
Spatiotemporal Dynamics of Vegetation Net Primary Productivity and Its Response to Climate Change in Inner Mongolia from 2002 to 2019


Abstract
:1. Introduction
2. Materials and Methods
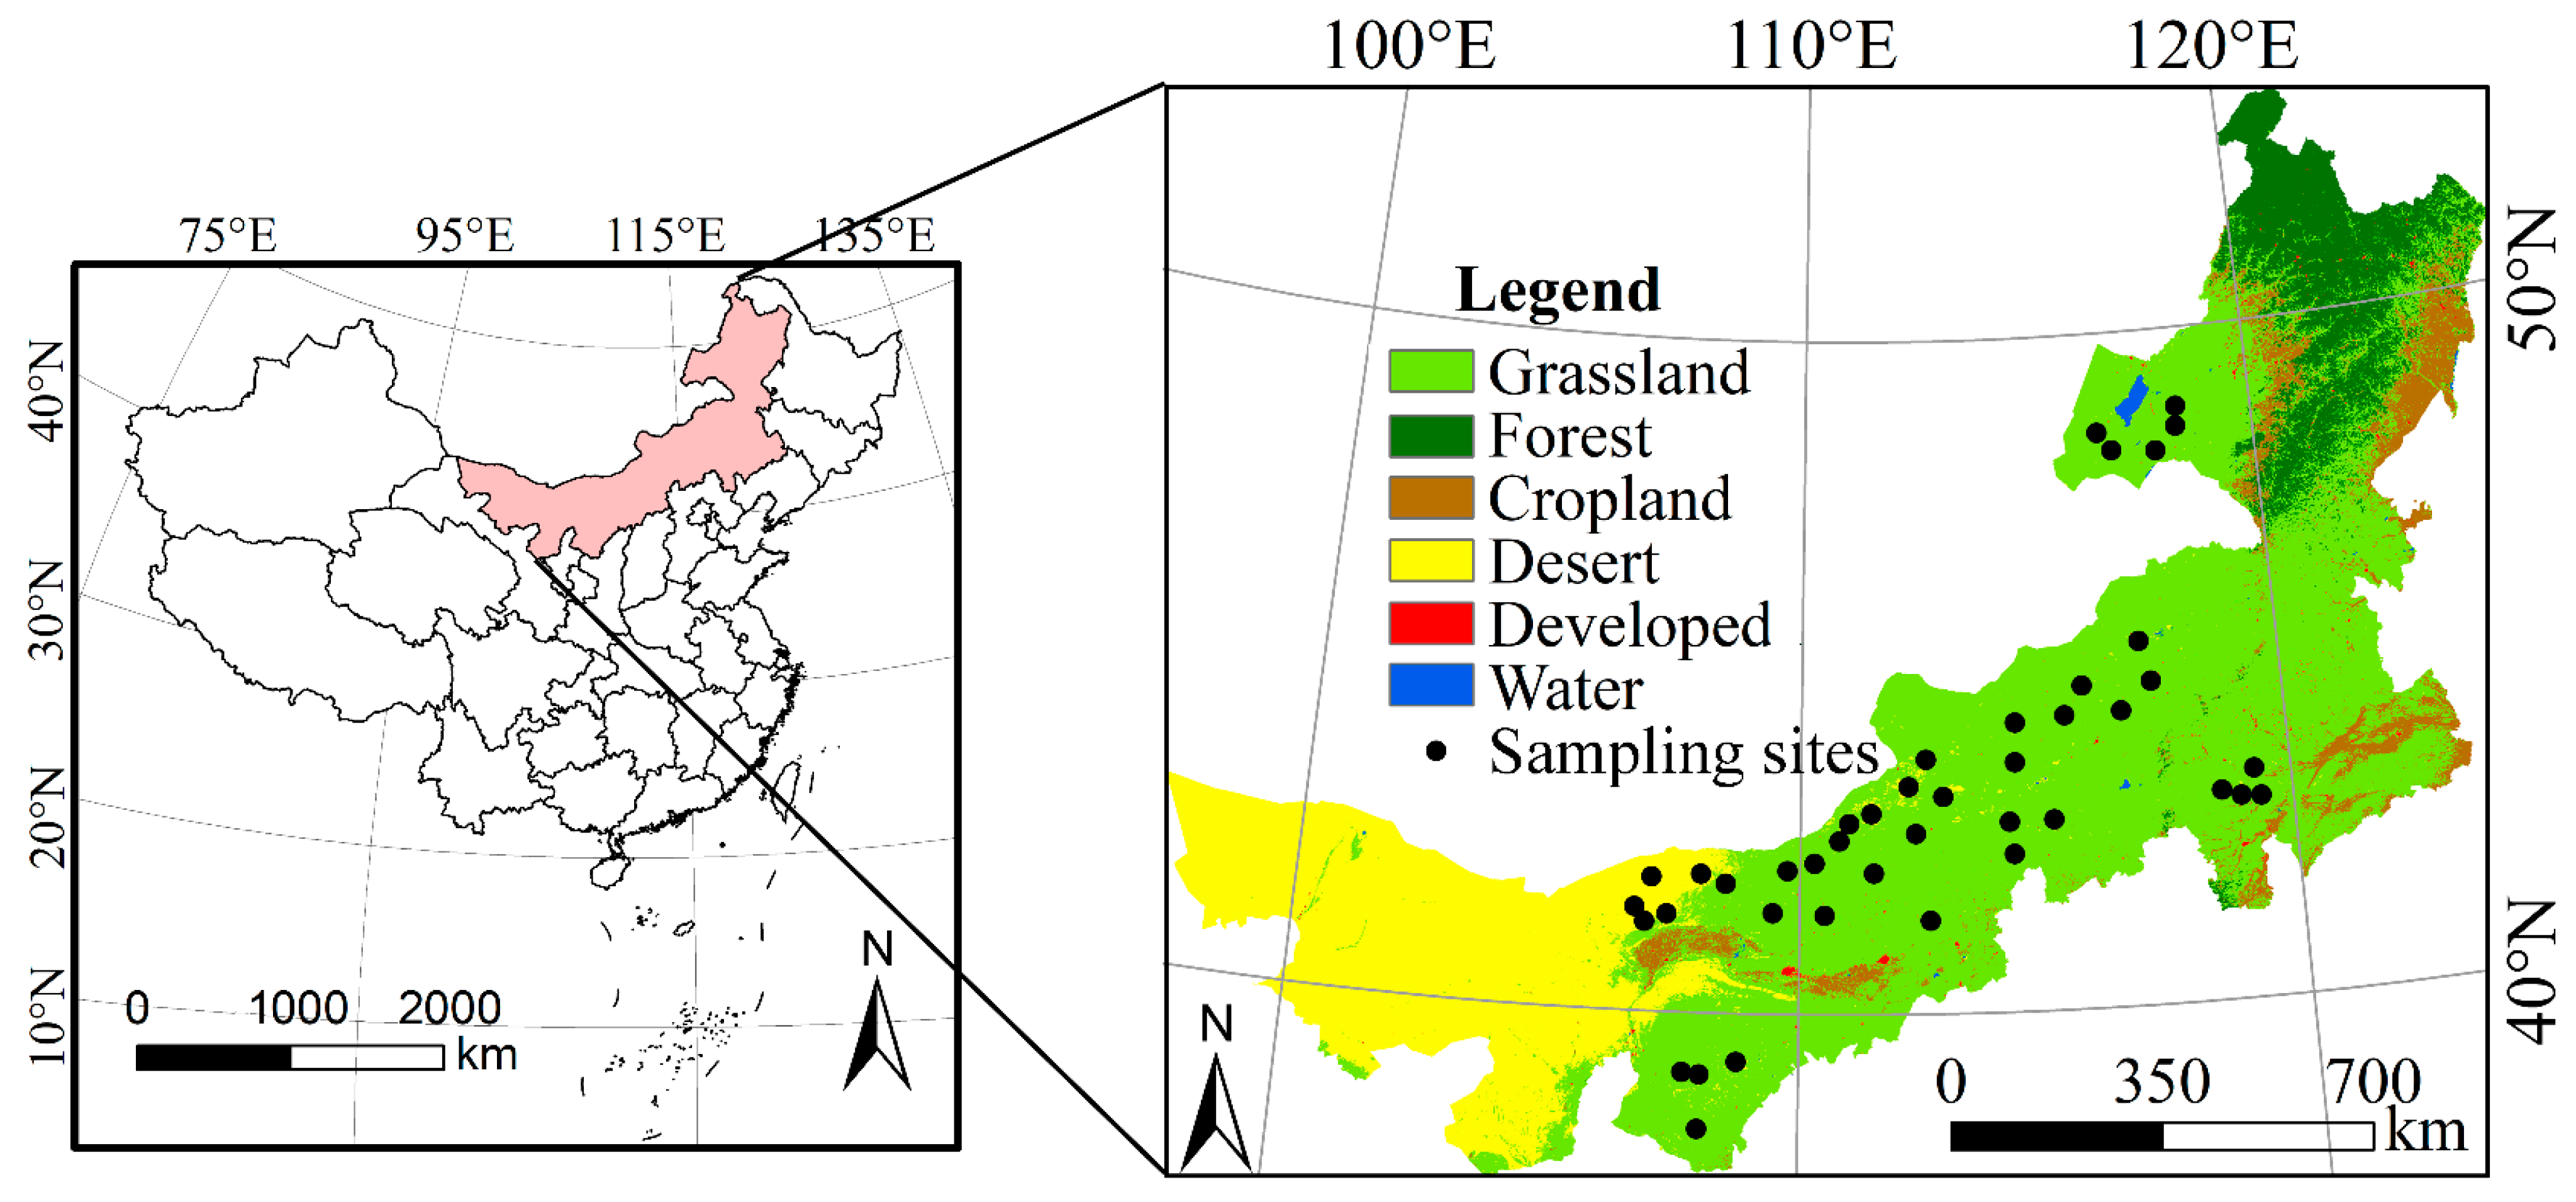
2.1. Study Area
2.2. Data
2.2.1. Remote Sensing Data
2.2.2. Meteorological Data
2.2.3. Field Sampling Data
2.3. Methods
2.3.1. NPP Estimation
2.3.2. Trend Analysis
2.3.3. Partial Correlation Analysis
3. Results
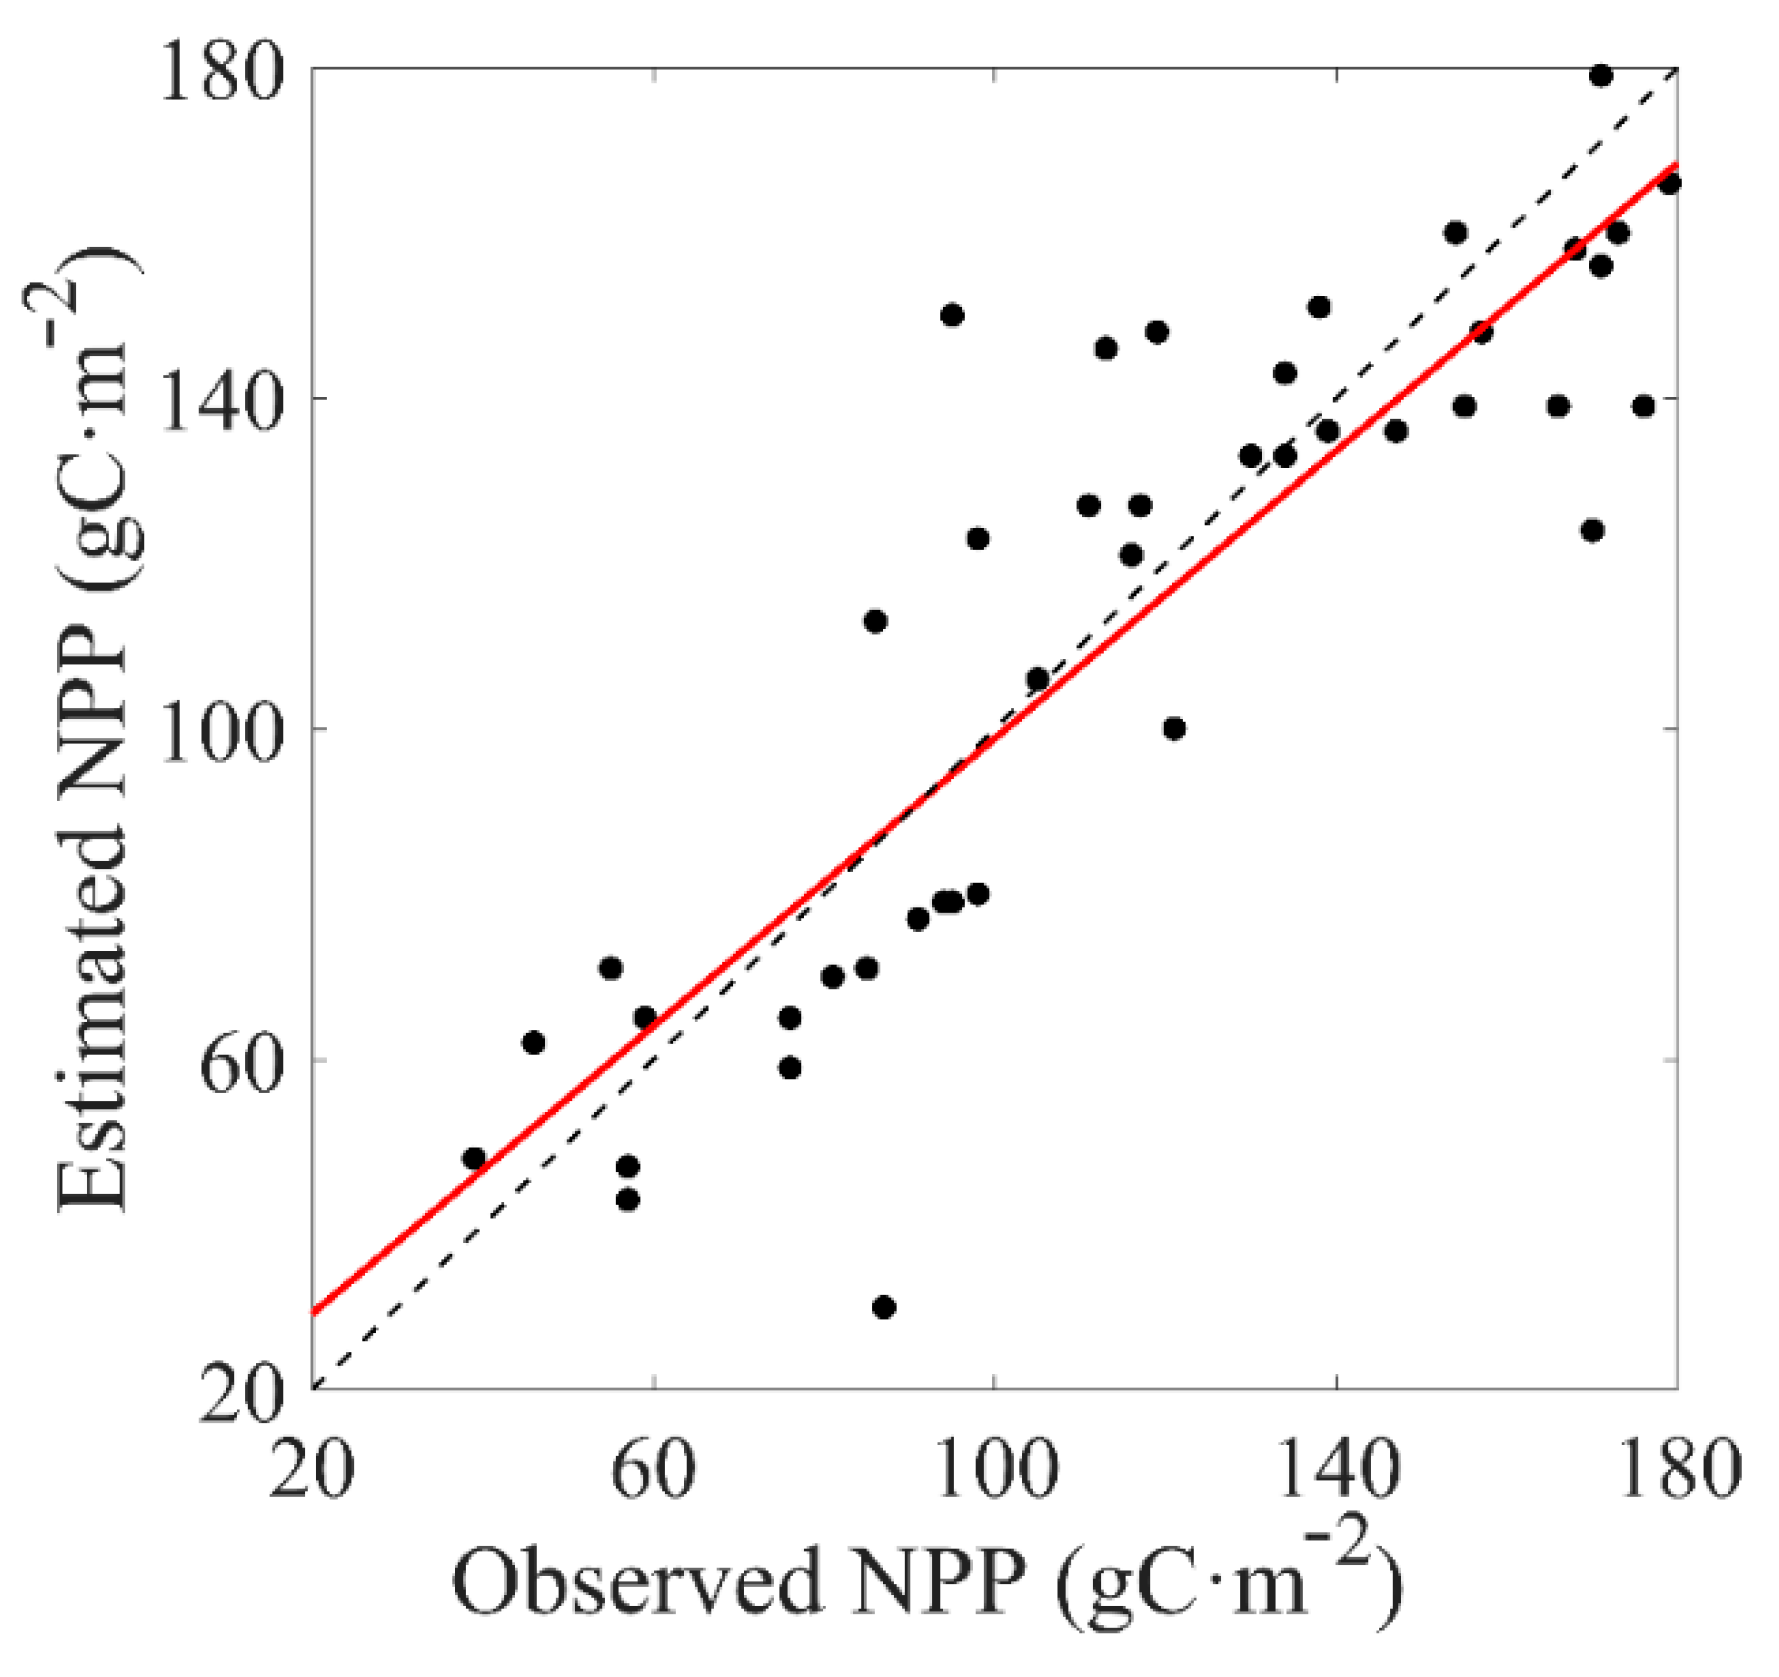
3.1. NPP Validation
3.2. Spatiotemporal Dynamics of Vegetation NPP
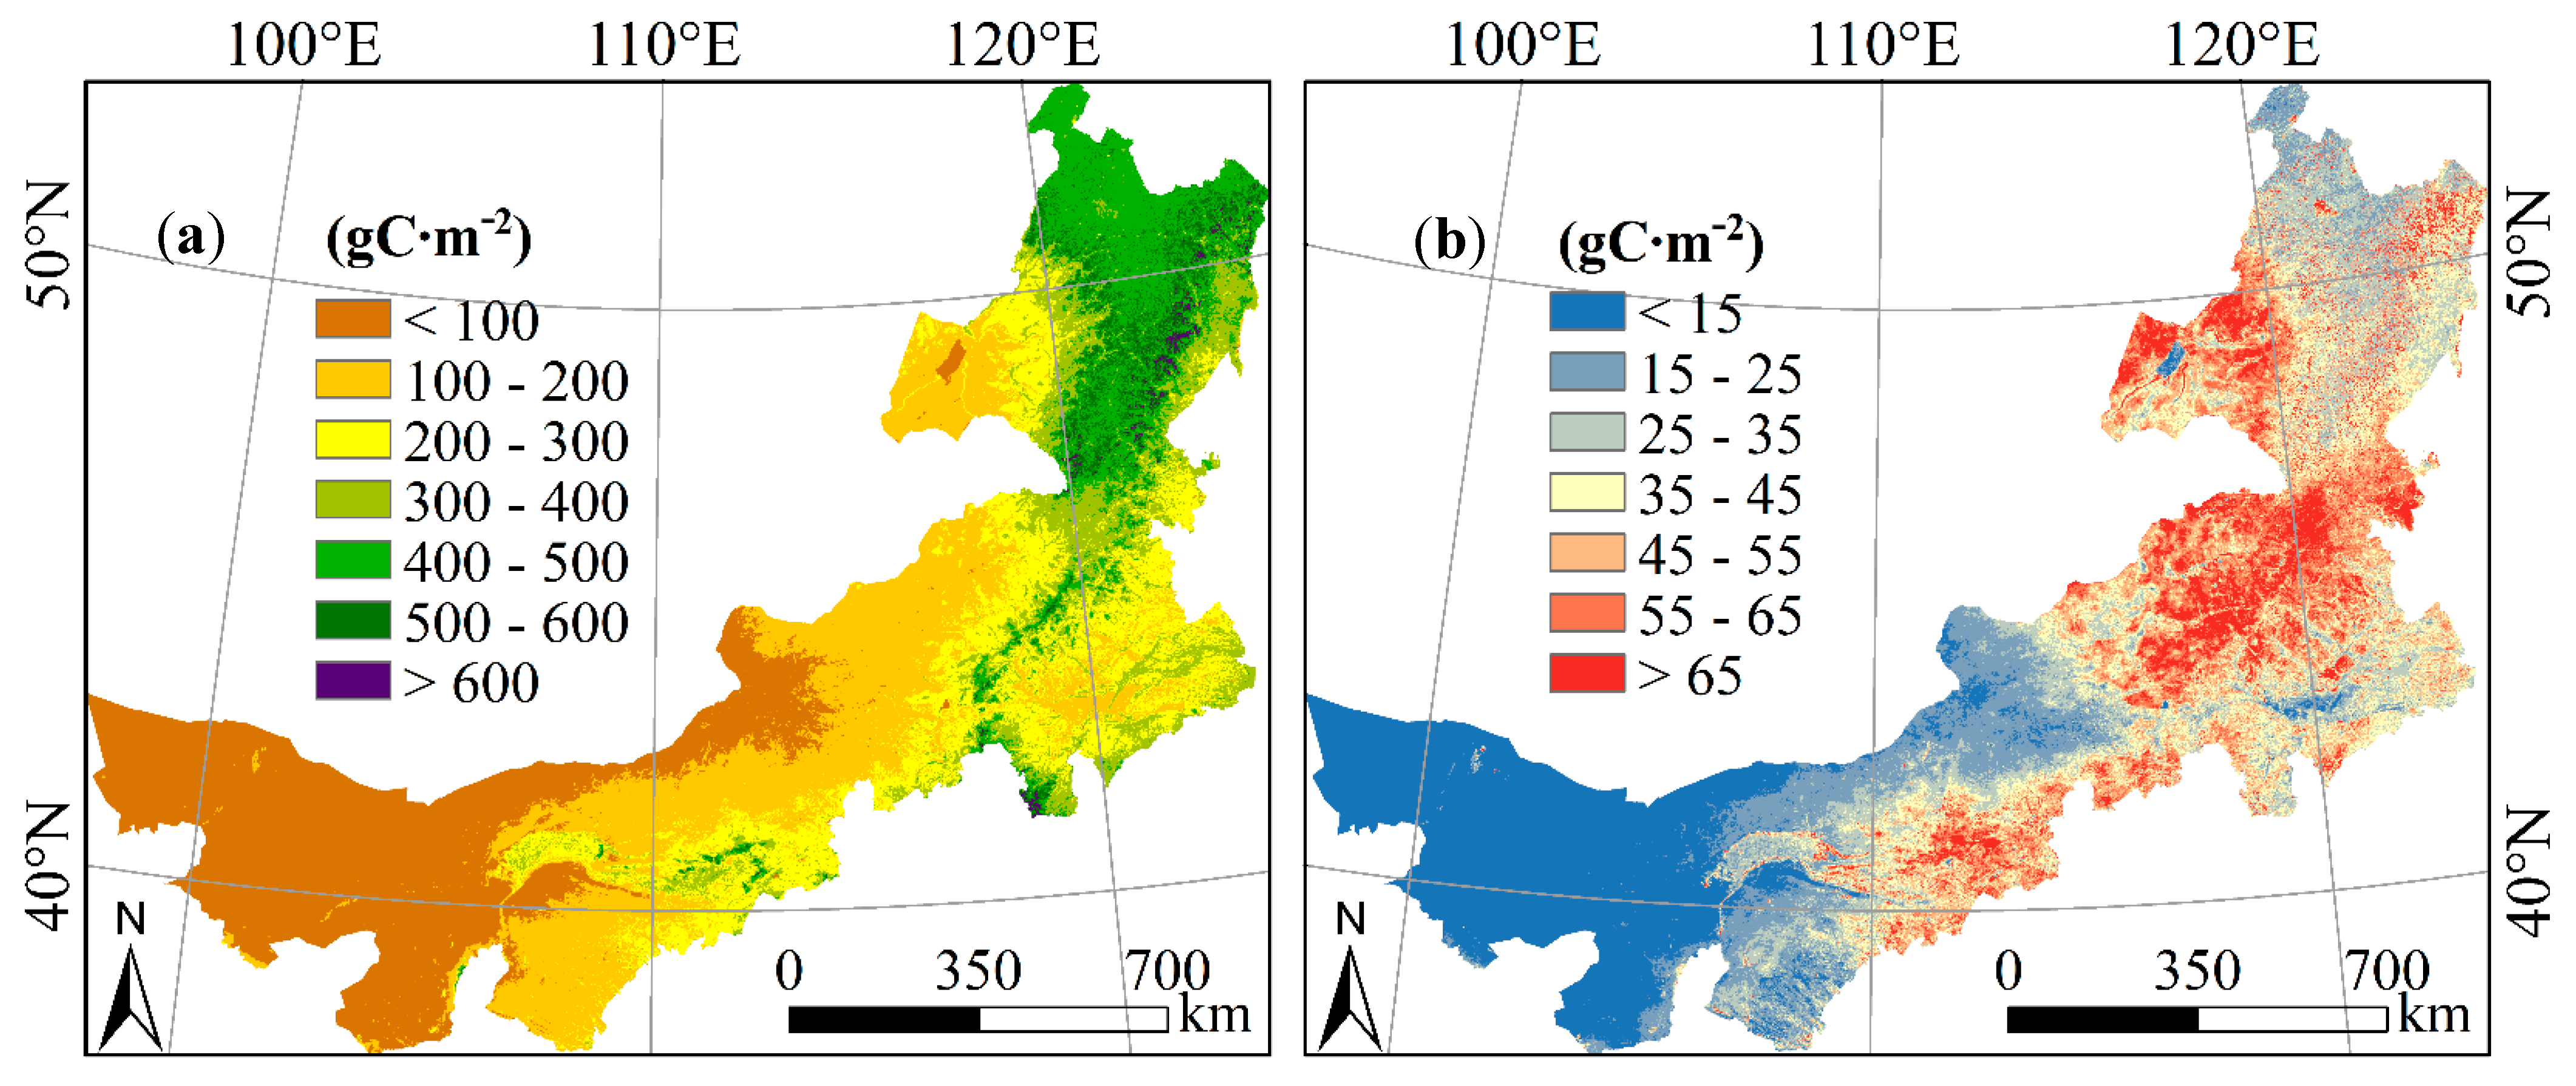
3.2.1. Spatial Distribution Pattern of Vegetation NPP
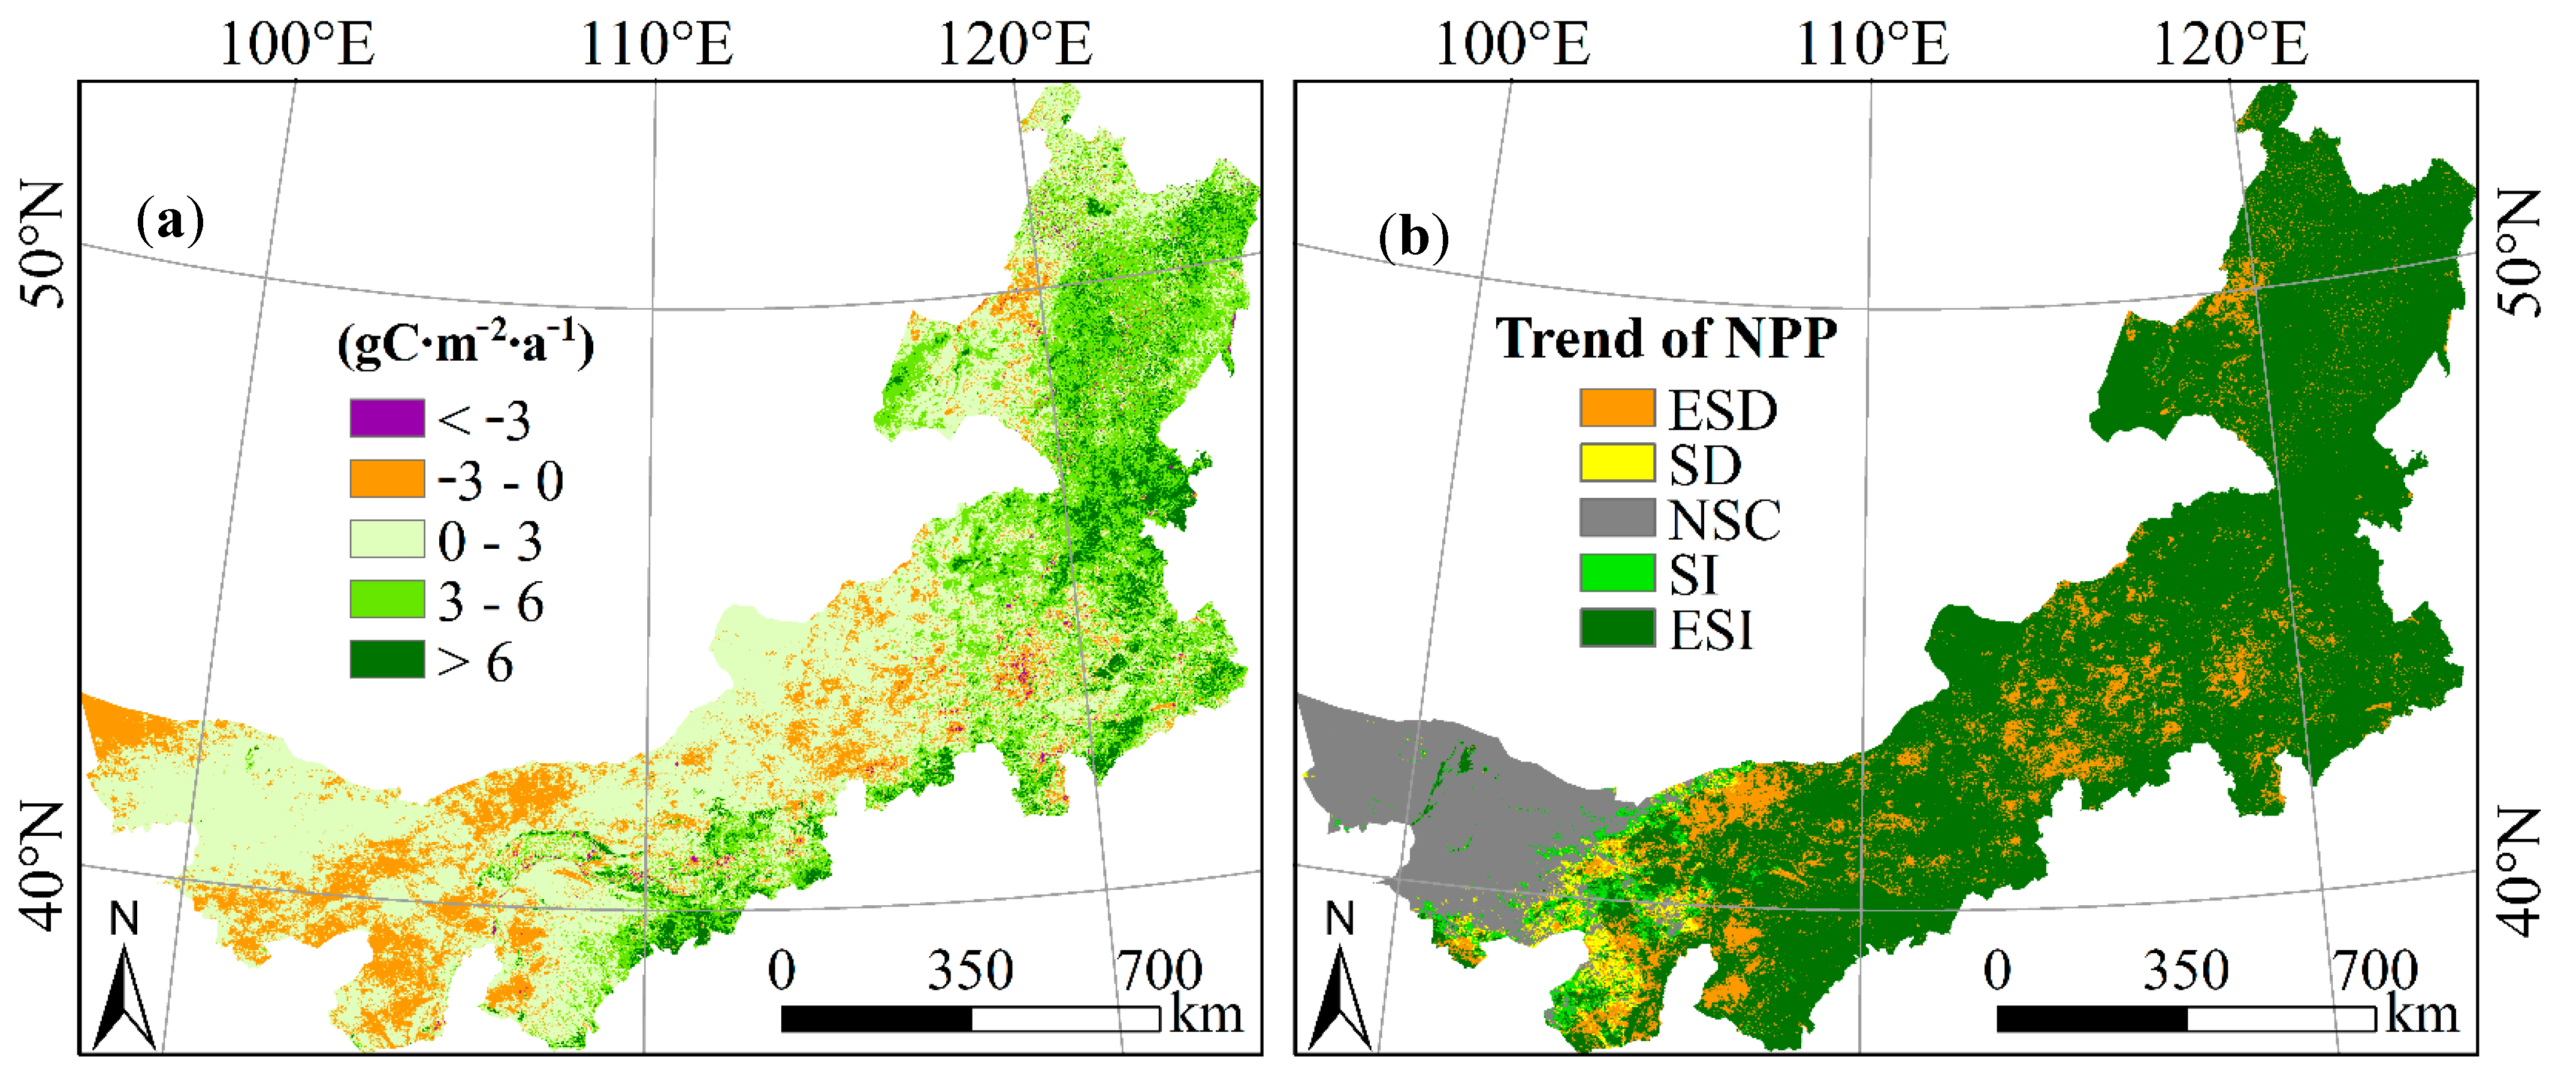
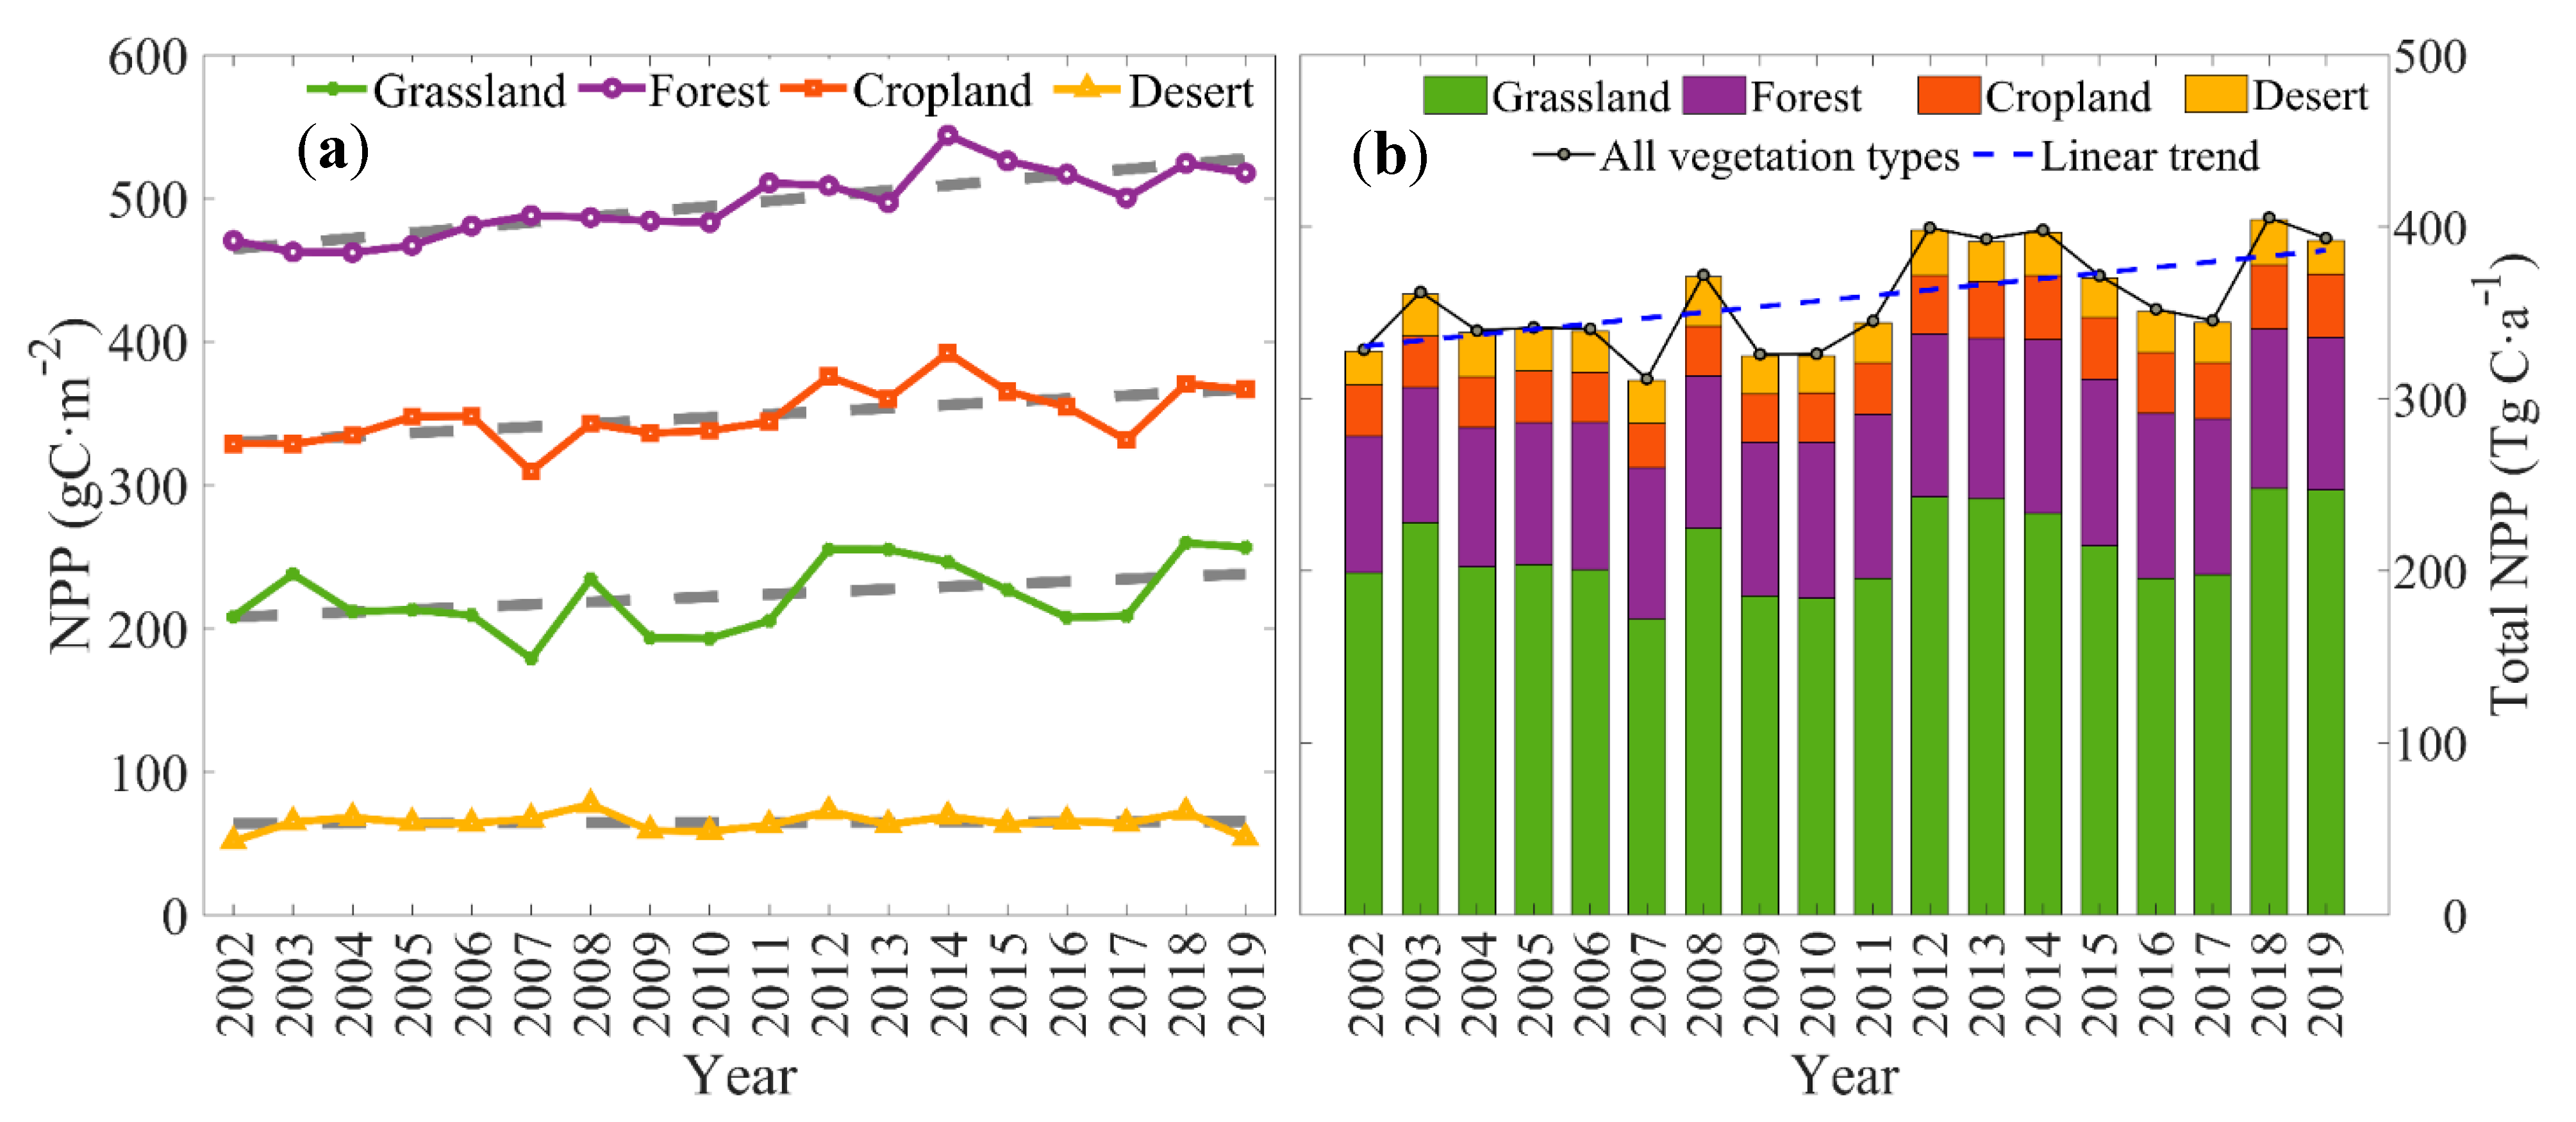
3.2.2. Inter-Annual Variation of Vegetation NPP
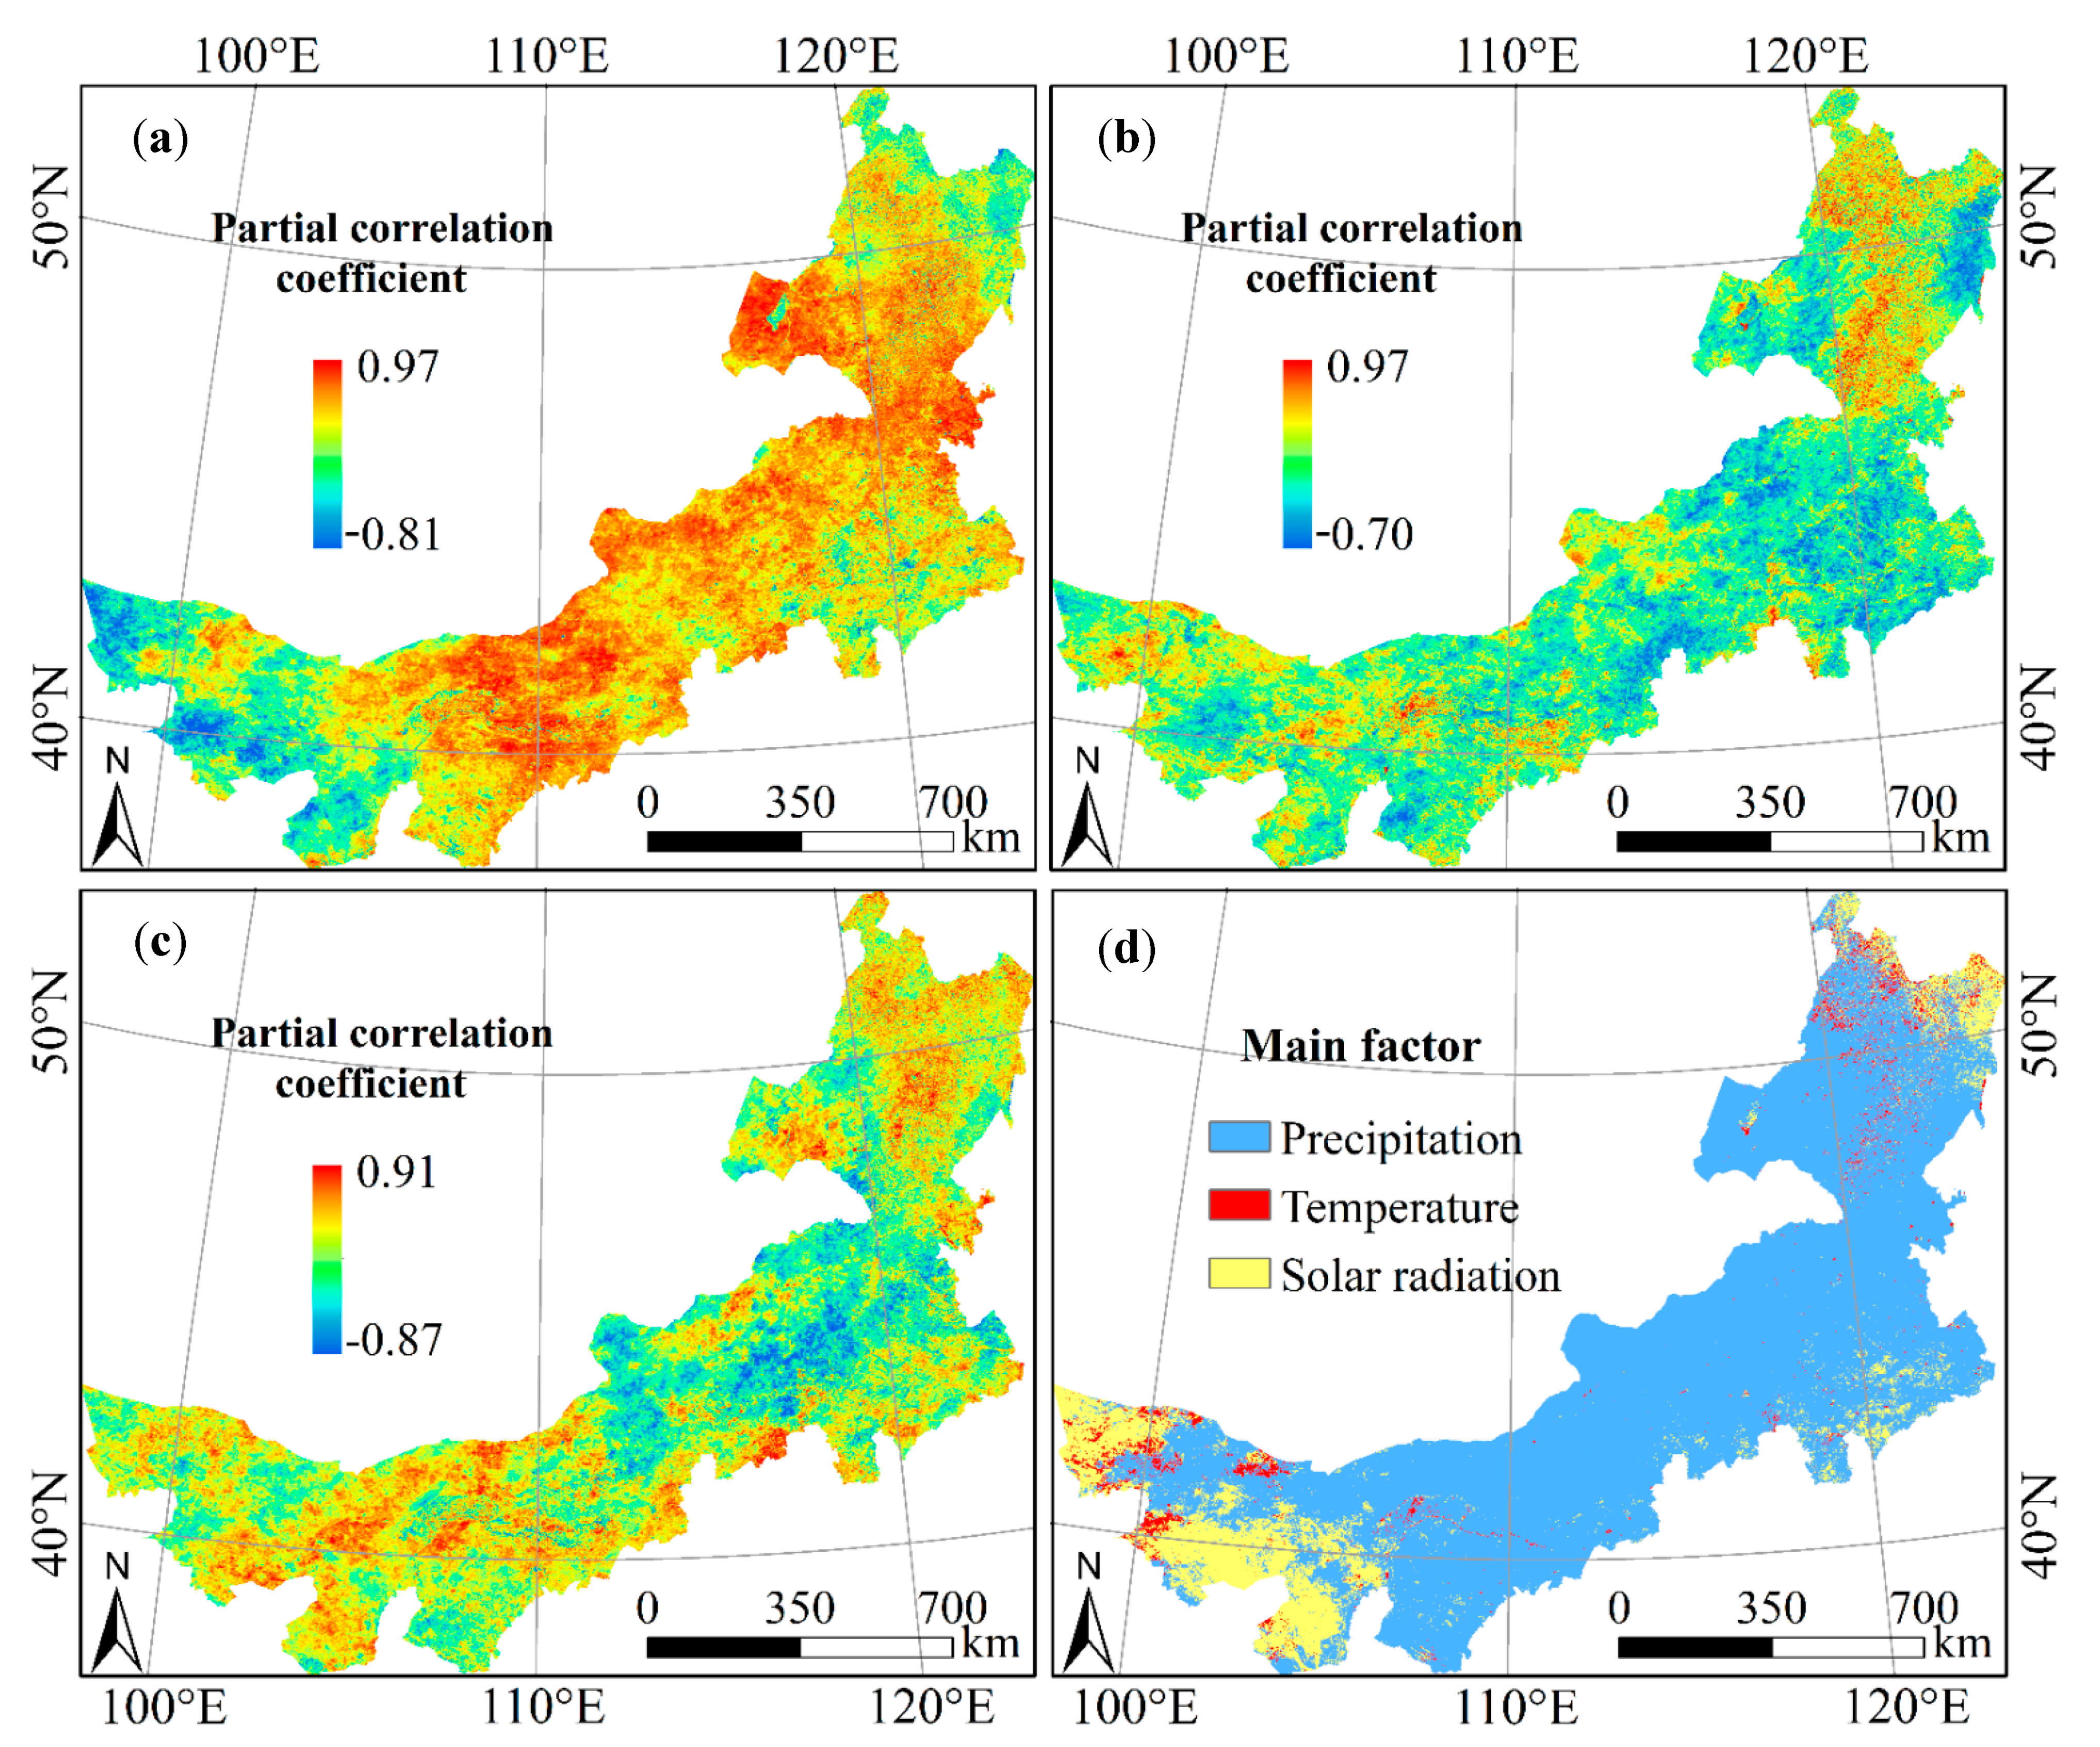
3.3. The Impact of Climate Factors on Vegetation NPP
3.4. The Response of NPP of Different Vegetation Types to Climate Factors
4. Discussion
4.1. Vegetation NPP Estimation in IM
4.2. Climate Change and Vegetation Response in IM
4.3. Limitations and Future Research Directions
5. Conclusions
Author Contributions
Funding
Data Availability Statement
Acknowledgments
Conflicts of Interest
References
- Schuur, E.A.; Bockheim, J.; Canadell, J.G.; Euskirchen, E.; Field, C.B.; Goryachkin, S.V.; Hagemann, S.; Kuhry, P.; Lafleur, P.M.; Lee, H.; et al. Vulnerability of permafrost carbon to climate change: Implications for the global carbon cycle. BioScience 2008, 58, 701–714. [Google Scholar] [CrossRef]
- McGuire, A.D.; Anderson, L.G.; Christensen, T.R.; Dallimore, S.; Guo, L.; Hayes, D.J.; Heimann, M.; Lorenson, T.D.; Macdonald, R.W.; Roulet, N. Sensitivity of the carbon cycle in the Arctic to climate change. Ecol. Monogr. 2009, 79, 523–555. [Google Scholar] [CrossRef] [Green Version]
- Piao, S.; Fang, J.; Zhou, L.; Zhu, B.; Tan, K.; Tao, S. Changes in vegetation net primary productivity from 1982 to 1999 in China. Glob. Biogeochem. Cycles 2005, 19, 2027. [Google Scholar] [CrossRef] [Green Version]
- Cramer, W.; Kicklighter, D.W.; Bondeau, A.; Iii, B.M.; Churkina, G.; Nemry, B.; Ruimy, A.; Schloss, A.L.; Intercomparison TPOTPNM. Comparing global models of terrestrial net primary productivity (NPP): Overview and key results. Glob. Chang. Biol. 1999, 5, 1–15. [Google Scholar] [CrossRef]
- Field, C.B.; Randerson, J.T.; Malmström, C.M. Global net primary production: Combining ecology and remote sensing. Remote Sens. Environ. 1995, 51, 74–88. [Google Scholar] [CrossRef] [Green Version]
- Zhu, Q.; Zhao, J.; Zhu, Z.; Zhang, H.; Zhang, Z.; Guo, X.; Bi, Y.; Sun, L. Remotely sensed estimation of net primary productivity (NPP) and its spatial and temporal variations in the Greater Khingan Mountain region, China. Sustainability 2017, 9, 1213. [Google Scholar] [CrossRef] [Green Version]
- Imhoff, M.L.; Bounoua, L.; DeFries, R.; Lawrence, W.T.; Stutzer, D.; Tucker, C.J.; Ricketts, T. The consequences of urban land transformation on net primary productivity in the United States. Remote Sens. Environ. 2004, 89, 434–443. [Google Scholar] [CrossRef]
- IGBP Terrestrial Carbon Working Group; Steffen, W.; Noble, I.; Canadell, J.; Apps, M.; Schulze, E.-D.; Jarvis, P.G. The terrestrial carbon cycle: Implications for the Kyoto Protocol. Scinece 1998, 280, 1393–1394. [Google Scholar] [CrossRef] [Green Version]
- Nemani, R.R.; Keeling, C.D.; Hashimoto, H.; Jolly, W.M.; Piper, S.C.; Tucker, C.J.; Myneni, R.B.; Running, S.W. Climate-driven increases in global terrestrial net primary production from 1982 to 1999. Science 2003, 300, 1560–1563. [Google Scholar] [CrossRef] [Green Version]
- Falkner, R. The Paris Agreement and the new logic of international climate politics. Int. Aff. 2016, 92, 1107–1125. [Google Scholar] [CrossRef]
- Wu, J.; Zhang, Q.; Li, A.; Liang, C. Historical landscape dynamics of Inner Mongolia: Patterns, drivers, and impacts. Landsc. Ecol. 2015, 30, 1579–1598. [Google Scholar] [CrossRef]
- Wang, Z.; Deng, X.; Song, W.; Li, Z.; Chen, J. What is the main cause of grassland degradation? A case study of grassland ecosystem service in the middle-south Inner Mongolia. Catena 2017, 150, 100–107. [Google Scholar] [CrossRef]
- Tong, C.; Wu, J.; Yong, S.P.; Yang, J.; Yong, W. A landscape-scale assessment of steppe degradation in the Xilin River Basin, Inner Mongolia, China. J. Arid. Environ. 2004, 59, 133–149. [Google Scholar] [CrossRef]
- Gao, L.; Kinnucan, H.W.; Zhang, Y.; Qiao, G. The effects of a subsidy for grassland protection on livestock numbers, grazing intensity, and herders’ income in Inner Mongolia. Land Use Policy 2016, 54, 302–312. [Google Scholar] [CrossRef] [Green Version]
- Du, B.; Zhen, L.; Yan, H.; De Groot, R. Effects of government grassland conservation policy on household livelihoods and dependence on local grasslands: Evidence from Inner Mongolia, China. Sustainability 2016, 8, 1314. [Google Scholar] [CrossRef] [Green Version]
- Tian, H.; Cao, C.; Chen, W.; Bao, S.; Yang, B.; Myneni, R.B. Response of vegetation activity dynamic to climatic change and ecological restoration programs in Inner Mongolia from 2000 to 2012. Ecol. Eng. 2015, 82, 276–289. [Google Scholar] [CrossRef]
- He, J.; Kuhn, N.; Zhang, X.; Zhang, X.; Li, H. Effects of 10 years of conservation tillage on soil properties and productivity in the farming–pastoral ecotone of Inner Mongolia, China. Soil Use Manag. 2009, 25, 201–209. [Google Scholar] [CrossRef]
- Liu, H.; Cui, H.; Pott, R.; Speier, M. The surface pollen of the woodland–steppe ecotone in southeastern Inner Mongolia, China. Rev. Palaeobot. Palynol. 1999, 105, 237–250. [Google Scholar] [CrossRef]
- Wang, Y.; Liu, G.; Guo, E. Spatial distribution and temporal variation of drought in Inner Mongolia during 1901–2014 using Standardized Precipitation Evapotranspiration Index. Sci. Total Environ. 2019, 654, 850–862. [Google Scholar] [CrossRef]
- Zhang, G.; Kang, Y.; Han, G.; Sakurai, K. Effect of climate change over the past half century on the distribution, extent and NPP of ecosystems of Inner Mongolia. Glob. Chang. Biol. 2011, 17, 377–389. [Google Scholar] [CrossRef]
- Sha, Z.; Bai, Y.; Lan, H.; Liu, X.; Li, R.; Xie, Y. Can more carbon be captured by grasslands? A case study of Inner Mongolia, China. Sci. Total Environ. 2020, 723, 138085. [Google Scholar] [CrossRef]
- Wei, H.; Fan, W.; Ding, Z.; Weng, B.; Xing, K.; Wang, X.; Lu, N.; Ulgiati, S.; Dong, X. Ecosystem services and ecological restoration in the Northern Shaanxi Loess Plateau, China, in relation to climate fluctuation and investments in natural capital. Sustainability 2017, 9, 199. [Google Scholar] [CrossRef] [Green Version]
- Huang, Q.; Ju, W.; Zhang, F.; Zhang, Q. Roles of climate change and increasing CO2 in driving changes of net primary productivity in China simulated using a dynamic global vegetation model. Sustainability 2019, 11, 4176. [Google Scholar] [CrossRef] [Green Version]
- Wu, D.; Zhao, X.; Liang, S.; Zhou, T.; Huang, K.; Tang, B.; Zhao, W. Time-lag effects of global vegetation responses to climate change. Glob. Chang. Biol. 2015, 21, 3520–3531. [Google Scholar] [CrossRef] [PubMed]
- Lenihan, J.M.; Drapek, R.; Bachelet, D.; Neilson, R.P. Climate change effects on vegetation distribution, carbon, and fire in California. Ecol. Appl. 2003, 13, 1667–1681. [Google Scholar] [CrossRef]
- Bachelet, D.; Neilson, R.P.; Lenihan, J.M.; Drapek, R.J. Climate change effects on vegetation distribution and carbon budget in the United States. Ecosystems 2001, 4, 164–185. [Google Scholar] [CrossRef]
- Propastin, P.A.; Kappas, M.W.; Herrmann, S.M.; Tucker, C.J. Modified light use efficiency model for assessment of carbon sequestration in grasslands of Kazakhstan: Combining ground biomass data and remote-sensing. Int. J. Remote Sens. 2012, 33, 1465–1487. [Google Scholar] [CrossRef] [Green Version]
- Song, C.; Dannenberg, M.P.; Hwang, T. Optical remote sensing of terrestrial ecosystem primary productivity. Prog. Phys. Geogr. 2013, 37, 834–854. [Google Scholar] [CrossRef]
- Potter, C.S.; Randerson, J.T.; Field, C.B.; Matson, P.A.; Vitousek, P.M.; Mooney, H.A.; Klooster, S.A. Terrestrial ecosystem production: A process model based on global satellite and surface data. Glob. Biogeochem. Cycles 1993, 7, 811–841. [Google Scholar] [CrossRef]
- Chen, S.; Jiang, H.; Jin, J.; Wang, Y. Changes in net primary production in the Tianmu Mountain Nature Reserve, China, from 1984 to 2014. Int. J. Remote Sens. 2017, 38, 211–234. [Google Scholar] [CrossRef]
- Pei, Y.; Huang, J.; Wang, L.; Chi, H.; Zhao, Y. An improved phenology-based CASA model for estimating net primary production of forest in central China based on Landsat images. Int. J. Remote Sens. 2018, 39, 7664–7692. [Google Scholar] [CrossRef]
- Jin, H.; Bao, G.; Chen, J.; Chopping, M.; Jin, E.; Mandakh, U.; Jiang, K.; Huang, X.; Bao, Y.; Vandansambuu, B. Modifying the maximal light-use efficiency for enhancing predictions of vegetation net primary productivity on the Mongolian Plateau. Int. J. Remote Sens. 2020, 41, 3740–3760. [Google Scholar] [CrossRef]
- Holben, B.N. Characteristics of maximum-value composite images from temporal AVHRR data. Int. J. Remote Sens. 1986, 7, 1417–1434. [Google Scholar] [CrossRef]
- Loveland, T.R.; Zhu, Z.; Ohlen, D.O.; Brown, J.F.; Reed, B.C.; Yang, L. An analysis of the IGBP global land-cover characterization process. Photogramm. Eng. Remote Sens. 1999, 65, 1021–1032. [Google Scholar]
- Oliver, M.A.; Webster, R. Kriging: A method of interpolation for geographical information systems. Int. J. Geogr. Inf. Syst. 1990, 4, 313–332. [Google Scholar] [CrossRef]
- Potter, C.; Klooster, S.; Genovese, V. Net primary production of terrestrial ecosystems from 2000 to 2009. Clim. Chang. 2012, 115, 365–378. [Google Scholar] [CrossRef] [Green Version]
- Eggleston, H.; Buendia, L.; Miwa, K.; Ngara, T.; Tanabe, K. 2006 IPCC Guidelines for National Greenhouse Gas Inventories; IPCC: Geneva, Switzerland, 2006. [Google Scholar]
- Ma, W.H.; Yang, Y.H.; He, J.S.; Zeng, H.; Fang, J.Y. The relationship between grassland biomass dynamics and the meteorological factors in Inner Mongolia. Sci. China (Life Sci.) 2008, 38, 84–92, (In Chinese with English Abstract). [Google Scholar]
- Zhu, W.; Pan, Y.; He, H.; Yu, D.; Hu, H. Simulation of maximum light use efficiency for some typical vegetation types in China. Chin. Sci. Bull. 2006, 51, 457–463. [Google Scholar] [CrossRef]
- Piao, S.-L.; Fang, J.-Y.; Guo, Q.-H. Application of CASA model to the estimation of Chinese terrestrial net primary productivity. Chin. J. Plant Ecol. 2001, 25, 603. [Google Scholar]
- Ohlson, J.A.; Kim, S. Linear valuation without OLS: The Theil-Sen estimation approach. Rev. Account. Stud. 2015, 20, 395–435. [Google Scholar] [CrossRef]
- Baba, K.; Shibata, R.; Sibuya, M. Partial correlation and conditional correlation as measures of conditional independence. Aust. N. Z. J. Stat. 2004, 46, 657–664. [Google Scholar] [CrossRef]
- Benesty, J.; Chen, J.; Huang, Y.; Cohen, I. Pearson correlation coefficient. In Noise Reduction in Speech Processing; Springer: Berlin/Heidelberg, Germany, 2009; pp. 1–4. [Google Scholar]
- Tong, S.; Li, X.; Zhang, J.; Bao, Y.; Bao, Y.; Na, L.; Si, A. Spatial and temporal variability in extreme temperature and precipitation events in Inner Mongolia (China) during 1960–2017. Sci. Total Environ. 2019, 649, 75–89. [Google Scholar] [CrossRef]
- Li, Z.; Wu, W.; Liu, X.; Fath, B.D.; Sun, H.; Liu, X.; Cao, J. Land use/cover change and regional climate change in an arid grassland eco-system of Inner Mongolia, China. Ecol. Model. 2017, 353, 86–94. [Google Scholar] [CrossRef]
- Ren, H.; Shang, Y.; Zhang, S. Measuring the spatiotemporal variations of vegetation net primary productivity in Inner Mongolia using spatial autocorrelation. Ecol. Indic. 2020, 112, 106108. [Google Scholar] [CrossRef]
- Zhao, Y.; Liu, H.; Zhang, A.; Cui, X.; Zhao, A. Spatiotemporal variations and its influencing factors of grassland net primary productivity in Inner Mongolia, China during the period 2000–2014. J. Arid. Environ. 2019, 165, 106–118. [Google Scholar] [CrossRef]
- Yan, H.; Pan, L.; Xue, Z.; Zhen, L.; Bai, X.; Hu, Y.; Huang, H.Q. Agent-Based Modeling of Sustainable Ecological Consumption for Grasslands: A Case Study of Inner Mongolia, China. Sustainability 2019, 11, 2261. [Google Scholar] [CrossRef] [Green Version]
- Peng, S.; Piao, S.; Shen, Z.; Ciais, P.; Sun, Z.; Chen, S.; Chen, A. Precipitation amount, seasonality and frequency regulate carbon cycling of a semi-arid grassland ecosystem in Inner Mongolia, China: A modeling analysis. Agric. For. Meteorol. 2013, 178, 46–55. [Google Scholar] [CrossRef]
- Pei, F.; Wu, C.; Liu, X.; Li, X.; Yang, K.; Zhou, Y.; Wang, K.; Xu, L.; Xia, G. Monitoring the vegetation activity in China using vegetation health indices. Agric. For. Meteorol. 2018, 248, 215–227. [Google Scholar] [CrossRef]
- Xiao, J.; Moody, A. Trends in vegetation activity and their climatic correlates: China 1982 to 1998. Int. J. Remote Sens. 2004, 25, 5669–5689. [Google Scholar] [CrossRef]
- Guo, D.; Song, X.; Hu, R.; Cai, S.; Zhu, X.; Hao, Y. Grassland type-dependent spatiotemporal characteristics of productivity in Inner Mongolia and its response to climate factors. Sci. Total Environ. 2021, 775, 145644. [Google Scholar] [CrossRef]
- Dai, E.; Huang, Y.; Wu, Z.; Zhao, D. Analysis of spatio-temporal features of a carbon source/sink and its relationship to climatic factors in the Inner Mongolia grassland ecosystem. J. Geogr. Sci. 2016, 26, 297–312. [Google Scholar] [CrossRef] [Green Version]
- Xiao-Ying, W.; Chun-Yu, Z.; Qing-Yu, J. Impacts of climate change on forest ecosystems in Northeast China. Adv. Clim. Chang. Res. 2013, 4, 230–241. [Google Scholar] [CrossRef]
- Liu, H.; Zhang, M.; Lin, Z. Relative importance of climate changes at different time scales on net primary productivity—A case study of the Karst area of northwest Guangxi, China. Environ. Monit. Assess. 2017, 189, 539. [Google Scholar] [CrossRef]
- Gang, C.; Zhou, W.; Wang, Z.; Chen, Y.; Li, J.; Chen, J.; Qi, J.; Odeh, I.; Groisman, P. Comparative assessment of grassland NPP dynamics in response to climate change in China, North America, Europe and Australia from 1981 to 2010. J. Agron. Crop. Sci. 2015, 201, 57–68. [Google Scholar] [CrossRef]
- Gang, C.; Zhou, W.; Chen, Y.; Wang, Z.; Sun, Z.; Li, J.; Qi, J.; Odeh, I. Quantitative assessment of the contributions of climate change and human activities on global grassland degradation. Environ. Earth Sci. 2014, 72, 4273–4282. [Google Scholar] [CrossRef]
- Hao, L.; Sun, G.; Liu, Y.; Gao, Z.; He, J.; Shi, T.; Wu, B. Effects of precipitation on grassland ecosystem restoration under grazing exclusion in Inner Mongolia, China. Landsc. Ecol. 2014, 29, 1657–1673. [Google Scholar] [CrossRef]
- Wang, Z.; Zhong, J.; Lan, H.; Wang, Z.; Sha, Z. Association analysis between spatiotemporal variation of net primary productivity and its driving factors in inner mongolia, china during 1994–2013. Ecol. Indic. 2019, 105, 355–364. [Google Scholar] [CrossRef]
- Zhai, Y.; Qu, Z.; Hao, L. Land cover classification using integrated spectral, temporal, and spatial features derived from remotely sensed images. Remote Sens. 2018, 10, 383. [Google Scholar] [CrossRef] [Green Version]
- Zhai, Y.; Wang, N.; Zhang, L.; Hao, L.; Hao, C. Automatic crop classification in northeastern China by improved nonlinear dimensionality reduction for satellite image time series. Remote Sens. 2020, 12, 2726. [Google Scholar] [CrossRef]
- Wen, Y.; Liu, X.; Bai, Y.; Sun, Y.; Yang, J.; Lin, K.; Pei, F.; Yan, Y. Determining the impacts of climate change and urban expansion on terrestrial net primary production in China. J. Environ. Manag. 2019, 240, 75–83. [Google Scholar] [CrossRef]
- Morel, A.C.; Adu Sasu, M.; Adu-Bredu, S.; Quaye, M.; Moore, C.; Ashley Asare, R.; Mason, J.; Hirons, M.; McDermott, C.L.; Robinson, E.J. Carbon dynamics, net primary productivity and human-appropriated net primary productivity across a forest–cocoa farm landscape in West Africa. Glob. Chang. Biol. 2019, 25, 2661–2677. [Google Scholar] [CrossRef] [PubMed]


| Change Rate (gC∙m−2∙a−2) | Percentage (%) | Trend | Percentage (%) |
|---|---|---|---|
| <−3 | 0.6 | ESD | 11.0 |
| −3–0 | 15.3 | SD | 1.7 |
| 0–3 | 53.1 | NSC | 12.5 |
| 3–6 | 23.7 | SI | 1.9 |
| >6 | 7.3 | ESI | 72.9 |
| Types | Slope | R2 | p |
|---|---|---|---|
| Forest | 3.6988 | 0.6784 | <0.01 |
| Cropland | 2.1864 | 0.3305 | <0.05 |
| Grassland | 1.7651 | 0.1442 | >0.05 |
| Desert | 0.0806 | 0.0051 | >0.05 |
| Forest | Grassland | Cropland | Desert | |
|---|---|---|---|---|
| NPP_Precipitation | 0.4490 | 0.5887 | 0.5212 | 0.2888 |
| NPP_Temperature | 0.1557 | −0.1462 | −0.1229 | −0.0153 |
| NPP_Solar radiation | 0.3198 | 0.1654 | 0.1995 | 0.2884 |
Publisher’s Note: MDPI stays neutral with regard to jurisdictional claims in published maps and institutional affiliations. |
© 2021 by the authors. Licensee MDPI, Basel, Switzerland. This article is an open access article distributed under the terms and conditions of the Creative Commons Attribution (CC BY) license (https://creativecommons.org/licenses/by/4.0/).
Share and Cite
Hao, L.; Wang, S.; Cui, X.; Zhai, Y. Spatiotemporal Dynamics of Vegetation Net Primary Productivity and Its Response to Climate Change in Inner Mongolia from 2002 to 2019. Sustainability 2021, 13, 13310. https://0-doi-org.brum.beds.ac.uk/10.3390/su132313310
Hao L, Wang S, Cui X, Zhai Y. Spatiotemporal Dynamics of Vegetation Net Primary Productivity and Its Response to Climate Change in Inner Mongolia from 2002 to 2019. Sustainability. 2021; 13(23):13310. https://0-doi-org.brum.beds.ac.uk/10.3390/su132313310
Chicago/Turabian StyleHao, Lei, Shan Wang, Xiuping Cui, and Yongguang Zhai. 2021. "Spatiotemporal Dynamics of Vegetation Net Primary Productivity and Its Response to Climate Change in Inner Mongolia from 2002 to 2019" Sustainability 13, no. 23: 13310. https://0-doi-org.brum.beds.ac.uk/10.3390/su132313310