Article

How Do Nature-Based Solutions’ Color Tones Influence People’s Emotional Reaction? An Assessment via Virtual and Augmented Reality in a Participatory Process

by
Barbara Ester Adele Piga
1,*,
Gabriele Stancato
1,
Nicola Rainisio
2 and
Marco Boffi
2
1
Laboratorio di Simulazione Urbana Fausto Curti, Department of Architecture and Urban Studies (DAStU), Politecnico di Milano, 20133 Milan, Italy
2
Department of Cultural Heritage and Environment, University of Milan, 20122 Milan, Italy
*
Author to whom correspondence should be addressed.
Sustainability 2021, 13(23), 13388; https://0-doi-org.brum.beds.ac.uk/10.3390/su132313388
Submission received: 3 November 2021 / Revised: 22 November 2021 / Accepted: 29 November 2021 / Published: 3 December 2021

Abstract

:
Simulations of urban transformations are an effective tool for engaging citizens and enhancing their understanding of urban design outcomes. Citizens’ involvement can positively contribute to foster resilience for mitigating the impact of climate change. Successful integration of Nature-Based Solutions (NBS) into the urban fabric enables both the mitigation of climate hazards and positive reactions of citizens. This paper presents two case studies in a southern district of Milan (Italy), investigating the emotional reaction of citizens to existing urban greenery and designed NBS. During the events, the participants explored in Virtual Reality (VR) (n = 48) and Augmented Reality (AR) (n = 63) (i) the district in its current condition and (ii) the design project of a future transformation including NBS. The environmental exploration and the data collection took place through the exp-EIA© method, integrated into the mobile app City Sense. The correlations between the color features of the viewed landscape and the emotional reaction of participants showed that weighted saturation of green and lime colors reduced the unpleasantness both in VR and AR, while the lime pixel area (%) reduced the unpleasantness only in VR. No effects were observed on the Arousal and Sleepiness factors. The effects show high reliability between VR and AR for some of the variables. Implications of the method and the benefits for urban simulation and participatory processes are discussed.

1. Introduction

Nature-Based Solutions (NBS) are increasingly adopted in a logic of risk management, resilience, mitigation, and adaptation to face urgent socio-economical-environmental issues such as climate change, natural disasters, food and water security, biodiversity loss, social cohesion, health [1]. NBS encompasses several eco-system-based approaches, such as ecosystem-based adaptation, ecosystem-based disaster-risk reduction, ecosystem-based mitigation [2,3]. With other initiatives related to the 2030 Agenda for Sustainable Development, the systematic approach linking human wellbeing and natural systems emerge as crucial for proper sustainable growth. Governments, businesses, and civil society show a growing interest in such a perspective. In the NBS panorama framed by the European Commission, interdisciplinary and systematic approaches and solutions are relevant and should lead to a mutual and “balanced benefit for nature and society” [4] (p. 1217). This approach towards more sustainable development can benefit from rapid technological advancements. As highlighted by Bishop [5], in the field of landscape planning and particularly concerning environmental information, already in the past and even more today, “computer developments have created new opportunities for the landscape researcher in all areas of data storage, modeling and visualization” [5] (p. 112). The author continues stressing that it is highly probable that Augmented Reality (AR) and Virtual Reality (VR), in conjunction with immersive modes of visualizations, will play a significant role in the field in the next 10 years.
In this article, we explore a specific application of computer vision to deepen the relationship between NBS and people’s emotions, with a dual aim = On the one hand, to investigate how color tones of NBS influence the subjective emotional experience in urban spaces, a topic that is poorly addressed in the literature so far. On the other hand, to develop a reliability analysis on two emerging technologies (AR and VR) regarding the aforementioned relationship. The results will therefore provide new insights both in the design of NBS as emotionally supportive environments, and in the field of urban simulation.
In detail, the article presents: (i) a literature review that relates Nature-Based Solutions (NBS) and citizens engagement, (ii) a brief framework of AR and VR solutions for citizens’ involvement, (iii) the relationship between green solutions and their emotional effects, (iv) the objective and methodology of the study, (v) the analysis of results, and (vi) the outcomes discussion, the limitations of the current research, and the future work to develop. The analytical method is part of a research project that led to developing the AR4CUP mobile application (distributed as City Sense).

2. Literature Review

2.1. NBS and the Relevance of Citizens Engagement

The many positive effects of NBS, often highlighted in the literature, should not be confused with an indistinct process of ‘biophilic washing’ that applies standardized solutions to different urban contexts and does not consider the social, emotional, and community dimension of the transformation processes [4,6,7]. Different biophilic design strategies have various cost-benefit ratios and different acceptance levels [8,9,10]. According to the review of 42 different design strategies carried out by Xue in collaboration with 30 experts [11], the solutions with the best Benefit-Cost Ratio (BCR) include: ‘biophilic infrastructure’ (i.e., green space coverage ratio, plants canopy configuration), ‘sensory design’, (i.e., visual connections with nature, green walls, and others), and ‘natural landscape promotion with minimal management’ (i.e., green roof). Among those strategies, one of the most preferred for investments is the ‘green space coverage ratio’, which focuses on the correct ratio between green elements and artificial ones [12] to obtain a positive response by observers. Indeed, according to Jiang and colleagues’ observations, the appreciation curve tends to have an asymptotic trend, reaching the plateau around 41% density of the tree canopy, which is consistent with the notion of balance between understanding and exploration supported by the preference matrix theory [13]. This variation in response to green distribution shows that it is not possible to take for granted that an NBS intervention is functional and appreciable in itself. However, positive effects of buildings, including greenery on their façades, were observed on aesthetic, restorative, and affective dimensions [14].
Nevertheless, Wolch [15] suggests that urban green projects may create a paradox. On the one hand, they make the city healthier both physically and mentally (see for instance [10,16]). On the other hand, the most effective NBS interventions are usually applied to urban degraded areas, where they often induce the increase of the real estate value fostering gentrification; as a result, these renovated areas become economically unsustainable for the population living there [17,18,19]. To avoid inducing a phenomenon of social injustice and the related conflicts resulting from an urban intervention, some authors propose finding a ‘just green enough’ balance [20] intended as an optimal and balanced solution between the community’s needs and the developers’ tradeoff. Wolch and colleagues [15] argue that this approach implies the development of urban planning strategies based on the wishes and needs of the communities involved, rather than grounding design projects on conventional solutions focused exclusively on ecological issues. As urban greenspace has a significant impact also on real estate values [21,22], its implementation plays a crucial role in increasing or reducing social justice and equity [23]. Equity factors are closely related to the urban greenery accessibility and proximity to the public [24], to the point that the spatial distribution of greenery can even draw social geography of inequality [24,25,26]. Therefore, in NBS interventions, it is necessary to consider both the physical environmental effects and related long-term social impacts.
In this regard, participatory processes in green areas are fundamental to prevent and reduce conflicts between stakeholders [27]; moreover, the experience of being involved in the decision-making process increases end-users awareness about the importance of implementing and preserving the green areas [28]. Furthermore, some critical issues may emerge in NBS processes if the citizen’s perceptual perspective is not adequately considered [29]. Indeed, various actors perceive vegetation differently [30]; in some cases, social groups may object to tree planting since they perceive it as a potential source of indirect disservices [31]. Citizens’ involvement in transformation processes generally mitigates these types of disagreements [32]. However, traditional participatory processes may encounter difficulties in engaging the weaker segments of the population [24,26], which implies the need for a contextual design of the engagement strategy to favor sustainable participation for citizens [33].
Information technologies might play an important role in such perspective, extending the possibilities of participation [34] by overcoming some limitations of traditional methods through digital inclusion [35], such as the difficulty of engaging many people simultaneously or the availability of schedules for specific categories of workers [36]. The widespread use of mobile devices and the continuous flux of information exchange led to the idea that it is possible to describe the relationship between citizen and city as a spatialized intelligence [37]. Nevertheless, these devices should be considered as an integrative tool for more comprehensive participatory processes and not as a stand-alone solution; this is particularly relevant when dealing with specific populations affected by low digital literacy, such as older people, which may benefit from more traditional activities (see for instance [38,39]).

2.2. Augmented and Virtual Reality as Citizens’ Engagement Solutions

Although the forms of smart participation are relatively recent, two main approaches emerge when considering the type of information collected involving citizens: (i) the environmental-centered approach, which uses objective data for studying the environment, e.g., by evaluating environmental parameters through cell phone sensors; (ii) the people-centered approach, which studies the human perceptual dimension exploring subjective data [40]. Often these solutions make use of mobile applications: the first approach encompasses APPs dealing with the urban environment under different meanings such as ‘environmental risk and adaptation’ [41] and ‘urban transformation modeling’ [42,43]; the second approach encompasses APPs dealing with citizens’ perceptions, through sensory assessment (e.g., physical comfort) [40], attitudes (e.g., safety and security) [44], or emotional assessment (e.g., environmental affective quality) [45].
After the early 2000s, VR has enriched e-participation (participation through ICT) [46]; more recently, AR has also become relevant in participatory design [47,48,49]. These solutions can be exploited to visualize the design projects or their alternatives or even allow the direct modification by the user of the 3D model components [50,51]. The three-dimensional model visualization can directly occur on the construction site through Augmented Reality (e.g., APPs such as City Sense; Urban CoBuilder; AR Sketchwalk; ARki) or off-site in Virtual Reality (e.g., APPs such as City Planner Online—KALASATAMA; Virtual Singapore; 3D Rotterdam 2.0; TYGRON). The visualization via VR and AR often happens in a subjective perspective using photorealistic scenarios. Such representations are named ‘experiential simulations’ since they mimic reality with an eye-level point of view. When such solutions follow parameters ensuring representation realism and fidelity [52,53,54,55], their use in participatory urban processes ensures that citizens’ reactions to the simulated environments are comparable to those they would have experienced by looking at the actual environment [56]. Several studies demonstrated that observing real natural landscapes or accurate experiential simulations of the same environment generates comparable physiological and psychological reactions [57,58,59,60,61]. Among the different ways to visualize urban scenarios, VR and AR open a crucial possibility: they can anticipate future urban transformation easy-to-understand, often enabling a ‘naturalistic interaction’ [62] with the environment. Indeed, 3D visualization methods are considered crucial for properly conveying spatial features of places to laypeople, both in their current and future conditions, enabling new forms of citizens engagement [63]. According to the case study presented by Edler et al. [64], one of the main advantages of VR lies in its interactive nature, which offers the possibility of actively exploring the modelled landscapes. Combining the possibility of freely positioning the virtual camera, which overcomes the limitations of physical environments, and the support offered by navigation aids (e.g., mini-maps, signifying footprints, pointer teleportation, teleport stations), participants can access a more detailed experience of the simulated environment in a short time than with traditional tools. Likewise, Loyola et al. [65] exploited the natural sense of presence of immersive VR simulations to present a project of an urban park. The authors reported a higher level of comprehension of the physical features of the design proposal (e.g., presence of various functional areas, characteristics of urban furniture and vegetation, relationship with the surroundings) for VR users compared to those involved with traditional means. Similar considerations are drawn from case studies applying AR for citizens engagement, which is considered particularly effective as its novelty increases the willingness to participate [66] and can be fruitfully integrated in existing participatory practices [67]. In particular, AR offers two fundamental advantages: (i) the in-situ immersive experiences favor a suspension of disbelief and, therefore, ease spontaneous reactions to visualizations [63]; (ii) the superimposition of the design project onto the physical reality fosters the comparison between current and potential condition. Despite this, it is essential to note that in AR the existing context is perceived in its actual conditions and not according to the modifications induced by the urban transformation on its surroundings. Thus, the ‘semi-permanent’ urban elements (e.g., urban furniture), the ‘recursive’ ones (e.g., seasonal or hourly cycles), and the ‘temporary conditions’ (e.g., people, cars) [54] are consistent with the current conditions and are not affected by the designed transformation, as it can instead happen in VR. Despite their differences, VR and AR are considered among the key technologies to enable a smart urban greenery management, which is conceived as “the design, establishment, monitoring, and management of urban trees and vegetation through the use of digital technologies, for the joint purpose of improving the urban environment and engaging all relevant stakeholders in its governance” [68] (p. 8).

2.3. Green Effects: Natural Elements and Color Clues

According to the psychological literature, natural and/or green elements are strongly associated with positive effects [69,70]. Momentary or prolonged exposure to natural environments was found to be related to a broad spectrum of positive psychological states, namely stress reduction [71,72], restoration of optimal attention span [73], flow or peak experiences [7], positive emotions increase [74,75]. Furthermore, these elements were identified as antecedents of broader experiential, social, and performance outcomes, including pain reduction [76,77], faster post-surgery recovery [72], better results in logic tasks [78], decreased aggressivity [79], and increased proximity sociality [80]. Referring to an epidemiological framework, more frequent exposure to natural environments was also associated with better children development [81] and a lower prevalence of psychiatric pathologies (schizophrenia and anxiety) [82,83]. These results were mainly explained by the ability of the natural environment to attract involuntary attention [13,84] and/or automatically reduce stress [16] due to the evolutionary bond between humans and the natural environment as a primary source of food and shelter. According to Korpela and colleagues [85,86], this evolutionary link is well recognized and present in people’s mental life, as natural environments are consciously used as tools for emotional self-regulation (environmental self-regulation hypothesis).
These beneficial effects occur in the direct presence of natural environments and also when such environments are presented through photographs, videos, or VR [57,87,88,89]. Many studies in this field are conducted in laboratories to control the intervening variables (see [70] for a methodological summary). On the one side, the virtual scenario reduces variables and allows scholars to manipulate them according to the experimental goals, e.g., studying the influence of light or weather conditions on emotional states [90]. On the other side, researches may be focused on the simulation tools themselves; for instance, de Kort [91] showed that immersive simulations increase the restorative effect of projected natural environments, even though such effect is recorded only for physiological measures (HR and skin conductance) and not for self-reported affect. The use of immersive devices, e.g., Head-Mounted Displays (HMD), showed that exposure to natural scenarios in VR induces the same anxiety-reducing effects as exposure to real natural environments [92], but without inducing the expected positive attentional restoration effects [93]. Despite this, VR scenarios allowed scholars to show that environments partially covered by vegetation are preferred to environments wholly covered with greenery or completely open green spaces, both considering physiological sensors [94] and EEG [95].
Positive green effects are also found in the absence of natural elements, as mere exposure to color clues (see [96] for a review). Exposure to green color was indeed correlated to better performances in logic [97] and creativity tasks [98], reduced perception of physical fatigue [99], and was associated with a general feeling of calm [100], in line with the results presented above. Green is often contrasted with red, as these are two antagonistic additive primary colors, which is instead related to greater aggressivity, sexual attraction, and better sports performance [101,102]. The influence of the green color was also tested by showing a video of a route in a natural environment represented in three variants (unedited, achromatic, and red filter) to three groups of volunteers undergoing physical exertion; only those who observed nature without alteration obtained a benefit in terms of performance [99]. Considering the colors’ mutual influence, Bartram and colleagues [103] used network analysis to represent colors as a network of assessed psychological relationships, arguing that the brightest colors do not transmit negative sensations and green tones represent a significant cluster related to positive sensations. The lightness of neutral tones, often related to artificial elements, seems to reduce the arousal values [100,104,105]. Applying such an approach to architectural settings requires considering many factors, as the chromatic composition of an urban environment is articulated and complex [106]. Thus, Manav [107] applied a segmentation and dominant color extraction method to discretize the volunteers’ emotional answers to panoramic photos, relating color tones to emotions. It emerged that the urban context with the more massive presence of green vegetation was identified as the most restful. Different theoretical explanations for such green color effects appear to be complementary. Elliot and Maier [96] hypothesized that colors might have a signal function to maximize animal fitness, eliciting automatic psycho-physiological reactions and orienting the individual behavior. Moreover, the green color is historically associated with positive meanings in popular culture, particularly with fertility, hope, and renewal [98]. Consistently with such studies, Palmer and Schloss [108] argued that human preference for specific tones is both an evolutionary effect and an association of ideas between colors and known objects.
The studies presented in this article investigate how different color tones of NBS can influence people’s emotional reactions towards urban areas and whether this influence relationship is equivalent in AR and VR. To this end, a two-step analysis was carried out:
(1)
Analysis of the correlations between different color tones and emotions.
(2)
Reliability analysis of the detected correlations, comparing the results obtained in AR and VR.

3. Methods

3.1. Materials

Data collection was carried out in two case studies in the Porta-Romana district (south Milan, Italy) with a quasi-experimental design. From the eighties the city of Milan passed from an industry-based to a service-based city; this long and relevant process of urban renewal of unused areas, mainly former industries and railway yards, is still undergoing [109]. The southern part of the Porta-Romana district, where the two studies are located, is one of these areas, and it is still under an important renovation process that is changing the district’s identity from industrial to business-oriented. In general, Milan, a city of the flat Po Valley, suffers from severe heatwaves in summer and flooding in winter [110]. Despite this, no data seem to suggest a relevant effect of weather on daily mood in such a context [111].
The two studies were conducted under different climatic conditions. Study 1 was conducted indoors, observing panoramic photographs taken in June 2018; Study 2 was conducted outdoors in December 2019. In Milan. According to ARPA (Richiesta dati misurati—Meteorologia|ARPA Lombardia (2021). Available at: https://www.arpalombardia.it/Pages/Meteorologia/Richiesta-dati-misurati.aspx, accessed on 19 November 2021) (Agenzia Regionale per la Protezione Ambientale) data, the environmental conditions in June on average are: temperature 24.02 °C, relative humidity 82.69%, rainfall 5.53 mm, wind speed 1.45 m/s, daylight hours 480. In December, the environmental conditions on average are: temperature 6.24 °C, relative humidity 83.90%, rainfall 40.32 mm, wind speed 1.39 m/s, daylight hours 266. According to the criteria of the UTCI (Universal Thermal Climate Index) [112,113], a potential discomfort condition in June can be indicated for 12% of the hours of the month; in December, there a potential discomfort can be experienced for 88% of the hours of the month. The average NDVI (Normalized Difference Vegetation Index) [114], evaluated on the base of Sentinel2 data, in June 2018 is M:0.25 s.d.:0.00813, and in December 2019 is M: 0.11 s.d.: 0.00740; comparing the two months NDVI decreases by 44%. Study 1 uses VR (i.e., panoramic photographs) of four representative points of view surrounding the Fondazione Prada and piazza Olivetti, recently renovated. Study 2 uses AR to show the urban design project VITAE by Covivio, Carlo Ratti Associati, and Partners (via Serio). Study 1 presents the actual urban area with the existing vegetation, whereas Study 2 is a biophilic design project with NBS solutions, including a walkable green spiral with terraces running from the ground to the rooftop of the building.
In both case studies, participants observed experiential simulations with vegetation and artificial elements. Study 1 presented pre-selected StreetView™ pannable panoramas from four fixed points of view. Study 2 presented the photorealistic render of the VITAE design project superimposed on-site to the actual environment through AR using the City Sense app; the rendered photorealistic 3D model of the urban transformation is automatically located in the right place and consistently anchored to the actual context by the app.
The parts of the simulations belonging to the chromatic range of lime and green tones (Hue: 38–67°) were exclusively vegetal elements, both in VR (Study 1) and AR (Study 2); the chromatic preference for these tones is therefore connected to the existing or designed vegetation. Neutral tones (Saturation <10%) are associated with built elements (mainly buildings, sidewalks, streets).
The emotions experienced by the participants in both simulated urban environments were assessed through a questionnaire consisting of 20 items rated on a 5-points Likert scale [115]. The questionnaire’s answers allow describing the emotions through four factors, namely Pleasantness, Unpleasantness, Arousal, and Sleepiness. Those factors are conceived as two pairs of oppositional values on the Unpleasant-Pleasant continuum, which indicates the level of pleasure of the emotions, and the Sleepy-Arousing continuum, which indicates the level of activation of the emotions. According to such a theoretical model, considering the values of the four scales provides a holistic description of a person’s affective state. Moreover, the values obtained on each continuum can be used as coordinates to place the resulting emotions in the circumplex model, which describes a cartesian plane where affective states have a univocal label.

3.2. Procedure and Participants

In this case, 48 students (age M = 26; s.d. = 12.12) from Università degli Studi di Milano attended Study 1. The four stimuli, i.e., spherical panoramas of the existing condition projected on a widescreen, were presented to participants. After a short visual exploration of the urban context by panning the panorama, the virtual camera was brought back to the initial target point, i.e., the urban perspective to assess. At the end of the virtual experience of each point of view, students had to fill in the questionnaire.
Here, 63 citizens (age M = 41; s.d. = 12.81) attended Study 2. During the first public event for presenting the VITAE design project (Experiencing VITAE—LABSIMURB (2021). Available at: http://www.labsimurb.polimi.it/research/ar4cup/experiencing_vitae/, accessed on 19 November 2021), participants made a semi-guided exploration of the project area using the City Sense app in AR mode. The app showed the photorealistic model of the urban transformation superimposed to the actual context and applied the exp-EIA© method for assessing the experience in the environment, including the psychological questionnaire formerly described. The organizers identified three main relevant perspectives (two in front of the designed project and one on its back) for stopping the walk, looking around and towards the VITAE project, and assessing the urban scenario via the app.

3.3. Analyses

Data collected through the emotions’ questionnaire were treated in three ways. Firstly, descriptive statistics were used to locate on a cartesian plane the emotional state experienced from each point of view; different colors are assigned to the emotions distributed on the cartesian plane. Secondly, emotions were integrated with geographic information of the users’ position and their visual target, producing a semantic isovist map; according to the exp-EIA method©, colors corresponding to the experiences on the cartesian plane were applied to the related partial isovist, i.e., the portion of space visible from a specific point of view and with a single target [116,117]. Thirdly, inferential statistics were used to detect significant correlations between the colors of the urban landscape and the emotional factors.
The participants’ answers gathered in the two case studies were clustered according to the StreetView™ camera location (Study 1) and the GPS observers’ locations (Study 2) using the DBSCAN method [118] with Scikit-learn 0.22 and Python 3.8 libraries. This procedure allowed us to identify different clusters of participants based on their spatial exploration. For each cluster, the average value of the answers to the emotions’ questionnaire was calculated. In Study 1, four main clusters were identified, i.e., the four target points assigned for the experimental task. In Study 2, three main clusters were identified, distributed around the building simulated in AR. Each cluster was associated with the specific image representing its view and the related answers, which served for building the color-emotion correlation matrix. Through color segmentation [119], we extracted and quantified, via Computer Vision processing with OpenCV 3 library and Python 3.8, 45 chromatic features mined from Lightness, a* and b* (CIELAB) color-space, and Hue Saturation Value (HSV) color-space. The 45 color features identified and evaluated are organized in: (i) Lightness; (ii) oppositive channels a* b*; (iii) Hue; (iv) Saturation. More in detail:
  • LIGHTNESS: “The brightness of an area judged relative to the brightness of a similarly illuminated area that appears to be white or highly transmitting” [120] (p. 88), analyzed in the following ways: (1) average brightness of the image; (2) percentage of low-brightness pixels (L < 15%); (3) percentage of high-brightness pixels (L > 85%); (4) average brightness of low-saturation pixels only.
  • OPPOSITIVE CHANNELS: “The a* and b* dimensions approximately correlated with red-green and yellow-blue chroma perceptions” [120] (p. 202), analyzed in the following ways: (1) average oppositional a* green-red; (2) average oppositional b* blue-yellow.
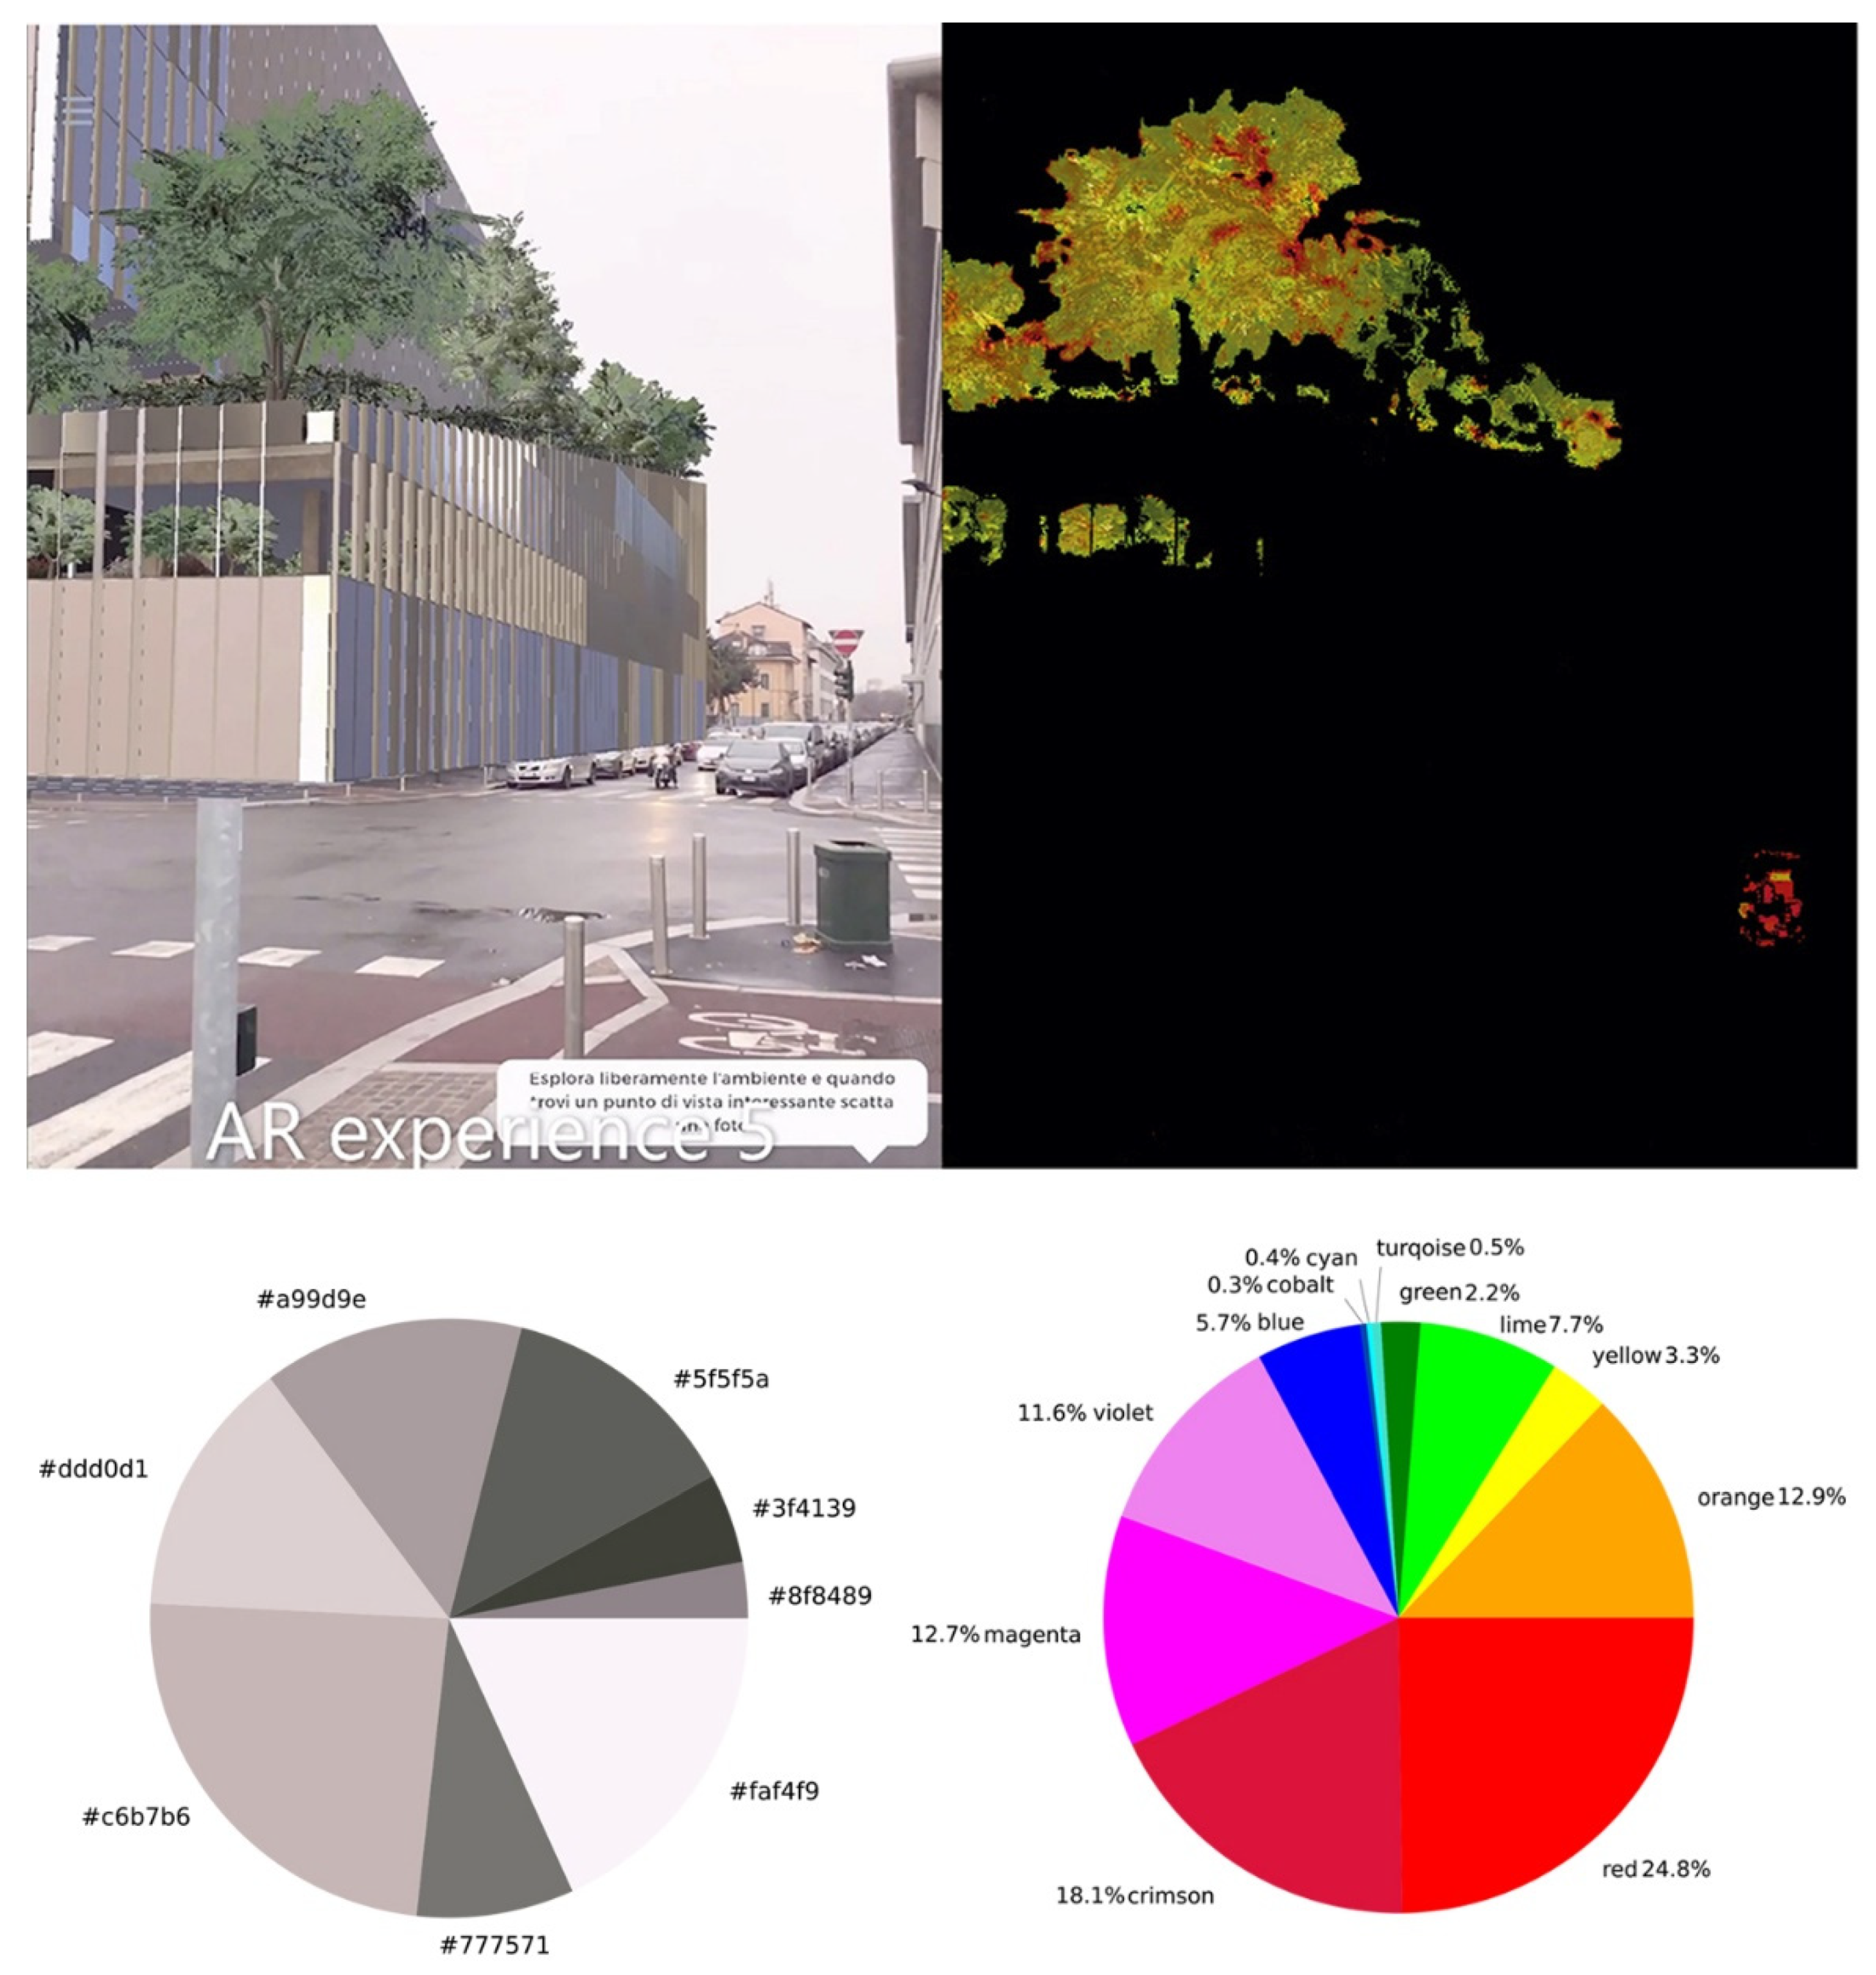
  • HUE: “Attribute of a visual perception according to which an area appears to be similar to one of the colors—red, yellow, green, and blue—or to a combination of adjacent pairs of these colors considered in a closed ring” [120] (p. 88), calculated in a range [0°:180°], it is analyzed in the following ways: (1) percentage of orange tones pixels (8° ≤ H < 23°); (2) percentage of yellow tones pixels (23° ≤ H < 38°); (3) percentage of lime tones pixels (38° ≤ H < 53°); (4) percentage of green tones pixels (53° ≤ H < 68°); (5) percentage of turquoise tones pixels (68° ≤ H < 83°); (6) percentage of cyan tones pixels (83° ≤ H < 98°); (7) percentage of cobalt tones pixels (98° ≤ H < 113°); (8) percentage of blues tones pixels (113° ≤ H < 143°); (9) percentage of violet tones pixels (128° ≤ H < 143°); (10) percentage of magenta tones pixels (143° ≤ H < 158°); (11) percentage crimson tones pixels (158° ≤ H < 173°); (12) percentage of red tones pixels (173° ≤ H < 179° and 0° ≤ H < 8°).
  • SATURATION: “Colorfulness of an area judged in proportion to its brightness” [120] (p. 91), it is calculated for each image as: (1) mean saturation of the entire image; (2) the percentage of the pixels’ area belonging to the same hue, or more simply, the image surface with the same color tones, (3) the ‘mean saturation’ of a specific hue, that is the average saturation of a color’s tone range, and (4) the ‘weighted saturation’, i.e., the combination of the previous two, that is the ratio between the mean saturation and the pixels’ area of a specific hue. Furthermore, each image was filtered on the base of the L channel (CIELAB) to analyze: (i) saturation of low lightness pixels; (ii) saturation of high lightness pixels.
The datasets containing the chromatic features and the emotional response values (structured separately for the two different studies) were normalized using the ScikitLearn MinMaxScaler method (range [0:1]) to make the variables comparable. A correlation matrix was then generated by checking the chromatic feature/emotional response pairs.
Due to the different simulation solutions of the two studies (VR in Study 1, AR in Study 2), the correlation values between colors and emotions in one system and the other may differ. For this reason, we first considered the correlation’s statistical significance and then applied the Bland-Altman evaluation [121,122] to establish the concordance between the correlations found in the two case studies. In Bland-Altman’s graphs, the mean of the correlations found in the two cases is shown on the abscissas and the difference between the two correlations values on the ordinates. According to this representation, the more the pairs of correlations agree, the closer they are to the indifference line (delta = 0.00) on the y-axis. The closer they are to the indifference line, the closer they are to the probable real value. Furthermore, the more the correlation values are in agreement and the higher the correlation value is, the more they are placed at the two extremes of the x-axis (mean). In identifying the most relevant correlations, we classified the concordance based on the following criteria: (i) to be High level, the correlations must be contained within the confidence range of the difference values (mean-t_test_confidence) and have an absolute value r > 0.75 (in charts the points inside the azure stripe); (ii) to be Medium level the correlations must be in the intermediate bands between the confidence area of the difference values and the t-confidence boundaries (±1.96 std) of the data (the charts’ area outside the azure stripe and inside the red dashed lines); (iii) all the other correlations are classified as a Low level of concordance.
Using the Bland-Altman chart coordinates, we applied a DBSCAN clustering to check possible groups of features to deeper interpret the correlations as agreement patterns; the cluster analysis is conducted on the emotional characteristics that show higher agreement and higher statistical significance in correlations.

4. Results

4.1. Emotional Reactions to the Simulated Urban Environment

The cartesian plane described by the circumplex model presents pleasant emotions on the right and unpleasant emotions on the left, arousing emotions on the top and sleepy emotions on the bottom. The cartesian plane is divided into sections labeled with basic emotions. In Figure 1, each dot represents the average value of the emotional reaction from a single point of view (PoV). PoVs A and B of Study 1 were categorized as depressed. PoV C of Study 1 was categorized as alert-excited. PoV D of Study 1 was categorized as tense. PoVs 1 and 3 of Study 2 were categorized as fatigued. PoV 2 of Study 2 was categorized as calm. In Figure 2, the isovists corresponding to the different PoVs (Figure 3) rated by participants are shown on a map. The color of each isovist corresponds to the color of the position the PoV has on the cartesian plane.

4.2. Color Features and Emotional Reactions

Figure 4 (PoV D, case Study 1), Figure 5 (PoV 1, case Study 2), and Figure 6 (PoV 2, case Study 2) provide an example of the viewed urban landscape and the related green and lime elements identification, including the pie-charts of the hues proportion and the eight main colors of the scene. For the present paper and based on the literature suggesting the key role of different types of green in assessing vegetation effects on people [123,124], we only present here the correlations of lime and green tones with the emotions’ factors (Table 1). The greenery in the pictures was mainly represented by lime pixels: in Study 1, Lime M = 7.99% s.d. = 9.99%, Green M = 2.04% s.d. = 1.73%; in Study 2, Lime M = 5.71% s.d. = 1.80%, Green M = 0.85% s.d. = 1.13%. As a first step, a correlational inquiry was performed. In Study 1 (VR, Table 1), results suggested the existence of significant correlations (p < 0.05) of the Unpleasant factor with two variables concerning the lime color and one variable concerning the green color. No other variables correlated significantly with any other detected emotion. Considering the lime color, the variables significantly correlated (negative correlation) to the Unpleasant factor were the pixel area (%) (r = −0.98, p < 0.05), namely the amount of image surface covered by lime pixels, and the “weighted saturation” (r = −0.96, p < 0.05), calculated as the pixels’ average saturation value in the lime tone range (38° ≤ Hue < 53°). Regarding the green color, only this latter variable correlated significantly with the Unpleasant factor (r = −0.95, p < 0.05). In Study 2 (AR, Table 1), only one significant (negative) correlation between color variables (lime pixel area %) and emotions (Pleasant factor) was detected (r = −0.98, p < 0.05). Moreover, in Study 2 significant (positive) correlations were detected between the percentage of area covered by high lightness pixels and the Unpleasant/Pleasant continuum (r = 0.99, p < 0.05), and between the mean lightness of neutral hues areas and the Deactivation/Activation continuum (r = 0.99, p < 0.05).
As a second step, Bland-Altman analysis was applied to measure the level of agreement between the correlations obtained in the two studies (VR and AR).
The results from the first and second steps were used to identify the variables that met the following restrictive criteria of significance:
  • To show a significant correlation in at least one of the two studies: p < 0.05.
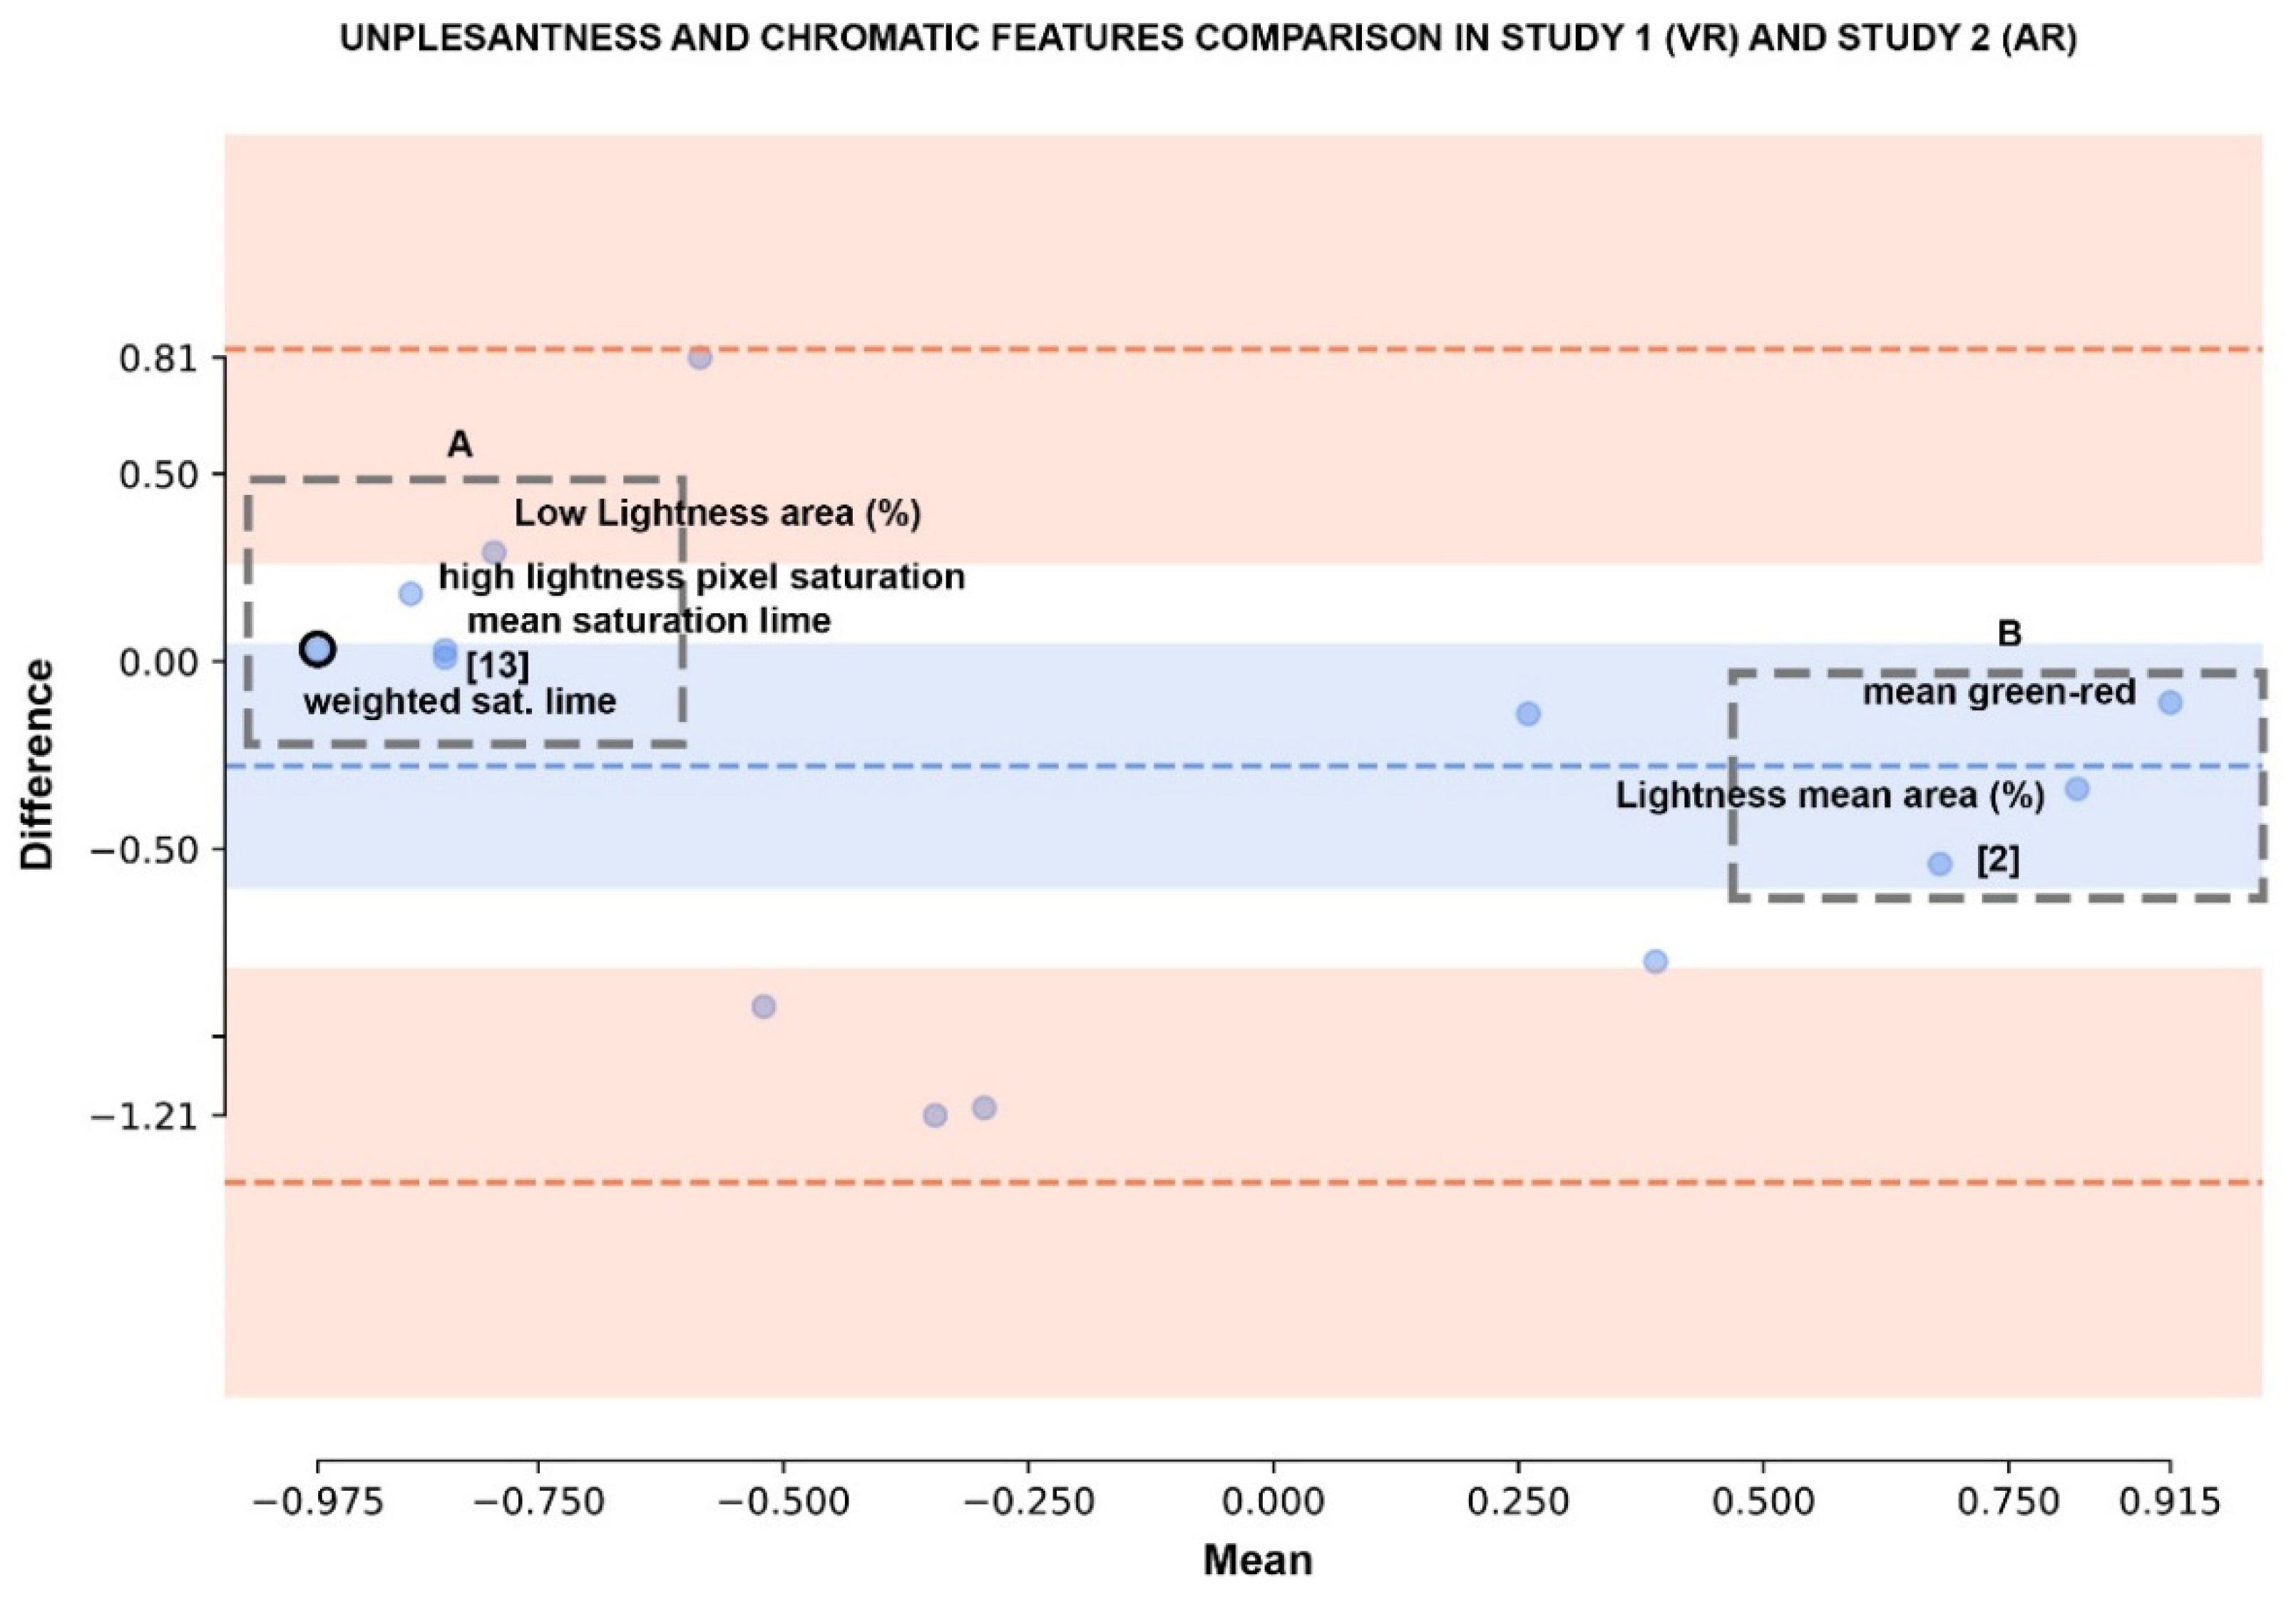
  • To be included in the Bland-Altman interval of confidence: Difference in the range [(mean distance from equality—t_confidence) ∶ (mean distance from equality + t_confidence)], where the mean distance from equality is the mean of all difference values related to an emotional parameter.
  • To show a high level of agreement in the two studies comparisons: |mean correlation| > 0.75.
Table 2 shows the difference values between Study 1 and 2 correlations; Table 3, Table 4 and Table 5 shows mean values of Study 1 and 2 correlations; Table 4 and Table 5 show Bland-Altman analysis results, representing the presence within the confidence interval and the level of agreement. The correlation between weighted saturation lime and the Unpleasant factor was the only one respecting the criteria of significance. No other color variables showed statistical significance and high agreement strength in their interaction with emotional factors. We computed a post-hoc power analysis [125] for the Unpleasant variable, resulting p = 94.90%:α = 0.05, Δ = 0.70, n1 = 48, n2 = 63, s1 = 0.74, s2 = 1.29.

4.3. Agreements Cluster Analysis

The emotional factor resulting as significant from previous analyses was the Unpleasant (weighted saturation lime difference = 0.03, mean = −0.98). Furthermore, the Unpleasant parameter presents most of the agreement on the emotional effect of chromatic features: 36% of high agreements, 14% of medium agreements. Cluster analysis run on Unpleasant Bland-Altman chart for the correlations’ agreement generated two clusters related to negative (cluster A) and positive correlations (cluster B). In the Unpleasant graph agreement (Figure 7), cluster A groups percentage area of low lightness, saturation of high lightness areas, mean saturation of lime areas, weighted saturation of lime area, mean saturation green; cluster B groups mean green-red value, percentage of area covered in mean lightness pixel, high lightness area (%).

5. Discussion

Our research investigated the relationship between colors and emotions in actual urban areas, including existing vegetation in VR (Study 1) and a designed project with NBS in AR (Study 2) through a two steps process. Firstly, we analyzed the general effects of urban scenes colors on emotions, focusing on lime and green colors traditionally associated with natural elements [123]. Secondly, we tested the level of agreement between two different simulation solutions by comparing VR and AR.
Compared with the generally positive effects of natural elements reported in the literature, the relationship between lime and green color tones and affective states was not straightforward in our studies. In the first place, green tones show a significant correlation with emotions only in one case (green weighted saturation reduces the Unpleasant factor) and only in the VR experimental condition. Lime tones show two significant correlations: both lime pixel area (%) and lime weighted saturation reduce the Unpleasant factor, and the latter effect has a high agreement between VR and AR. The effects of lime are consistent with previous studies on yellowish-green plants associated with positive emotions and happiness [123,124]. Despite this, it is worth noting that lime pixel area (%) also has a negative correlation with the Pleasant factor in AR, which is anyway in disagreement with VR. Most of the positive effects observed with lime and green tones are consistent with previous literature, whereas further studies are needed to understand better this negative effect of the lime pixel area in AR.
More in general, the results suggest that the presence of green and lime tones via AR and VR reduce the unpleasantness rather than increasing the pleasantness in the urban environment. This finding is coherent with psychological models, which stressed the independence between positive and negative affects [126]. It is possible to argue that, in the examined urban conditions, the perception of urban greenery (lime tones in AR and VR, green tones in AR only) triggers less intense sensations of dissatisfaction and repulsion but does not significantly stimulate the individual perception of beauty and pleasantness. Furthermore, the results show no significant relationships between green tones and emotions concerning positive (i.e., calm, relaxation) or negative (i.e., boredom) deactivation. This encourages a non-mechanistic view of the relationship between greenery and pleasantness or relaxation in urban environments. Indeed, despite the well-established positive effect of greenery presented in the literature, it is necessary to contextualize each case study. For example, referring to two classic psychological frameworks, we can hypothesize that in our case studies greenery is not able by itself to generate affordances [127] eliciting emotional states of activation/deactivation [128] or to trigger a restorative experience increasing people’s perception of fascination, being away, extent and compatibility [84].
Finally, the results offer a remarkable suggestion regarding the reliability between AR and VR. Indeed, data suggest that lime and green tones’ influence on some emotional variables is partially consistent with VR and AR scenarios, especially regarding the Unpleasant factor. Considering high-level agreements between VR and AR, including both significant and non-significant correlations, the number of assessments in agreement increases from one to seven. It is worth noting that the majority of such agreements include the Unpleasant factor, which appears as the most stable variable that can be assessed comparatively with AR and VR, at least regarding green tones. These results pave the way for future analyses comparing VR and AR.
The results suggest that the positive effects of natural elements [57,87] should be explored more in detail in the future. The different reactions to green and lime colors, as well as the varying effect that the considered lime variables had on pleasantness, call for a deeper understanding of the role played by several natural factors. As suggested by Han and Ruan [129], future research should tackle issues including plants’ amount, size, color, scent, and type (including flowers, foliage, shape). In such a perspective, it is also relevant to consider time (e.g., seasonal conditions) in relation to the geographical location. In developing such researches, it is important considering that the relationship between human and environmental factors is an interdisciplinary topic, investigated in various disciplines with many different theoretical and methodological traditions such as psychology, architecture, landscape design, or agriculture. Hence, the research conducted by monodisciplinary teams are more prone to be methodologically sounder on environmental factors or on human ones but not on both of them. As Bringslimark, Hartig and Patil [130] suggested in their review on indoor plants, more collaboration between environmental psychologists and horticulturists would be beneficial. Similarly, such reflections can be extended to the greenery in public spaces, which calls for even broader collaboration [131].
Results also stress once more that an ethic for simulation usage is needed and urgent [132,133,134] since the improper alteration of the simulation elements, including colors, can create distortions in the proper understanding of the depicted environment; in the worst case, this can lead to poor urban/landscape planning and design decision that impact on society. Showing biased representations that do not trustfully anticipate the urban transformation is also a powerful—and thus hazardous—tool for manipulating public opinion and directly impacting citizens’ emotional states. This consideration is relevant both when presenting urban design projects to a pre-selected private audience or when using it in public participatory processes. In the same perspective, it is also essential that the scientific research continues investigating such a topic for leading the fair preparation and application of simulation in relation to the specific knowledge goals and the available resources (e.g., available time and abilities, economic and human resources). This proper cost/benefit balance is crucial to positively impact cities and societies. Indeed, the recent advancement of solutions such as VR and AR suggests their incremental usage in urban processes, but the impact of costs for producing reliable realistic simulations should not be underestimated. Indeed, the proper production of simulations can be affected by this economic aspect; thus, correctly identifying the needed fidelity level of the simulation can potentially contribute to its wider unbiased application.

6. Conclusions

Our results bear some limitations to be carefully considered. Our analysis focused on color features extracted from the images, which included a high amount of lime pixels compared to green ones, both in VR and AR. In addition, we did not consider the semantic value of the green elements included in the images; hence all types of vegetation are considered equal, including trees, bushes, grass, and flowers. These elements were present in varying proportions in the actual and in the designed scenario. Similarly, no variables were considered to distinguish lush and cultivated vegetation from unkempt and spontaneous greenery, which varied across the scenarios. Moreover, it is worth noting that the weather conditions, another environmental feature that influences affective states, varied across the scenarios. VR presented a sunny environment, whereas AR superimposed the building with NBS on the urban landscape on a cloudy winter day, which may have affected participants’ emotions. The limitations of the quasi-experimental design, which hinders the full comparability of the two scenarios, and the choice of environments unbalanced towards lime tones are due to the data collection during a real case study. The needs of the participatory process limited the choice of the environment to explore, prevented us from manipulating the designed NBS, narrowed the choice of tools for data collection, and influenced the choice of participants. Such considerations suggest two main fields of research for the future. The first concerns theoretical research, which implies experimental design, the manipulation of single environmental variables (e.g., types of vegetation, weather and seasonal conditions, architectural solutions), and broader categories of participants. Laboratory research would also allow scholars to examine more in depth the psycho-physiological effects of such technologies, offering a complementary perspective to the emotional description obtained through psychometric scales; one of the main obstacles for the inclusion of such physiological tools in actual participatory processes lies in the difficulty of having reliable measures with low-cost and non-intrusive instruments. The second field is related to applied research, investigating the most effective procedures for integrating these technologies and the related devices into concrete case studies, devoting specific attention to sensitive populations (e.g., with low digital literacy, color vision or other sight deficiencies). In addition to the citizens’ perspective, it is also worth considering other stakeholders’ perception: the opinion of experts working in public institutions and private companies involved in relevant urban transformations are a key factor for designing successful engagement strategies.
Despite these limitations, our studies showed that it is possible to obtain a reliable assessment of the emotional reaction to NBS, even when comparing data gathered with different technologies such as VR and AR. In light of such results, we conceive participatory apps with VR/AR solutions as valuable tools for participatory urban processes; they can represent a quick and affordable assessment tool for investigating the relevant issue of alignment with the community needs [15] and monitoring the differences among sub-populations [30]. Indeed, the gained results are relevant sources for checking the congruence between users’ perceptions and design desiderata. Moreover, the application of AR and VR solutions generally engages citizens and fosters inclusiveness thanks to the ease of understanding of the design outcomes. Our studies show that integrating these apps in a participatory process enables the collection of specific contextual information about the people-environment relationship focusing on NBS. Indeed, with such an approach, it is possible to combine objective (e.g., environmental features such as chromatic elements) and subjective data analysis (e.g., emotional and/or cognitive reaction). The explanatory capability of subjective data is increased when associated with socio-demographic variables, allowing a more detailed explanation or a targeted analysis of results.
In this perspective, the proposed approach supports improving collective wellbeing by favoring the creation of places capable of fulfilling the community goals and inclinations [135]. Such an approach would allow different stakeholders to assess the wellbeing experienced by different population segments and thus consistently inform the design or decision-making phase. Nevertheless, participatory apps are not conceived as autonomous tools for guiding design solutions; rather, they can be seen as a tool for fostering people’s perspectives in urban processes (i.e., human-centered design) by opening a debate among the stakeholders involved in the transformation process. The interpretation of the results gained via such smart participatory solutions is assigned to professionals with a background in social sciences and architecture/urban planning, and experts of the local context capable of including cultural variables regarding artificial and natural elements and expected behaviors of local/global communities. The translation of such information into meaningful physical features is entirely in charge of architects and planners.

7. Patents

The AR4CUP APP, distributed as City Sense by Artefacto, provides realistic and immersive environment replicas via AR or VR. Through an architectural\psychological integrated framework, the interaction with the simulated environment triggers an experience that can be reliably assessed using established psychological constructs (exp-EIA©—Experiential Environmental Impact Assessment—Copyright BOIP N. 123453—6 May 2020 and N. 130516—25 February 2021; Patent for Invention application N. 102021000017168—30 June 2021).

Author Contributions

The overall effort on the article and the writing is equally distributed among the authors, whose contribution according to CRediT (Contributor Roles Taxonomy) is described as follows. Conceptualization, B.E.A.P. and M.B.; methodology, B.E.A.P., G.S., N.R. and M.B.; formal analysis, G.S.; investigation, B.E.A.P., G.S., N.R. and M.B.; data curation, G.S.; writing—original draft preparation, G.S. and N.R.; writing—review and editing, B.E.A.P. and M.B.; visualization, B.E.A.P. and G.S.; supervision, B.E.A.P. and M.B.; funding acquisition, B.E.A.P. All authors have read and agreed to the published version of the manuscript.

Funding

This project has received funding from the European Union’s Horizon 2020 research and innovation program EIT Digital 2019 and 2020 “AR4CUP: Augmented Reality for Collaborative Urban Planning”.The sole responsibility of this publication lies with the author. The European Union is not responsible for any use that may be made of the information contained therein.

Institutional Review Board Statement

The study was conducted according to the guidelines of the Declaration of Helsinki, and approved by the Institutional Ethics Committee of POLITECNICO DI MILANO (protocol code 7/2019 on 18/03/2019, and 15/2020 on 15/07/2020).

Informed Consent Statement

Informed consent was obtained from all subjects involved in the study.

Data Availability Statement

Original data can be obtained by contacting the first author. Authorization for publication consent was obtained from all authors and involved partners.

Acknowledgments

The first draft of this paper was presented at the symposium Greening cities shaping cities on 12 and 13 October 2020, at the Politecnico di Milano; for more information visit www.greeningcities-shapingcities.polimi.it (accessed on 19 November 2021).

Conflicts of Interest

The authors declare no conflict of interest.

References

  1. European Commission; Directorate-General for Research and Innovation. Towards an EU Research and Innovation Policy Agenda for Nature-Based Solutions & Re-Naturing Cities: Final Report of the Horizon 2020 Expert Group on “Nature Based Solutions and Re Naturing Cities; Publications Office of the European Union: Luxemburg, 2015; ISBN 978-92-79-46048-7. [Google Scholar]
  2. Faivre, N.; Fritz, M.; Freitas, T.; de Boissezon, B.; Vandewoestijne, S. Nature-Based Solutions in the EU: Innovating with Nature to Address Social, Economic and Environmental Challenges. Environ. Res. 2017, 159, 509–518. [Google Scholar] [CrossRef]
  3. Parenership for Environment and Disaster Risk Reduction; Friends of EbA. Promoting Nature-Based Solutions in the Post-2020 Global Biodiversity Framework; International Union for Conservation of Nature: Gland, Switzerland, 2020. [Google Scholar]
  4. Nesshöver, C.; Assmuth, T.; Irvine, K.N.; Rusch, G.M.; Waylen, K.A.; Delbaere, B.; Haase, D.; Jones-Walters, L.; Keune, H.; Kovacs, E.; et al. The Science, Policy and Practice of Nature-Based Solutions: An Interdisciplinary Perspective. Sci. Total Environ. 2017, 579, 1215–1227. [Google Scholar] [CrossRef] [PubMed]
  5. Bishop, I.D. Environmental Information and Technology: Is It All Too Much? Landsc. Urban Plan. 2000, 47, 111–114. [Google Scholar] [CrossRef]
  6. Ferreira, V.; Barreira, A.P.; Loures, L.; Antunes, D.; Panagopoulos, T. Stakeholders’ Engagement on Nature-Based Solutions: A Systematic Literature Review. Sustainability 2020, 12, 640. [Google Scholar] [CrossRef] [Green Version]
  7. Rainisio, N.; Boffi, M.; Riva, E. Positive Change in Environment: Aesthetics, Environmental Flowability and Well-Being. In Enabling Positive Change: Flow and Complexity in Daily Experience; Inghilleri, P., Riva, G., Riva, E., Eds.; DE GRUYTER OPEN: Warsaw, Poland, 2015; ISBN 978-3-11-041024-2. [Google Scholar]
  8. Joye, Y. Architectural Lessons from Environmental Psychology: The Case of Biophilic Architecture. Rev. Gen. Psychol. 2007, 11, 305–328. [Google Scholar] [CrossRef] [Green Version]
  9. Kellert, S.R.; Heerwagen, J.H.; Mador, M.L. Biophilic Design: The Theory, Science, and Practice of Bringing Buildings to Life; Wiley: Hoboken, NJ, USA, 2008. [Google Scholar]
  10. Kellert, S.; Wilson, E. The Biophilia Hypothesis; Island Press: Washington, DC, USA, 1993. [Google Scholar]
  11. Xue, F.; Gou, Z.; Lau, S.S.-Y.; Lau, S.-K.; Chung, K.-H.; Zhang, J. From Biophilic Design to Biophilic Urbanism: Stakeholders’ Perspectives. J. Clean Prod. 2019, 211, 1444–1452. [Google Scholar] [CrossRef]
  12. Jiang, B.; Larsen, L.; Deal, B.; Sullivan, W.C. A Dose–Response Curve Describing the Relationship between Tree Cover Density and Landscape Preference. Landsc. Urban Plan. 2015, 139, 16–25. [Google Scholar] [CrossRef]
  13. Kaplan, R.; Kaplan, S. The Experience of Nature: A Psychological Perspective; Cambridge University Press: Cambridge, UK, 1989; ISBN 978-0-521-34939-0. [Google Scholar]
  14. White, E.V.; Gatersleben, B. Greenery on Residential Buildings: Does It Affect Preferences and Perceptions of Beauty? J. Environ. Psychol. 2011, 31, 89–98. [Google Scholar] [CrossRef] [Green Version]
  15. Wolch, J.R.; Byrne, J.; Newell, J.P. Urban Green Space, Public Health, and Environmental Justice: The Challenge of Making Cities ‘Just Green Enough. Landsc. Urban Plan. 2014, 125, 234–244. [Google Scholar] [CrossRef] [Green Version]
  16. Ulrich, R.S.; Simons, R.F.; Losito, B.D.; Fiorito, E.; Miles, M.A.; Zelson, M. Stress Recovery during Exposure to Natural and Urban Environments. J. Environ. Psychol. 1991, 11, 201–230. [Google Scholar] [CrossRef]
  17. Cousins, J.J. Justice in Nature-Based Solutions: Research and Pathways. Ecol. Econ. 2021, 180, 106874. [Google Scholar] [CrossRef]
  18. Dale, A.; Newman, L.L. Sustainable Development for Some: Green Urban Development and Affordability. Local Environ. 2009, 14, 669–681. [Google Scholar] [CrossRef]
  19. Haase, D.; Kabisch, S.; Haase, A.; Andersson, E.; Banzhaf, E.; Baró, F.; Brenck, M.; Fischer, L.K.; Frantzeskaki, N.; Kabisch, N.; et al. Greening Cities—To Be Socially Inclusive? About the Alleged Paradox of Society and Ecology in Cities. Habitat Int. 2017, 64, 41–48. [Google Scholar] [CrossRef]
  20. Curran, W.; Hamilton, T. Just Green Enough: Contesting Environmental Gentrification in Greenpoint, Brooklyn. Local Environ. 2012, 17, 1027–1042. [Google Scholar] [CrossRef]
  21. Conway, D.; Li, C.Q.; Wolch, J.; Kahle, C.; Jerrett, M. A Spatial Autocorrelation Approach for Examining the Effects of Urban Greenspace on Residential Property Values. J. Real Estate Finance Econ. 2010, 41, 150–169. [Google Scholar] [CrossRef]
  22. Zhang, Y.; Dong, R. Impacts of Street-Visible Greenery on Housing Prices: Evidence from a Hedonic Price Model and a Massive Street View Image Dataset in Beijing. ISPRS Int. J. Geo-Inf. 2018, 7, 104. [Google Scholar] [CrossRef] [Green Version]
  23. Zuniga-Teran, A.A.; Gerlak, A.K. A Multidisciplinary Approach to Analyzing Questions of Justice Issues in Urban Greenspace. Sustainability 2019, 11, 3055. [Google Scholar] [CrossRef] [Green Version]
  24. Li, H.; Liu, Y. Neighborhood Socioeconomic Disadvantage and Urban Public Green Spaces Availability: A Localized Modeling Approach to Inform Land Use Policy. Land Use Policy 2016, 57, 470–478. [Google Scholar] [CrossRef]
  25. Gould, K.A.; Lewis, T.L. Green Gentrification: Urban Sustainability and the Struggle for Environmental Justice; Routledge: London, UK, 2016; ISBN 978-1-317-41780-4. [Google Scholar]
  26. Li, X.; Zhang, C.; Li, W.; Kuzovkina, Y.A.; Weiner, D. Who Lives in Greener Neighborhoods? The Distribution of Street Greenery and Its Association with Residents’ Socioeconomic Conditions in Hartford, Connecticut, USA. Urban For. Urban Green. 2015, 14, 751–759. [Google Scholar] [CrossRef]
  27. Sipilä, M.; Tyrväinen, L. Evaluation of Collaborative Urban Forest Planning in Helsinki, Finland. Urban For. Urban Green. 2005, 4, 1–12. [Google Scholar] [CrossRef]
  28. Mahmoud, I.; Morello, E. Co-Creation Pathway as a Catalyst for Implementing Nature-Based Solution in Urban Regeneration Strategies Learning from CLEVER Cities Framework and Milano as Test-Bed. Urban. Inf. Interruptions Intersect. Shar. Overlapping New Perspect. Territ. 2018, 25, 204–210. [Google Scholar]
  29. Kronenberg, J. Why Not to Green a City? Institutional Barriers to Preserving Urban Ecosystem Services. Ecosyst. Serv. 2015, 12, 218–227. [Google Scholar] [CrossRef]
  30. Kirkpatrick, J.B.; Davison, A.; Daniels, G.D. Sinners, Scapegoats or Fashion Victims? Understanding the Deaths of Trees in the Green City. Geoforum 2013, 48, 165–176. [Google Scholar] [CrossRef]
  31. Lyytimäki, J.; Sipilä, M. Hopping on One Leg—The Challenge of Ecosystem Disservices for Urban Green Management. Urban For. Urban Green. 2009, 8, 309–315. [Google Scholar] [CrossRef]
  32. Kirkpatrick, J.B.; Davison, A.; Harwood, A. How Tree Professionals Perceive Trees and Conflicts about Trees in Australia’s Urban Forest. Landsc. Urban Plan. 2013, 119, 124–130. [Google Scholar] [CrossRef]
  33. Boffi, M.; Riva, E.; Rainisio, N. Positive Change and Political Participation: Well-Being as an Indicator of the Quality of Citizens’ Engagement. In Enabling Positive Change: Flow and Complexity in Daily Experience; Inghilleri, P., Riva, G., Riva, E., Eds.; DE GRUYTER OPEN: Warsaw, Poland, 2015; ISBN 978-3-11-041024-2. [Google Scholar]
  34. Evans-Cowley, J.; Hollander, J. The New Generation of Public Participation: Internet-Based Participation Tools. Plan. Pract. Res. 2010, 25, 397–408. [Google Scholar] [CrossRef]
  35. Sæbø, Ø.; Rose, J.; Flak, L. The Shape of Eparticipation: Characterizing an Emerging Research Area. Gov. Inf. Q. 2008, 25, 400–428. [Google Scholar] [CrossRef] [Green Version]
  36. Desouza, K.C.; Bhagwatwar, A. Technology-Enabled Participatory Platforms for Civic Engagement: The Case of U.S. Cities. J. Urban Technol. 2014, 21, 25–50. [Google Scholar] [CrossRef]
  37. Picon, A. Smart Cities. A Spatialised Intelligence. AD 2015, 49, 5403. [Google Scholar] [CrossRef]
  38. Boffi, M.; Pola, L.; Fumagalli, N.; Fermani, E.; Senes, G.; Inghilleri, P. Nature Experiences of Older People for Active Ageing: An Interdisciplinary Approach to the Co-Design of Community Gardens. Front. Psychol. 2021, 12, 4175. [Google Scholar] [CrossRef]
  39. Fumagalli, N.; Fermani, E.; Senes, G.; Boffi, M.; Pola, L.; Inghilleri, P. Sustainable Co-Design with Older People: The Case of a Public Restorative Garden in Milan (Italy). Sustainability 2020, 12, 3166. [Google Scholar] [CrossRef] [Green Version]
  40. Kanhere, S.S. Participatory Sensing: Crowdsourcing Data from Mobile Smartphones in Urban Spaces. In Proceedings of the ICDCIT 2013, Bhubaneswar, India, 5–7 February 2013; Hota, C., Srimani, P.K., Eds.; Springer: Berlin/Heidelberg, Germany, 2013; pp. 19–26. [Google Scholar]
  41. Brooks, N. Vulnerability, Risk and Adaptation: A Conceptual Framework; Tyndall Centre for Climate Change Research: Norwich, UK, 2003; p. 20. [Google Scholar]
  42. Bosselmann, P. Urban Transformation: Understanding City Form and Design; Island Press: Washington, DC, USA, 2012; ISBN 978-1-61091-149-8. [Google Scholar]
  43. Ertiö, T.-P. Participatory Apps for Urban Planning—Space for Improvement. Plan. Pract. Res. 2015, 30, 303–321. [Google Scholar] [CrossRef]
  44. Cardone, G.; Cirri, A.; Corradi, A.; Foschini, L.; Ianniello, R.; Montanari, R. Crowdsensing in Urban Areas for City-Scale Mass Gathering Management: Geofencing and Activity Recognition. IEEE Sens. J. 2014, 14, 4185–4195. [Google Scholar] [CrossRef]
  45. Capineri, C.; Huang, H.; Gartner, G. Tracking Emotions in Urban Space. Two Experiments in Vienna and Siena. Riv. Geogr. Ital. 2018, 125, 273–288. [Google Scholar]
  46. Hudson-Smith, A.; Evans, S.; Batty, M. Building the Virtual City: Public Participation through e-Democracy. Knowl. Technol. Policy 2005, 18, 62–85. [Google Scholar] [CrossRef]
  47. Anagnostou, K.; Vlamos, P. Square AR: Using Augmented Reality for Urban Planning. In Proceedings of the 2011 Third International Conference on Games and Virtual Worlds for Serious Applications, Athens, Greece, 4–6 May 2011; pp. 128–131. [Google Scholar]
  48. Bosché, F.; Tingdahl, D.; Carozza, L.; Gool, L.V. Markerless Vision-Based Augmented Reality for Enhanced Project Visualization. Gerontechnology 2012, 11, 69. [Google Scholar] [CrossRef]
  49. Imottesjo, H.; Kain, J.-H. The Urban CoBuilder—A Mobile Augmented Reality Tool for Crowd-Sourced Simulation of Emergent Urban Development Patterns: Requirements, Prototyping and Assessment. Comput. Environ. Urban Syst. 2018, 71, 120–130. [Google Scholar] [CrossRef]
  50. Rodríguez Bolívar, M.P.; Alcaide Muñoz, L. E-Participation in Smart Cities: Technologies and Models of Governance for Citizen Engagement; Public Administration and Information Technology; Springer: Cham, Switzerland, 2019; Volume 34, ISBN 978-3-319-89473-7. [Google Scholar]
  51. Stratigea, A.; Papadopoulou, C.-A.; Panagiotopoulou, M. Tools and Technologies for Planning the Development of Smart Cities. J. Urban Technol. 2015, 22, 43–62. [Google Scholar] [CrossRef]
  52. Appleyard, D. Understanding Professional Media. In Human Behavior and Environment; Altman, I., Wohlwill, J.F., Eds.; Plenum Press: New York, NY, USA, 1977; pp. 43–88. ISBN 978-1-4684-0810-2. [Google Scholar]
  53. Bosselmann, P. Representation of Places: Reality and Realism in City Design; University of California Press: Oakland, CA, USA, 1998; ISBN 978-0-520-20658-8. [Google Scholar]
  54. Piga, B.E.A.; Morello, E. Environmental Design Studies on Perception and Simulation: An Urban Design Approach. Int. J. Sens. Environ. Archit. Urban Space 2015. [Google Scholar] [CrossRef] [Green Version]
  55. Sheppard, S.R.J. Visual Simulation: A User Guide for Architects, Engineers, and Planners; Van Nostrand Reinhold: New York, NY, USA, 1989; ISBN 978-0-442-27827-4. [Google Scholar]
  56. McKechnie, G.E. Simulation Techniques in Environmental Psychology. In Perspectives on Environment and Behavior; Stokols, D., Ed.; Plenum Press: London, UK, 1977; pp. 169–189, ISBN 13: 978-1-4684-2279-5. [Google Scholar]
  57. Browning, M.H.E.M.; Saeidi-Rizi, F.; McAnirlin, O.; Yoon, H.; Pei, Y. The Role of Methodological Choices in the Effects of Experimental Exposure to Simulated Natural Landscapes on Human Health and Cognitive Performance: A Systematic Review. Environ. Behav. 2020. [Google Scholar] [CrossRef]
  58. Calogiuri, G.; Litleskare, S.; Fagerheim, K.A.; Rydgren, T.L.; Brambilla, E.; Thurston, M. Experiencing Nature through Immersive Virtual Environments: Environmental Perceptions, Physical Engagement, and Affective Responses during a Simulated Nature Walk. Front. Psychol. 2018, 8, 2321. [Google Scholar] [CrossRef] [Green Version]
  59. Kahn, P.H.; Severson, R.L.; Ruckert, J.H. The Human Relation With Nature and Technological Nature. Curr. Dir. Psychol. Sci. 2009, 18, 37–42. [Google Scholar] [CrossRef]
  60. Kjellgren, A.; Buhrkall, H. A Comparison of the Restorative Effect of a Natural Environment with That of a Simulated Natural Environment. J. Environ. Psychol. 2010, 30, 464–472. [Google Scholar] [CrossRef]
  61. Lassonde, K.A.; Gloth, C.A.; Borchert, K. Windowless Classrooms or a Virtual Window World: Does a Creative Classroom Environment Help or Hinder Attention? Teach. Psychol. 2012, 39, 262–267. [Google Scholar] [CrossRef]
  62. Loomis, J.M.; Blascovich, J.J.; Beall, A.C. Immersive Virtual Environment Technology as a Basic Research Tool in Psychology. Behav. Res. Methods Instrum. Comput. 1999, 31, 557–564. [Google Scholar] [CrossRef] [PubMed] [Green Version]
  63. Dede, C. Immersive Interfaces for Engagement and Learning. Science 2009, 323, 66–69. [Google Scholar] [CrossRef] [PubMed] [Green Version]
  64. Edler, D.; Keil, J.; Wiedenlübbert, T.; Sossna, M.; Kühne, O.; Dickmann, F. Immersive VR Experience of Redeveloped Post-Industrial Sites: The Example of “Zeche Holland” in Bochum-Wattenscheid. KN-J. Cartogr. Geogr. Inf. 2019, 69, 267–284. [Google Scholar] [CrossRef] [Green Version]
  65. Loyola, M.; Rossi, B.; Montiel, C.; Daiber, M. Use of Virtual Reality in Participatory Design. In Blucher Design Proceedings; Editora Blucher: Porto, Portugal, 2019; pp. 449–454. [Google Scholar]
  66. Williams, A.S.; Angelini, C.; Kress, M.; Ramos Vieira, E.; D’Souza, N.; Rishe, N.D.; Medina, J.; Özer, E.; Ortega, F. Augmented Reality for City Planning. In Proceedings of the Virtual, Augmented and Mixed Reality. Design and Interaction, Copenhagen, Denmark, 19–24 July 2020; Chen, J.Y.C., Fragomeni, G., Eds.; Springer: Cham, Switzerland, 2020; pp. 256–271. [Google Scholar]
  67. Saßmannshausen, S.M.; Radtke, J.; Bohn, N.; Hussein, H.; Randall, D.; Pipek, V. Citizen-Centered Design in Urban Planning: How Augmented Reality Can Be Used in Citizen Participation Processes. In Proceedings of the Designing Interactive Systems Conference 2021, Virtual Event, USA, 28 June 2021; pp. 250–265. [Google Scholar]
  68. Nitoslawski, S.A.; Galle, N.J.; Van Den Bosch, C.K.; Steenberg, J.W.N. Smarter Ecosystems for Smarter Cities? A Review of Trends, Technologies, and Turning Points for Smart Urban Forestry. Sustain. Cities Soc. 2019, 51, 101770. [Google Scholar] [CrossRef]
  69. Frumkin, H.; Bratman, G.N.; Breslow, S.J.; Cochran, B.; Kahn, J.P.H.; Lawler, J.J.; Levin, P.S.; Tandon, P.S.; Varanasi, U.; Wolf, K.L.; et al. Nature Contact and Human Health: A Research Agenda. Environ. Health Perspect. 2017, 125, 075001. [Google Scholar] [CrossRef] [Green Version]
  70. Velarde, M.D.; Fry, G.; Tveit, M. Health Effects of Viewing Landscapes—Landscape Types in Environmental Psychology. Urban For. Urban Green. 2007, 6, 199–212. [Google Scholar] [CrossRef]
  71. Parsons, R.; Tassinary, L.G.; Ulrich, R.S.; Hebl, M.R.; Grossman-Alexander, M. The View From The Road: Implications for Stress Recovery and Immunization. J. Environ. Psychol. 1998, 18, 113–140. [Google Scholar] [CrossRef]
  72. Ulrich, R.S. View through a Window May Influence Recovery from Surgery. Science 1984, 224, 420–421. [Google Scholar] [CrossRef] [Green Version]
  73. Tennessen, C.M.; Cimprich, B. Views to Nature: Effects on Attention. J. Environ. Psychol. 1995, 15, 77–85. [Google Scholar] [CrossRef]
  74. Berto, R. The Role of Nature in Coping with Psycho-Physiological Stress: A Literature Review on Restorativeness. Behav. Sci. 2014, 4, 394–409. [Google Scholar] [CrossRef] [Green Version]
  75. Richardson, M.; McEwan, K.; Maratos, F.; Sheffield, D. Joy and Calm: How an Evolutionary Functional Model of Affect Regulation Informs Positive Emotions in Nature. Evol. Psychol. Sci. 2016, 2, 308–320. [Google Scholar] [CrossRef] [Green Version]
  76. Dijkstra, K.; Pieterse, M.; Pruyn, A. Physical Environmental Stimuli That Turn Healthcare Facilities into Healing Environments through Psychologically Mediated Effects: Systematic Review. J. Adv. Nurs. 2006, 56, 166–181. [Google Scholar] [CrossRef]
  77. Kline, G.A. Does A View of Nature Promote Relief From Acute Pain? J. Holist. Nurs. 2009, 27, 159–166. [Google Scholar] [CrossRef] [PubMed]
  78. Berman, M.G.; Jonides, J.; Kaplan, S. The Cognitive Benefits of Interacting With Nature. Psychol. Sci. 2008, 19, 1207–1212. [Google Scholar] [CrossRef] [PubMed]
  79. Kuo, F.E.; Sullivan, W.C. Aggression and Violence in the Inner City: Effects of Environment via Mental Fatigue. Environ. Behav. 2001, 33, 543–571. [Google Scholar] [CrossRef]
  80. Sullivan, W.C.; Kuo, F.E.; Depooter, S.F. The Fruit of Urban Nature: Vital Neighborhood Spaces. Environ. Behav. 2004, 36, 678–700. [Google Scholar] [CrossRef]
  81. Wells, N.M.; Evans, G.W. Nearby Nature: A Buffer of Life Stress among Rural Children. Environ. Behav. 2003, 35, 311–330. [Google Scholar] [CrossRef]
  82. Engemann, K.; Svenning, J.-C.; Arge, L.; Brandt, J.; Geels, C.; Mortensen, P.B.; Plana-Ripoll, O.; Tsirogiannis, C.; Pedersen, C.B. Natural Surroundings in Childhood Are Associated with Lower Schizophrenia Rates. Schizophr. Res. 2020, 216, 488–495. [Google Scholar] [CrossRef]
  83. Krabbendam, L.; van Os, J. Schizophrenia and Urbanicity: A Major Environmental Influence—Conditional on Genetic Risk. Schizophr. Bull. 2005, 31, 795–799. [Google Scholar] [CrossRef]
  84. Kaplan, S. The Restorative Benefits of Nature: Toward an Integrative Framework. J. Environ. Psychol. 1995, 15, 169–182. [Google Scholar] [CrossRef]
  85. Korpela, K.M. Adolescents’ Favourite Places and Environmental Self-Regulation. J. Environ. Psychol. 1992, 12, 249–258. [Google Scholar] [CrossRef]
  86. Korpela, K.M.; Hartig, T.; Kaiser, F.G.; Fuhrer, U. Restorative Experience and Self-Regulation in Favorite Places. Environ. Behav. 2001, 33, 572–589. [Google Scholar] [CrossRef]
  87. Gerber, S.M.; Jeitziner, M.-M.; Wyss, P.; Chesham, A.; Urwyler, P.; Müri, R.M.; Jakob, S.M.; Nef, T. Visuo-Acoustic Stimulation That Helps You to Relax: A Virtual Reality Setup for Patients in the Intensive Care Unit. Sci. Rep. 2017, 7, 13228. [Google Scholar] [CrossRef] [PubMed] [Green Version]
  88. Pasca, L.; Carrus, G.; Loureiro, A.; Navarro, Ó.; Panno, A.; Tapia Follen, C.; Aragonés, J.I. Connectedness and Well-Being in Simulated Nature. Appl. Psychol. Health Well-Being 2021. [Google Scholar] [CrossRef]
  89. Yeo, N.L.; White, M.P.; Alcock, I.; Garside, R.; Dean, S.G.; Smalley, A.J.; Gatersleben, B. What Is the Best Way of Delivering Virtual Nature for Improving Mood? An Experimental Comparison of High Definition TV, 360° Video, and Computer Generated Virtual Reality. J. Environ. Psychol. 2020, 72, 101500. [Google Scholar] [CrossRef] [PubMed]
  90. Felnhofer, A.; Kothgassner, O.D.; Schmidt, M.; Heinzle, A.-K.; Beutl, L.; Hlavacs, H.; Kryspin-Exner, I. Is Virtual Reality Emotionally Arousing? Investigating Five Emotion Inducing Virtual Park Scenarios. Int. J. Hum.-Comput. Stud. 2015, 82, 48–56. [Google Scholar] [CrossRef]
  91. De Kort, Y.A.W.; Meijnders, A.L.; Sponselee, A.A.G.; IJsselsteijn, W.A. What’s Wrong with Virtual Trees? Restoring from Stress in a Mediated Environment. J. Environ. Psychol. 2006, 26, 309–320. [Google Scholar] [CrossRef]
  92. Anderson, A.P.; Mayer, M.D.; Fellows, A.M.; Cowan, D.R.; Hegel, M.T.; Buckey, J.C. Relaxation with Immersive Natural Scenes Presented Using Virtual Reality. Aerosp. Med. Hum. Perform. 2017, 88, 520–526. [Google Scholar] [CrossRef]
  93. Herman, L.M.; Sherman, J. Virtual Nature: A Psychologically Beneficial Experience. In Virtual, Augmented and Mixed Reality. Multimodal Interaction; Lecture Notes in Computer Science; Chen, J.Y.C., Fragomeni, G., Eds.; Springer: Cham, Switzerland, 2019; Volume 11574, pp. 441–449. ISBN 978-3-030-21606-1. [Google Scholar]
  94. Wang, X.; Shi, Y.; Zhang, B.; Chiang, Y. The Influence of Forest Resting Environments on Stress Using Virtual Reality. Int. J. Environ. Res. Public Health 2019, 16, 3263. [Google Scholar] [CrossRef] [PubMed] [Green Version]
  95. Gao, T.; Zhu, L.; Qiu, L.; Gao, T.; Gao, Y. Exploring Psychophysiological Restoration and Individual Preference in the Different Environments Based on Virtual Reality. Int. J. Environ. Res. Public Health 2019, 16, 3102. [Google Scholar] [CrossRef] [PubMed] [Green Version]
  96. Elliot, A.J.; Maier, M.A. Color Psychology: Effects of Perceiving Color on Psychological Functioning in Humans. Annu. Rev. Psychol. 2014, 65, 95–120. [Google Scholar] [CrossRef]
  97. Mehta, R.; Zhu, R. (Juliet) Blue or Red? Exploring the Effect of Color on Cognitive Task Performances. Science 2009, 323, 1226–1229. [Google Scholar] [CrossRef] [Green Version]
  98. Lichtenfeld, S.; Elliot, A.J.; Maier, M.A.; Pekrun, R. Fertile Green: Green Facilitates Creative Performance. Pers. Soc. Psychol. Bull. 2012, 38, 784–797. [Google Scholar] [CrossRef] [Green Version]
  99. Akers, A.; Barton, J.; Cossey, R.; Gainsford, P.; Griffin, M.; Micklewright, D. Visual Color Perception in Green Exercise: Positive Effects on Mood and Perceived Exertion. Environ. Sci. Technol. 2012, 46, 8661–8666. [Google Scholar] [CrossRef] [PubMed]
  100. Clarke, T.; Costall, A. The Emotional Connotations of Color: A Qualitative Investigation. Color Res. Appl. 2008, 33, 406–410. [Google Scholar] [CrossRef]
  101. Fetterman, A.K.; Robinson, M.D.; Meier, B.P. Anger as “Seeing Red”: Evidence for a Perceptual Association. Cogn. Emot. 2012, 26, 1445–1458. [Google Scholar] [CrossRef] [Green Version]
  102. Hill, R.A.; Barton, R.A. Red Enhances Human Performance in Contests. Nature 2005, 435, 293. [Google Scholar] [CrossRef]
  103. Jadid, A.; Koplin, M.; Stephan, S.; Hering-Bertram, M.; Paelke, V.; Teschke, T.; Helmut, E. Express Yourself/City—Smart Participation Culture Technologies. In Smart Cities in the Mediterranean. Coping with Sustainability. Objectives in Small and Medium-sized Cities and Island Communities; Stratigea, A., Kyriakides, E., Nicolaides, C., Eds.; Springer: Berlin/Heidelberg, Germany, 2017. [Google Scholar]
  104. Adams, F.M.; Osgood, C.E. A Cross-Cultural Study of the Affective Meanings of Color. J. Cross Cult. Psychol. 1973, 4, 135–156. [Google Scholar] [CrossRef]
  105. Valdez, P.; Mehrabian, A. Effects of Color on Emotions. J. Exp. Psychol. Gen. 1994, 123, 394–409. [Google Scholar] [CrossRef] [PubMed]
  106. Petit, A.; Siret, D.; Simonnot, N. Capturing Chromatic Effects in Urban Environment. In Experiential Walks for Urban Design: Revealing, Representing, and Activating the Sensory Environment; Piga, B.E.A., Siret, D., Thibaud, J.-P., Eds.; Springer Tracts in Civil Engineering; Springer International Publishing: Cham, Switzerland, 2021; pp. 207–222. ISBN 978-3-030-76694-8. [Google Scholar]
  107. Manav, B. Color-Emotion Associations, Designing Color Schemes for Urban Environment-Architectural Settings. Color Res. Appl. 2017, 42, 631–640. [Google Scholar] [CrossRef]
  108. Palmer, S.E.; Schloss, K.B. An Ecological Valence Theory of Human Color Preference. Proc. Natl. Acad. Sci. USA 2010, 107, 8877–8882. [Google Scholar] [CrossRef] [PubMed] [Green Version]
  109. Armondi, S.; Bruzzese, A. Contemporary Production and Urban Change: The Case of Milan. J. Urban Technol. 2017, 24, 27–45. [Google Scholar] [CrossRef]
  110. Boros, J.; Mahmoud, I. Urban Design and the Role of Placemaking in Mainstreaming Nature-Based Solutions. Learning From the Biblioteca Degli Alberi Case Study in Milan. Front. Sustain. Cities 2021, 3, 38. [Google Scholar] [CrossRef]
  111. Denissen, J.J.A.; Butalid, L.; Penke, L.; van Aken, M.A.G. The Effects of Weather on Daily Mood: A Multilevel Approach. Emotion 2008, 8, 662–667. [Google Scholar] [CrossRef] [Green Version]
  112. Höppe, P. Different Aspects of Assessing Indoor and Outdoor Thermal Comfort. Energy Build. 2002, 34, 661–665. [Google Scholar] [CrossRef]
  113. Jendritzky, G.; de Dear, R.; Havenith, G. UTCI—Why Another Thermal Index? Int. J. Biometeorol. 2012, 56, 421–428. [Google Scholar] [CrossRef] [Green Version]
  114. Rouse, J.W.; Haas, R.; Deering, D.; Schell, J.; Harlan, J. Monitoring the Vernal Advancement and Retrogradation (Green Wave Effect) of Natural Vegetation; ScienceOpen, Inc.: Washington, DC, USA, 1974. [Google Scholar]
  115. Russell, J.A.; Pratt, G. A Description of the Affective Quality Attributed to Environments. J. Pers. Soc. Psychol. 1980, 38, 311–322. [Google Scholar] [CrossRef]
  116. Benedikt, M.L. To Take Hold of Space: Isovists and Isovist Fields. Environ. Plan. B Plan. Des. 1979, 6, 47–65. [Google Scholar] [CrossRef]
  117. Morariu, V.I.; Prasad, V.S.N.; Davis, L.S. Human Activity Understanding Using Visibility Context. IEEERSJ IROS Workshop Sens. Hum. Spat. Concepts FS2HSC 2007, 9, 1–8. [Google Scholar]
  118. Birant, D.; Kut, A. ST-DBSCAN: An Algorithm for Clustering Spatial–Temporal Data. Data Knowl. Eng. 2007, 60, 208–221. [Google Scholar] [CrossRef]
  119. Cheng, H.D.; Jiang, X.H.; Sun, Y.; Wang, J. Color Image Segmentation: Advances and Prospects. Pattern Recognit. 2001, 34, 2259–2281. [Google Scholar] [CrossRef]
  120. Fairchild, M.D. Color Appearance Models. In The Wiley-IS&T Series in Imaging Science and Technology, 3rd ed.; John Wiley & Sons, Inc.: Chichester, West Sussex, UK, 2013; ISBN 978-1-118-65309-8. [Google Scholar]
  121. Bunce, C. Correlation, Agreement, and Bland–Altman Analysis: Statistical Analysis of Method Comparison Studies. Am. J. Ophthalmol. 2009, 148, 4–6. [Google Scholar] [CrossRef]
  122. Giavarina, D. Understanding Bland Altman Analysis. Biochem. Medica 2015, 25, 141–151. [Google Scholar] [CrossRef] [Green Version]
  123. Elsadek, M.; Sayaka, S.; Fujii, E.; Koriesh, E.; Moghazy, E.; Fatah, Y.A.E. Human Emotional and Psycho-Physiological Responses to Plant Color Stimuli. J. Food Agric. Environ. 2013, 11, 1584–1591. [Google Scholar]
  124. Elsadek, M.; Sun, M.; Fujii, E. Psycho-Physiological Responses to Plant Variegation as Measured through Eye Movement, Self-Reported Emotion and Cerebral Activity. Indoor Built Environ. 2017, 26, 758–770. [Google Scholar] [CrossRef]
  125. Zhang, Y.; Hedo, R.; Rivera, A.; Rull, R.; Richardson, S.; Tu, X.M. Post Hoc Power Analysis: Is It an Informative and Meaningful Analysis? Gen. Psychiatry 2019, 32, e100069. [Google Scholar] [CrossRef] [Green Version]
  126. Feldman Barrett, L.; Russell, J.A. Independence and Bipolarity in the Structure of Current Affect. J. Pers. Soc. Psychol. 1998, 74, 967–984. [Google Scholar] [CrossRef]
  127. Gibson, J.J. The Theory of Affordances. In Perceiving, Acting and Knowing; Shaw, R., Bransford, J., Eds.; Lawrence Erlbaum Associates; distributed by the Halsted Press Division; Wiley: Hillsdale, NJ, USA; New York, NY, USA, 1977; ISBN 978-0-470-99014-8. [Google Scholar]
  128. Roe, J.; Aspinall, P. The Emotional Affordances of Forest Settings: An Investigation in Boys with Extreme Behavioural Problems. Landsc. Res. 2011, 36, 535–552. [Google Scholar] [CrossRef]
  129. Han, K.-T.; Ruan, L.-W. Effects of Indoor Plants on Self-Reported Perceptions: A Systemic Review. Sustainability 2019, 11, 4506. [Google Scholar] [CrossRef] [Green Version]
  130. Bringslimark, T.; Hartig, T.; Patil, G.G. The Psychological Benefits of Indoor Plants: A Critical Review of the Experimental Literature. J. Environ. Psychol. 2009, 29, 422–433. [Google Scholar] [CrossRef]
  131. Boffi, M.; Rainisio, N. To Be There, or Not to Be. Designing Subjective Urban Experiences. In Urban Design and Representation; Springer International Publishing: Cham, Switzerland, 2017; pp. 37–53. [Google Scholar]
  132. Piga, B.E.A. The Combined Use of Environmental and Experiential Simulations to Design and Evaluate Urban Transformations. In Quality of Life in Urban Landscapes; Cocci Grifoni, R., D’Onofrio, R., Sargolini, M., Eds.; The Urban Book Series; Springer: Cham, Switzerland, 2018; pp. 357–364. ISBN 978-3-319-65580-2. [Google Scholar]
  133. Sheppard, S.R.J. Guidance for Crystal Ball Gazers: Developing a Code of Ethics for Landscape Visualization. Landsc. Urban Plan. 2001, 54, 183–199. [Google Scholar] [CrossRef]
  134. Sheppard, S.R.J. Validity, Reliability and Ethics in Visualization. In Visualization in Landscape and Environmental Planning; Bishop, I.D., Lange, E., Eds.; Routledge—Taylor and Francis Group: New York, NY, USA, 2005; pp. 79–97. [Google Scholar]
  135. Boffi, M.; Rainisio, N.; Riva, E.; Inghilleri, P. Social Psychology of Flow: A Situated Framework for Optimal Experience. In Flow Experience. Empirical Research and Applications; Springer: Berlin, Germany, 2016. [Google Scholar]
Figure 1. Mean values on the cartesian plane described by the circumplex model for the PoVs assessed in Study 1 (PoVs A, B, C, and D) and Study 2 (PoVs 1, 2, and 3). Source: chart based on Russell’s circumplex model, elaboration by the authors.
Sustainability 13 13388 g001
Figure 2. The Porta-Romana district (Milan, Italy), with the isovists of the PoVs assessed in Study 1 (PoVs A, B, C, and D) and Study 2 (PoVs 1, 2, and 3), colored with the respective colors resulting from the affective state described by the circumplex model. Source: the authors.
Sustainability 13 13388 g002
Figure 3. Points of view: Study 1, PoV A-B-C-D (without the VITAE project); Study 2 PoV 1-2-3. Sources: PoV A-B-C-D, Google StreetView™; PoV 1-2-3, City Sense™ (in Augmented Reality mode) screenshots.
Sustainability 13 13388 g003
Figure 4. Analysis of the image of StreetView™ from via Giovanni Lorenzini (Milan)—PoV D—towards Fondazione Prada (existing condition: panoramic photo). Top-left, StreetView™ screenshot; bottom-left, lime areas identification (38° ≤ Hue < 53°, not depending on the saturation); top-right, the eight principal colors proportions; bottom-right, the proportions of the hues [Credits: the authors]. Sources: photo by Google StreetView™; color segmentation and charts by the authors.
Sustainability 13 13388 g004
Figure 5. Analysis of the AR view from via Vezza d’Oglio (Milan)—PoV 1—towards the VITAE project. From left to right: future condition: simulation in AR; lime areas identification (38° ≤ Hue < 53°, not depending on the saturation); the eight principal colors proportions; the proportions of the hues [Credits: the authors]. Sources: photo by Google StreetView™; color segmentation and charts by the authors.
Sustainability 13 13388 g005
Figure 6. Analysis of the AR view from via Condino (Milan)—PoV 2—towards the VITAE project (future condition: simulation in AR). From left to right: future condition: simulation in AR; lime areas identification (38° ≤ Hue < 53°, not depending on the saturation); the eight principal colors proportions; the proportions of the hues [Credits: the authors]. Sources: photo by Google StreetView™; color segmentation and charts by the authors.
Sustainability 13 13388 g006
Figure 7. Bland-Altman chart of Unpleasant and chromatic features resulting from the comparison of Study 1 and Study 2; dots with black border show correlations with high agreement and statistical significance, with grey border correlations with medium-high agreement but no sufficient statistical significance. Dashed lines are correlations clusters (DBSCAN): cluster A groups percentage area of low Lightness, saturation of high lightness areas, mean saturation of lime areas, weighted saturation of lime area, mean saturation green; cluster B groups mean green-red value, percentage of area covered in mean lightness pixel, high Lightness area (%). Source: the authors.
Sustainability 13 13388 g007
Table 1. Study 1 (VR) and Study 2 (AR) correlations’ matrix of chromatic features and emotions. The first four columns relate to single parameters, the last two columns relate to the two axes of Russell’s chart. Cells values are: orange r < −0.80 and p < 0.05; light orange r < −0.80 and p > 0.05; green r > 0.80 and p < 0.05; light green r > 0.80 and p > 0.05. Source: the authors.
Image FeaturesUnpleasantPleasantSleepinessArousalUnpleasant/Pleasant ContinuumDeactivation/Activation ContinuumBland-Altman Chart Annotation
Study 1 (VR)
CIELAB color space
Low Lightness area (%)−0.650.11−0.55−0.21−0.32−0.37[1]
High Lightness area (%)0.410.360.610.460.360.52[2]
Lightness mean (entire pic)0.65−0.060.580.240.320.39[3]
Mean lightness of neutral hues areas0.19−0.040.330.090.020.18[4]
Mean green-red0.860.460.680.650.790.69[5]
HSV color space
Mean saturation area (%)−0.180.62−0.020.350.230.19[6]
Low light pixel saturation−0.01−0.74−0.16−0.51−0.41−0.36[7]
High light pixel saturation−0.79−0.05−0.68−0.37−0.49−0.52[8]
LIME (HSV)
Lime pixel area (%)−0.98−0.45−0.87−0.71−0.83−0.80[9]
Mean saturation lime−0.84−0.15−0.62−0.44−0.62−0.54[10]
Weighted saturation lime−0.96−0.36−0.84−0.65−0.77−0.75[11]
GREEN (HSV)
Green pixel area (%)−0.89−0.36−0.70−0.59−0.75−0.67[12]
Mean saturation green−0.83−0.07−0.68−0.39−0.54−0.53[13]
Weighted saturation green−0.95−0.33−0.81−0.61−0.75−0.72[14]
Study 2 (AR)
CIELAB color space
Low Lightness area (%)−0.940.340.45−0.80−0.77−0.04[1]
High Lightness area (%)0.950.290.190.280.990.64[2]
Lightness mean (entire pic)0.990.09−0.020.470.970.46[3]
Mean lightness of neutral hues areas0.330.940.90−0.610.620.99[4]
Mean green-red0.97−0.24−0.350.730.840.15[5]
HSV color space
Mean saturation area (%)−0.990.110.22−0.64−0.90−0.28[6]
Low light pixel saturation0.790.610.52−0.080.950.87[7]
High light pixel saturation−0.970.270.37−0.75−0.82−0.12[8]
LIME (HSV)
Lime pixel area (%)−0.06−0.99−0.980.80−0.39−0.95[9]
Mean saturation lime−0.850.530.62−0.91−0.620.17[10]
Weighted saturation lime−0.99−0.100.01−0.46−0.97−0.47[11]
GREEN (HSV)
Green pixel area (%)0.30−0.96−0.980.96−0.04−0.77[12]
Mean saturation green−0.860.520.61−0.90−0.630.16[13]
Weighted saturation green0.26−0.97−0.990.95−0.08−0.80[14]
Table 2. Correlations’ difference between the two case studies. In light green: differences between −0.10 and 0.10 are considered strongly converging. Source: the authors.
Difference (Study 1–Study 2)
Image FeaturesUnpleasantPleasantSleepinessArousalUnpleasant/Pleasant ContinuumDeactivation/Activation Continuum
CIELAB color space
Low Lightness area (%)0.29−0.23−1.000.590.45−0.33
High Lightness area (%)−0.540.070.420.18−0.63−0.12
Mean Lightness area (%)−0.34−0.150.60−0.23−0.65−0.07
Mean lightness of neutral hues areas−0.14−0.98−0.570.70−0.60−0.81
Mean green-red−0.110.701.03−0.08−0.050.54
HSV color space
Mean saturation area (%)0.810.51−0.240.991.130.47
Low light pixel saturation−0.80−1.35−0.68−0.43−1.36−1.23
High light pixel saturation0.18−0.32−1.050.380.33−0.40
LIME (HSV)
Lime pixel area (%)−0.920.540.11−1.51−0.440.15
Mean saturation lime0.01−0.68−1.240.470.00−0.71
Weighted saturation lime0.03−0.26−0.85−0.190.20−0.28
GREEN (HSV)
Green pixel area (%)−1.190.600.28−1.55−0.710.10
Mean saturation green0.03−0.59−1.290.510.09−0.69
Weighted saturation green−1.210.640.18−1.56−0.670.08
Standard deviation0.590.650.750.860.630.50
Mean (distance from equality)−0.28−0.11−0.31−0.12−0.21−0.24
Standard error0.160.170.200.230.170.13
Confidence0.340.380.430.500.370.29
Confidence—lower limit mean−0.62−0.48−0.74−0.62−0.57−0.53
Confidence—upper limit mean0.060.270.120.370.160.05
Table 3. Correlations mean of the two case studies. In light green: means lower than −0.75 or higher than 0.75 are considered strongly converging. Source: the authors.
Mean [(Study 1 + Study 2)/2]
Image FeaturesUnpleasantPleasantSleepinessArousalUnpleasant/Pleasant ContinuumDeactivation/Activation Continuum
CIELAB color space
Low Lightness area (%)−0.800.23−0.05−0.51−0.55−0.21
High Lightness area (%)0.680.330.400.370.680.58
Mean Lightness area (%)0.820.020.280.360.650.43
Mean lightness of neutral hues areas0.260.450.62−0.260.320.59
Mean green-red0.920.110.170.690.820.42
HSV color space
Mean saturation area (%)−0.590.370.10−0.15−0.34−0.05
Low light pixel saturation0.39−0.070.18−0.300.270.26
High light pixel saturation−0.880.11−0.16−0.56−0.66−0.32
LIME (HSV)
Lime pixel area (%)−0.52−0.72−0.930.05−0.61−0.88
Mean saturation lime−0.850.190.00−0.68−0.62−0.19
Weighted saturation lime−0.98−0.23−0.42−0.56−0.87−0.61
GREEN (HSV)
Green pixel area (%)−0.30−0.66−0.840.19−0.40−0.72
Mean saturation green−0.850.23−0.04−0.65−0.59−0.19
Weighted saturation green−0.35−0.65−0.900.17−0.42−0.76
Table 4. The inclusion of the agreement values of Study 1 and Study 2 within the mean confidence interval of the Bland-Altman chart. Cells with bold borders relate to a significant correlation in at least one case Study; correlations outside the confidence interval are not considered for significance. Source: the authors.
Study 1 and Study 2 Correlations within the Mean Confidence Interval
Image FeaturesUnpleasantPleasantSleepinessArousalUnpleasant/Pleasant ContinuumDeactivation/Activation Continuum
CIELAB color space
Low Lightness area (%)OUTINOUTOUTOUTIN
High Lightness area (%)ININOUTINOUTIN
Mean Lightness area (%)ININOUTINOUTIN
Mean lightness of neutral hues areasINOUTINOUTOUTOUT
Mean green-redININOUTININOUT
HSV color space
Mean saturation area (%)OUTININOUTOUTOUT
Low light pixel saturationOUTOUTININOUTOUT
High light pixel saturationOUTINOUTOUTOUTIN
LIME (HSV)
Lime pixel area (%)OUTININOUTINOUT
Mean saturation limeINOUTOUTOUTINOUT
Weighted saturation limeININOUTINOUTIN
GREEN (HSV)
Green pixel area (%)OUTINOUTOUTOUTOUT
Mean saturation greenINOUTOUTOUTINOUT
Weighted saturation greenOUTINOUTOUTOUTOUT
Table 5. Level of agreement of Study 1 and Study 2 based on mean correlation and inclusion within the mean confidence interval. Cells with bold borders relate to significant correlation in at least one case study; correlation with low or medium agreement is not considered for significance. Source: the authors.
Level of Agreement Between Study 1 (VR) And Study 2 (AR)
Image FeaturesUnpleasantPleasantSleepinessArousalUnpleasant/Pleasant ContinuumDeactivation/Activation Continuum
CIELAB color space
Low Lightness area (%)MED.LOWLOWLOWLOWLOW
High Lightness area (%)LOWLOWLOWLOWLOWLOW
Mean Lightness area (%)HIGHLOWLOWLOWLOWLOW
Mean lightness of neutral hues areasLOWLOWLOWLOWLOWLOW
Mean green-redHIGHLOWLOWLOWHIGHLOW
HSV color space
Mean saturation area (%)LOWLOWLOWLOWLOWLOW
Low light pixel saturationLOWLOWLOWLOWLOWLOW
High light pixel saturationMED.LOWLOWLOWLOWLOW
LIME (HSV)
Lime pixel area (%)LOWLOWHIGHLOWLOWMED.
Mean saturation limeHIGHLOWLOWLOWLOWLOW
Weighted saturation limeHIGHLOWLOWLOWMED.LOW
GREEN (HSV)
Green pixel area (%)LOWLOWMED.LOWLOWLOW
Mean saturation greenHIGHLOWLOWLOWLOWLOW
Weighted saturation greenLOWLOWMED.LOWLOWMED.
Publisher’s Note: MDPI stays neutral with regard to jurisdictional claims in published maps and institutional affiliations.

