Article

The Pedospheric Variation of DTPA-Extractable Zn, Fe, Mn, Cu and Other Physicochemical Characteristics in Major Soil Orders in Existing Land Use Systems of Punjab, India

1
Department of Soil Science, Punjab Agricultural University, Ludhiana 141027, India
2
Indian Institute of Soil Science, Bhopal 462038, India
3
Department of Agronomy, Bangladesh Wheat and Maize Research Institute, Dinajpur 5200, Bangladesh
4
Department of Chemistry, College of Science, Taif University, P.O. Box 11099, Taif 21944, Saudi Arabia
5
Department of Biology, College of Science, Taif University, P.O. Box 11099, Taif 21944, Saudi Arabia
6
Department of Science and Technology, University College-Ranyah, Taif University, P.O. Box 11099, Taif 21944, Saudi Arabia
*
Authors to whom correspondence should be addressed.
Submission received: 18 November 2021 / Revised: 14 December 2021 / Accepted: 17 December 2021 / Published: 21 December 2021
(This article belongs to the Special Issue Soil Health Restoration and Environmental Management)

Abstract

:
The agricultural production in Punjab has increased manifold that aggravated the deficiencies of micronutrients in soils and plants. The availability of soil micronutrients in different soil orders depends upon the soil mineralogy, topography, climatic conditions and cropping sequences. Hence, to study the pedospheric variations of DTPA-extractable micronutrients, viz., zinc (Zn), iron (Fe), manganese (Mn) and copper (Cu), in three prominent soil orders of Punjab, a total of 144 depth-wise soil samples were collected from four major land-use systems (cultivated, horticulture, forest and pasture lands). The DTPA extractable micronutrients varied from 1.74–2.81, 1.83–2.82 and 1.81–2.80 for Zn; 5.3–6.8, 5.6–6.9, 4.3–6.3 for Fe; 5.1–7.8, 5.5–7.9, 5.4–7.5 for Mn; and 0.84–1.40, 0.93–1.68, 0.87–1.65 for Cu in soil orders Aridisol, Entisol and Inceptisol, respectively. The average content of DTPA-extractable micronutrients was highest under soil order Entisol followed by Inceptisol and Aridisol. The content of micronutrients showed a declining trend with increase in soil depth in all orders. Among different soil properties, the pH and EC showed significantly negative correlation, however, OC had non-significant correlation with DTPA-extractable micronutrients in soils. Therefore, it is concluded that parent material, land use systems and soil depth affected the distribution of DTPA extractable micronutrients in different soil orders.

1. Introduction

Micronutrient deficiencies in crops are gaining attention, owing to the adoption of high-yielding varieties, exhaustive cropping, improved crop yield, enhanced usage of high analysis fertilizers and lesser utilization of crop residues, animal manures and composts [1]. The deficiency of micronutrients employed a significant setback on the performance of crops in terms of food grain production, therefore showing an impact on the food chain [2]. Nevertheless, the spatial variability in micronutrient deficiencies is resulting in major nutritional constraints affecting more than 2 billion people on regional and global scales [3]. The availability of micronutrients showed a wide range of spatial variability in soils of diverse orders with differentiated soil texture, cropping sequences, geo-morphologies and farming systems [4]. The distribution of micronutrients is predominantly directed by the variation in topography, climatic conditions and soil development factors and processes that alter and soil pH, organic matter content in soils, complexation with natural organic chelates and redox reactions in soils, which affect nutrient availability in soils [5]. Similarly, the availability of soil micronutrients also depends on the topographical positions, soil development rates and the climatic conditions of the area under consideration [6].
In the soil profile, the decline in the acquisition of micronutrients is associated with reckless exhaustion by crops [7]. The variability in the distribution of micronutrients in soils is controlled by factors including the nature of metal ions and physical, chemical and mineralogical properties of soil [5]. The research studies by researchers concluded the positive correlation of organic carbon but a negative correlation of soil pH with Zn, Cu, Fe and Mn availability in soils [8,9,10].
The spatial variability in soil orders of Punjab, including Entisols, Inceptisols and Aridisols, have been reported to affect the micronutrient availability to crops. Among these soil orders, Inceptisols comprise soils with modified parent materials but possessing very little horizon development as a result of variability in soil-forming processes [11]. From the past three decades, the production in the agriculture sector has augmented in Punjab, but the intensification in productivity is being constrained to the Inceptisols, which cover about 60% of state geographical area [7]. Similarly, Entisols are the soils without any development in soil horizons of the profile while, in Aridisols, the soils belong to arid and semi-arid areas with the accumulation of salts on the surface and a profile leading to the development of a gypsic, salic or calcic horizon [12]. The occurrence of these soils is restricted to the western and northwestern parts of India [13]. In general, the soils of Aridisols are poor in organic matter (OM) with a decline in soil quality traits (physical, chemical and biological), resulting in low crop yields [12].
Soil taxonomy is related directly to the availability of micronutrients in soils [14,15]. The higher concentration of micronutrients in the Entisols and Inceptisols orders is ascribed to the finer texture of the parent materials comparative to the content in soils of Aridisols [11]. Another study indicated that the highest availability of micronutrients was detected in Inceptisols, while the least was determined in soils belonging to Aridisols [5]. The availability of micronutrients has been observed to be higher in Inceptisols than Entisols and Aridisols in the soils of Ethiopia [15]. Regarding the distribution of micronutrients, a report by concluding that their availability is in the following order: Inceptisols > Entisols > Aridisols in soils of Florida [16]. The prediction of soil micronutrient availability using soil survey maps can be achieved by creating the relationships between properties of soil (soil order, climatic condition, topography) and micronutrient distribution in soil [5].
To date, most of the studies focused on correlating diethylene triamine penta acetic acid (DTPA) extractable micronutrients with soil properties [11,17], but fewer experiments have relied on the interrelationship between the soil properties of profile and micronutrient distribution in benchmark profiles of the Aridisols, Entisols and Inceptisols of Punjab. Therefore, this experiment fulfils the gap of the information regarding the acknowledgement of available micronutrient forms in the soil profile of three distinct soil orders: Inceptisols, Entisols and Aridisols and their relationship with different aspects following soil progress, environmental factors, topography and taxonomic classes that resulted in the prediction of elemental behavior and status in similar soils.
Hence, the main objective of the current study was to generate information regarding the distribution of micronutrients in the soil profile of three dominant soil orders and their plant availability acting as the guide for their applications to the crops resulting in the sustainability of the soil with crop productivity in northwestern India.

2. Materials and Methods

2.1. Geomorphology and Climate

The Punjab state is located between 73°53′ and 76°55′ E and 29°33′ and 32°31′ N in the northwest part of India, covering an area of about 50,376 km2. It is situated about 180 to 660 m above the mean sea level [18]. The dominant soils in the state are alluvial plains and undulating Shivalik foothills with udic, ustic and aridic moisture regimes in the northern, central and southern parts of the state, respectively. The dominant soil orders in northern and central parts are Inceptisols and Entisols while the southern parts are Aridisols.

2.2. Site Selection and Sampling

For investigation of the distribution of DTPA-extractable micronutrients, a total of 144 soil samples were collected from soil profile (0–100 cm) of 4 different physiographic units (forest, cultivated, horticulture and barren land use) of 3 prominent soil orders, i.e., Inceptisols, Entisols and Ardisols from 5 locations (Bathinda, Ludhiana, SBS Nagar, Tarantarn and Gurdaspur) of Punjab State (Figure 1). The soil samples have been collected from six depths i.e., 0–10, 10–20, 20–40, 40–60, 60–80 and 80–100 cm. Physiographic details of soil samples collected from different horizons of the pedons for estimation of soil properties (pH, EC, OC, available P, K) and DTPA-extractable micronutrients (Zn, Fe, Mn, Cu) are depicted in Table 1. Soil samples were air-dried, ground thoroughly using mortar and pestle, sieved through 2.0 mm sieve and stored for analysis of soil pH, organic carbon (OC) content, electrical conductivity (EC) (1:2 soil/water), calcium carbonate and DTPA-extractable Zn, Cu, Fe and Mn by following the standard methods of determination [18].

2.3. Experimental Design and Physicochemical Analysis

The factorial randomized block design (RBD) was used in the study to compare different treatments. The analysis was carried out using the diethylene triamine penta acetic acid (DTPA) as an extractant for the determination of micronutrient cations. Different soil chemical properties were determined using following methods. The soil pH was estimated from soil suspension with water in ratio (1:2) and was determined by using a glass electrode pH meter (Elico, LI-120, Hyderabad, India). The EC was determined after keeping the same supernatant solution at equilibration for 24 h using a conductivity bridge (Elico, CM-183, Hyderabad, India) [19]. Soil organic carbon (SOC) was determined from soil samples using potassium dichromate rapid titration method with diphenylamine indicator [20]. The available P in soil was extracted by the molybdenum blue procedure using sodium bicarbonate, hydrochloric acid and ammonium fluoride with its estimation using a spectrophotometer at 760 nm wavelength [21]. For estimation of available K the soil was extracted using neutral normal ammonium acetate and quantified using flame photometer [22]. The method used for determination of soil particles distribution was the international pipette method [23]. The calcium carbonate content was estimated by titration of soil suspension with 0.5 N H2SO4 in presence of bromothymol blue and bromocresol green indicators [24]. For determination of available micronutrients, viz., Zn, Fe, Mn and Cu, the soil samples of 10 g soil (2-mm sieved) were extracted with 20 mL of DTPA (0.005 M DTPA + 0.1 M CaCl2 + 0.1 M triethanolamine, with pH 7.30) and estimated using atomic absorption spectrophotometer (Varian AAS FS240 Model, Varian, Inc., Palo Alto, IL, USA) [25].

2.4. Statistical Analysis

The two-way analysis of variance (ANOVA) was used for the statistical analysis. This resulted in determining the relationship of variable chemical soil properties with DTPA micronutrient content in soil regarding the change in soil orders and profile depth, at p ≤ 0.05 level of significance. The significant difference among the soil samples was checked using Tukey’s multiple comparison test with IBM SPSS statistics using SPSS version 16.0 (SPSS Inc., Chicago, IL, USA) packages.

3. Results and Discussion

3.1. Variation in Soil Physicochemical Properties

The variation in the physicochemical properties of the soils as a function of soil order in the profiles of different land-use systems are discussed in the following sub-headings.

3.1.1. Soil pH

The physicochemical properties of the soil profile belonging to different soil orders under different land-use systems indicated that the pH of soils mostly falls between the neutral to nearly alkaline range (7.4 to 7.8) (Figure 2).
The effect of soil orders and profile depth on soil pH was reported to be significant. The higher soil pH was under the order of Aridisol compared to other soil orders that correspond to a greater concentration of base-forming cations in these soils added through fertilizers and chemical amendments added in soils. However, a comparatively lower pH of about 7.4 was recorded under Entisols and Inceptisols, and that might be due to the continuous addition of organic matter in these soils through crop residues and leaf litter from forest land-use system and also due to the release of weak organic acids with litter decomposition [26]. A similar trend of soil pH has been reported by different research works [27,28]. Regardless of the soil orders, the soil pH among the profiles was observed to increase with depth. The gradual increase in soil pH with depth under all systems is due to the leaching of bases and salts to the deeper layer of soils [29,30]. A similar trend of an increase in soil pH with depth has already been reported in the literature [31]. Similarly, the pH in the soil profile varied among different soil orders with the peak values observed in Aridisol (7.62–7.89) followed by almost similar pH in soils of Entisol and Inceptisol (7.61–7.84). The higher pH of Aridisol might be due to low moisture content leading to accumulation of salts resulting in higher pH. Thus, soil pH has been influenced by various factors including depth, climatic variations (temperature and moisture) and weathering regimes, as well as land-use systems.

3.1.2. Soil EC

The distribution pattern of EC in profiles of different soil orders under variable land-use systems is depicted in Figure 2. The EC in soils showed significant change with the increase in the soil depth. Among the different soil orders, the maximum EC (0.23 dS m−1) was observed in the profile of order Aridisol while the minimum (0.17 dS m−1) was under soil order Inceptisol. The greater EC under Aridisol may be due to its higher evaporation, leading to the deposition of soluble salts [32]. The higher EC under Aridisols might primarily be also due to greater accumulation of salts in soils [1].
Irrespective of soil orders, the EC distribution among soil profiles did not follow a particular pattern, but it showed a subsequent decline with an increase in depth. A similar trend showing a decrease in EC with depth under all land uses was observed [29,33]. The higher EC on the surface layer was due to the higher amount of nutrient ions at the surface, and with the decrease in nutrient ions with depth, the EC decreased [34].

3.1.3. Soil Organic Carbon (SOC)

The data showed that soil depth showed a significant effect on OC content in soils, whereas non-significant variation was observed with soil orders (Figure 2). Comparing the content of SOC among soil orders, the highest content with an increase of 17.8% was under Inceptisol over Aridisol soils. The highest OC in Inceptisol might be due to due to exogeneous supply of organic matter through leaf litter and crop residues (roots, stubbles), whereas the lowest content under Aridisol corresponds to the higher salt and calcareous nature of soil with poor vegetation and the existence of the erosion effect prevalent on these areas, leading to the lower status of OC in these soils [26]. Moreover, the low level of SOC in Aridisol may be the result of continuous and intensive cultivation and other agricultural work that increased the mineralization of organic residues combined with the activity of soil microorganisms [27,34,35].
The lower content of OC in Aridisols might also be due to reduced biological activity, resulting in the declined rate of OM addition corresponding to existing arid conditions [32]. However, higher OC in soils of Entisols and Inceptisols was attributed to appropriate availability of moisture that resulted in the better growth of vegetation. These soils thus possess greater organic residues and hence a comparatively higher amount of OC in soil [36]. Apart from that, the high intensity and duration of rainfall accompanied by lower temperature favor the higher OC in soil [11]. Thus, the drainage systems in variable land-use systems along with the depth of the soil sample significantly contributed towards the variation. Irrespective of the land use, the highest OC content was observed at the surface due to the deposition of litter and organic residues and that decreased with depth [37]. A similar trend of a decrease in the OC content of soil with depth was reported [38].

3.1.4. Available P in Soils Profile

Available P distributed in the soil profile of different land-use systems under different soil orders is presented in Figure 2. A significant effect of soil order and depth were reported on the distribution of available P in soils. On comparison of the available P distributed among different orders, the highest content with an increase of 1.4 times occurs under Inceptisols over Aridisols. The distribution of available P under different soil orders was Inceptisol > Entisol > Aridisol. The pattern of available P distribution among different soil orders varied, with the highest content under Inceptisol (16.49–23.57 kg ha−1) and the least under Aridisol (8.83–18.93 kg ha−1) at different soil depths. The greater content of available P under Inceptisol corresponds to the continuous supply of nutrients through organic matter and fertilizers added to soils [27]. Factors including soil amendments, cultivation practices and weathering conditions played a significant role in the variable P content in different soil orders under different land-use systems. The variability in the available nutrients is also associated with changes in microbial activity, which affects the release of labile-organic compounds and nutrients in soil [39]. Similar results were presented by [27,37]. However, the decline in other Aridisols might be relative to intensive cultivation, resulting in the continuous exclusion of crop residues and thereby leading to a nutrient decline in soil [40,41]. The content of P decreased with the increasing depth in the soil profile, and that might be due to its greater release relative to the greater accumulation of organic matter in the surface soil [29]. Similar results reported the decrease in phosphorus contents over different depths [42].

3.1.5. Available K in the Soil Profile

The results showing the trend of the available K distribution in the soil profiles of different soil orders are depicted in Figure 2. A significant effect of soil order and depth was reported on the distribution of the available K in soils. The trend of the available K distribution showed that the highest available K, depicting an increase of 1.9-fold, was reported in the soil profile of Inceptisol compared to Aridisol. The order of distribution of available K was as follows: Inceptisol > Entisol > Aridisol. The greater content of available K under Inceptisol under forest land-use system corresponds to the governance of K-rich minerals and also the addition of OM that helped in the replenishment of nutrient status in soil [36]. Similarly, a higher level of available K was observed by researchers, which were probably due to the enrichment of soil with organic matter through plant residue and the addition of animal manures [26]. The stronger correlation of OM with pH and available nutrients might correspond to the higher level of available K in soil [43]. Thus, various factors including depth, soil amendments and climatic conditions under different land-use systems contributed towards the enhanced level of available K content of soils. The highest content of K in the surface layer was associated with a continuous decrease in the content and addition of organic matter in soils [31]. Our results are in line with the findings of some works [44,45].

3.1.6. Soil Texture and Calcium Carbonate

The variability in soil texture and calcium carbonate in the profiles of variable soil orders is presented in Table 2. The results demonstrate that there was variation in soil texture among the soil profiles of different orders, with higher sand (77%) under Aridisol, followed by 61.4 per cent in Entisol and 60.4 per cent in Inceptisol. The variability in texture under soil orders showed that it was finest in Inceptisol, followed by Entisol and the least in Aridisol. The greater clay content was observed in Entisol and Inceptisol soil orders, and that might be due to the higher stratified nature of these soils [1]. Soils under Entisol possess a finer texture, i.e., higher clay around 19 per cent that corresponds to more organic matter addition and higher microbial activity, thereby improving soil fertility and more productivity as compared to undisturbed land-use systems [26]. The location change showed the difference in soil texture due to pedogenic variation in soil orders under different land-use systems. However, the profile distribution of particle size indicated that all fractions, i.e., sand, silt and clay, did not follow any specific pattern. Similarly, the results in Table 2 also predicted that there was variability in calcium carbonate with the soil profile of all orders. Variability in calcium carbonate indicated that it was highest (6.1%) under Ardisols (calcareous), followed by 4.9% under Entisol and Inceptisol and being non-calcareous in nature. However, the depth-wise distribution of calcium carbonate did not follow any trend in soils.

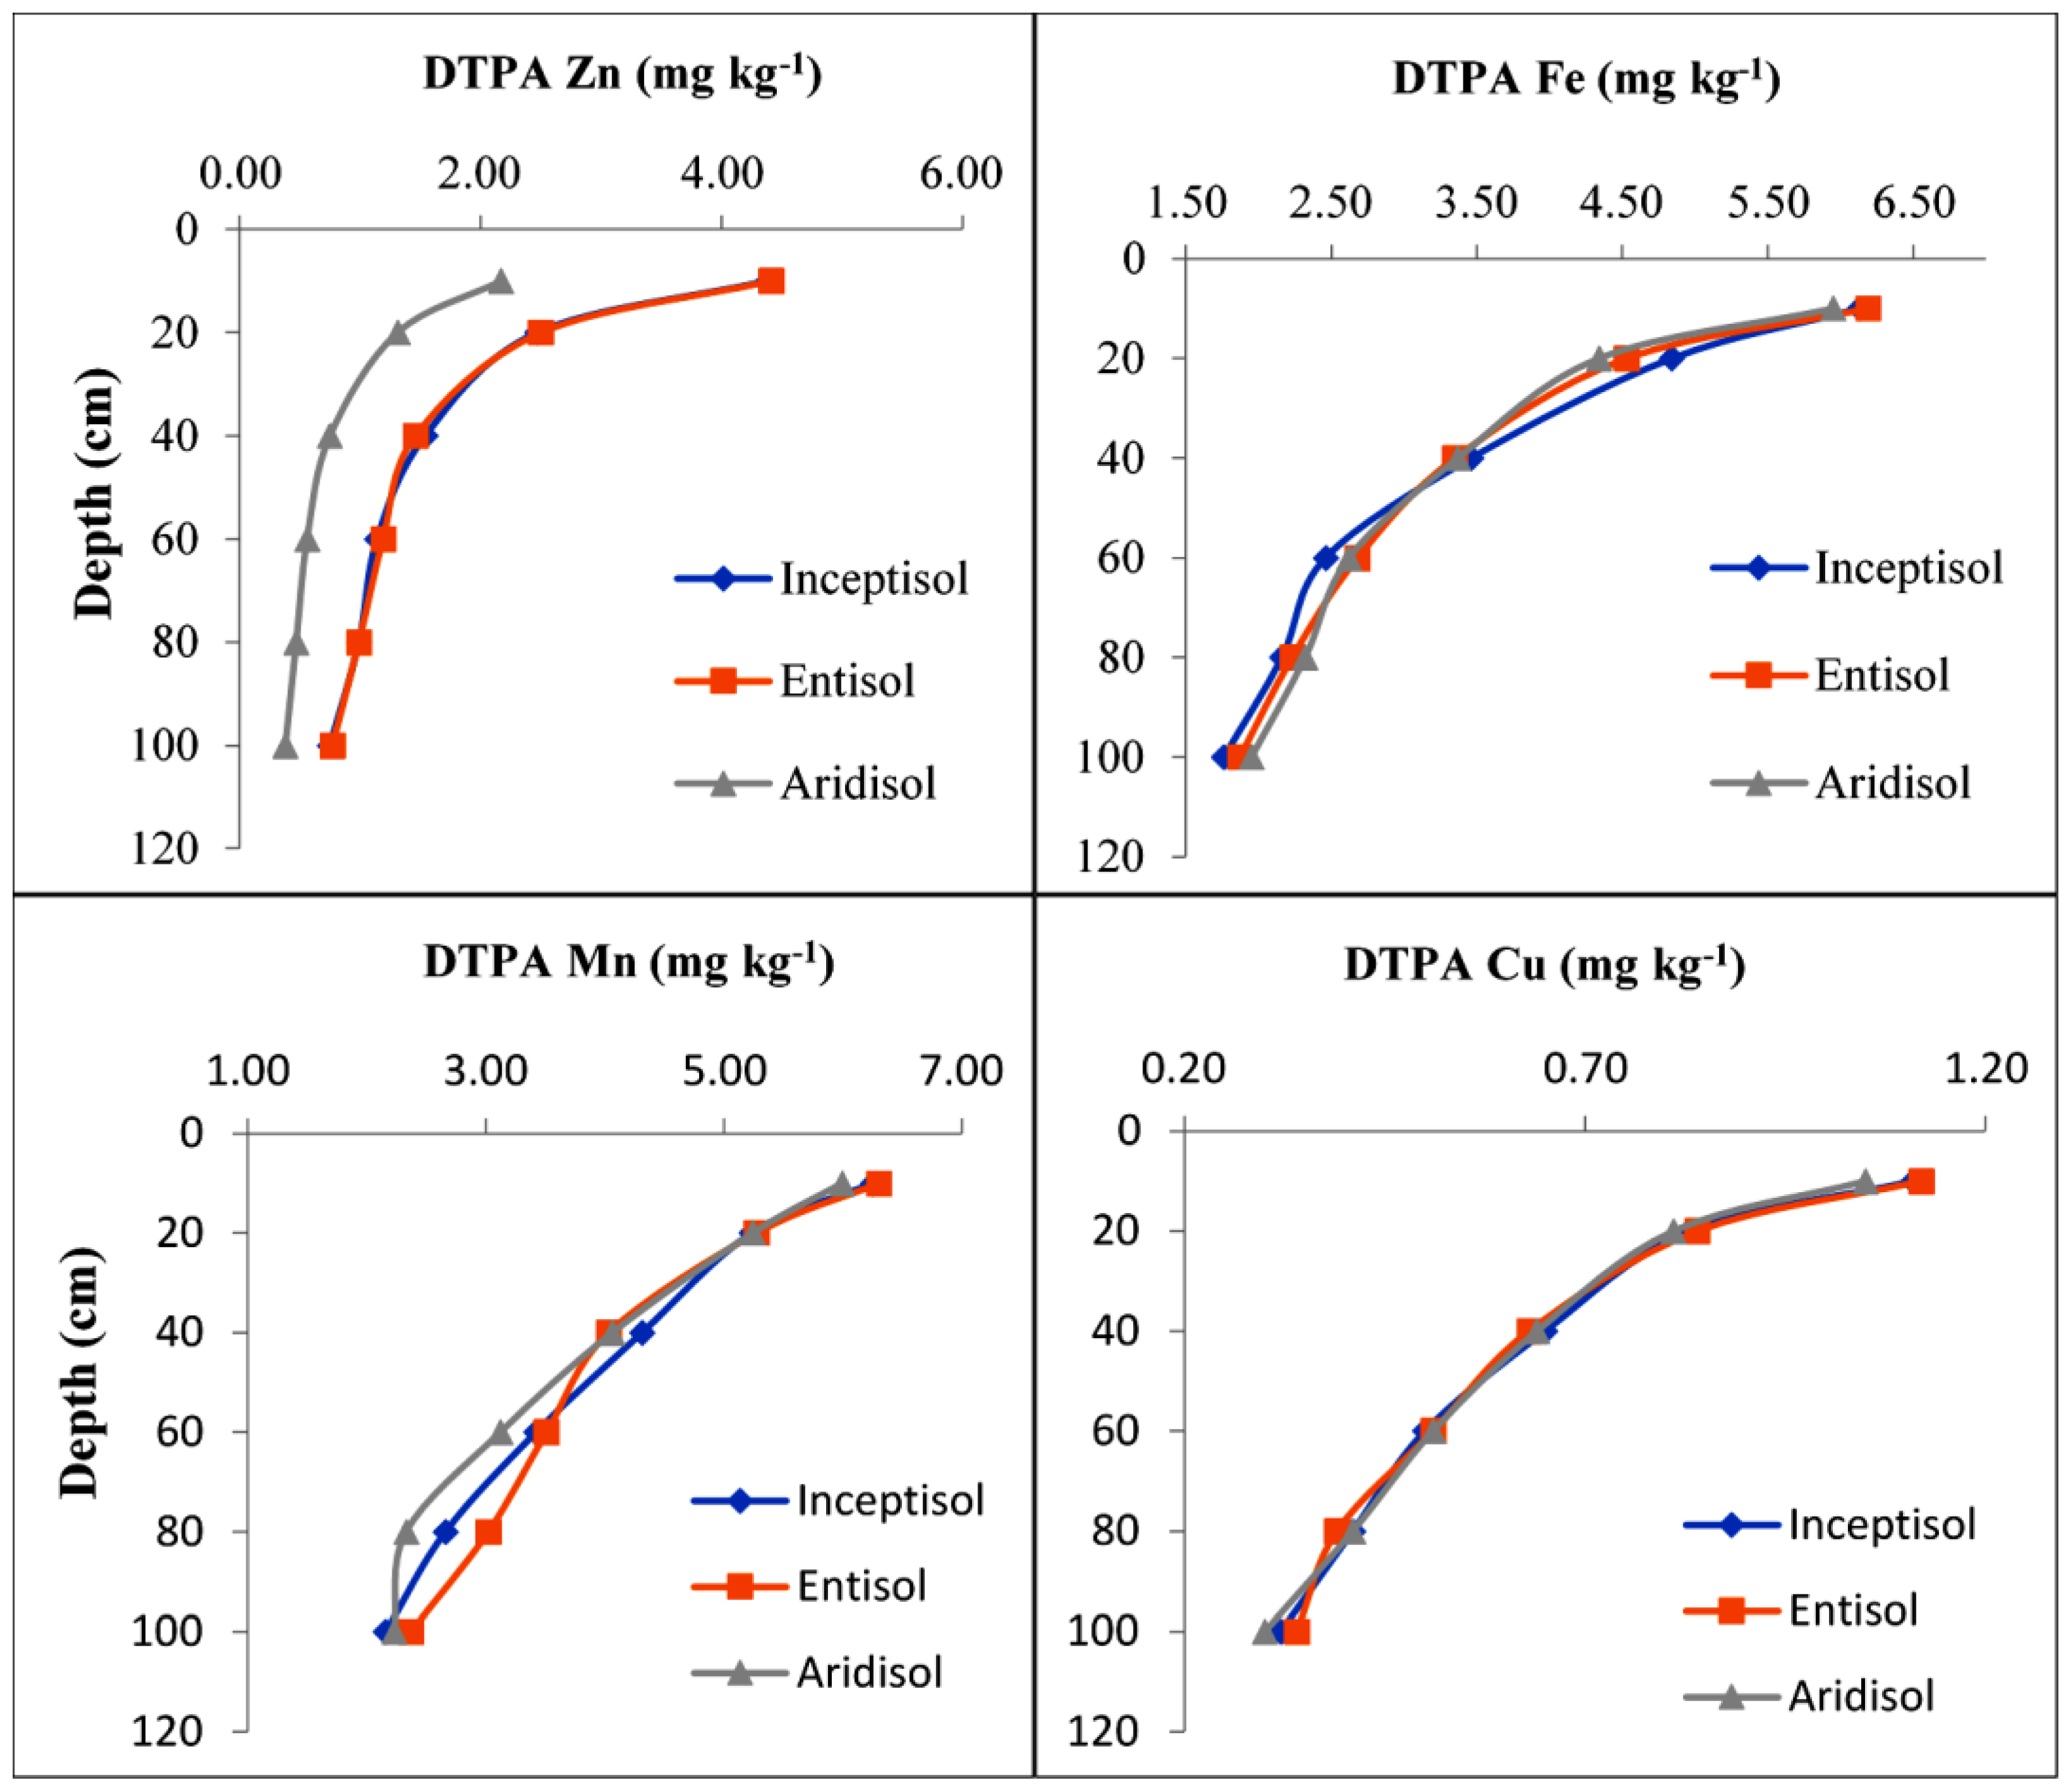
3.2. Variation in DTPA-Extractable Zn, Cu, Fe and Mn Cations

3.2.1. DTPA-Extractable Zinc (Zn)

The DTPA-extractable Zn distributed in the soil profiles of different land-use systems under different soil orders is depicted in Figure 3.
A significant effect of soil order, depth and its interactions were reported with DTPA- extractable Zn in soils. The content of Zn was higher in the surface horizon compared to sub-surface soil horizons, which might be due to a higher rate of addition and decomposition of organic matter, leading to the release of more nutrients into the soils. The content of Zn showed a decline in profile layers that might be relative to a decrease in the accumulation of organic matter content in the sub-surface soil [29]. Similar results reported the decrease in extractable Zn contents over different depths [30,45].
Distribution of DTPA-Zn under variable soil orders followed the trend of Entisol > Inceptisol > Aridisol. The greater contents under Entisol and Inceptisol correspond to the addition and recycling of Zn through the accumulation and decomposition of organic residues added to the soil in the form of litter and root residues, leading to increased microbial activity in the soil and thereby facilitating the release of micronutrients in the soils [42,46]. The lower Zn content under Aridisol might be due to exhaustive cultivation leading to continuous crop removal and nutrient decline in the soil [47]. It is also relative to fact that changes in land use alter the quantity of inputs in the form of crop residues, along with the application of lime that enhanced the pH of soils, thereby decreasing soluble forms of Zn and their availability in soils [48]. Similar results were presented by [27,37]. Similarly, the availability of Zn and other micronutrients is directly associated with the pH of the soil as it governs the chemical forms of soil-resident compounds [49]. The greater Zn content in the Entisols and Inceptisols compared to other orders might also be due to its finer texture along with the variation in the forms of their parent materials [11,17]. The concentration of Zn is also related to the drainage system of the soil, with higher contents occurring in poorly drained soils with fine textures, as in Entisol and Inceptisols [36].
In general, the greater Zn content in the soils of Inceptisol corresponds to the comparatively greater content of organic matter added in the piedmont compared to alluvial plain soils [11]. However, the poor status of Zn in soils of the Aridisols is ascribed to a lesser release owing to the excess presence of calcium carbonate (CaCO3) particles, leading to complexation and leaching of Zn, and its lower renewal, corresponding to highly reduced OM content (generally < 1%) in soils [50,51]. Apart from that, the increased availability of micronutrients in these soils corresponds to the reduced pH with the presence of organic acids that solubilized the micronutrients in soils. Similar results were reported by some works [5,52]. Similar results of higher Zn content in Inceptisols have been reported in the literature [7]. Thus, Zn availability was influenced by the accumulation of organic matter content, cultivation practices and parent material and drainage systems.

3.2.2. DTPA-Extractable Iron (Fe)

The distribution pattern of DTPA-extract Fe distributed in the soil profile of different land-use systems under different soil orders is depicted in Figure 3. The effect of soil order was non-significant, while that of depth was significant on the content of DTPA-Fe in the soil profiles of different soil orders. The content of Fe showed a decline with increasing depth in the soil profile. The relatively greater amount of extractable Fe in surface soil layers was associated with their greater content of organic matter in soils [31]. The results of our study were also in accordance with the findings of other researchers [40,41]. The peak content of DTPA-Fe among different soil orders was under Entisols, and that corresponds to an increase in the availability of organic Fe fractions of Fe in these soils comprising of greater OM content. The greater Fe content might also be due to the greater addition of organic residues that enhanced soil aeration, supplied chelating agents and prevented the precipitation and oxidation of Fe, thus increasing the availability of micronutrients in soils [46,47]. The variation may also relate to other aspects such as the variations in Fe containing minerals or the extraction efficiency of variable chemical extractants. The pattern of DTPA-Fe’s distribution in the soil profiles among different soil orders was observed to be highest under Entisol, with an increase of 2.01-fold over Aridisol. Similar results with higher contents of available Fe in Inceptisols than that in Entisols and Aridisols have been reported [5,9,11].
Commonly, the most dominant parameters affecting Fe availability include changes in pH and redox potential leading to the precipitation–dissolution of Fe. In addition, the presence of organic compounds resulted in the adsorption–desorption and complexation of Fe, thus increasing its availability. The higher status of Fe availability in Inceptisols might correspond to higher fractions of organic matter and finer texture (clay) that assisted in the solubilization of Fe via conversion from oxidized form (Fe3+) to reduced form (Fe2+) [5]. Moreover, other factors that control the availability of Fe include soil temperature and moisture regimes with the highest content in (Inceptisols), exhibiting mesic temperature and aquic moisture regimes, while least occurred in Aridisols, having hyperthermic temperatures and aridic moisture regimes [5,7]. The higher content of Fe in Inceptisols is also attributed to the finer texture with higher organic matter content that helps in increasing the exchange sites and thereby the capacity for sorption and the availability of micronutrients [5]. The parent material along with soil formation processes significantly affects the mobility and availability of micronutrients in soils [53]. The higher content of micronutrients (Fe) in Inceptisols is attributed to the greater precipitation resulting in the formation of well-developed pedons [54]. The lower Fe content in Aridisols is relative to the absence of Fe comprising minerals such as ferromagnesium silicates, Fe oxides, hydroxides and oxyhydroxide [11,55]. The comparatively poor content of available Fe in soils belonging to Entisols and Aridisols was possibly the outcome of a greater fixation of Fe by the higher calcium carbonate content of soils [56].

3.2.3. DTPA-Extractable Manganese (Mn)

The trend of DTPA-Mn distributed in soil profiles of different soil orders is presented in Figure 3. While determining the effect of soil depth on Mn content, it was observed that the highest Mn was reported in the surface soil layer with the significant subsequent decline in its content with increasing soil depth to least in the deepest (80–100 cm) soil layer. The decrease in the content of Mn with the increasing soil depth corresponds to its fixation by high carbonate contents existing in deeper layers and also due to the dilution effect leading to reduced availability in soils [31]. Our results are in line with the findings that reported the decrease in extractable micronutrient contents over different depths [30,45].
The pattern of DTPA-Mn distribution among soil orders was Entisol > Inceptisol > Aridisol. Variation in micronutrients availability in the soil order varies with changes in pH, organic matter, clay adsorption and immobilization in fractions of organic matter in soils [57,58]. Overall, the highest Mn content (4.10 mg kg−1) was under Entisols, while the least (3.82 mg kg−1) was under Aridisol. The higher Mn content might be related to the higher status of organic residues in soils of Entisol that results in the protection of micronutrients against the oxidation and precipitation into bound forms and also supply soluble chelating agents for the solubilization of micronutrients [27,37]. The greater content of Mn under Entisols and Inceptisols might be relative to the sensitivity of Mn to change to a reduced state from an oxidized state, or vice versa, with variations in soil temperatures and moisture regimes that enlighten the wide variability in DTPA-Mn among different groups of soils [11]. Apart from that variation in topography, the climatic conditions and soil development that control the soil properties. viz., pH, OC and soil texture, act as active factors in altering the distribution and availability of micronutrients in soils [5]. The distribution of Mn is controlled by parent material along with soil formation processes, with an increase in Mn content being related to finer textures along with greater contents of organic carbon in soils [52,53]. The maximum micronutrients in soils have been observed with the high status of OC and finer texture with the dominance of clay [59].

3.2.4. DTPA-Extractable Copper (Cu)

The profile distribution pattern of DTPA-extractable Cu in soil orders of different land-use systems is depicted in Figure 3. The results reported that the distribution of DTPA-Cu showed a decline with increasing depth in the soil profile of different soil orders. The higher Cu content on surface soils may be due to the lowering of pH with the addition of organic matter in the form of crop residues in the surface layer of soils. Among different soil orders, i.e., Inceptisols, Entisols and Aridisols, the distribution pattern of DTPA-extractable Cu was recorded to be highest in the soil profiles of Entisols > Inceptisols > Aridisols. The higher content of Cu in Entisol and Inceptisol is ascribed to variation in exogenic carbon inputs that stimulated the biomass and activity of microbes, thereby increasing the decomposition rate and release of micronutrients in soils [47,56,60]. The higher content of Cu in Inceptisols might be associated with an increase in clay content, resulting in its adsorption or fixation [1]. Similar results showing the higher content of DTPA-Cu in Inceptisols were reported by some workers [1]. However, the wide variation in Cu content corresponds to a variation in soil orders with different soil temperature and moisture regimes. The low content of Cu in Arid-sols is with respect to the low status of organic matter and clay content in soils. However, the greater content in the soils of Entisol and Inceptisols is ascribed to greater concentrations of cations (Na, Ca, Mg and K) that altered the adsorption–desorption stability of organic complexing agents, thereby affecting the Cu availability in these soils [5,61]. A significant setback of the available Cu was created by variable climate and moisture conditions, with the highest content in soils having mesic temperatures and aquic moisture regimes (Inceptisols) and the least occurring in soils having hyperthermic temperature with aridic and ustic moisture regimes (Aridisols) [5,7]. Higher Cu content in Inceptisols is also accredited to finer texture with higher organic matter content that assisted in an increase in the exchange sites that lead to increased capacity for micronutrient sorption, thereby increasing its availability [5]. Thus, physicochemical properties, such as climatic and soil weathering conditions, significantly contributed to the variation in Cu content in different soil orders under different land-use systems.

3.3. Correlation Coefficients of Soil Properties with DTPA-Extractable Micronutrients in Soil

The correlation between soil properties and DTPA-extractable micronutrients of the studied soils (Table 3) showed a significant negative correlation between DTPA-extracted Zn with pH (−0.605), EC (−0.991 **) and available K (−0.496) and Fe with pH (−0.475), EC (−0.977) and available P (−0.504).
Similar results depicting a negative correlation of DTPA Mn and Cu with pH and EC were detected. However, the positive correlation of Zn with OC (0.415), available P (0.355), followed by Fe with OC (0.237) and available K (0.401), while the correlation between Mn and Cu was observed to be positive with OC, available P and K in soils. A positive correlation of DTPA Zn, Cu, Fe and Mn with OC and available P and K has been reported in the literature [6]. Similar results were reported by some works [5,11,56]. The distribution of DTPA micronutrients is affected by variation in soil pH, OC and texture. The available forms of micronutrients are increased with an increase in the OC and clay content, which might be due to the adsorption on non-organic sites. However, in Aridisols, the accessibility of DTPA Zn, Cu, Fe and Mn were limited due to low OC content, high soil pH and coarse soil textures [6]. The micronutrient availability increased with the increase in OC, which might be due to improved soil structure, also acts as a chelating agent to increase the availability of micronutrients and prevent the oxidation of micronutrients. Inversely, the solubility of micronutrients decreased with the increase in soil pH [62].

4. Conclusions

The availability of the micronutrients to crops is a major concern for efficient plant production. The distribution of DTPA- extractable Zn, Fe, Mn and Cu among different soil orders was higher in the soil order Entisols, followed by Inceptisols and least in Aridisols. The distributions of extractable Zn, Fe, Mn and Cu were higher in the surface soil layers and declined with the increase in soil depths. The DTPA-extractable Zn, Cu, Fe and Mn showed a significant negative correlation with soil properties such as pH and EC in the soil profiles of all soil orders. The outcomes of the current study might be of great importance to researchers, state agricultural officers and farmers to implement nutrient management strategies in different soils.

Author Contributions

Conceptualization, S.S.D., V.S., J.K., A.K.S. and V.K.S.; methodology, S.S.D., V.S., J.K., A.K.S. and V.K.S.; software, S.S.D. and A.H.; validation, S.S.D., V.S., J.K., A.K.S. and V.K.S.; formal analysis, S.S.D. and A.H.; investigation, S.S.D., V.S., J.K., A.K.S. and V.K.S.; resources, S.S.D.; data curation, S.S.D. and A.H.; writing—original draft preparation, S.S.D., V.S., J.K., A.K.S. and V.K.S.; writing—review and editing, A.G., S.H.A.-H., S.S. and A.H.; visualization, S.S.D., V.S., J.K., A.K.S. and V.K.S.; supervision, S.S.D.; project administration, S.S.D., A.G., S.H.A.-H., S.S. and A.H.; funding acquisition, A.G., S.H.A.-H., S.S. and A.H. All authors have read and agreed to the published version of the manuscript.

Funding

This research was funded by the Taif University Researchers for funding this research with Supporting Project number (TURSP-2020/23), Taif University, Taif, Saudi Arabia.

Institutional Review Board Statement

Not applicable.

Informed Consent Statement

Not applicable.

Data Availability Statement

All data are available in the manuscripts.

Acknowledgments

Authors gratefully thank Taif University Researchers Supporting Project number (TURSP-2020/23), Taif University, Taif, Saudi Arabia, for supporting this study.

Conflicts of Interest

The authors would hereby like to declare that there is no conflict of interest for the article.

References

  1. Sharma, B.D.; Brar, J.S.; Chanay, J.K.; Sharma, P.; Singh, P.K. Distribution of forms of copper and their association with soil properties and uptake in major soil orders in semi-arid soils of Punjab, India. Commun. Soil Sci. Plant Anal. 2015, 46, 511–527. [Google Scholar] [CrossRef]
  2. da Fonseca, A.F.; Caires, E.F.; Barth, G. Extraction methods and availability of micronutrients for wheat under a no-till system with a surface application of lime. Sci. Agric. 2010, 67, 60–70. [Google Scholar] [CrossRef]
  3. Bailey, R.L.; West, K.P.; Black, R.E. The epidemiology of global micronutrient deficiencies. Ann. Nutr. Metab. 2015, 66, 22–33. [Google Scholar] [CrossRef] [PubMed]
  4. Behera, S.K.; Singh, M.V.; Singh, K.N.; Todwal, S. Distribution variability of total and extractable zinc in cultivated acid soils of India and their relationship with some selected soil properties. Geoderma 2011, 162, 242–250. [Google Scholar] [CrossRef]
  5. Najafi-Ghiri, M.; Ghasemi-Fasaei, R.; Farrokhnejad, E. Factors Affecting Micronutrient Availability in Calcareous Soils of Southern Iran. Arid Land Res. Manag. 2013, 27, 203–215. [Google Scholar] [CrossRef]
  6. Shakeri, S.; Saffari, M. The status of chemical forms of iron and manganese in various orders of calcareous soils and their relationship with some physicochemical and mineralogical properties. Commun. Soil Sci. Plant Anal. 2020, 51, 2054–2068. [Google Scholar] [CrossRef]
  7. Sharma, B.D.; Mukhopadhyay, S.S.; Sidhu, P.S.; Katyal, J.C. Pedospheric attributes in distribution of total and DTPA-extractable Zn, Cu, and Mn and Fe in Indo-Gangetic plains. Geoderma 2000, 96, 131–151. [Google Scholar] [CrossRef]
  8. Obrador, A.; Alvarez, J.M.; Lopez-Valdivia, L.M.; Gonzalez, D.; Novillo, J.; Rico, M.I. Relationships of soil properties with Mn and Zn distribution in acidic soils and their uptake by a barley crop. Geoderma 2007, 137, 432–443. [Google Scholar] [CrossRef]
  9. Wang, L.; Wu, J.P.; Liu, Y.X.; Huang, H.Q.; Fang, Q.F. Spatial variability of micronutrients in rice grain and paddy soil. Pedosphere 2009, 19, 748–755. [Google Scholar] [CrossRef]
  10. Wu, C.; Luo, Y.; Zhang, L. Variability of copper availability in paddy fields in relation to selected soil properties in southeast China. Geoderma 2010, 156, 200–206. [Google Scholar] [CrossRef]
  11. Sharma, B.D.; Arora, H.; Kumar, R.; Nayyar, V.K. Relationship between soil characteristics and total and DTPA-extractable micronutrients in Inceptisols of Punjab. Commun. Soil Sci. Plant Anal. 2004, 35, 799–818. [Google Scholar] [CrossRef]
  12. Sharma, K.L.; Grace, J.K.; Raj, M.; Mittal, S.B.; Singh, J.; Sharma, S.K.; Sangwan, P.S.; Sidhpuria, M.S.; Vittal, K.P.R.; Mishra, P.K.; et al. Improvement and Assessment of Soil Quality under Long-Term Conservation Agricultural Practices in Hot, Arid Tropical Aridisol. Commun. Soil Sci. Plant Anal. 2013, 44, 1033–1055. [Google Scholar] [CrossRef]
  13. ISSS. Fundamentals of Soil Science; Indian Society of Soil Science: New Delhi, India, 2009. [Google Scholar]
  14. Holmgren, G.G.S.; Meyer, M.W.; Chaney, R.L.; Daniels, R.B. Cadmium, lead, zinc, copper, and nickel in agricultural soils of the USA. J. Environ. Qual. 1993, 22, 335–348. [Google Scholar] [CrossRef]
  15. White, J.G.; Zasoski, R.J. Mapping soil micronutrients. Field Crops Res. 1999, 60, 11–26. [Google Scholar] [CrossRef]
  16. Chen, M.; Ma, L.Q.; Harris, W.J. Baseline concentrations of 15 trace elements in Florida surface soils. J. Environ. Qual. 1999, 28, 1173–1181. [Google Scholar] [CrossRef] [Green Version]
  17. Sharma, B.D.; Aggarwal, V.K.; Mukhopadhyay, S.S.; Arora, H. Micronutrient distributions and their association with soil properties in Entisols of Punjab. Indian J. Agric. Sci. 2002, 72, 334–340. [Google Scholar]
  18. Dhaliwal, S.S.; Shukla, A.K.; Sharma, V.; Behera, S.K.; Choudhary, O.P.; Chaudhari, S.K.; Prakash, C.; Kumar, A.; Patra, A.K.; Sikaniya, Y.; et al. Status of Sulphur and Micronutrients in Soils of Punjab-Blockwise Atlas; Ludhiana and ICAR-Indian Institute of Soil Science: Bhopal, India, 2020; pp. 1–210.
  19. Jackson, M.L. Soil Chemical Analysis; Prentice Hall, Inc.: Hoboken, NJ, USA, 1967. [Google Scholar]
  20. Walkley, A.J.; Black, C.A. Estimation of organic carbon by chromic acid titration method. Soil Sci. 1934, 37, 29–38. [Google Scholar] [CrossRef]
  21. Watanabe, F.S.; Olsen, S.R. Test of an Ascorbic Acid Method for Determining Phosphorus in Water and NaHCO3 Extracts from Soil. Soil Sci. Soc. Am. J. 1965, 29, 677–678. [Google Scholar] [CrossRef]
  22. Pansu, M.; Gautheyrou, J. Handbook of Soil Analysis: Mineralogical, Organic and Inorganic Methods; Springer Science & Business Media: Berlin/Heidelberg, Germany, 2006; ISBN 3540312102. [Google Scholar]
  23. Piper, C.S. Soil and Plant Analysis; Hans Publishers: Bombay, India, 1966. [Google Scholar]
  24. Puri, A.N. A new method of estimating total carbonates in soils, Imp. Agric. Res. Pusa Bull 1930, 206, 7. [Google Scholar]
  25. Lindsay, W.L.; Norvell, W.A. Development of DTPA soil test for zinc, iron, manganese, and copper. Soil Sci. Soc. Am. J. 1978, 42, 421–428. [Google Scholar] [CrossRef]
  26. Dhaliwal, S.S.; Singh, B.; Sharma, B.D.; Khera, K.L. Soil quality and yield trends of different crops in low productive submontaneous tract and highly productive area in Punjab, lndia. Indian J. Dryland Agric. Res. Dev. 2009, 24, 39–45. [Google Scholar]
  27. Chandel, S.; Hadda, M.S.; Mahal, A.K. Soil quality assessment through minimum data set under different land uses of submontane Punjab. Commun. Soil Sci. Plant Anal. 2018, 49, 658–674. [Google Scholar] [CrossRef]
  28. Kaushik, U.; Raj, D.; Rani, P.; Bhardwaj, K.K. Effect of cultivation on organic carbon pools and nutrient availability in soil under different land use systems. Int. J. Curr. Microbiol. Appl. Sci. 2018, 7, 1578–1591. [Google Scholar] [CrossRef]
  29. Mandal, A.; Toor, A.S.; Dhaliwal, S.S. Effect of land-uses on physico-chemical properties and nutrient status of surface (0–15 cm) and sub-surface (15–30 cm) layers in soils of South-Western Punjab, India. Int. J. Curr. Microbiol. Appl. Sci. 2018, 7, 2659–2671. [Google Scholar] [CrossRef]
  30. Macedo, R.S.; Teixeira, W.G.; Correia, M.M.; Martins, G.C.; Vidal-Torrado, P. Pedogenetic processes in anthrosols with pretic horizon (Amazonian Dark Earth) in Central Amazon, Brazil. PLoS ONE 2017, 12, e0178038. [Google Scholar] [CrossRef] [Green Version]
  31. Cancela, R.C.; De Abreu, C.A.; Paz-González, A. DTPA and Mehlich-3 micronutrient extractability in natural soils. Commun. Soil Sci. Plant Anal. 2002, 33, 2879–2893. [Google Scholar] [CrossRef]
  32. Dhaliwal, S.S.; Naresh, R.K.; Walia, M.K.; Gupta, R.K.; Mandal, A.; Singh, R. Long-term effects of intensive rice–wheat and agroforestry based cropping systems on build-up of nutrients and budgets in alluvial soils of Punjab, India. Arch. Agron. Soil Sci. 2020, 66, 330–342. [Google Scholar] [CrossRef]
  33. Kaur, R.; Bhat, Z.A. Effect of different agricultural land-use system on physico-chemical properties of soil in the sub-mountainous district of Punjab. J. Pharm. Phytochem. 2017, 6, 226–233. [Google Scholar]
  34. Mandal, D.; Dhyani, B.; Kumar, A.; Singh, C.; Bihari, B.; Muruganandam, M.; Madhu, M. Impact of different land use systems on soil quality in northwest Himalayan region. Indian J. Soil Conserv. 2013, 41, 200–205. [Google Scholar]
  35. Maini, A.; Sharma, V.; Sharma, S. Assessment of soil carbon and biochemical indicators of soil quality under rainfed land usesystems in north eastern region of Punjab, India. Carbon Manag. 2020, 11, 169–182. [Google Scholar] [CrossRef]
  36. Sharma, B.D.; Choudhary, O.P.; Chanay, J.K.; Singh, P.K. Forms and Uptake of Manganese in Relation to Soil Taxonomic Orders in Alluvial Soils of Punjab, India. Commun. Soil Sci. Plant Anal. 2016, 47, 313–327. [Google Scholar] [CrossRef]
  37. Neha, G.; Bhople, B.S.; Sharma, S. Seasonal variation of rhizospheric soil properties under different land use systems at lowerShivalik foothills of Punjab, India. Agrofor. Syst. 2020, 94, 1959–1976. [Google Scholar] [CrossRef]
  38. Islam, W.; Saqib, S.H.A.; Adnan, M.; Wang, Z.; Tyyab, M.; Huang, Z.; Chen, H.Y.H. Differential response of soil microbial and animal communities along the chronosequence of Cunninghamia lanceolata at different soil depth levels in subtropical forest ecosystem. J. Adv. Res. 2021. [Google Scholar] [CrossRef]
  39. Tayyab, M.; Fallah, N.; Zhang, C.; Pang, Z.; Islam, W.; Lin, S.; Lin, W.; Zhnag, H. Sugarcane cultivar-dependent changes in assemblage of soil rhizosphere fungal communities in subtropical ecosystem. Environ. Sci. Pollut. Res. 2021, 1–13. [Google Scholar] [CrossRef] [PubMed]
  40. Costa, J.A.; Kern, D.C.; Costa, M.L.; Rodrigues, T.E.; Kampf, N.; Lehmann, J.; Frazâo, F.J. As Terras Pretas De Índio da Amazônia: Sua Caracterização E Uso Deste Conhecimento Na Criação De Novas Áreas; Teixeira, W.G., Kern, D.C., Madari, B.E., Lima, H.N., Woods, W., Eds.; Embrapa Amazônia Ocidental: Manaus, Brazil, 2009; pp. 162–171. [Google Scholar]
  41. Mendoza, E.M.O. Carbono Orgânico E Nutrientes Em Solos Antrópicos E Adjacentes Sob Floresta Secundária Na Amazônia Central. Master’s Thesis, Instituto Nacional de Pesquisas da Amazônia–INPA, Manaus, Brazil, 2011; p. 85. [Google Scholar]
  42. Uthappa, A.R.; Bana, O.P.S.; Kumar, M.; Kanwal, M. Soil physic-bio-chemical properties as influenced by varyig tree densities inPopular based agroforestry system. Indian J. Agrofor. 2013, 17, 81–90. [Google Scholar]
  43. Van der Wal, A.; De Boer, W.; Lubbers, I.M. Concentration and vertical distribution of total soil phosphorus in relation to time of abandonment of arable fields. Nutr. Cycl. Agroecosyst. 2007, 79, 73–79. [Google Scholar] [CrossRef] [Green Version]
  44. Pang, Z.; Tayyab, M.; Kong, C.; Liu, Q.; Liu, Y.; Hu, C.; Huang, J.; Weng, P.; Islam, W.; Lin, W.; et al. Continuous Sugarcane Planting Negatively Impacts Soil Microbial Community Structure, Soil Fertility, and Sugarcane Agronomic Parameters. Microrganisms 2021, 9, 2008. [Google Scholar] [CrossRef] [PubMed]
  45. Albuquerque, A.R. Caracterização Antracolo’Gica, Físico-Química, Isoto’Pica E Molecular da Terra Preta Do SítioArqueolo’Gico Porto, Santar’Em, PA. Ph.D. Thesis, Universidade de São Paulo, Piracicaba, Brazil, 2017; p. 185. [Google Scholar]
  46. Dhaliwal, M.K.; Dhaliwal, S.S. Impact of manure and fertilizers on chemical fractions of Zn and Cu in soil under wheat-rice cropping system. J. Indian Soc. Soil Sci. 2019, 67, 85–91. [Google Scholar] [CrossRef]
  47. Singh, P.; Benbi, D.K. Soil organic carbon pool changes in relation to slope position and land-use in Indian lower Himalayas. Catena 2018, 166, 171–180. [Google Scholar] [CrossRef]
  48. Stepien, A.; Wojtkowiak, K.; Pietrusewicz, M.; Skłodowski, M.; Pietrzak-Fiećko, R. The yield and grain quality of winter rye (Secale cereale L.) under the conditions of foliar fertilization with micronutrients (Cu, Zn and Mn). Pol. J. Nat. Sci. 2016, 31, 33–46. [Google Scholar]
  49. Tayyab, M.; Islam, W.; Arafat, Y.; Pang, Z.; Zhang, C.; Lin, Y.; Waqas, M.; Lin, S.; Lin, W.; Zhang, H. Effect of sugarcane straw and goat manure on soil nutrient transformation and bacterial communities. Sustainability 2018, 10, 2361. [Google Scholar] [CrossRef] [Green Version]
  50. Rashid, A.; Ryan, J. Micronutrient constraints to crop production in soils with Mediterranean-type characteristics: A review. J. Plant Nutr. 2004, 27, 959–975. [Google Scholar] [CrossRef]
  51. Ahmed, N.; Abid, M.; Rashid, A. Zinc fertilization impact on irrigated cotton grown in an Aridisol: Growth, productivity, fiber quality, and oil quality. Commun. Soil Sci. Plant Anal. 2010, 41, 1627–1643. [Google Scholar] [CrossRef]
  52. Sharma, B.D.; Seth, A.; Saini, R.S.; Dhaliwal, S.S. Distribution of different forms of Mn and their association with soil properties in arid zone soils of Punjab, India. Arch. Agron. Soil Sci. 2011, 57, 15–26. [Google Scholar] [CrossRef]
  53. Nael, M.; Khademi, H.; Jalalian, A.; Schulin, R. Effect of geo-pedological conditions on the distribution and chemical speciation of selected trace elements in forest soils of western Alborz, Iran. Geoderma 2009, 152, 157–170. [Google Scholar] [CrossRef]
  54. Zhang, X.P.; Deng, W.; Yang, X.M. The background concentrations of 13 soil trace elements and their relationships to parent materials and vegetation in Xizang (Tibet), China. J. Asian Earth Sci. 2002, 21, 167–174. [Google Scholar] [CrossRef]
  55. Fageria, N.K.; Baligar, V.C.; Clark, R.B. Micronutrients in crop production. Adv. Agron. 2002, 77, 185–268. [Google Scholar]
  56. Sharma, S.; Singh, P.; Angmo, P.; Dhaliwal, S.S. Micro-nutrient pools and their mobility in relation to the land-use system in a cold high altitude Himalayan mountainous region. Agrofor. Syst. 2021, 95, 1395–1412. [Google Scholar] [CrossRef]
  57. Keshavarzi, A.; Kumar, V.; Bottega, E.L.; Rodrigo-Comino, J. Determining Land Management Zones Using Pedo-Geomorphological Factors in Potential Degraded Regions to Achieve Land Degradation Neutrality. Land 2019, 8, 92. [Google Scholar] [CrossRef] [Green Version]
  58. Saikia, R.; Sharma, S.; Thind, H.S.; Singh, Y. Tillage and residue management practices affect soil biological indicators in a rice-wheat cropping system in north-western India. Soil Use Manag. 2019, 36, 157–170. [Google Scholar] [CrossRef]
  59. Nascimento, C.W.A.; Melo, E.E.C.; Nascimento, R.S.D.M.P.; Leite, P.V.V. Effect of liming on the plant availability and distribution of zinc and copper among soil fractions. Commun. Soil Sci. Plant Anal. 2007, 38, 545–560. [Google Scholar] [CrossRef]
  60. Motta, A.C.V.; Serrat, B.M.; Reissmann, C.B.; Dionísio, J.A. (Eds.) Micronutrientesnarocha, No Solo E Na Planta, 1st ed.; Universidade Federal do Parana: Curitiba, Brazil, 2007; 242p. [Google Scholar]
  61. Rusjan, D.; Strlic, M.; Pucko, D.; Korosec-Koruza, Z. Copper accumulation regarding the soil characteristics in Sub-Mediterranean vineyards of Slovenia. Geoderma 2007, 141, 111–118. [Google Scholar] [CrossRef]
  62. Kumar, M.; Babel, A. Available micronutrient status and their relationship with soil properties of Jhunjhunu tehsil, District Jhunjhunu, Rajasthan, India. J. Agric. Sci. 2011, 3, 97–106. [Google Scholar] [CrossRef]
Figure 1. Locations for soil sampling (Bathinda, Ludhiana, SBS Nagar, Tarantarn and Gurdaspur).
Sustainability 14 00029 g001
Figure 2. Depth wise variations in soil properties and available PK (kg ha−1) among different soil orders (n = 144).
Sustainability 14 00029 g002
Figure 3. Depth-wise variations in DTPA-extractable micronutrients (mg kg−1) among different soil orders (n = 144).
Sustainability 14 00029 g003
Table 1. Physiographic description of sites of soil profile under different soil orders.
Sr. NoLocationsAgro-Climatic ZoneAnnual Rainfall (mm)Soil OrderLand Use
ForestHorticultureCultivatedPasture
1BathindaWestern zone<800AridisolDek plantationKinnow orchardRice-wheatBarren land
2GurdaspurSub-mountain undulating zone>800InceptisolPoplar plantationMango orchardRice-wheatBarren land
3LudhianaCentral plain zone<800InceptisolPoplar plantationGuava orchardRice-wheatBarren land
4SBS NagarUndulating plain zone>800EntisolMixed plantationGuava orchardMaize-wheatBarren land
5TarntaranCentral plain zone≤800EntisolMixed plantationPear orchard intercropped with peaRice-wheatBarren land
Table 2. Variations in particle size distribution (soil texture) and calcium carbonate content in the soil profiles of different soil orders.
Depth (cm)Sand (%)Silt (%)Clay (%)CaCO3 (%)
0–1060.420.019.64.9
10–2059.920.1204.7
20–4059.220.720.14.5
40–6058.119.9224.8
60–8059.420.520.14.6
80–10059.220.120.74.3
LSD (p = 0.05)NSNSNSNS
Order
Aridisol77.511.610.86.1
Entisol61.419.219.44.9
Inceptisol60.420.119.54.3
Table 3. Linear correlation (Pearson) coefficient between soil properties and DTPA-extractable micronutrients in the soil profile of variable soil orders.
VariablespHECOCAvailable PAvailable KDTPA-ZnDTPA-FeDTPA-MnDTPA-Cu
pH1
EC−0.5241
OC0.761 **−0.411 NS1
Available P0.5210.426 NS0.538 *1
Available K0.945 **−0.385 NS0.522 *0.527 *1
DTPA-Zn−0.605 *−0.991 **0.415 NS0.355 NS−0.496 *1
DTPA-Fe−0.475 *−0.977 *0.237 NS−0.504 *0.401 NS0.982 **1
DTPA-Mn−0.530 *−0.386 NS0.177 NS0.837 *0.702 *0.266 NS0.345 NS1
DTPA-Cu−0.377 NS−0.5340.252 NS−0.327 NS0.556 *0.614 *0.693 *0.170 NS1
**, * indicate correlation is significant at 1 and 5% significance level and NS, indicates non-significant.
Publisher’s Note: MDPI stays neutral with regard to jurisdictional claims in published maps and institutional affiliations.

