
Relationships among the Fossil Fuel and Financial Markets during the COVID-19 Pandemic: Evidence from Bayesian DCC-MGARCH Models


Graduate School of Humanities and Social Sciences, Saitama University, 255 Shimo-Okubo, Sakura-ku, Saitama 338-8570, Japan
*
Author to whom correspondence should be addressed.
Sustainability 2022, 14(1), 51; https://0-doi-org.brum.beds.ac.uk/10.3390/su14010051
Submission received: 27 October 2021
/
Revised: 12 December 2021
/
Accepted: 20 December 2021
/
Published: 21 December 2021
(This article belongs to the Special Issue Global Energy Economics and Implications of Energy-Related Policies)
Abstract
:This study examined how the relationships among the fossil fuel, clean energy stock, gold, and Bitcoin markets have changed since the COVID-19 pandemic took place for hedging the price change risks in the fossil fuel markets. We applied the Bayesian Dynamic Conditional Correlation-Multivariate GARCH (DCC-MGARCH) models using US daily data from 2 January 2019 to 26 February 2021. Our results suggest that the fossil fuel (WTI crude oil and natural gas) and financial markets (clean energy stock, gold, and Bitcoin) generally had negative relationships in 2019 before the pandemic prevailed, but they became positive for a while in mid-2020, alternating between positive (0.8) and negative values (−0.8). As it is known that negative relationships are required among assets to hedge the risk of price changes, this implies that stakeholders need to be cautious in hedging the risk across the fossil fuel and financial markets when a crisis like COVID-19 occurs. However, our study also revealed that such negative relationships only lasted for three to six months, suggesting that the effects of the pandemic were short term and that stakeholders in the fossil fuel markets could cross hedge with the financial markets in the long term.
1. Introduction
Since the outbreak of the COVID-19 pandemic, many countries have adopted restrictive measures to prevent the spread of the virus, which has led to the stagnation of many industries and a decrease in the demand and consumption of fossil fuels [1]. Global fossil fuel demand fell by 6% in 2020, with the United States (US) and the European Union (EU) reporting the largest fall of 9% and 11%, respectively [2]. The reduction in the consumption of fossil fuels is likely to have adverse impacts on fossil fuel prices. Taking the price of the US West Texas Intermediate (WTI) as an example, it dropped below the 20 USD per barrel, which was the lowest in the past 18 years [3]. Meanwhile, Zhang et al. [4] suggested that the pandemic had a significant impact on the stability of the financial markets. For example, the S&P 500 Index reached 3380.16 points on 14 February 2020, but plunged to 2237.40 on 23 March 2020, which indicated a drop of 30% within one month [5] as the pandemic started to spread in the US.
We conjecture that, before the pandemic, the relationship between fossil fuel and financial assets was relatively stable. To deal with the risk of fluctuation in the price of fossil fuels, investors in the fossil fuel market would hold assets that are negatively correlated or uncorrelated with the fossil fuel market, such as clean energy stock, gold, and Bitcoin [6].
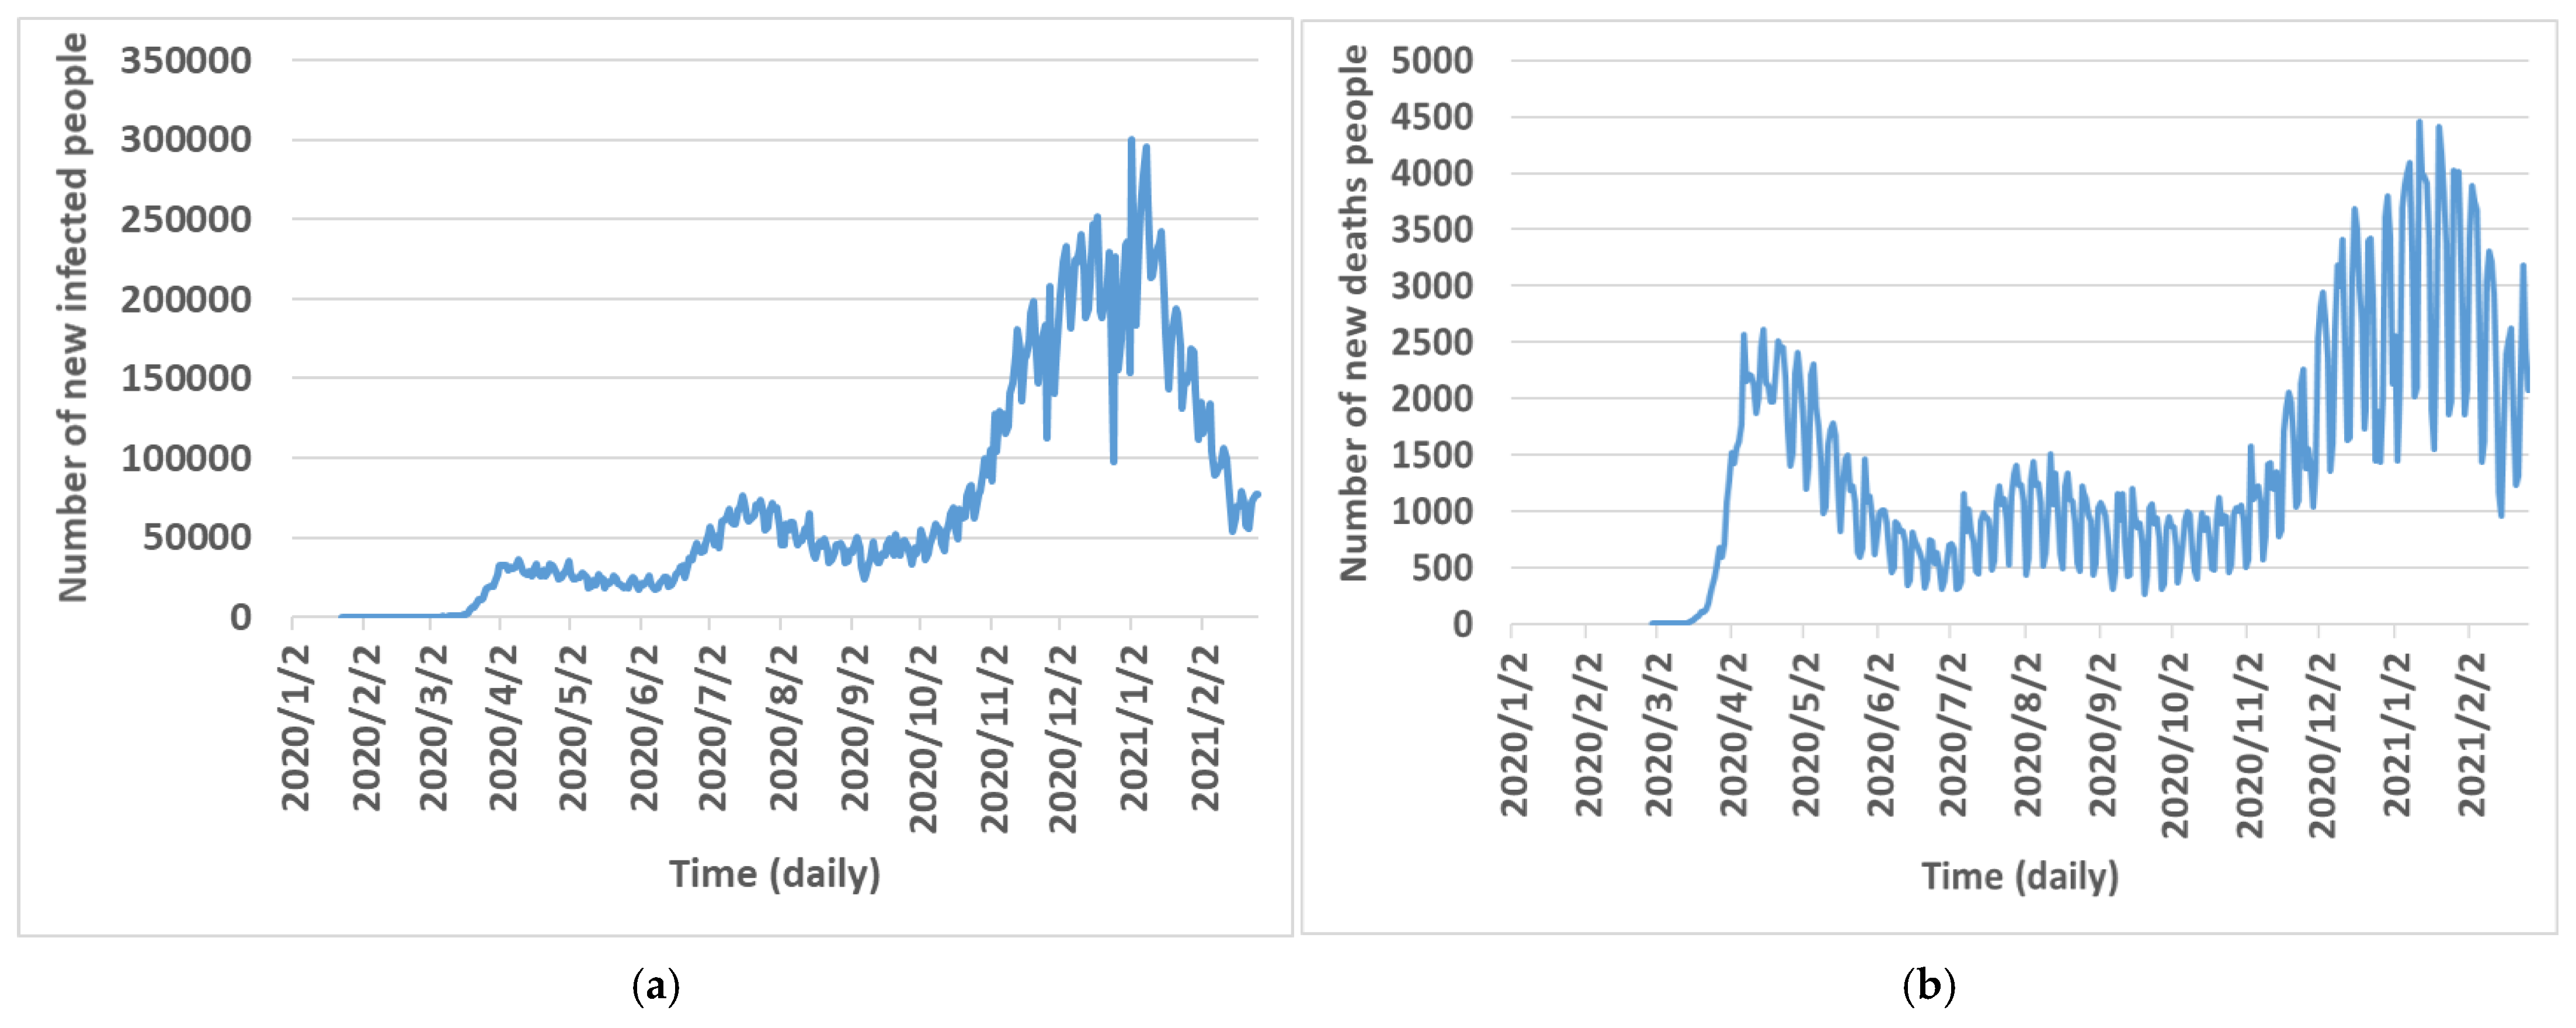
In response to the pandemic, the US implemented lockdown regulations prohibiting people from stepping out. The regulations caused many industries to stagnate and directly affected energy consumption, which lowered the price volatility of the energy market [1]. Simultaneously, due to the increasing number of new infections and deaths (see Figure 1), the restrictions also affected investor confidence. The investors began to panic and sold their financial assets [7], which further depreciated the prices of those financial assets. Thus, it is probable that both the fossil fuel and financial asset markets were adversely affected by the pandemic [8], and as a result, both markets formed a positive, correlative relationship. Hence, we expect their relationship changed before and after the crisis. However, if so, it becomes difficult for investors to manage their portfolios rationally by combining various assets based on modern portfolio theory (MPT) [9].
Since Markowitz [10], MPT has become one of the fundamental pillars of portfolio construction. The MPT assumes that risk-averse investors can construct a portfolio that minimizes risk, which is calculated by a weighted average related to the correlation coefficients of the returns of its component assets. Thus, it is speculated that the greater the positive correlation of the portfolio, the greater the risk because all the weights in this average are positive values. According to the MPT assumption, Baur and Lucey [11] proposed the concept that an asset is a haven asset if it is negatively correlated or uncorrelated with another asset during crisis periods and suggested gold as a haven asset for stock markets. Along these lines, Dutta et al. [3] also suggested gold as a haven asset for oil because there is a significant negative relationship between gold and oil. Bitcoin, however, is not a haven asset for oil because of the positive relationship between Bitcoin and oil during the pandemic. Nonetheless, the MPT assumption is still undermined by crises. For example, there was a strongly positive cross-market linkage during the 2008 financial crisis period [9]. Moreover, So et al. [12] suggested that the diversification effect during a pandemic is weaker than during normal periods due to the co-movement of the cross-financial market triggered by extraordinary events such as a pandemic.
While the linkage between fossil fuels and their hedging assets started drawing attention due to the pandemic, academic research on this issue is insufficient. Hedging between fossil fuel and other assets is important to assure capital for purchasing fossil fuel, which will help stabilize the energy supply. However, events like the pandemic could make it difficult for suppliers of energy to hedge the risk of changes in the fossil fuel price by combining their portfolios with financial assets such as gold and Bitcoin. Therefore, it is necessary to reanalyze the connection between fossil fuels and their hedging assets for cross-market investors to understand portfolio risk management based on the MPT. This issue is crucial for institutions seeking to assure energy for their citizens because energy markets are often strongly affected by changes in financial markets such as relevant stock and gold markets, and hedging across the financial markets is crucial for achieving sustainable energy supply.
If the linkage between the fossil fuel market and its hedging assets is time-varying during the pandemic, investors should pay more attention to the changes in their relationships. For example, it would be worthwhile to note whether the change is from a negative correlation to a positive correlation, from a positive correlation to a negative correlation, or from a strong correlation to a weak correlation. In particular, when fossil fuels become positively correlated with financial assets such as clean energy stock, gold, and Bitcoin during the pandemic, the effect of reducing risk may become very low based on MPT. If so, it could be that hedging across the fossil fuel and financial markets become difficult when they are adversely influenced by shocks like the pandemic. Therefore, our study is expected to provide important information on the dynamic relationship between the energy and financial markets so that the right adjustments can be made to diversifying portfolios after accounting for price fluctuation risk caused by the pandemic. The results of the study can offer a valuable reference to understand how the relationships between the energy and financial markets will be affected by the pandemic.
Although some empirical studies have explored the relationship between oil prices and hedging assets, such as clean stock, gold, and Bitcoin prices separately, to the best of our knowledge, no study has explored the linkage between fossil fuel prices (coal, crude oil, and natural gas) and its hedging assets (such as clean energy stock, gold, and Bitcoin prices) simultaneously during a pandemic.
Therefore, to fill this gap, the study examines how the relationships among the fossil fuel and financial markets have been affected during the COVID-19 pandemic. For this purpose, the US market was chosen. First, the US has the world’s largest energy and financial trading markets. Second, it has one of the largest numbers of COVID-19 patients in the world, which means that the US market can better reflect the impact of the pandemic on the energy and financial markets. In addition, compared to prior studies [6,9] which mostly employed the DCC-GARCH or Constant Conditional Correlation (CCC)-GARCH model using the Maximum Likelihood (ML) estimation to test the correlation, our study employs the Bayesian DCC-MGARCH models. In the Bayesian DCC-MGARCH models, the standard error of the estimated parameter is smaller than the ML [13] and thus, more accurate for the results of the study.
The clean energy stock, gold, and Bitcoin cryptocurrency markets are chosen as the markets that may have the characteristics of hedging for fossil fuels [14,15,16]. Gold is usually chosen as a hedging asset to offset the risk that investors face because it is a universal currency recognized all over the world [17,18,19]. Bitcoin is a new financial product that may be useful for inclusion in investment portfolios [20] because of its popularity as a cryptocurrency. During the pandemic, while demand for fossil fuels has declined, the demand for clean energy has risen accordingly [21], which means that the clean energy stock market has attracted more private capital reallocation [15] as clean energy is now considered the most efficient alternative to meet fossil fuel consumption [22]. Thus, it is reasonable to assume that clean energy stocks might be regarded as a good hedge asset during the pandemic.
As the world still heavily relies on fossil fuels for its energy, countries need to hedge the risk of sudden price change for sustainable energy supply. To mitigate such risk, energy suppliers need to hedge across the financial markets since energy prices are often affected by financial markets. Since COVID-19 had devastating impacts on fossil fuel and financial markets, the current study investigates how susceptible the relationships among the fossil fuel and financial markets are during this pandemic to provide important information to cope with potential risks that might have similar impacts on the relationships in the future.
In the Section 2, the related prior literature is discussed. The Section 3 and Section 4 describe the data and methods. The Section 5 explains the results of the analysis. The final section discusses the implications of the results and draws conclusions. In addition, the basic concepts discussed in this paper are described in Appendix A Table A1.
2. Previous Research
We present our review of previous studies from four aspects: the nexus between the fossil fuel and financial markets; whether Bitcoin and gold are safe havens against the crude market; whether the COVID-19 pandemic affected the fossil fuel market and financial market such as gold, clean energy stock, Bitcoin; and studies applying the DCC-GARCH model. A summary of relevant studies introduced in this study is shown in Table 1.
Some studies have attempted to investigate the nexus between clean energy and fossil fuels, such as the causality between oil and renewable energy stock prices [15] and the relationship between fossil fuels, renewable energy, and economic growth in Pakistan [22]. In addition, there is a growing body of literature on the relationships between Bitcoin and fossil fuel markets. For example, Moussa et al. [23] investigate their relationship in a dynamic aspect from the short and long run over the period 2011–2018 using STECM approach. The study reveals that the impact of Bitcoin on fossil fuel lagged values is positive, while Rehman and Kang [24] employ MODWT approach to test their time-frequency co-movement and causality relationship to suggest that while both oil and gas have a significant co-movement with the Bitcoin returns, it no longer exhibits a co-movement when the effect of coal market is considered.
Other studies have investigated the relationship between crude oil, Bitcoin, and gold from a finance perspective. For instance, using the DCC-GARCH model, Al-Yahyaee et al. [6] suggested that Bitcoin and gold assets have diversification and hedging properties for S&P Goldman Sachs Commodity Index investors. Conversely, using a dummy variable GARCH and a quantile regression model, Das et al. [25] showed that (1) Bitcoin is not a superior asset over others in hedging oil-related uncertainties, and (2) the hedging capacity of different assets is conditional upon the nature of the oil risks and market situation. Moreover, using methodologies of DCC and wavelet coherence, Kyriazis [26] indicated that Bitcoin had a long way to go before it can be considered a safe-haven asset such as gold. From the results of the studies above, we can conclude that it is uncertain whether Bitcoin is a hedging asset for crude oil and that gold is a haven asset in different periods.
Among the studies investigating the impact of the COVID-19 on fossil fuel and financial markets, Wan et al. [21] conducted a study on the impact of the crisis on investment in clean energy versus the fossil fuel stock market in China. They find evidence that the pandemic is causing impacts on the clean energy and fossil fuel markets. Hoang et al. [27] suggest that while the COVID-19 pandemic affected the fossil fuel market the most, the clean energy market was also not spared. Even after the outbreak, there is a controversy regarding whether clean energy can replace fossil fuels as the economic and environmental impact need to be considered for investment in renewable energy to replace fossil fuels [28]. According to Kanamura [28], the clean energy business might represent a form of environmental value, while fossil fuels might represent economic value. It is also known that all renewable energy stock markets are affected by the volatility of the US fossil fuel energy prices due to COVID-19 [7].
In addition to prior studies on the impact of COVID-19 on stock related to clean energy, there are also studies on stock indices and industry stocks during COVID-19. For example, Shehzad et al. [29] utilized VAR-DCC-EGARCH to test the volatility spillover between the stock market and reported a volatility spillover for both China and Pakistan stock markets during the pandemic. Sayed and Eledum [30] used event study methodology to suggest that when the announcement of COVID-19 went in after 9 days, it only had a negative and significant effect Saudi stock market and has different effects on different industries such as banks, consumer services, capital goods, and transportation.
However, these studies above did not investigate whether the correlation between clean energy and fossil fuels became any stronger during the pandemic. Moreover, Heinlein et al. [31] applied the multiplicative component GARCH model to investigate how the relationship between crude oil and stock markets, suggesting that there are correlations between the crude oil and stock markets for all countries during the COVID-19 crisis. The authors also indicate that the stock markets of commodity exporters have stronger correlations with oil returns than their importing counterparts. Hammoudeh et al. [32] explored the causal relationship between oil prices and clean energy based on the nonparametric causality-in-quantiles, indicating that oil price returns have an absence of significant causal relationships with clean energy stock during the COVID-19 pandemic period. Tang and Aruga (2021) [33] suggest that there exists an impact from the COVID-19 pandemic on the relationship between China and international fossil fuel and that the changes in the relationship are driven by the influence of the pandemic on the Chinese fossil fuel market. Moreover, Chevallier [34] indicated that the COVID-19 confirmed cases and deaths have an adverse influence on the CO2 emissions.
Finally, the Bayesian DCC-MGARCH method was first proposed by Fioruci, Ehlers, and Louzada [35]. Then, this method was applied by Shiferaw [13] to study the time-varying correlation between agricultural commodities and energy prices in comparison with ML methods. Shiferaw [13] showed that the posterior standard deviations of the parameters generated by the Bayesian DCC-MGARCH models were slightly lower than the standard deviations of the parameters from ML. These results indicate that the Bayesian inference process might be better than the conventional ML approach for estimating parameters in the DCC-MGARCH models. Compared to the above previous literature, our current study explores how these relationships among fossil fuel, Bitcoin, gold, and clean energy stock markets are changing during the COVID-19 pandemic periods using the Bayesian DCC-MGARCH model.
3. Data
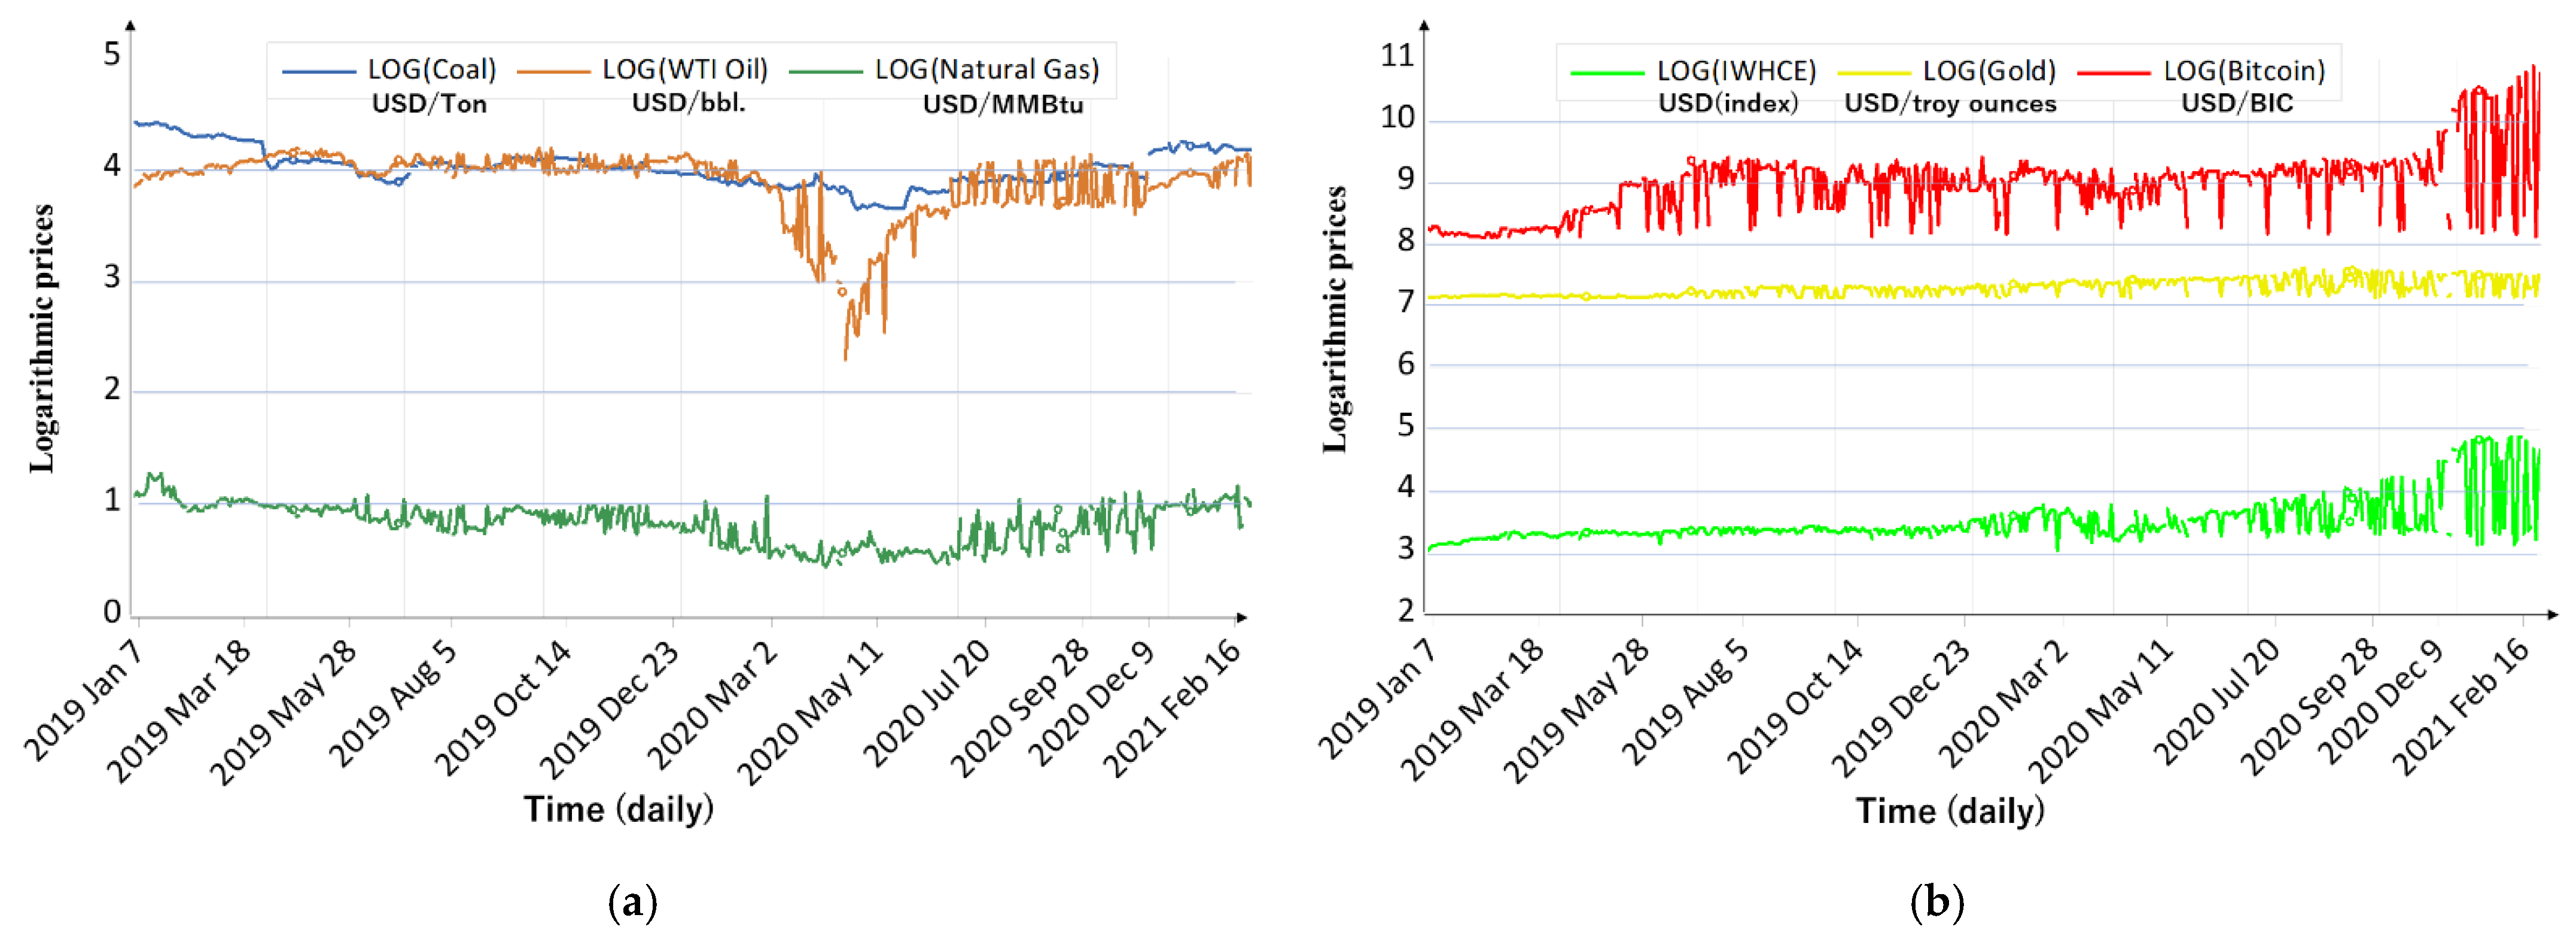
The daily returns of the US fossil fuel markets (Coal, WTI Oil, and Henry Hub Natural Gas) and Invesco Wilder Hill Clean Energy (IWHCE) Index were the samples analyzed in this study from 2 January 2019 to 26 February 2021. The IWHCE Index is not directly available, so our study used the clean energy Exchange-Traded Fund as a proxy variable because the fund is based on the IWHCE Index, which is computed by the stocks of US publicly traded companies engaging in the business of advancing clean energy and conservation [36]. The daily prices of these samples related to US energy were the official close prices sourced from INSIDER [37]. The daily gold data came from GOLDHUB [38], and the price unit is US dollars per troy ounce. The Bitcoin daily prices were obtained from Yahoo Finance [5] and are quoted as US dollars. Since the energy markets and financial markets mentioned above have different calculation units, we take the data logarithmically, as shown in Figure 2.
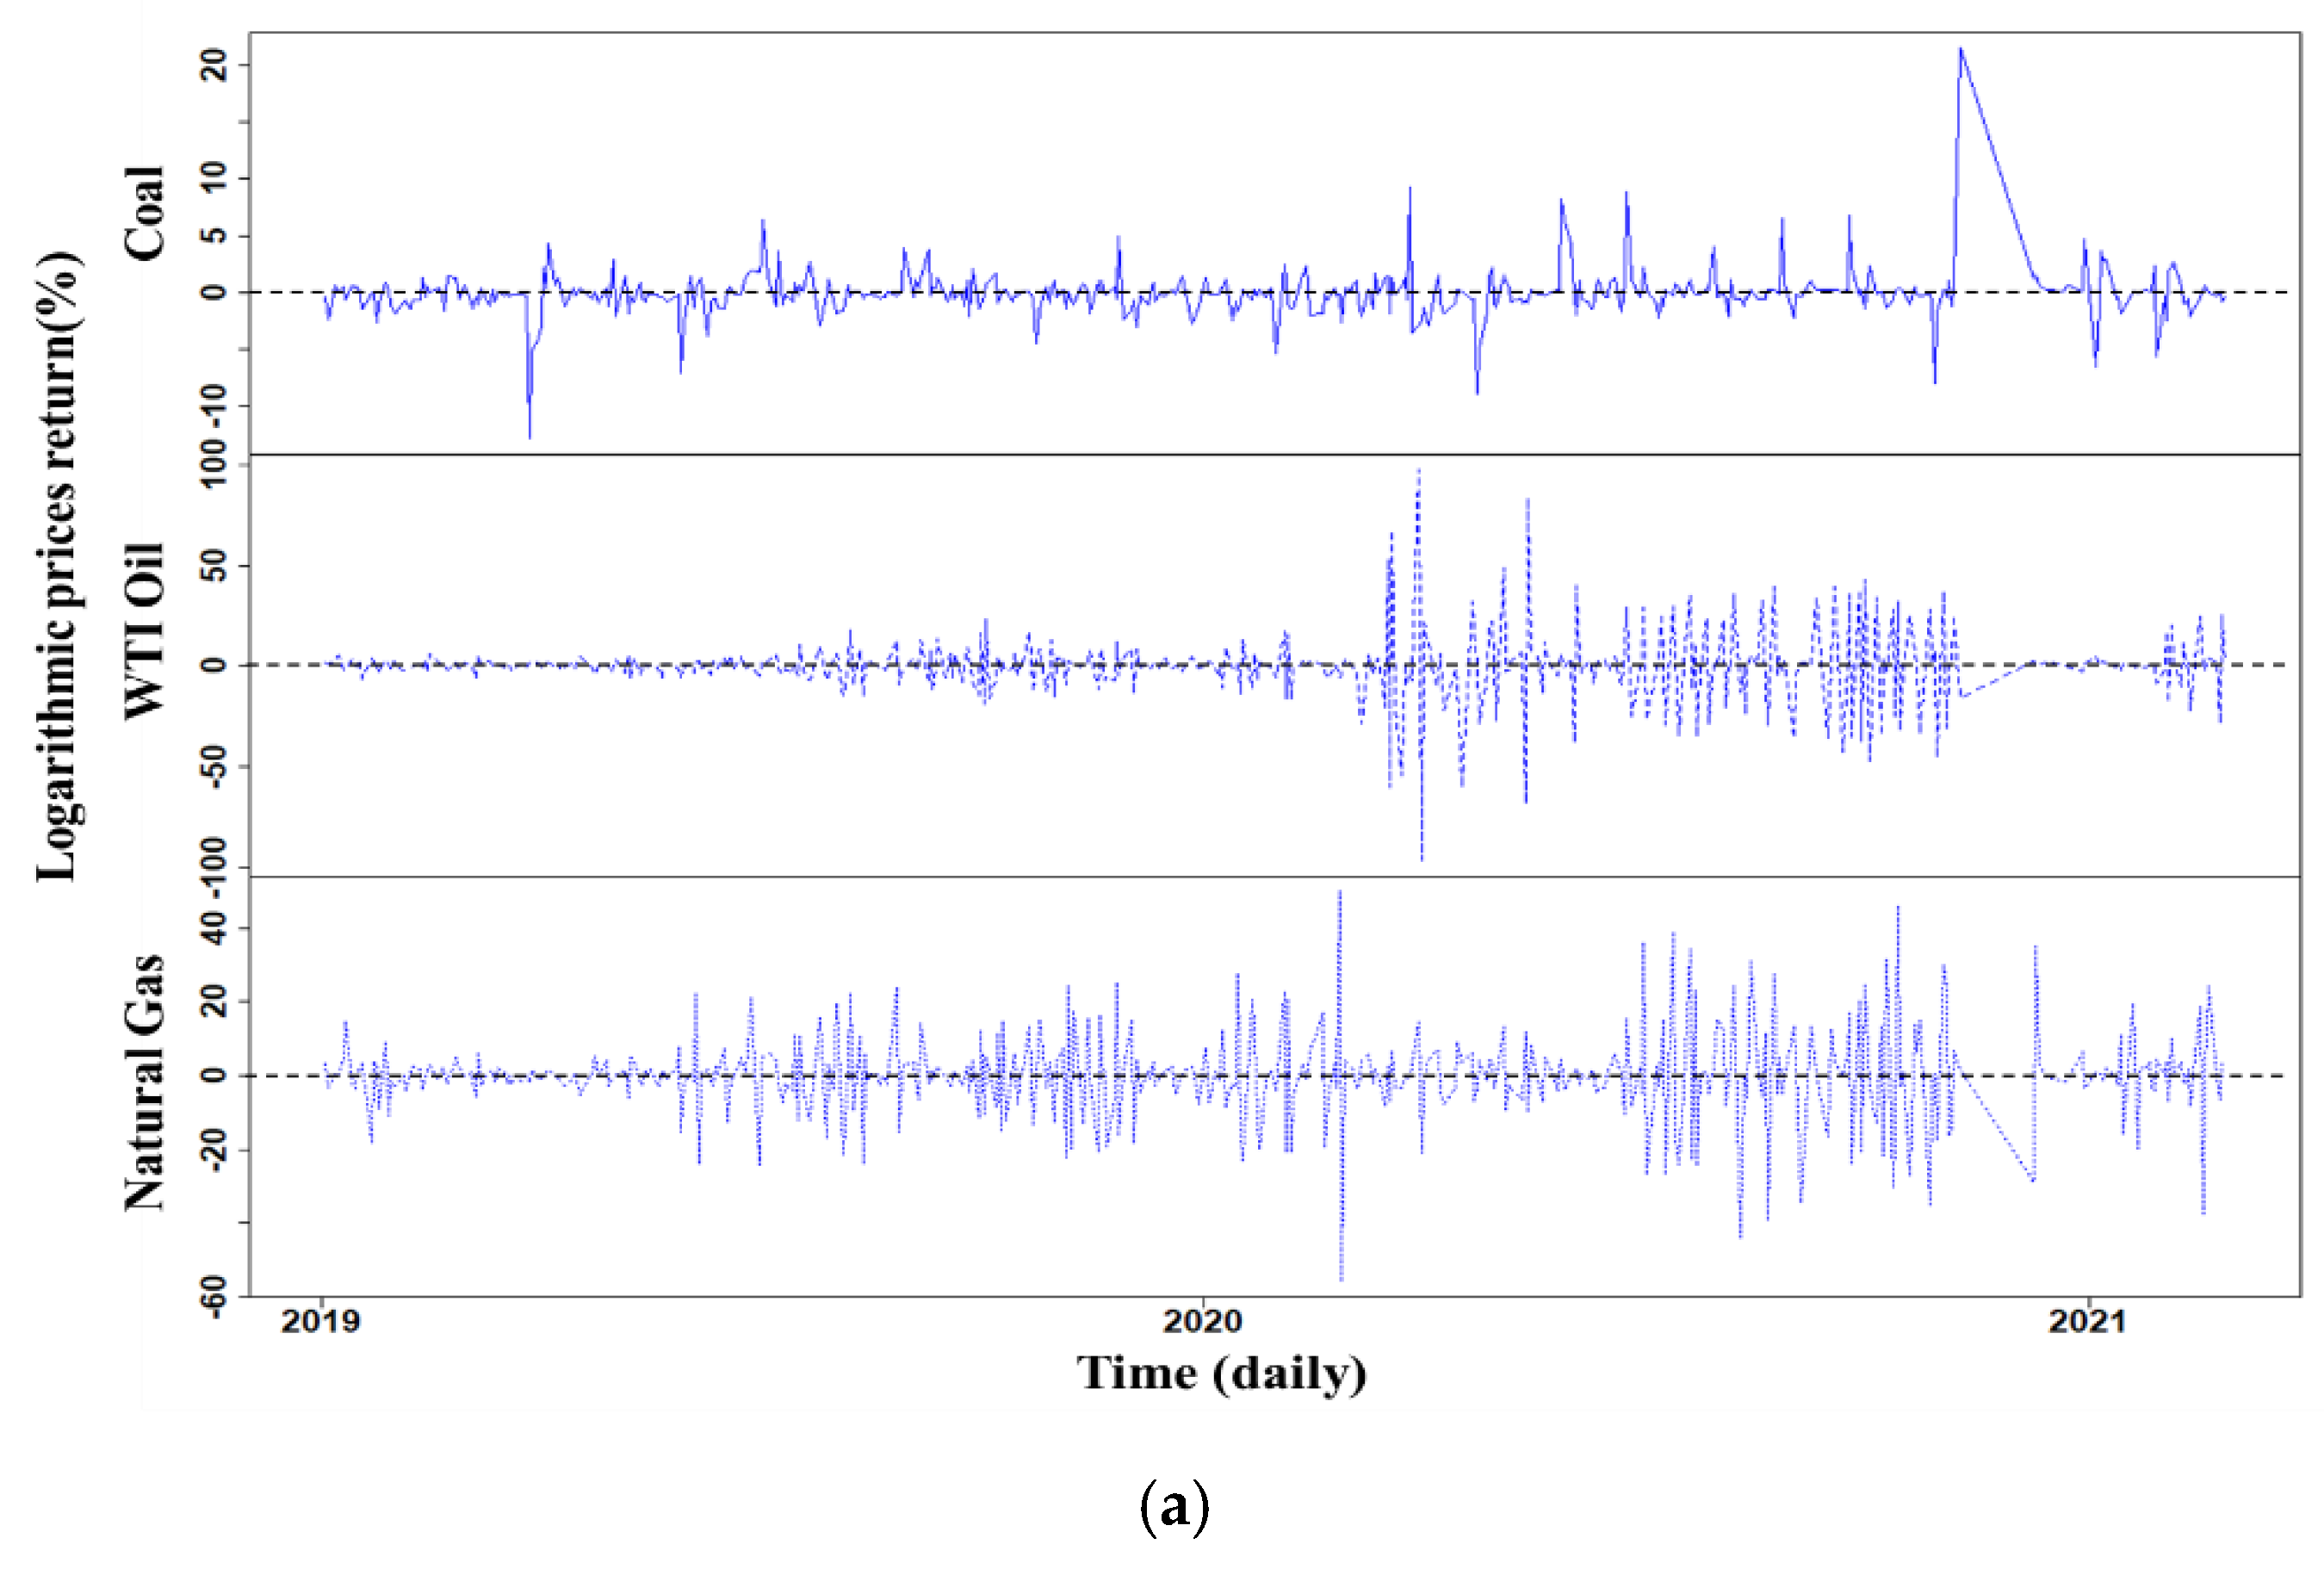
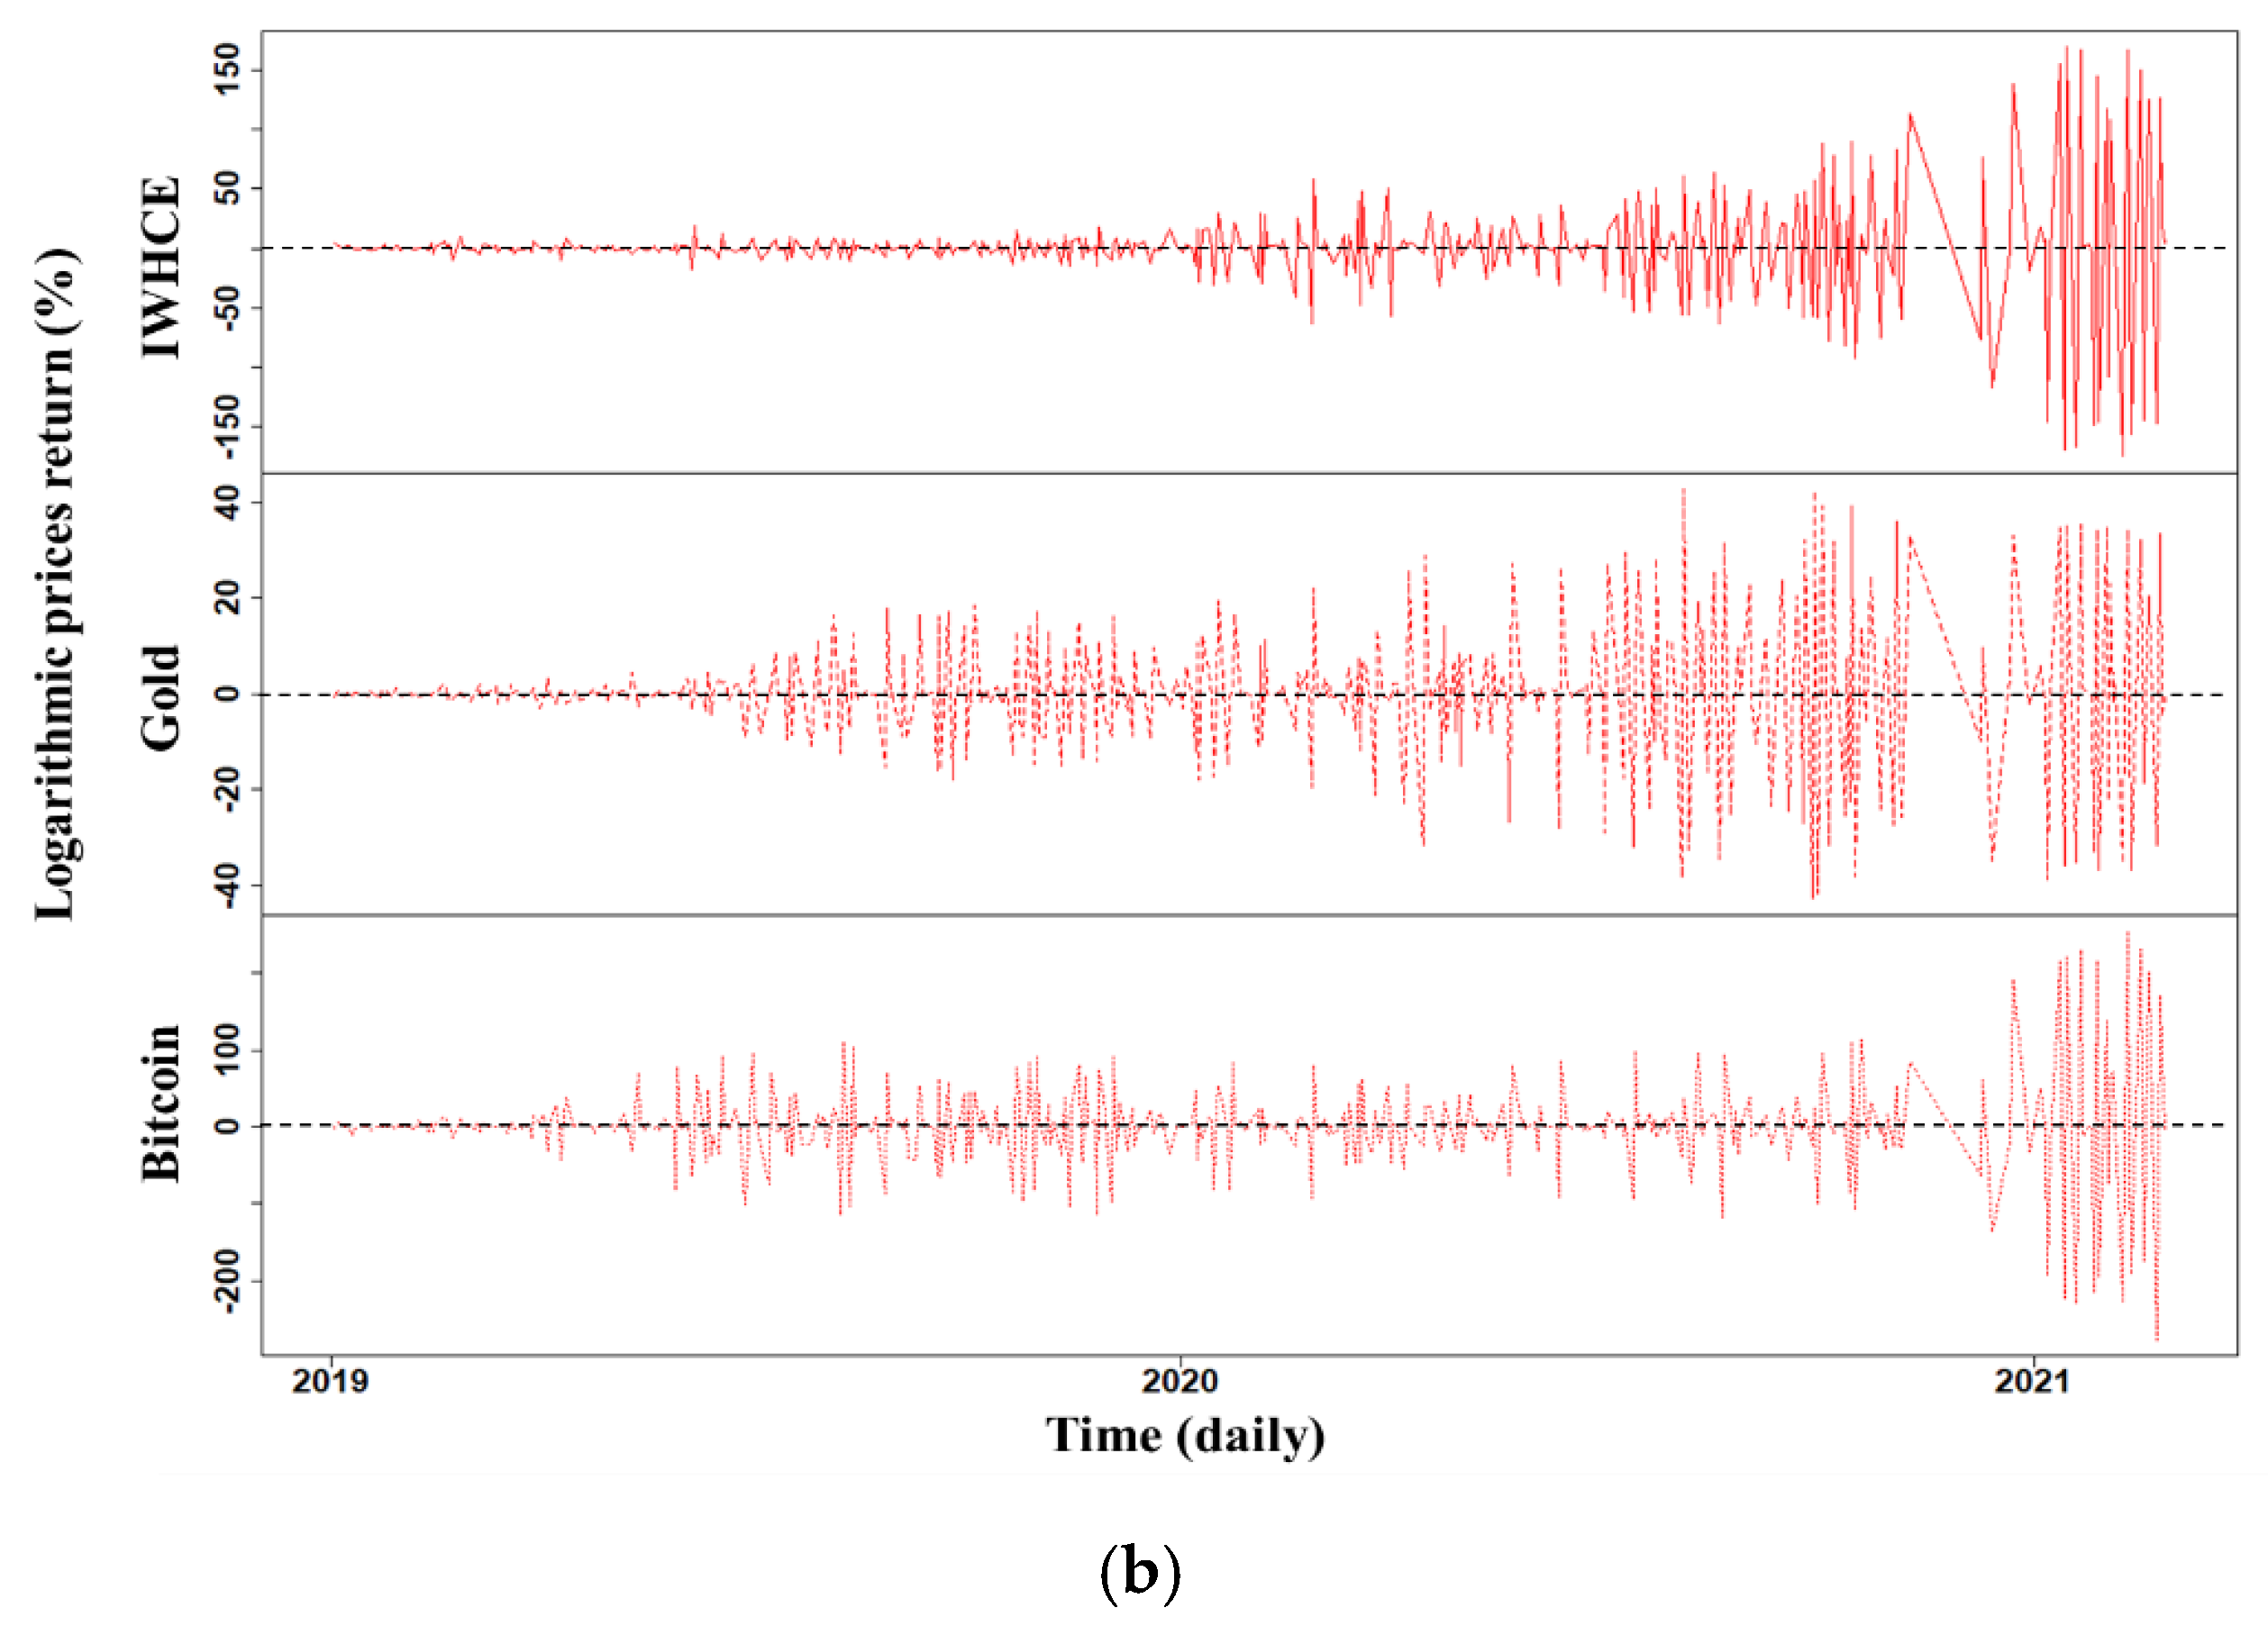
The DCC-MGARCH models require price returns data; therefore, the percentage of continuously compounded returns is computed by = 100 × [ln() − ln()], where denotes the US fossil fuel, IWHCE, gold, and Bitcoin prices in period t. Figure 3 shows the plot of price returns against time.
4. Methods
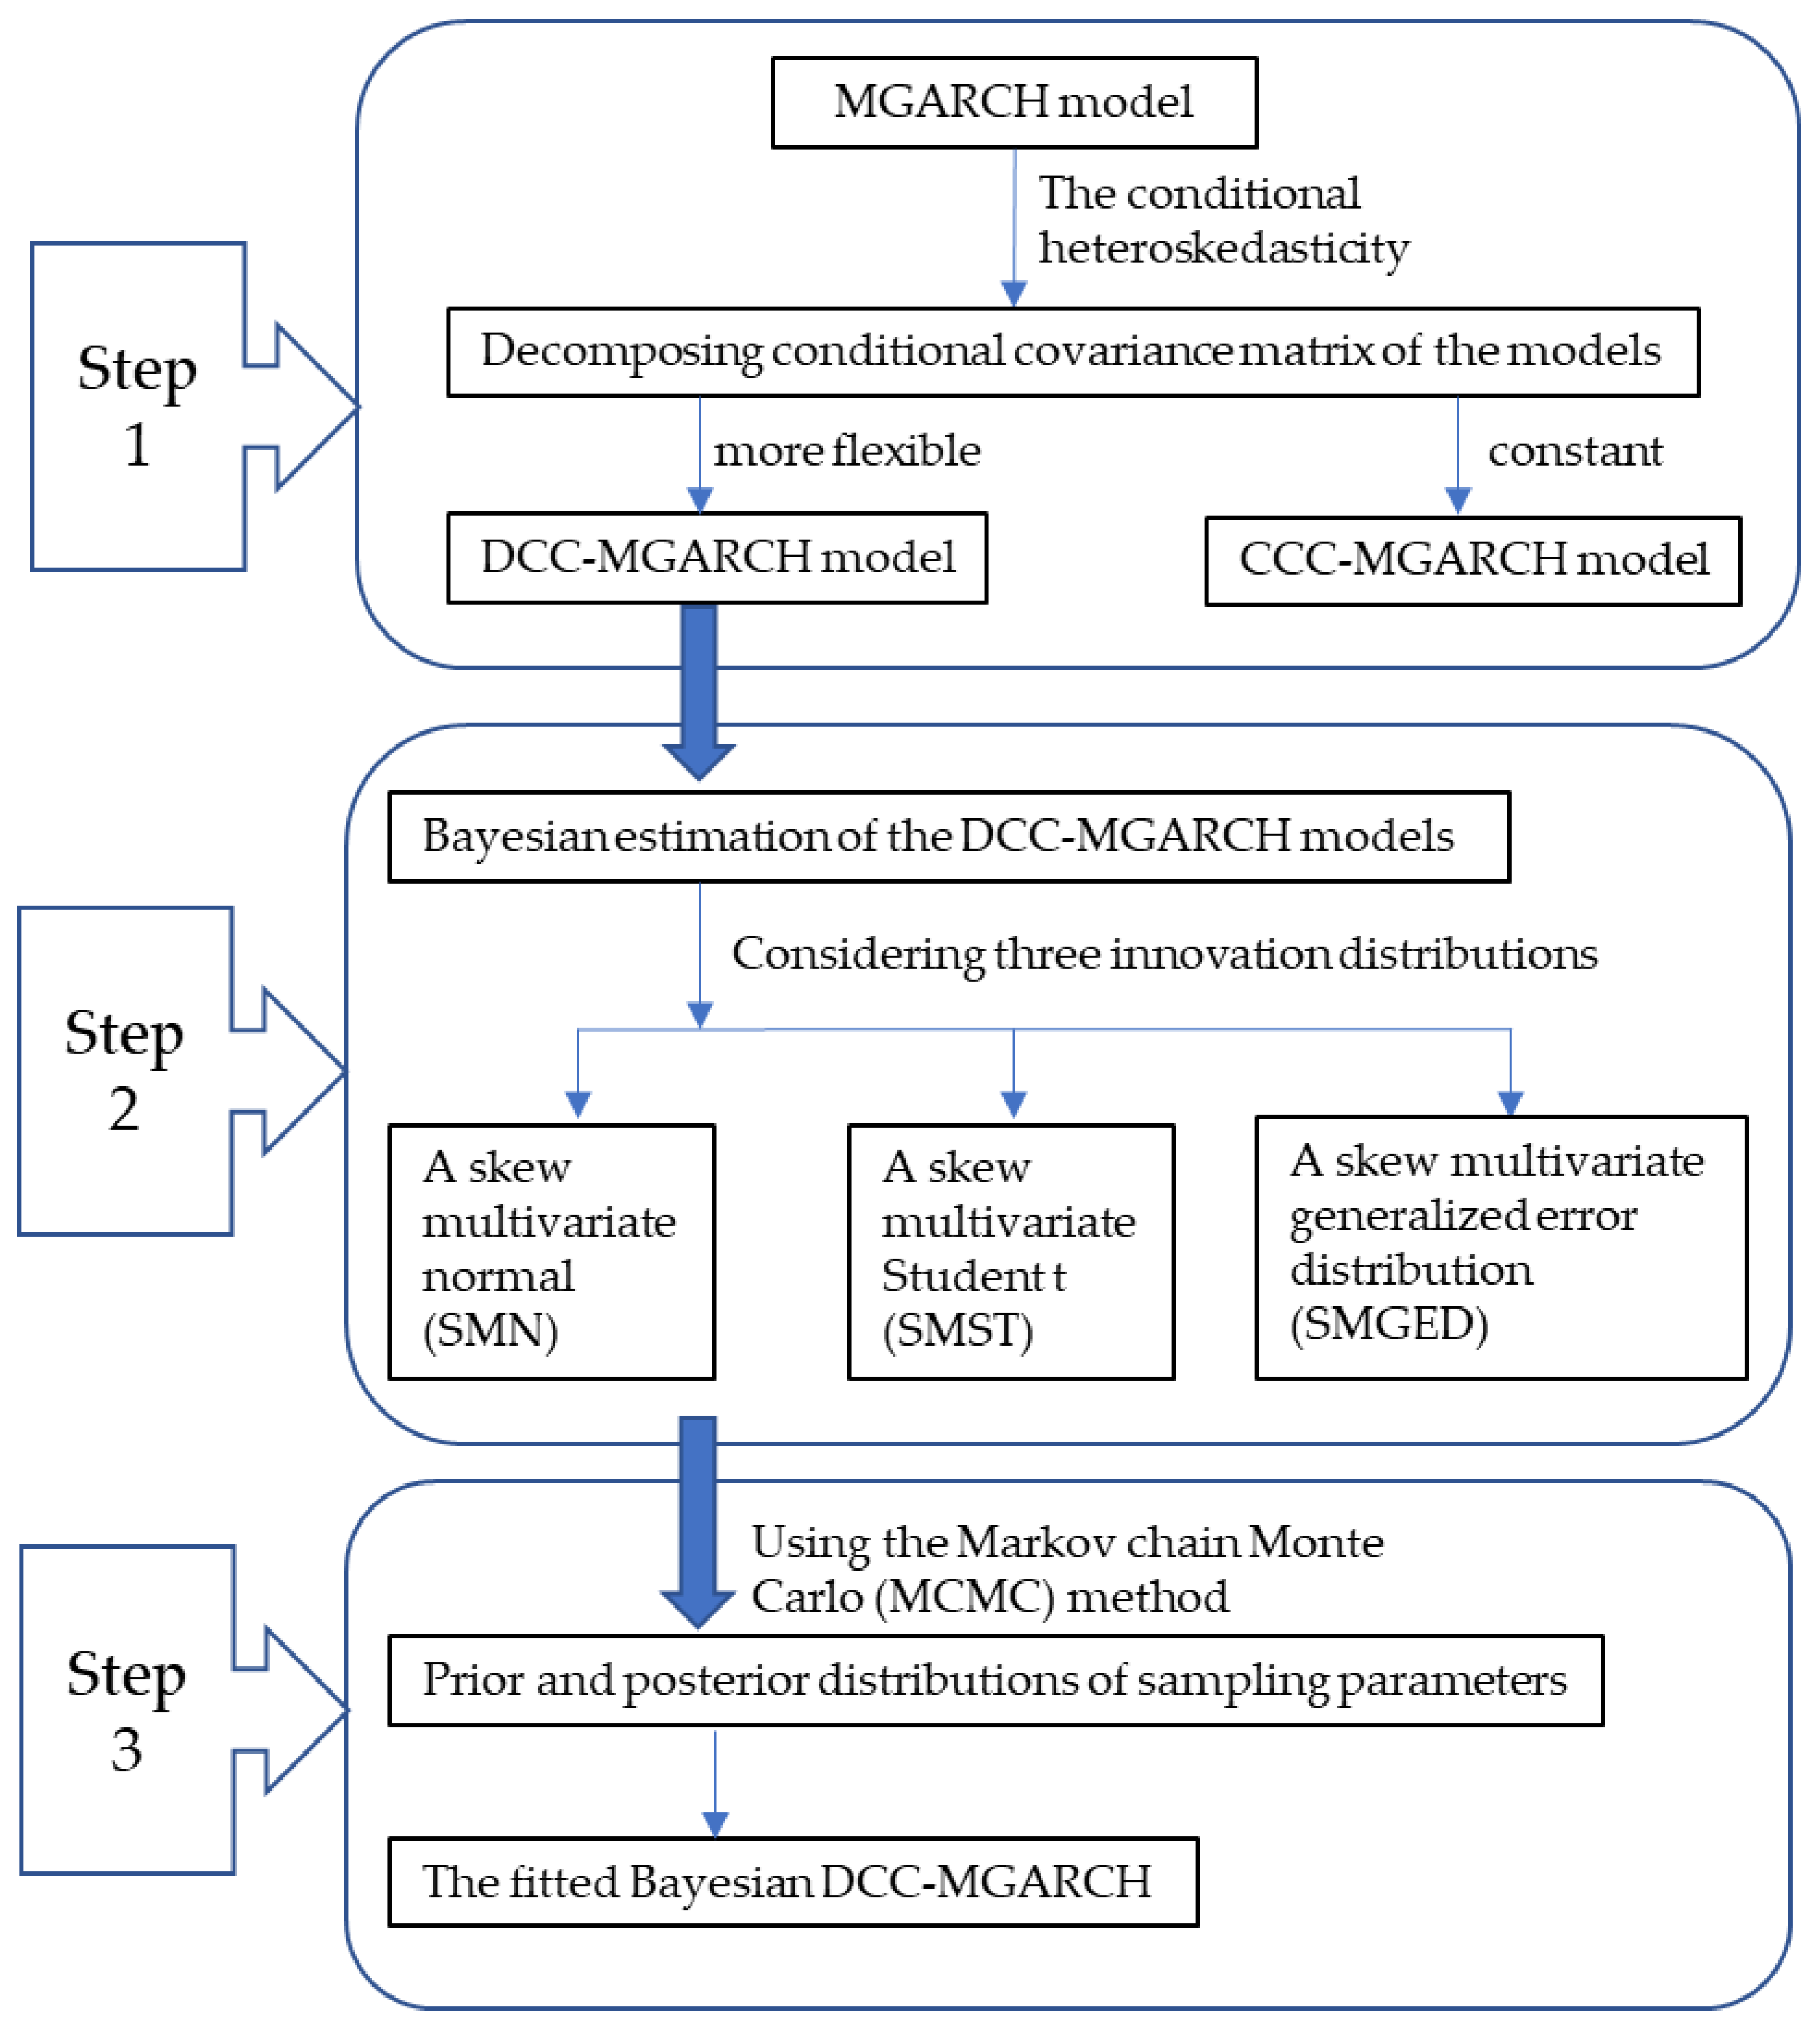
According to the MPT presented in the introduction, we investigated the correlations among the fossil fuel and IWHCE, gold, and Bitcoin price returns for analyzing how the portfolio investment has been affected during the COVID-19 pandemic. To this end, we used the DCC-MGARCH model with Bayesian estimation. In the Bayesian DCC-MGARCH model framework, we present our methods in three steps: the MGARCH model, the Bayesian estimation of the models, and estimating the posterior distribution using Markov Chain Monte Carlo (MCMC). The summary of the steps is shown in Figure 4.
4.1. DCC-MGARCH Models (Step 1)
We employ the DCC-MGARCH model to study the connectedness of fossil fuels and the conditional heteroskedasticity IWHCE, gold, and Bitcoin markets during the COVID-19 period. The MGARCH model was developed by many researchers with the examples of Engle and Sheppard [39], Bauwens et al. [40], Silvennoinen and Teräsvirta [41], and Tsay [42]. Since the MGARCH model is the conditional heteroskedasticity, the conditional covariance matrix of the models can be decomposed into conditional standard deviations and a conditional correlation Matrix. Moreover, the conditional correlation can be assumed to be constant and dynamic over time.
The CCC-MGARCH model introduced by Bollerslev [43] is preferable if the conditional correlation is constant over time and the conditional standard deviation is time-varying. However, the conditional correlation is not always constant over time [3,13] and it is known that the DCC-MGARCH is more flexible than the CCC-MGARCH for examining the co-movements between different markets [13]. Thus, the DCC-MGARCH model is applied in our study.
According to Engle and Sheppard [39], the DCC-MGARCH model is defined as:
where is a vector of log prices of prices at time t, is a vector of the expected value of , is a vector of mean-corrected returns of n assets at time t with = 0 and = . is a conditional variance matrix of return and is obtained by a Cholesky factorization of . is a vector of identically independently distributed () errors with E() = 0 and = . is a diagonal matrix of standard deviations of return . is the time-varying correlation matrix.
Next, we explain the details of the decomposition for the matrix based on Engle and Sheppard [39].
First, the diagonal matrix in Equation (3) is specified as a univariate GARCH model, which is expressed as:
where is the conditional covariance. Here we specify a GARCH (p, q) model for each conditional covariance , which can be written as:
where . Note that the subscripts p and q are the lag lengths. The GARCH model is not limited to the standard GARCH (p, q) and the optimal lag order is chosen by the Bayesian calculation process. We used the simplest GARCH(1,1) following Fioruci, Ehlers, and Filho [44].
Second, we would like to note that the time-varying conditional correlation in Equation (3) is a symmetric matrix:
Third, the elements of in Equation (2) can be expressed as follows:
where is a time-varying conditional correlation between returns series and . If and only if , is positive definite and is positive definite.
Finally, the proposed symmetric dynamic correlation structure is:
where is the unconditional covariance matrix of the standardized errors . In addition to the conditions for the univariate GARCH model to ensure positive unconditional variances, the parameters and are , , and . The is the diagonal matrix with the square root of the diagonal elements of . The can be written as:
Hence, the typical element of have the form .
4.2. Bayesian Estimation of the DCC-MGARCH Models (Step 3)
Multivariate Skew Densities
To estimate the parameters of the DCC-MGARCH model, the Bayesian approach is used. In the Bayesian approach, the skewness in the distributions of errors has to be considered for calculating the parameters because financial time series data are often skewed [44]. Therefore, for the distributions of the errors, the in Equation (2), we consider three different innovation distributions: a skew multivariate normal (SMN) [45], a skew multivariate Student t (SMST) [45], and a skew multivariate generalized error distribution (SMGED) [42] to fit the Bayesian DCC-MGARCH.
According to Kotz and Nadarajah [46], the multivariate skewed densities can be written as:
where is a symmetric multivariate density, if and if . is a shape parameter to judge the class of skewed distributions. If the values of is 1 (), the density distributions would be symmetric, and the values of indicate right (left) skewness. The parameter also can be used to compute the mean and variance . The details of the calculations are explained in Fioruci, Ehlers, and Filho [40].
Given the extra degrees of freedom parameter to Equation (8) based on Fioruci, Ehlers, and Filho [44], the SMST has density functions given as follows:
where if and if .
Moreover, if the parameter is to be () in Equation (8), we would obtain the SMN density.
Finally, according to Fioruci, Ehlers, and Filho [44], the SMGED is also known as multivariate exponential power distribution. Its density function can be written as:
where is a common tail parameter, if and if .
Therefore, if the errors in Equation (2) are assumed to be SMN, there would be no extra parameter to be estimated. However, the extra degrees of freedom parameter will be estimated [45] when the errors are SMST, and the extra parameter will be calculated when the errors are SMGED.
4.3. Estimating the Posterior Distribution (Step 3)
4.3.1. Prior and Posterior Distributions
According to Equations (4), (9) and (10), the set of all model parameters of interest is represented by . Following the Bayesian theory, the prior distributions need to be specified for these parameters, where the parameters are assumed to be a priori independent and normally distributed. First, according to Ardia [47], the prior distributions of parameters and are given by , and , . Secondly, the prior distributions of the tail parameters are assumed as or when the errors are SMST or SMGED. Finally, for the skewness parameters, is set to be based on Fioruci, Ehlers, and Filho, [44].
The Markov chain Monte Carlo (MCMC) method in the framework of Bayesian Inference was used to obtain samples from the joint posterior distributions. The Metropolis-Hastings algorithm is applied to provide the easiest sampling.
4.3.2. The Performance of the Fitted Bayesian DCC-MGARCH
Because three different innovation distributions are considered to fit the Bayesian DCC-MGARCH, we applied the Akaike Information Criterion (AIC), Bayesian Information Criterion (BIC), and Deviance Information Criterion (DIC) to choose the best DCC-MGARCH model. The AIC, BIC, and DIC are used to determine the best fitted DCC-MGARCH models.
It is essential to understand the statistical characterization for the fossil fuel and clean energy, gold, and Bitcoin price returns series before identifying the fitted DCC-MGARCH model. On the one hand, to avoid pseudo-regression problems, we applied the Augmented Dickey–Fuller (ADF), Phillips–Perron (PP), and Kwiatkowski–Phillips–Schmidt–Shin (KPSS) tests to identify the stationarity of our test variables. On the other hand, we used the Shapiro–Wilk (SW) and Jarque–Bera (JB) tests to detect the normality, skewness, and kurtosis of the sample distribution. Moreover, Engle’s Lagrange multiplier (LM) test is applied to identify the effects of autoregressive conditional heteroscedastic (ARCH) for each of the returns.
5. Result and Discussion
5.1. Descriptive Summary of All Prices and Return Series Data
Table 2 presents the unit root test for all the prices and returns series data. The ADF, PP, and KPSS test results in Table 2 show that the null hypothesis of non-stationarity is rejected at a 5% level of significance in each of the returns series, but each of the price series becomes stationary from the first difference.
Table 3 presents the results of summary statistics. The JB statistic is statistically significant at the 1% level, indicating that all the returns series have skewness and excess kurtosis. Moreover, the SW statistic is also statistically significant at the 1% level, which indicates that the returns series do not come from a normally distributed population. Thus, according to the SW and JB statistics, all return series are violations of normality assumptions. This implies that it is necessary to consider their asymmetric distributions. Moreover, the results of Engle’s LM test are statistically significant at the 1% level, which indicates that ARCH effects exist for all returns series. As a result, there are three possible Bayesian DCC-MGARCH (1,1) models to be fitted using the SMN, SMST, and SMGED as innovations.
5.2. Bayesian Estimation of the Dynamic Conditional Correlation-Multivariate Generalized Autoregressive Conditional Heteroskedasticity (1,1) Model
For the MCMC method in the framework of Bayesian inference [44], we ran 10,000 iterations with a burn-in phase of 1000 and a thinning interval of 10 in the MCMC sampling. The remaining 9000 samples generated from the posterior distribution were kept for the estimation of each parameter sample. Table 4 reports the results of the information criteria of the AIC, BIC, and DIC, which are to identify the goodness of fit statistics for the Bayesian DCC-MGARCH (1,1) models with the SMN, SMST, and SMGED errors. As seen in Table 4, the values of the AIC, BIC, and DIC are the smallest for all return and bivariate series under the SMGED, which indicates that the Bayesian DCC-MGARCH model with SMGED errors provided a better fit compared to other models [44]. This is because it is more likely to capture the fat tails and skewed features present in the prices of clean energy stocks, Bitcoin, and gold [13].
Table 5 shows the results of the DCC-MGARCH (1,1) model with the SMGED errors for all returns based on Bayesian estimation by the MCMC method. The table consists of the posterior means, medians, and standard deviation with 2.5% to 97.5% credible intervals. First, according to the 95% credible intervals, the estimated posterior densities of the skewness parameters in Equation (10) are statistically significant because their mean is included in the 95% credible intervals. According to Fioruci, Ehlers, and Filho [44], these results provide strong evidence of asymmetry for all returns. Next, the conditional variance parameters and are statistically significant at 95% credible intervals, while the values of are less than 1, which indicates the existence of GARCH effects for all returns [48]. Finally, the extra parameter also statistically and significantly implies that the model with the SMGED is applicable.
Table 6 reports the Bayesian DCC-MGARCH (1,1) model with the SMGED errors for the bivariate combinations of the returns of clean energy, Bitcoin, and gold. As seen from the tables, it is easy to confirm that all estimated parameters in Equations (4), (6), (9) and (10) are significant at 97.5% credible intervals. Based on parameters and results, the CCC model hypothesis ( = = 0) is rejected, indicating that the DCC parameters and are satisfied with the model. Moreover, it is easy to calculate that the values of + in all bivariate models are less than 1, which implies that the time-varying conditional correlations measured by the Bayesian DCC-MGARCH model with the SMGED are credible.
5.3. The Time-Varying Conditional Correlations
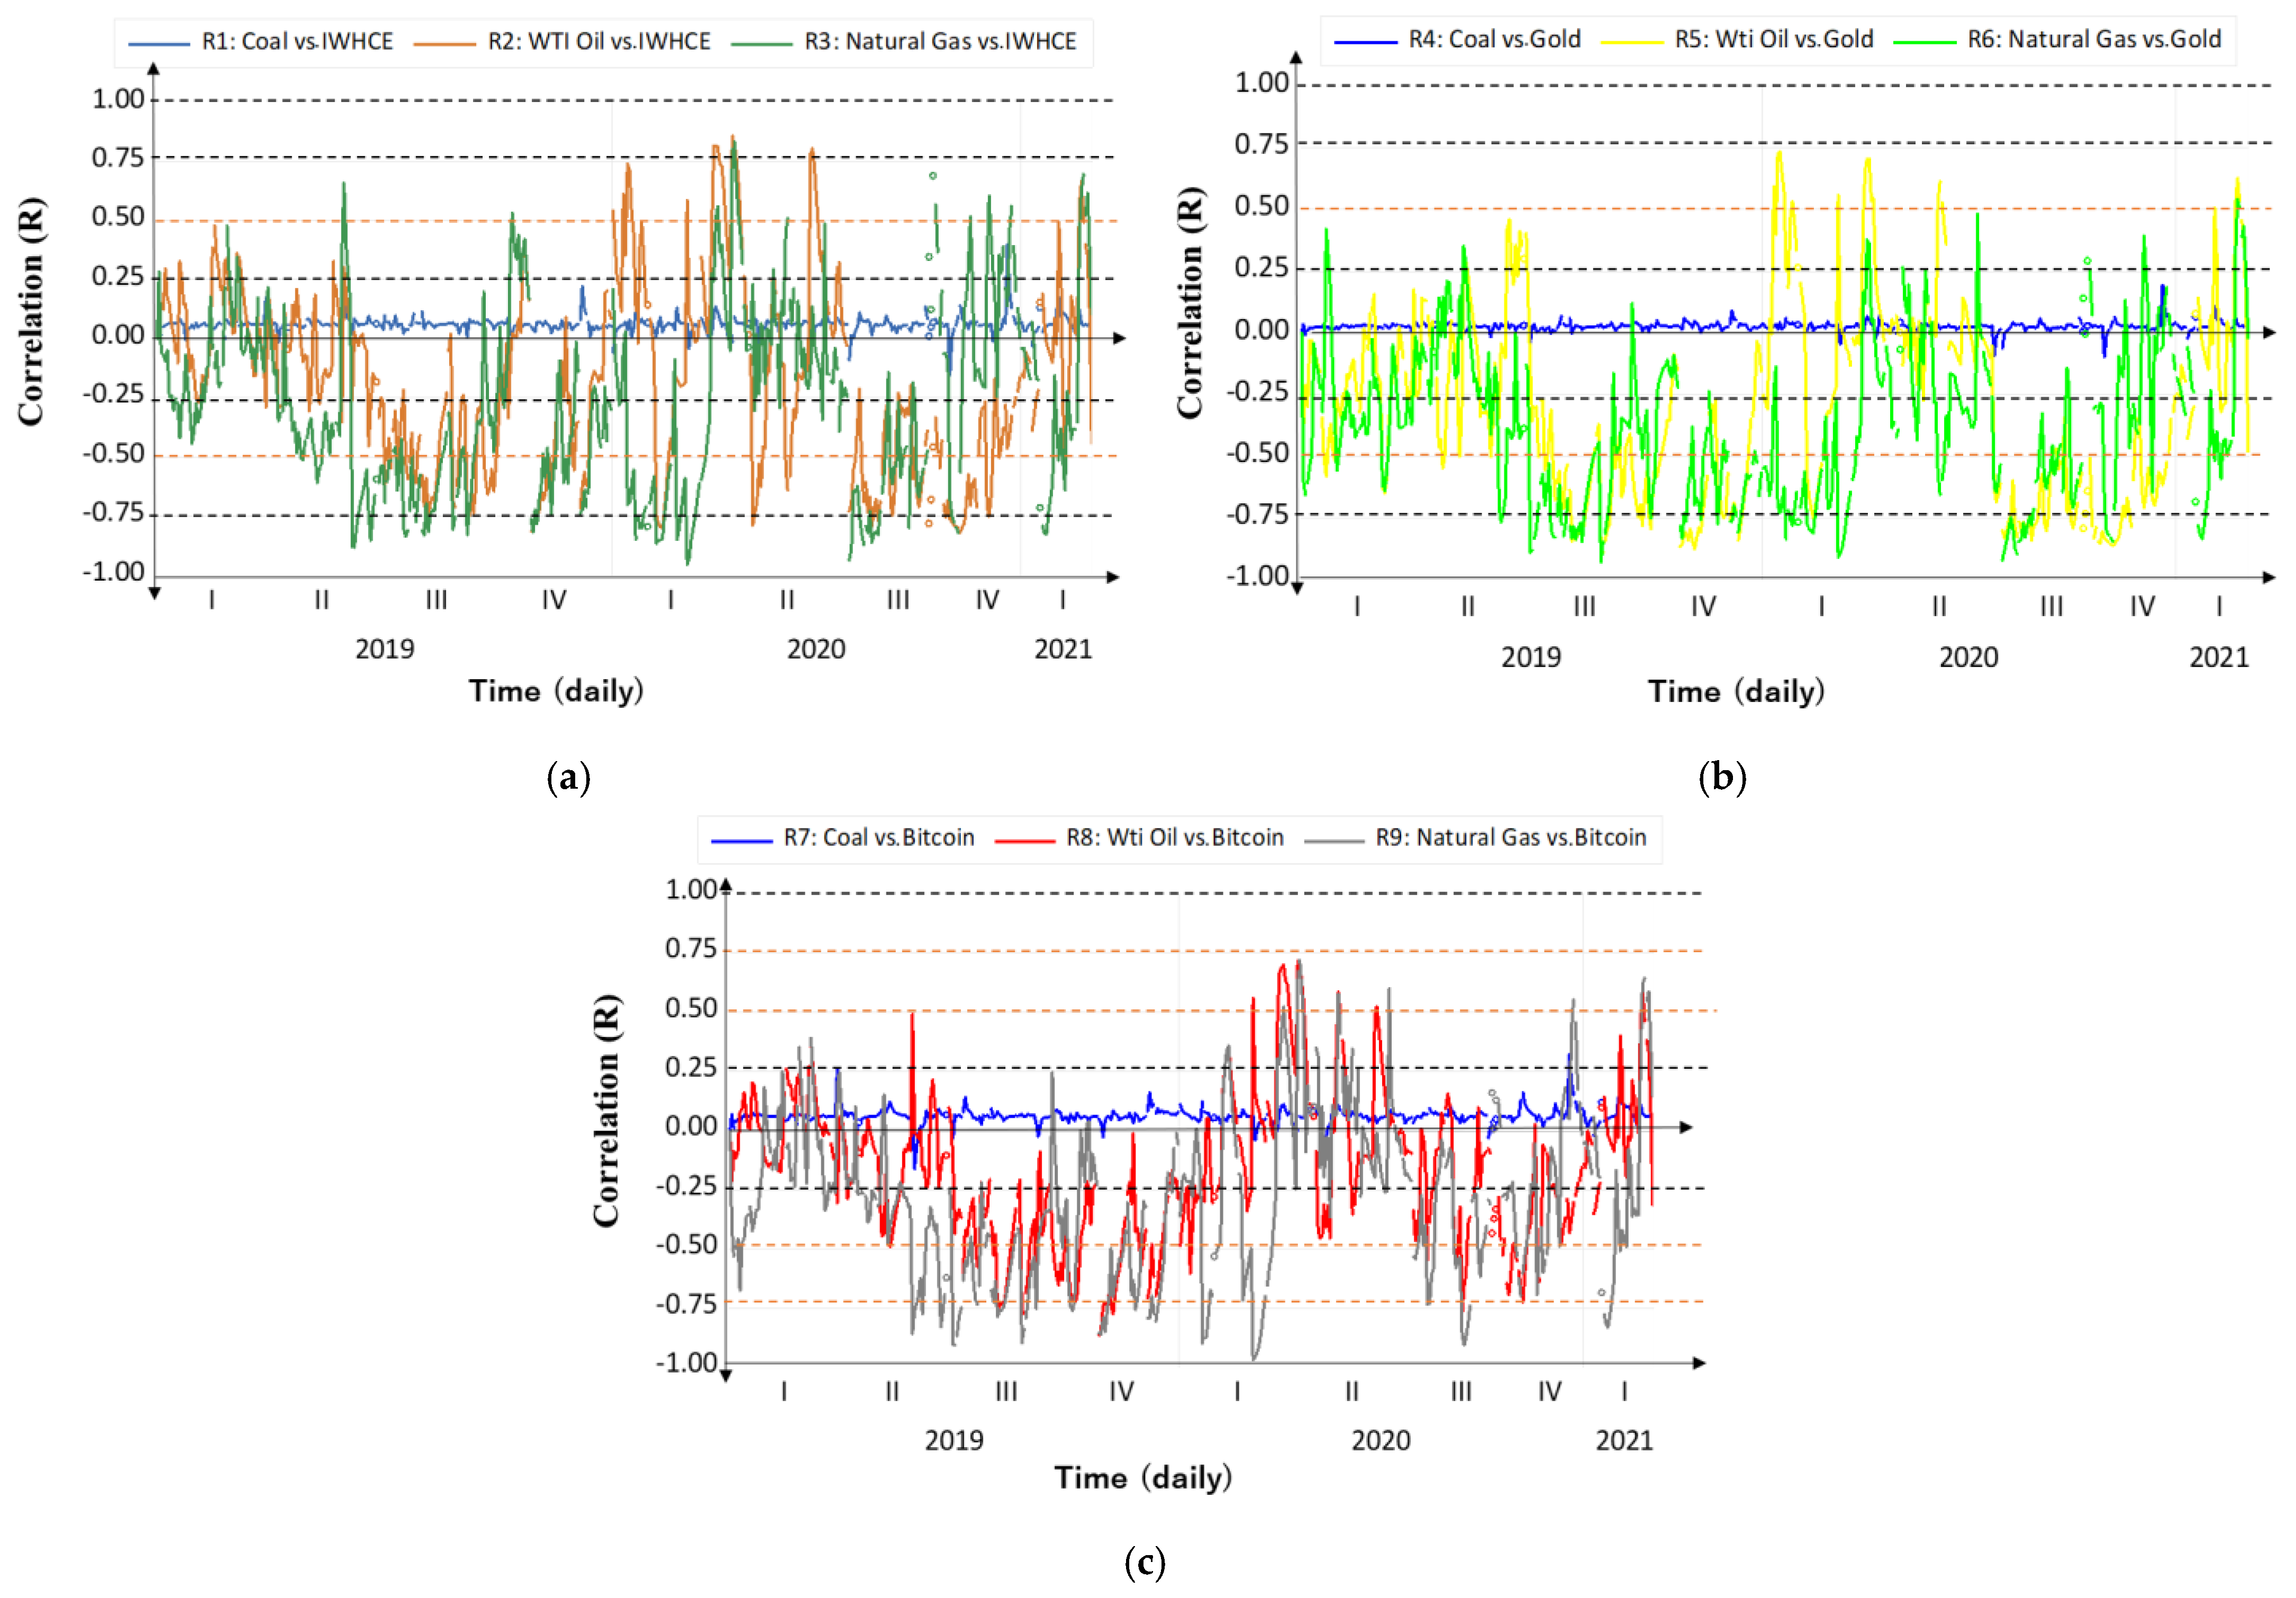
Based on the results in Table 4, we applied the Bayesian DCC-MGARCH model with the SMGED to estimate the time-varying conditional correlations ( in Equation (3)) between the fossil fuel and financial markets.
The results of the fossil fuel relation to IWHCE are shown in Figure 5a. Noteworthily, during the COVID-19 period, the correlations between IWHCE and coal were almost positive values, and the fluctuation range was smaller compared to that of IWHCE and WTI oil and natural gas (Figure 5a: R1). The nexus between IWHCE and WTI oil fluctuated between positive and negative correlation values (−0.8 to 0.8) before and after 2020, while it became a negative correlation from June 2020 to January 2021 (Figure 5a: R2). In addition, the relationship between IWHCE and natural gas fluctuated between positive and negative correlations from 2020 to 2021 (Figure 5a: R3). The results in Figure 5a indicate that the IWHCE relation to oil and natural gas was stronger than the correlation between IWHCE and coal, and that their relationship shifted from negative to positive after 2020 because IWHCE, oil, and natural gas in the US were all affected by COVID-19 [49].
Figure 5b shows the DCC-conditional correlations between fossil fuels and gold. It is evident from Figure 5b that the correlation between coal and gold was also almost positive and that there was only a small fluctuation range before and after the COVID-19 period (Figure 5b: R4). While the relationship between WTI and natural gas and gold was stronger, alternating between positive (0.8) and negative values (−0.8) (Figure 5b: R5, R6), their relationship also changed from negative to positive after the pandemic as seen in Figure 5a. From Figure 5c, we can observe that the correlation between fossil fuels and Bitcoin fluctuated between positive and negative in the COVID-19 period, and the relationship between Bitcoin and WTI oil and natural gas also became stronger, but not as strong as the correlation between fossil fuels and IWHCE and gold. This may be because Bitcoin acts only as a diversifier for fossil fuel portfolio investments [3].
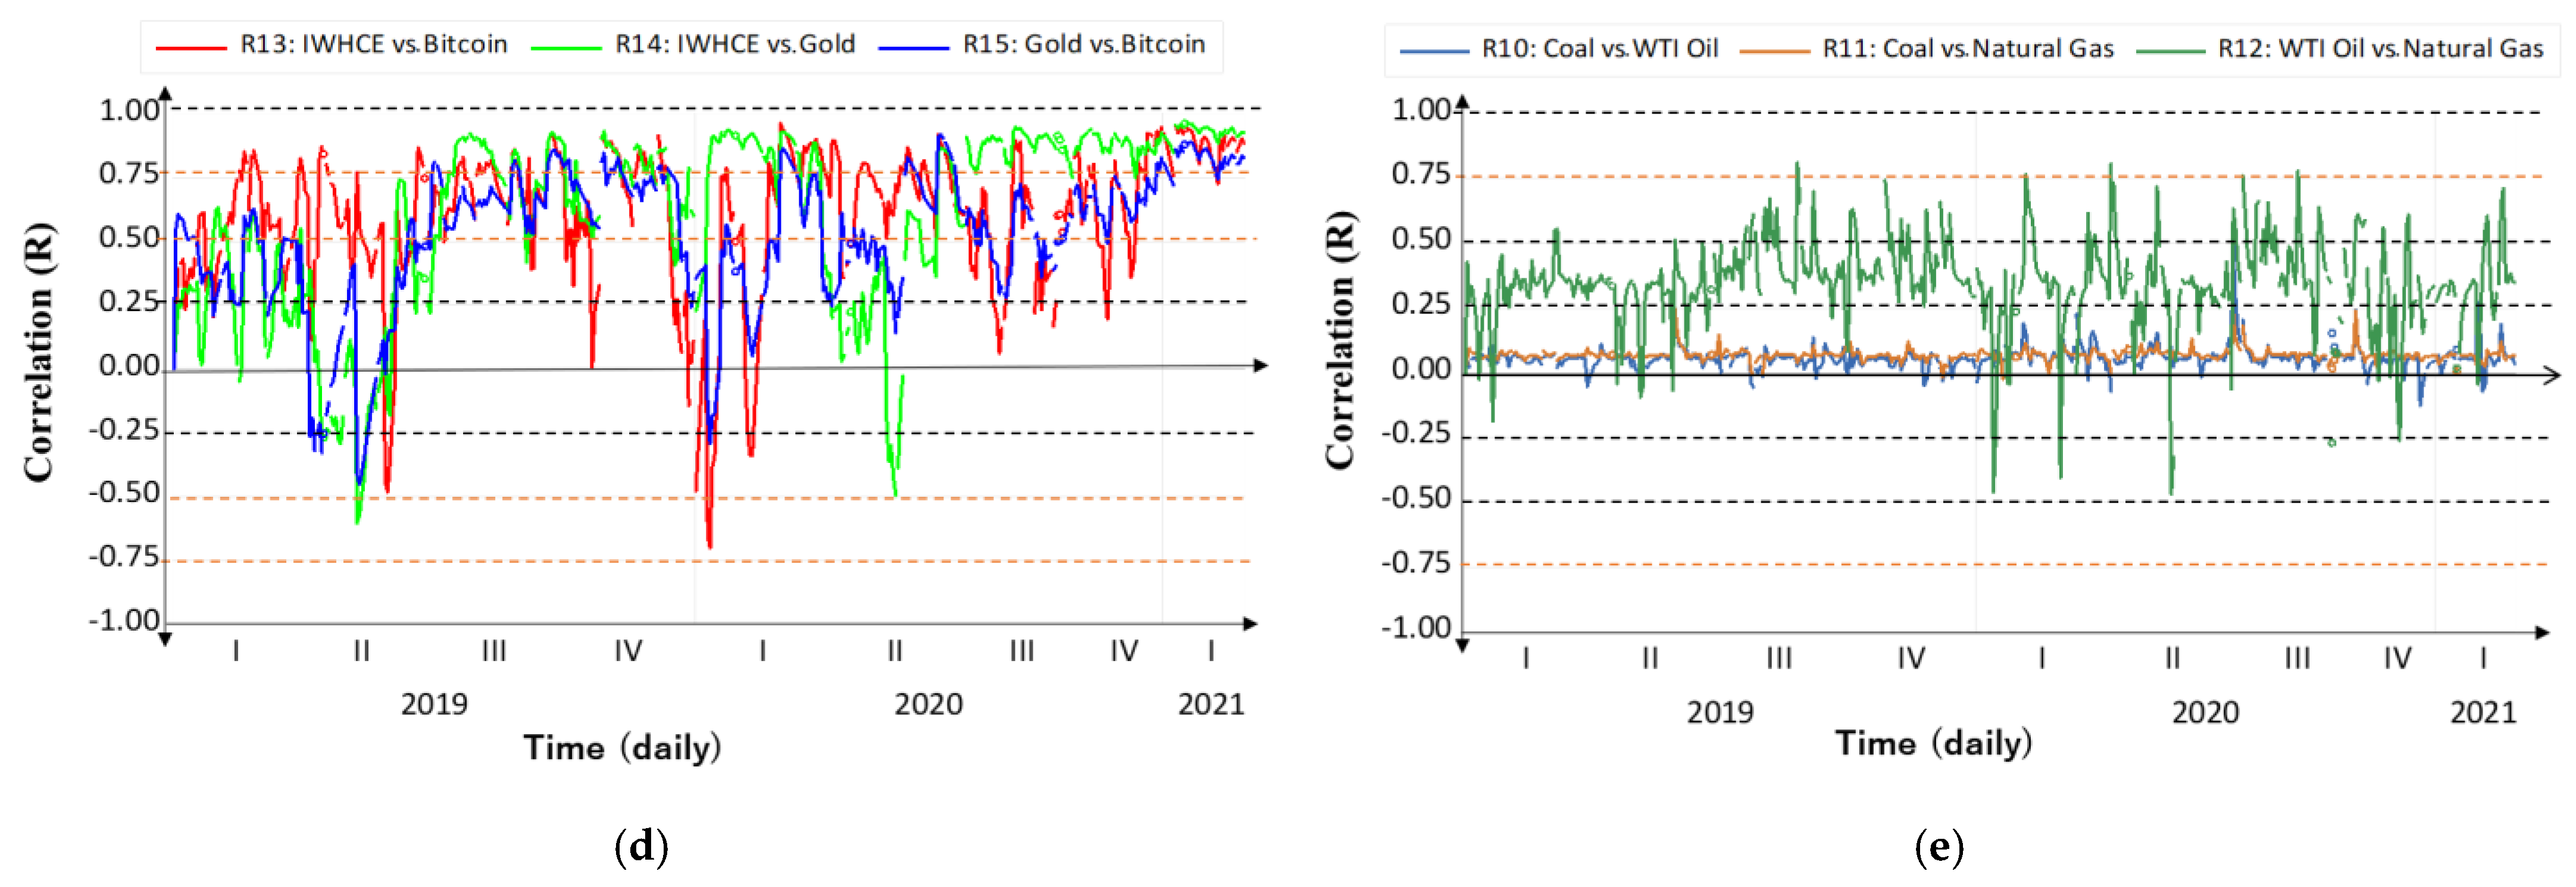
Finally, Figure 5d displays the correlation among coal, natural gas, and WTI oil, while Figure 5e focuses on the linkage among IWHCE, Bitcoin, and gold. Noteworthily, the magnitude of IWHCE and gold correlation displayed higher positive values (Figure 5d): R14) before and after the COVID-19 period. There is also a minor, positive relationship between coal and WTI oil and natural gas, with the correlation of WTI and natural gas being stronger during the COVID-19 period (Figure 5e).
5.4. Discussion
In this study, we found a GARCH effect between fossil fuels and their hedging assets based on the LM test. This implies that the volatility between them is related. Moreover, we also suggest that the Bayesian DCC-MGARCH model with the SMGED is credible for estimating the DCC conditional correlations between them. As per the results shown in Table 6, we can conclude that the values of a + b in Equation (6) are less than 1 in all bivariate models, indicating the existence of time-varying conditional correlations. This implies that the conditional correlations between fossil fuels and their hedging asset price returns are time-varying during the pandemic period. This confirms the result of Zhang et al. [8] revealing that the linkage between energy and the stock market is dynamic in the context of COVID-19. We also confirm that the WTI oil and natural gas nexus with their hedging assets tend to have a stronger negative correlation before the pandemic and a stronger positive correlation value after the pandemic (Figure 5).
A possible reason for this is as follows. In order to mitigate their risks, energy investors in oil and natural gas usually need to make a portfolio plan based on MPT. In this theory, a negative or low correlation is a key concept for creating diversified portfolios that can better withstand portfolio volatility. Gold, clean energy stocks, and Bitcoin are most likely to be selected as hedging assets to diversify investment portfolios in the energy market [3]. This might indicate that crude oil and natural gas have a stronger negative correlation with these markets before the pandemic because diversification works best when the assets are negatively correlated with one another, such that, as some parts of the portfolio fall, others rise. However, during the early days of the pandemic, crude oil and natural gas in the US suffered from negative influences related to COVID-19 ([49,50]), as did the IWHCE [8], gold, and Bitcoin markets [3]. This means that, when a pandemic occurs, investors may panic and simultaneously sell crude oil, natural gas, IWHCE, and other relatively risky assets to buy relatively low-risk or low-correlation assets such as bonds. This behavior triggered by panic will cause the market prices of these assets to decline simultaneously; thus, their volatility correlation may also become positive after the pandemic.
In particular, we also find that the relationship between WTI oil and natural gas and its hedging assets has a stronger positive correlation value after the pandemic. This implies that the effect of portfolio investment between fossil fuel and clean energy stock, gold, and Bitcoin to diversify risks through negative correlation may not be as significant during the pandemic. This result is consistent with the findings of So et al. [12], pointing out that the hedging effect in a diversified portfolio weakened due to the high positive correlation of financial markets during the pandemic. However, this finding also contradicts Dutta et al. [3] suggesting that gold has either negative or zero correlations with the oil indexes during the COVID-19 period.
Furthermore, we also find that the relationships among the fossil fuel and financial assets only became positive for the short-term and their relationship returned negative in mid-2020. As Waggle and Agrrawal [51] define three to six months as an indicator for short-term investments, our result might be implying that the impact of the COVID-19 pandemic on their relationship was only sustained for the short-term. This indicates that for the long term, the stakeholders in the fossil fuel markets were able to cross hedge their portfolios with the financial assets.
Therefore, the changes in the relationships among the fossil fuel and financial markets due to the COVID-19 pandemic became apparent in the short run but might not be as prevalent in the long term. This result is somewhat different from Chang et al. [7], suggesting that the dynamic relationships between the fossil fuel and clean energy stock markets were dramatically affected in both the short and long run.
6. Conclusions
Our study employed the Bayesian DCC-MGARCH model to examine how the correlation between the fossil fuel and clean energy stock, gold, and Bitcoin market is changing since the COVID-19 pandemic took place. The study identifies that the Bayesian DCC-MGARCH model with the skew multivariate generalized error distribution is credible for fossil fuel, clean energy stock, gold, and Bitcoin market to estimate the time-varying conditional correlations between them. Our results suggest that the fossil fuel relation to clean energy stock, gold, and Bitcoin market are changing, and they have almost become positively correlated since the pandemic occurred. It is important for fostering energy and financial market stability and choosing optimal hedging strategies that minimize the diversification of risk under the situation of the pandemic. Thus, the study can offer a valuable reference for policymakers and energy traders to help their decision-making in the future.
Moreover, our results show that during the COVID-19 pandemic, the relationship between the fossil fuel (WTI oil and natural gas) and financial (IWHCE, gold, and Bitcoin) assets changed from a negative correlation to a stronger positive correlation in the short term; three to six months. However, such a positive correlation did not last for more than six months and the correlation returned negative within less than six months. This positive correlation between fossil fuels and the financial market indicates difficulties for cross-market investors to hedge across these markets in the short term. Therefore, investors should be cautious in hedging the risk across the fossil fuel and financial markets for the short term when the shock from the pandemic is evident. However, our result suggests that hedging across the fossil and financial markets is still effective for the long term when the shock of the pandemic on markets is weakening.
Our findings have some significant implications for investors and energy policymakers that are cross-hedging among the fossil fuel and financial markets.
First, as the COVID-19 pandemic did change the correlations among fossil fuel and financial markets to become positive in the short term, the stakeholders to secure fossil fuel energy should note that hedging across the fossil fuel and financial markets becomes difficult in the short term. Hence, the study provides evidence that a shock like COVID-19 makes it difficult for the market participants to hedge the price risk involved in the fossil fuel market in the short term.
Second, given that the correlations among fossil fuel and financial markets returned to negative within less than six months, the optimal hedging strategies that minimize the risk in the short and long term based on the MPT can be still effective for the long term. Thus, this indicates that hedging the price risk in fossil fuel can be still mitigated by cross-hedging with financial assets like renewable energy stock, gold, and Bitcoin in the long term. This implies that keeping track of the relationships among the fossil fuel and financial markets in the long term is important for stakeholders in the fossil fuel market to conduct a sustainable energy supply.
One limitation of this study is that the fossil fuel relation to IWHCE, gold, and Bitcoin markets was considered only during the pandemic. In future research, we should focus on the volatility spillovers between all energy and financial markets to identify which market is the transmitter/receiver of volatility to manage risk in cross-market investment during this pandemic.
Author Contributions
Conceptualization, C.T. and K.A.; methodology, C.T. and K.A.; software, C.T. and K.A.; validation, C.T. and K.A.; formal analysis, C.T. and K.A.; investigation, C.T. and K.A.; resources, C.T. and K.A.; data curation, C.T. and K.A.; writing—original draft preparation, C.T. and K.A.; writing—review and editing, C.T. and K.A.; visualization, C.T. and K.A.; supervision, C.T. and K.A.; project administration, C.T. and K.A.; funding acquisition, K.A. All authors have read and agreed to the published version of the manuscript.
Funding
This research received no external funding.
Data Availability Statement
Our data are downloadable from the homepages of the Statistics Database: INSIDER https://markets.businessinsider.com/ (accessed on 8 May 2021), Yahoo finance https://finance.yahoo.com/quote/BTC-USD/history/ (accessed on 8 May 2021), and GOLDHUB https://www.gold.org/goldhub/data/gold-prices (accessed on 8 May 2021).
Conflicts of Interest
The authors declare no conflict of interest.
Abbreviations
| US | United States |
| JB | Jarque–Bera |
| SW | Shapiro–Wilk |
| PP | Phillips–Perron |
| ADF | Augmented Dickey–Fuller |
| KPSS | Kwiatkowski–Phillips–Schmidt–Shin |
| LM | Lagrange Multiplier |
| AIC | Akaike Information Criterion |
| DIC | Deviance Information Criterion |
| BIC | Bayesian Information Criterion |
| IWHCE | Invesco Wilder Hill Clean Energy |
| MPT | Modern Portfolio Theory |
| CSSD | Cross-section Standard Deviation |
| STECM | Smooth Transition Error Correction Model |
| ARDL | Autoregressive Distributed Lag |
| DCC-MIDAS | Dynamic Conditional Correlation with Mixed Data Sampling |
| IEA | International Energy Agency |
| WTI | West Texas Intermediate |
| DCC | Dynamic Conditional Correlation |
| CCC | Constant Conditional Correlation |
| ARCH | Autoregressive Conditional Heteroscedastic |
| GARCH | Generalized Autoregressive Conditional Heteroskedasticity |
| MGARCH | Multivariate GARCH |
| MCMC | Markov Chain Monte Carlo |
| SMN | Skew Multivariate Normal |
| SMST | Skew Multivariate Student t |
| SMGED | Skew Multivariate Generalized Error Distribution |
| ML | Maximum Likelihood |
| CSAD | Cross-section Absolute Deviation |
| MODWT | Maximal Overlap Discrete Wavelet Transformation |
| EGARCH | Exponential GARCH |
| VAR | Vector Autoregressive |
Appendix A

Table A1.
List of Basic Concepts.
| Basic Concept | Appropriate Explanations |
|---|---|
| Haven asset | Baur and Lucey [11] proposed the concept that an asset is a haven asset if it is negatively correlated or uncorrelated with another asset during crisis periods. |
| Hedging asset | The definition of hedging assets is that if the price of one asset falls while the price of another asset rises, they can be used as a hedge against each other, implying that a hedge is an investment that is made to reduce the risk of adverse price movements in an asset. |
| Modern Portfolio Theory (MPT) assumption | The MPT assumption is that risk-averse investors can construct a portfolio that minimizes risk, which is calculated by a weighted average related to the correlation coefficients of the returns of its component assets. |
| Portfolio risk management | Portfolio risk management is a process that investor attempts to identify, assess, measure, and manage risk within the portfolio based on the MPT theory or risk management strategies. |
| Maximum Likelihood (ML) estimation | The Maximum Likelihood estimation is a method of estimating the unknown coefficients by maximizing a likelihood function which is the joint probability distribution of giving some observed data [52]. |
| Bayesian estimation | Bayesian estimation is an unknown parameter process of sampling the joint posterior parameter distribution through the individual sampling of the posterior distributions, given the prior distribution of data [44]. |
| Dynamic conditional correlation | The Dynamic Conditional Correlation is what you get after decomposing the conditional covariance matrix of MGARCH model [35]. |
References
- Jiang, P.; van Fan, Y.; Klemeš, J.J. Impacts of COVID-19 on energy demand and consumption: Challenges, lessons and emerging opportunities. Appl. Energy 2021, 285, 116441. [Google Scholar] [CrossRef]
- International Energy Agency (IEA). Global Energy Demand to Plunge This Year as a Result of The Biggest Shock since the Second World War. Available online: https://www.iea.org/news/global-energy-demand-to-plunge-this-year-as-a-result-of-the-biggest-shock-since-the-second-world-war (accessed on 2 May 2021).
- Dutta, A.; Das, D.; Jana, R.; Vo, X.V. COVID-19 and oil market crash: Revisiting the safe haven property of gold and Bitcoin. Resour. Policy 2020, 69, 101816. [Google Scholar] [CrossRef]
- Zhang, D.; Hu, M.; Ji, Q. Financial markets under the global pandemic of COVID-19. Financ. Res. Lett. 2020, 36, 101528. [Google Scholar] [CrossRef]
- Yahoo Finance. Available online: https://finance.yahoo.com/quote/BTC-USD/history/ (accessed on 2 May 2021).
- Al-Yahyaee, K.H.; Mensi, W.; Al-Jarrah, I.M.W.; Hamdi, A.; Kang, S.H. Volatility forecasting, downside risk, and diversification benefits of Bitcoin and oil and international commodity markets: A comparative analysis with yellow metal. N. Am. J. Econ. Financ. 2019, 49, 104–120. [Google Scholar] [CrossRef]
- Chang, C.L.; Mcaleer, M.; Wang, Y.A. Herding behavior in energy stock market during the Global Financial Crisis, SARS, and ongoing COVID-19. Renew. Sustain. Energy Rev. 2020, 134, 110349. [Google Scholar] [CrossRef] [PubMed]
- Zhang, H.; Chen, J.; Shao, L. Dynamic spillovers between energy and stock markets and their implications in the context of COVID-19. Int. Rev. Financ. Anal. 2021, 77, 101828. [Google Scholar] [CrossRef]
- Ding, L.; Huang, Y.; Pu, X. Volatility linkage across global equity markets. Glob. Financ. J. 2014, 25, 71–89. [Google Scholar] [CrossRef]
- Markowitz, H. Portfolio selection. J. Financ. 1952, 7, 77–91. [Google Scholar]
- Baur, D.G.; Lucey, B.M. Is Gold a Hedge or a Safe Haven? An Analysis of Stocks, Bonds and Gold. Financ. Rev. 2010, 45, 217–229. [Google Scholar] [CrossRef]
- So, M.K.; Chu, A.M.; Chan, T.W. Impacts of the COVID-19 pandemic on financial market connectedness. Financ. Res. Lett. 2021, 38, 101864. [Google Scholar] [CrossRef]
- Shiferaw, Y.A. Time-varying correlation between agricultural commodity and energy price dynamics with Bayesian multivariate DCC-GARCH models. Phys. A Stat. Mech. Its Appl. 2019, 526, 120807. [Google Scholar] [CrossRef]
- Kumar, S.; Pradhan, A.K.; Tiwari, A.; Kang, S.H. Correlations and volatility spillovers between oil, natural gas, and stock prices in India. Resour. Policy 2019, 62, 282–291. [Google Scholar] [CrossRef]
- Reboredo, J.C.; Rivera-Castro, M.A.; Ugolini, A. Wavelet-based test of co-movement and causality between oil and renewable energy stock prices. Energy Econ. 2017, 61, 241–252. [Google Scholar] [CrossRef]
- Gkillas, K.; Bouri, E.; Gupta, R.; Roubaud, D. Spillovers in Higher-Order Moments of Crude Oil, Gold, and Bitcoin. Q. Rev. Econ. Financ. 2020; in press. [Google Scholar] [CrossRef]
- Cunado, J.; Gil-Alana, L.A.; Gupta, R. Persistence in trends and cycles of gold and silver prices: Evidence from historical data. Phys. A Stat. Mech. Its Appl. 2019, 514, 345–354. [Google Scholar] [CrossRef] [Green Version]
- Lin, M.; Wang, G.-J.; Xie, C.; Stanley, H.E. Cross-correlations and influence in world gold markets. Phys. A Stat. Mech. Its Appl. 2018, 490, 504–512. [Google Scholar] [CrossRef]
- Ruan, Q.; Huang, Y.; Jiang, W. The exceedance and cross-correlations between the gold spot and futures markets. Phys. A Stat. Mech. Its Appl. 2016, 463, 139–151. [Google Scholar] [CrossRef]
- Henriques, I.; Sadorsky, P. Can Bitcoin Replace Gold in an Investment Portfolio? J. Risk Financ. Manag. 2018, 11, 48. [Google Scholar] [CrossRef] [Green Version]
- Wan, D.; Xue, R.; Linnenluecke, M.; Tian, J.; Shan, Y. The impact of investor attention during COVID-19 on investment in clean energy versus fossil fuel firms. Financ. Res. Lett. 2021, 43, 101955. [Google Scholar] [CrossRef]
- Baz, K.; Cheng, J.; Xu, D.; Abbas, K.; Ali, I.; Ali, H.; Fang, C. Asymmetric impact of fossil fuel and renewable energy consumption on economic growth: A nonlinear technique. Energy 2021, 226, 120357. [Google Scholar] [CrossRef]
- Moussa, W.; Mgadmi, N.; Béjaoui, A.; Regaieg, R. Exploring the dynamic relationship between Bitcoin and commodities: New insights through STECM model. Resour. Policy 2021, 74, 102416. [Google Scholar] [CrossRef]
- Rehman, M.U.; Kang, S.H. A time–frequency comovement and causality relationship between Bitcoin hashrate and energy commodity markets. Glob. Financ. J. 2021, 49, 100576. [Google Scholar] [CrossRef]
- Das, D.; Le Roux, C.; Jana, R.; Dutta, A. Does Bitcoin hedge crude oil implied volatility and structural shocks? A comparison with gold, commodity and the US Dollar. Financ. Res. Lett. 2020, 36, 101335. [Google Scholar] [CrossRef]
- Kyriazis, N.A. Is Bitcoin Similar to Gold? An Integrated Overview of Empirical Findings. J. Risk Financ. Manag. 2020, 13, 88. [Google Scholar] [CrossRef]
- Hoang, A.T.; Nguyen, X.P.; Le, A.T.; Huynh, T.T.; Pham, V.V. COVID-19 and the Global Shift Progress to Clean Energy. J. Energy Resour. Technol. 2021, 143, 094701. [Google Scholar] [CrossRef]
- Kanamura, T. A model of price correlations between clean energy indices and energy commodities. J. Sustain. Financ. Invest. 2020, 1–41. [Google Scholar] [CrossRef]
- Shehzad, K.; Xiaoxing, L.; Kazouz, H.; Balsalobre-Lorente, D.; Zeraibi, A.; Rauf, A. An asymmetric spillover between China and Pakistan’ stock markets: A comparative analysis before and during COVID-19 crisis. J. Sustain. Financ. Invest. 2021, 1–20. [Google Scholar] [CrossRef]
- Sayed, O.A.; Eledum, H. The short-run reponse of Saudi Arabia stock market to the outbreak of COVID-19 pandemic: An event-study methodology. Int. J. Financ. Econ. 2021, 1–15. [Google Scholar] [CrossRef]
- Heinlein, R.; Legrenzi, G.D.; Mahadeo, S.M. Crude oil and stock markets in the COVID-19 crisis: Evidence from oil exporters and importers. Q. Rev. Econ. Financ. 2021, 82, 223–229. [Google Scholar] [CrossRef]
- Hammoudeh, S.; Mokni, K.; Ben-Salha, O.; Ajmi, A.N. Distributional predictability between oil prices and renewable energy stocks: Is there a role for the COVID-19 pandemic? Energy Econ. 2021, 103, 105512. [Google Scholar] [CrossRef]
- Tang, C.; Aruga, K. Effects of the 2008 Financial Crisis and COVID-19 Pandemic on the Dynamic Relationship between the Chinese and International Fossil Fuel Markets. J. Risk Financ. Manag. 2021, 14, 207. [Google Scholar] [CrossRef]
- Chevallier, J. COVID-19 Outbreak and CO2 Emissions: Macro-Financial Linkages. J. Risk Financ. Manag. 2020, 14, 12. [Google Scholar] [CrossRef]
- FIoruci, J.A.; Ehlers, R.S.; Louzada, F. BayesDccGarch–An Implementation of Multivariate GARCH DCC Models. arXiv 2014, arXiv:1412.2967. [Google Scholar]
- Invesco. Available online: https://www.invesco.com/us/financial-products/etfs/product-detail?audienceType=Investor&ticker=PBW (accessed on 2 May 2021).
- INSIDER. Available online: https://markets.businessinsider.com/ (accessed on 20 May 2021).
- GOLDHUB. Available online: https://www.gold.org/goldhub/data/gold-prices (accessed on 20 May 2021).
- Engle, R.; Sheppard, K. Theoretical and Empirical Properties of Dynamic Conditional Correlation Multivariate GARCH; Working Paper 8554; National Bureau of Economic Research (NBER): Cambridge, MA, USA, 2001. [Google Scholar] [CrossRef]
- Bauwens, L.; Laurent, S.; Rombouts, J.V.K. Multivariate GARCH models: A survey. J. Appl. Econ. 2006, 21, 79–109. [Google Scholar] [CrossRef] [Green Version]
- Silvennoinen, A.; Teräsvirta, T. Multivariate GARCH models. In Handbook of Financial Time Series; Mikosch, T., Kreiß, J.P., Davis, R., Andersen, T., Eds.; Springer: Berlin/Heidelberg, Germany, 2009; pp. 201–229. [Google Scholar]
- Tsay, R.S. Analysis of Financial Time Series, 3rd ed.; John Wiley & Sons: New York, NY, USA, 2010; pp. 109–149. [Google Scholar]
- Bollerslev, T. Modelling the Coherence in Short-Run Nominal Exchange Rates: A Multivariate Generalized Arch Model. Rev. Econ. Stat. 1990, 72, 498. [Google Scholar] [CrossRef]
- Fioruci, J.A.; Ehlers, R.S.; Filho, M.G.A. Bayesian Multivariate GARCH Models with Dynamic Correlations and Asymmetric Error Distributions. J. Appl. Stat. 2014, 41, 320–331. [Google Scholar] [CrossRef]
- Fiorentini, G.; Sentana, E.; Calzolari, G. Maximum likelihood estimation and inference in multivariate conditionally heteroskedastic dynamic regression models with student t innovations. J. Bus. Econ. Stat. 2003, 21, 532–546. [Google Scholar] [CrossRef]
- Kotz, S.; Nadarajah, S. Multivariate T-Distributions and Their Applications; Cambridge University Press: Cambridge, UK, 2004. [Google Scholar]
- Ardia, D.; Lennart, F.H. Bayesian Estimation of the GARCH (1,1) Model with Student-t Innovations. Student 2006, 5, 283–298. Available online: http://ssrn.com/abstract=1543409 (accessed on 20 May 2021). [CrossRef] [Green Version]
- Katzke, N. South African Sector Return Correlations: Using DCC and ADCC Multivariate GARCH Techniques to Uncover the Underlying Dynamics; Stellenbosch Economic Working Papers: 17/13; Department of Economics, University of Stellenbosch: Stellenbosch, South Africa; Bureau for Economic Research: Stellenbosch, South Africa, 2013; pp. 3–31. [Google Scholar]
- World Resources Institute. Oil & Gas Win, Clean Energy Loses in U.S. COVID-19 Response. Available online: https://www.wri.org/insights/oil-gas-win-clean-energy-loses-us-covid-19-response (accessed on 2 May 2021).
- Mensi, W.; Rehman, M.U.; Vo, X.V. Dynamic frequency relationships and volatility spillovers in natural gas, crude oil, gas oil, gasoline, and heating oil markets: Implications for portfolio management. Resour. Policy 2021, 73, 102172. [Google Scholar] [CrossRef]
- Waggle, D.; Agrrawal, P. Investor Sentiment and Short-Term Returns for Size-Adjusted Value and Growth Portfolios. J. Behav. Financ. 2015, 16, 81–93. [Google Scholar] [CrossRef]
- Stock, J.H.; Watson, M.W. Regression with a Binary Dependent Variable. In Introduction to Econometrics, 3rd ed.; Pearson Education: Upper Saddle River, NJ, USA, 2015; Chapter 11; pp. 385–409. [Google Scholar]
Figure 1.
The COVID-19 pandemic condition in the United States. Note: This figure was created by new cases and deaths data of the US from a database source: Johns Hopkins University CSSE COVID-19 Data, Link: https://github.com/CSSEGISandData/COVID-19 (accessed on 5 December 2021). (a) The new cases in the US. (b) The new deaths in the US.

Figure 2.
The related variables being studied between 3 January 2019 and 26 February 2021. Source: Own calculation. IWHCE and WTI denote Invesco Wilder Hill Clean Energy and West Texas Intermediate, respectively. (a) The logarithmic prices of fossil fuel. (b) The logarithmic prices of financial variable.

Figure 3.
The US fossil fuel, IWHCE, gold, and Bitcoin price return series. Source: Own calculation. Notes: IWHCE: Invesco Wilder Hill Clean Energy; WTI: West Texas Intermediate. (a) The returns of fossil fuel. (b) The returns of financial variable.
Figure 3.
The US fossil fuel, IWHCE, gold, and Bitcoin price return series. Source: Own calculation. Notes: IWHCE: Invesco Wilder Hill Clean Energy; WTI: West Texas Intermediate. (a) The returns of fossil fuel. (b) The returns of financial variable.


Figure 4.
The framework of methodology. Source: Own drawing.

Figure 5.
The time-varying conditional correlations between fossil fuel and clean energy. Notes: IWHCE: Invesco Wilder Hill Clean Energy; WTI: West Texas Intermediate. Source: Own calculation. (a) Fossil fuel and IWHCE. (b) Fossil fuel and gold. (c) Fossil fuel and Bitcoin. (d) Among financial markets. (e) Among fossil fuel.


Table 1.
Publication year, authors, type of study, and approach of relevant literature.
| Publication Year | Authors | Type of Study | Approach |
|---|---|---|---|
| 2014 | Fioruci, Ehlers, and Louzada | Studying an implementation of Multivariate GARCH DCC Models by Bayesian estimation | DCC-MGARCH model with Bayesian estimation |
| 2017 | Reboredo et al. | Studying co-movement and causality between oil and renewable energy stock prices | Continuous wavelets and cross-wavelet transforms |
| 2019 | Shiferaw | Studying the application of Bayesian DCC-MGARCH to agricultural and energy markets | DCC-MGARCH model with Bayesian estimation |
| 2019 | Al-Yahyaee et al. | Studying the volatility and correlation between Bitcoin and oil and international commodity markets | DCC-GARCH model |
| 2020 | Chang et al. | Examining Herding behavior in energy stock markets during the Global Financial Crisis, SARS, and ongoing COVID-19 | The cross-section Standard Deviation (CSSD) and the cross-section Absolute Deviation (CSAD) measures |
| 2020 | Das et al. | Studying whether Bitcoin and gold are safe havens against crude oil | A dummy variable GARCH and quantile regression model |
| 2020 | Kyriazis | Studying whether Bitcoin and gold are safe havens against other markets | DCC-GARCH model |
| 2020 | Kanamura | Studying the correlations between clean energy indices and energy commodities | Supply and demand-based correlation model, DCC-GARCH |
| 2021 | Moussa et al. | Studying the dynamic relationship between Bitcoin and fossil fuel markets in the short and long-run over the period 2011–2018 | Smooth Transition Error Correction Model (STECM) |
| 2021 | Rehman and Kang | Studying causality relationship between Bitcoin and energy commodity markets | Maximal overlap discrete wavelet transformation (MODWT), and nonlinear causality |
| 2021 | Hoang et al. | Examining the impact of the COVID-19 pandemic on the global energy market | Review by previous literature and data related to energy market |
| 2021 | Heinlein et al. | Examining the relationship between crude oil and stock market returns during COVID-19 crisis | Multiplicative component GARCH |
| 2021 | Hammoudeh et al. | Examining the causal relationship between oil prices returns and clean energy stock market during the COVID-19 pandemic | Unit root-in-quantiles test and nonparametric quantile causality test |
| 2021 | Baz et al. | Studying the nexus between fossil fuel, renewable energy, and economic growth | Nonlinear autoregressive distributed lag (ARDL) model |
| 2021 | Wan et al. | Examining the impact of the COVID-19 pandemic on investment in clean energy versus the fossil fuel stock market in China | Regression modeling method by relevant variable |
| 2021 | Tang and Aruga | Studying the impact of the COVID-19 pandemic and 2008 financial crisis on China and international fossil fuel | Vector Autoregressive (VAR) model including Dummy variable |
| 2021 | Shehzad et al. | Examining the impact of COVID-19 on stock markets from a comparative analysis of an asymmetric volatility spillover between China and Pakistan | The bivariate VAR-DCC— Exponential GARCH (EGARCH) model |
| 2021 | Chevallier | Studying the correlations between the macro-financial environment and CO2 emissions in the aftermath of the COVID-19 diffusion | Dynamic Conditional Correlation with Mixed Data Sampling (DCC-MIDAS) |
| 2021 | Sayed and Eledum | Studying the short-term response of the Saudi stock market (Tadawul) to the COVID-19 outbreak | Event study methodology |
Table 2.
Unit root tests of fossil fuel and clean energy, Bitcoin, and gold market price and price returns.
Table 2.
Unit root tests of fossil fuel and clean energy, Bitcoin, and gold market price and price returns.
| Variables | Level Data (t-Value) | First Difference Data | |||||||
|---|---|---|---|---|---|---|---|---|---|
| ADF | PP | KPSS | ADF | PP | KPSS | ADF | PP | KPSS | |
| (Return) | (Return) | (Return) | (Price) | (Price) | (Price) | (Price) | (Price) | (Price) | |
| Coal | −6.46 * | −13.20 * | 0.18 | −2.65 | −2.65 | 0.90 * | −18.54 * | −18.56 * | 0.18 |
| WTI (Oil) | −7.03 * | −33.75 * | 0.10 | −1.68 | −2.32 | 1.14 * | −5.36 * | −62.77 * | 0.12 |
| Natural Gas | −9.72 * | −34.17 * | 0.04 | −2.49 | −0.82 | 1.01 * | −12.45 * | −78.45 * | 0.09 |
| IWHCE | −10.24 * | −43.01 * | 0.03 | −2.12 | −3.73 | 1.54 * | −4.95 * | −41.75 * | 0.22 |
| Bitcoin | −10.68 * | −41.15 * | 0.04 | −0.34 | −5.87 | 1.46 * | −6.73 * | −41.78 * | 0.33 |
| Gold | −10.05 * | −41.92 * | 0.01 | −1.57 | −0.43 | 2.56 * | −8.58 * | −41.93 * | 0.23 |
Note: * Denotes statistical significance at the 5% level. Source: Own calculation.
Table 3.
Statistical properties of fossil fuel and clean energy, Bitcoin, and gold market returns.
| Return Variables | Min. | Max. | Std. | Skewness | Kurtosis | JB | SW | LM |
|---|---|---|---|---|---|---|---|---|
| Coal | −12.86 | 21.51 | 2.14 | 2.02 | 27.28 | 14,585.19 ** | 0.74 ** | 3235.64 ** |
| WTI (Oil) | −96.46 | 97.55 | 16.43 | 0.10 | 8.66 | 1443.89 ** | 0.80 ** | 511.47 ** |
| Natural Gas | −55.89 | 49.90 | 11.96 | −0.05 | 3.23 | 201.69 ** | 0.91 ** | 251.66 ** |
| IWHCE | −175.15 | 169.38 | 39.19 | −0.10 | 8.09 | 1258.96 ** | 0.71 ** | 104.39 ** |
| Bitcoin | −277.00 | 254.79 | 57.40 | −0.03 | 6.41 | 789.99 ** | 0.82 ** | 118.43 ** |
| Gold | −42.67 | 42.80 | 13.58 | −0.02 | 1.98 | 75.80 ** | 0.89 ** | 105.60 ** |
Note: ** Denotes statistical significance at the 1% level. Source: Own calculation.
Table 4.
Information criteria for all returns and bivariate under the SMN, SMST, and SMGED.
| Cri. | SMN | SMST | SMGED | Cri. | SMN | SMST | SMGED | ||
|---|---|---|---|---|---|---|---|---|---|
| All return | AIC | 19,007.3 | 18,308.7 | 18,193.7 | Coal vs. Oil | AIC | 5338.7 | 4962.1 | 4889.8 |
| BIC | 19,114.5 | 18,420.0 | 18,305.0 | BIC | 5379.9 | 5007.5 | 4935.2 | ||
| DIC | 18,984.8 | 18,284.0 | 18,173.0 | DIC | 5324.2 | 4947.3 | 4878.8 | ||
| Coal vs. Natural gas | AIC | 5365.9 | 4988.4 | 4932.9 | Oil vs. Natural gas | AIC | 6652.2 | 6453.5 | 6432.3 |
| BIC | 5407.2 | 5033.8 | 4978.2 | BIC | 6693.4 | 6498.9 | 6477.6 | ||
| DIC | 5354.6 | 4974.1 | 4924.5 | DIC | 6641.7 | 6439.7 | 6418.9 | ||
| Coal vs. IWHCE | AIC | 5677.2 | 5368.2 | 5296.8 | Coal vs. gold | AIC | 5176.4 | 4889.7 | 4769.7 |
| BIC | 5718.4 | 5413.5 | 5342.2 | BIC | 5217.6 | 4935.0 | 4815.1 | ||
| DIC | 5662.6 | 5354.9 | 5284.2 | DIC | 5161.6 | 4875.7 | 4755.8 | ||
| Oil vs. IWHCE | AIC | 6917.2 | 6825.1 | 6765.1 | Oil vs. gold | AIC | 6366.0 | 6288.8 | 6186.8 |
| BIC | 6958.4 | 6870.5 | 6810.4 | BIC | 6407.2 | 6334.1 | 6232.1 | ||
| DIC | 6906.3 | 6813.0 | 6752.7 | DIC | 6353.9 | 6277.8 | 6175.0 | ||
| Natural gas vs. IWHCE | AIC | 6916.1 | 6784.1 | 6752.8 | Natural gas vs. gold | AIC | 6415.7 | 6323.0 | 6263.4 |
| BIC | 6957.3 | 6829.5 | 6798.2 | BIC | 6457.0 | 6368.3 | 6308.7 | ||
| DIC | 6904.9 | 6771.8 | 6741.8 | DIC | 6404.9 | 6311.7 | 6252.1 | ||
| Coal vs. bitcoin | AIC | 6611.0 | 6207.0 | 6075.4 | IWHCE vs. gold | AIC | 6434.2 | 6368.1 | 6329.3 |
| BIC | 6652.3 | 6252.4 | 6120.7 | BIC | 6475.4 | 6413.5 | 6374.6 | ||
| DIC | 6598.8 | 6193.0 | 6062.5 | DIC | 6424.1 | 6355.8 | 6318.6 | ||
| Oil vs. bitcoin | AIC | 7903.2 | 7739.0 | 7616.5 | IWHCE vs. Bitcoin | AIC | 7987.8 | 7788.7 | 7766.1 |
| BIC | 7944.4 | 7784.4 | 7661.8 | BIC | 8029.0 | 7834.0 | 7811.4 | ||
| DIC | 7890.8 | 7725.7 | 7605.5 | DIC | 7977.6 | 7775.9 | 7753.3 | ||
| Natural gas vs. bitcoin | AIC | 7891.6 | 7714.5 | 7666.6 | Bitcoin vs. gold | AIC | 7538.6 | 7385.6 | 7321.7 |
| BIC | 7932.8 | 7759.8 | 7712.0 | BIC | 7579.8 | 7430.9 | 7367.1 | ||
| DIC | 7881.5 | 7701.3 | 7652.1 | DIC | 7526.3 | 7372.1 | 7308.3 |
Notes: IWHCE: Invesco Wilder Hill Clean Energy; WTI: West Texas Intermediate. Source: Own calculation.
Table 5.
Summary of the MCMC simulations for the model with SMGED.
| Commodities | Parameters | Mean | Sd. | 2.5% | 25% | 50% | 75% | 97.5% |
|---|---|---|---|---|---|---|---|---|
| Coal | 1.089 | 0.026 | 1.037 | 1.076 | 1.086 | 1.104 | 1.142 | |
| 2.252 | 0.413 | 1.603 | 2.024 | 2.262 | 2.481 | 3.012 | ||
| 0.673 | 0.159 | 0.318 | 0.583 | 0.680 | 0.775 | 0.964 | ||
| 0.132 | 0.106 | 0.025 | 0.066 | 0.118 | 0.172 | 0.299 | ||
| WTI (Oil) | 0.963 | 0.025 | 0.924 | 0.945 | 0.962 | 0.976 | 1.019 | |
| 2.006 | 0.646 | 0.868 | 1.625 | 1.949 | 2.271 | 3.562 | ||
| 0.150 | 0.025 | 0.108 | 0.132 | 0.152 | 0.163 | 0.201 | ||
| 0.806 | 0.031 | 0.747 | 0.786 | 0.802 | 0.829 | 0.865 | ||
| Natural Gas | 0.994 | 0.031 | 0.933 | 0.979 | 0.993 | 1.015 | 1.050 | |
| 9.171 | 3.112 | 3.925 | 6.839 | 9.317 | 11.042 | 16.061 | ||
| 0.221 | 0.032 | 0.155 | 0.204 | 0.222 | 0.241 | 0.280 | ||
| 0.709 | 0.048 | 0.603 | 0.678 | 0.713 | 0.747 | 0.790 | ||
| IWHCE | 0.938 | 0.038 | 0.879 | 0.917 | 0.942 | 0.959 | 0.999 | |
| 2.716 | 0.725 | 1.353 | 2.324 | 2.700 | 3.075 | 4.206 | ||
| 0.156 | 0.023 | 0.103 | 0.146 | 0.160 | 0.167 | 0.191 | ||
| 0.829 | 0.023 | 0.791 | 0.816 | 0.826 | 0.838 | 0.882 | ||
| Bitcoin | 0.968 | 0.024 | 0.928 | 0.955 | 0.967 | 0.981 | 1.017 | |
| 14.763 | 5.164 | 5.481 | 11.406 | 14.420 | 18.355 | 24.611 | ||
| 0.192 | 0.036 | 0.087 | 0.186 | 0.202 | 0.213 | 0.228 | ||
| 0.792 | 0.034 | 0.755 | 0.770 | 0.782 | 0.800 | 0.889 | ||
| Gold | 0.929 | 0.038 | 0.880 | 0.906 | 0.928 | 0.952 | 1.008 | |
| 0.113 | 0.058 | 0.024 | 0.068 | 0.107 | 0.150 | 0.236 | ||
| 0.119 | 0.024 | 0.075 | 0.099 | 0.119 | 0.138 | 0.164 | ||
| 0.866 | 0.024 | 0.822 | 0.847 | 0.866 | 0.888 | 0.908 | ||
| 0.798 | 0.030 | 0.739 | 0.779 | 0.797 | 0.822 | 0.857 | ||
| 0.203 | 0.020 | 0.173 | 0.194 | 0.204 | 0.213 | 0.233 | ||
| 0.666 | 0.034 | 0.611 | 0.650 | 0.668 | 0.686 | 0.714 | ||
| 0.869 | 0.054 | 0.785 | 0.845 | 0.872 | 0.899 | 0.947 |
Notes: IWHCE: Invesco Wilder Hill Clean Energy; WTI: West Texas Intermediate. Source: Own calculation.
Table 6.
The Bayesian DCC-MGARCH (1,1) estimation results for the bivariate model with SMGED.
| Bivariate | Parameters | Mean | Sd. | 2.5% | 25% | 50% | 75% | 97.5% |
|---|---|---|---|---|---|---|---|---|
| Coal vs. IWHCE | 0.046 | 0.039 | 0.001 | 0.016 | 0.037 | 0.067 | 0.151 | |
| 0.303 | 0.194 | 0.015 | 0.155 | 0.282 | 0.420 | 0.756 | ||
| Coal vs. Gold | 0.028 | 0.026 | 0.001 | 0.009 | 0.020 | 0.039 | 0.094 | |
| 0.383 | 0.227 | 0.046 | 0.186 | 0.360 | 0.546 | 0.870 | ||
| Coal vs. Bitcoin | 0.045 | 0.040 | 0.001 | 0.013 | 0.035 | 0.065 | 0.146 | |
| 0.470 | 0.220 | 0.073 | 0.296 | 0.493 | 0.639 | 0.884 | ||
| WTI (Oil) vs. IWHCE | 0.284 | 0.043 | 0.209 | 0.255 | 0.281 | 0.311 | 0.377 | |
| 0.592 | 0.066 | 0.459 | 0.548 | 0.597 | 0.639 | 0.707 | ||
| WTI (Oil) vs. Gold | 0.252 | 0.046 | 0.153 | 0.224 | 0.254 | 0.284 | 0.332 | |
| 0.667 | 0.059 | 0.566 | 0.627 | 0.663 | 0.701 | 0.806 | ||
| WTI (Oil) vs. Bitcoin | 0.240 | 0.050 | 0.092 | 0.216 | 0.245 | 0.272 | 0.324 | |
| 0.643 | 0.068 | 0.528 | 0.594 | 0.635 | 0.690 | 0.784 | ||
| Natural Gas vs. IWHCE | 0.321 | 0.082 | 0.216 | 0.273 | 0.302 | 0.345 | 0.520 | |
| 0.522 | 0.209 | 0.044 | 0.525 | 0.612 | 0.652 | 0.706 | ||
| Natural Gas vs. Gold | 0.326 | 0.271 | 0.056 | 0.151 | 0.235 | 0.273 | 0.311 | |
| 0.534 | 0.588 | 0.100 | 0.395 | 0.525 | 0.587 | 0.656 | ||
| Natural Gas vs. Bitcoin | 0.432 | 0.301 | 0.055 | 0.200 | 0.265 | 0.299 | 0.334 | |
| 0.376 | 0.590 | 0.078 | 0.399 | 0.544 | 0.602 | 0.646 | ||
| Coal vs. WTI (oil) | 0.064 | 0.042 | 0.006 | 0.032 | 0.058 | 0.089 | 0.167 | |
| 0.378 | 0.172 | 0.084 | 0.247 | 0.377 | 0.492 | 0.744 | ||
| Coal vs. Natural Gas | 0.038 | 0.031 | 0.002 | 0.015 | 0.029 | 0.054 | 0.116 | |
| 0.395 | 0.246 | 0.019 | 0.176 | 0.386 | 0.586 | 0.872 | ||
| WTI (oil) vs. Natural Gas | 0.219 | 0.058 | 0.120 | 0.179 | 0.214 | 0.254 | 0.345 | |
| 0.272 | 0.147 | 0.041 | 0.168 | 0.251 | 0.354 | 0.615 | ||
| Gold vs. Bitcoin | 0.138 | 0.040 | 0.080 | 0.109 | 0.131 | 0.158 | 0.232 | |
| 0.784 | 0.087 | 0.579 | 0.756 | 0.803 | 0.836 | 0.881 | ||
| Gold vs. IWHCE | 0.201 | 0.043 | 0.119 | 0.176 | 0.200 | 0.227 | 0.283 | |
| 0.759 | 0.049 | 0.651 | 0.731 | 0.763 | 0.792 | 0.838 | ||
| Bitcoin vs. IWHCE | 0.295 | 0.046 | 0.216 | 0.268 | 0.293 | 0.322 | 0.384 | |
| 0.595 | 0.059 | 0.462 | 0.564 | 0.599 | 0.634 | 0.702 |
Notes: IWHCE: Invesco Wilder Hill Clean Energy; WTI: West Texas Intermediate. Source: Own calculation.
Publisher’s Note: MDPI stays neutral with regard to jurisdictional claims in published maps and institutional affiliations. |
© 2021 by the authors. Licensee MDPI, Basel, Switzerland. This article is an open access article distributed under the terms and conditions of the Creative Commons Attribution (CC BY) license (https://creativecommons.org/licenses/by/4.0/).
Share and Cite
MDPI and ACS Style
Tang, C.; Aruga, K. Relationships among the Fossil Fuel and Financial Markets during the COVID-19 Pandemic: Evidence from Bayesian DCC-MGARCH Models. Sustainability 2022, 14, 51. https://0-doi-org.brum.beds.ac.uk/10.3390/su14010051
AMA Style
Tang C, Aruga K. Relationships among the Fossil Fuel and Financial Markets during the COVID-19 Pandemic: Evidence from Bayesian DCC-MGARCH Models. Sustainability. 2022; 14(1):51. https://0-doi-org.brum.beds.ac.uk/10.3390/su14010051
Chicago/Turabian StyleTang, Chaofeng, and Kentaka Aruga. 2022. "Relationships among the Fossil Fuel and Financial Markets during the COVID-19 Pandemic: Evidence from Bayesian DCC-MGARCH Models" Sustainability 14, no. 1: 51. https://0-doi-org.brum.beds.ac.uk/10.3390/su14010051
Note that from the first issue of 2016, this journal uses article numbers instead of page numbers. See further details here.