1. Introduction
Walkability grows more interesting to encourage healthier and more active lifestyles, while promoting active transportation [
1]. Walking helps to fight against obesity, excess weight risk, cardiovascular problems, and provides mental benefits [
2]. Walking is part of a sustainable city that can provide substantial socio-economic and environmental benefits. Walking is a way that gives life to streets and makes urban neighbourhoods safer. Urban planners are aware of the implications of highly walkable urban streets. Thus, trying to figure out the determinants of walkability with a wide variety of measurement indices.
Nowadays, the diversity of travel options has reduced the importance of walking. It is difficult to walk in large cities, whereas urban spaces allocated for pedestrians are insufficient. The aesthetic dimension of the city offers a better living environment [
3]. In particular, morphological and functional characteristics (e.g., parking, driveways, pavements, etc.) affect the walkability of urban spaces. To promote walkability, current mobility plans should be designed to encourage people to walk, while decision-makers should aim to expand pedestrian areas to make cities more inclusive.
There exist a consensus on the importance of multiple factors involved in the understanding of walkability [
4]. For instance, land-use density/diversity, street connectivity, access to sidewalks are often integrated into most of the modelling frameworks. In contrast, some pedestrian level-of-service measures only focus on particular factors (safety/comfort or personal space), which may result in potential variability across geographical units if different walkability indices are compared based on the same area [
5]. Thus, looking beyond this opposition of views in proposing multidisciplinary approaches to understanding walkability is required [
4].
Furthermore, multiple studies about walkability were conducted at the city scale with an emphasis on big cities, and fewer on medium/small cities or even smaller urban environments which have their own urban dynamics, sidewalk characteristics, and inherent safety/comfort feelings [
6].
In the literature review, we describe the existing work on objective and subjective measurements of walkable environments. Then we describe the methodological choices for addressing the research questions, followed by the survey design and data collection. The results are presented and discussed. The main findings are reported in the conclusions.
1.1. Objective Measurements of Walkable Environments
Objective measurements of walkability typically rely on the incorporation of land use diversity, population density, commercial density, and intersection density variables in the modelling framework [
7]. Other additional determinants related to network density, accessibility to parks/green spaces, and accessibility to public transport have also been considered [
8]. Land use diversity measures the homogeneity/heterogeneity of an area based on land use. A positive relationship exists between land-use diversity, walking/biking, transit trips, as studies show [
9,
10]. The Shannon entropy formulation [
7,
8] is computed to measure land-use mix. The population density, i.e., the population in zone
i divided by its area, increases the willingness to walk and the feeling of safety [
7,
8].
Walking distances are short in densely populated areas [
8] making access to social services easier for low-mobility groups [
7]. Furthermore, commercial entities or Points of Interest (POI) stand as places for work, shopping, entertainment, and service purposes. If the commercial density is important, people’s needs can be better satisfied in comparison with areas with low commercial presence, which may encourage people to walk instead of driving to reach distant areas [
7]. In this regard, people are more likely to perform their daily activities in areas with high commercial density.
Topological features of the network also influence the willingness to walk. For example, the network density stands as the street lengths within an area. This index has been incorporated in combination with the intersection density index in order to incorporate the influence of areas with low connectivity, but long streets, which may increase the level of accessibility [
7]. The number of street intersections, e.g., street crossings, in a zone defines the intersection density. Zones with high intersections make the environments more walkable. Furthermore, areas with high intersection density are associated with smaller block sizes [
7], resulting in more pleasant environments for pedestrians. To compute this index, total intersection degrees are summed over an area. For example, a typical four-way intersection has an intersection equivalency factor of 4. Areas with access to public transport increase the walkability of the environment [
8]. This can be defined as the number of bus/metros/tram stations in a zone. A positive correlation exists between the presence of parks/green spaces and the willingness to walk such areas [
8].
Besides, street quality is an important factor that can encourage people to walk. The street quality is evaluated by the level-of-service (LOS) in many studies. The LOS is an overall measure for describing existing conditions, facilities, furniture, and infrastructure for a variety of users, such as car drivers, transit users, cyclists, and pedestrians [
11,
12]. Pedestrian level-of-service (PLOS) is widely used to estimate the quality of street conditions for pedestrians. Capacity-based models and roadway characteristic-based models are two types of current PLOS methods. Fruin [
13] developed the first version of PLOS that was based on sidewalk capacity and pedestrian volume. Capacity, volume, and speed are also considered by PLOS in the Highway Capacity Manual. The main issue concerning the HCM method is that it treats pedestrians the same as vehicles, without considering the specific needs of pedestrians such as qualitative street dimensions, facilities, and furniture.
Some PLOS studies focused on pedestrian flow, volume, and sidewalk capacity [
14]. Other PLOS studies were sensitive to safety indicators, such as vehicle speed and volume and buffers from traffic [
15]. Some studies considered convenience facilities, such as pedestrian-scale lighting, shade trees, and benches [
16,
17,
18]. Other studies explored urban structures and socio-economic factors as indicators of walking conditions in traffic zones or neighbourhoods [
19,
20,
21,
22,
23,
24].
Most studies use direct observation, video techniques, and survey methodologies to collect data for their LOS models [
25,
26]. Analytical methods typically used in PLOS models include regression analysis [
15,
27], point systems [
16,
28,
29], and simulation [
30]. Unrealistic assumptions for regression analysis and simulation and subjective observations for point systems are the main issues for analytical methods typically used in PLOS models [
31,
32]. The main focus on walkability scores and on the existing infrastructure/physical environment makes the use of these PLOS models inappropriate for exploring sense perception rather.
These studies are generally conducted at nationwide [
33] or citywide [
7,
8] scales. The major shortcoming of this type of large-scale approach is the difficulty of capturing sense-perception effects. In summary, many current walkability measurements do not take into account urban design aspects, pedestrian walking preferences and sense perception. Furthermore, they do not include the potential effects of socio-demographics as it requires more targeted small scale field experiments.
1.2. Subjective Measurements of Walkable Environments
Investigating walkability from a subjective perspective has received little attention so far in the literature. This type of study requires survey designs and field experiments for collecting data. The survey includes multiple questions on the socio-demographics of the participants (gender, ethnicity, marital status, age, educational attainment, annual household income, children in household) as well as questions on their perceptions of different dimensions/items of perceived walkability. Perception measurements are based on scales, e.g., from 1 to 5 or 1 to 10 point Likert scales. They are generally conducted in the context of small urban environments, e.g., neighbourhoods.
For example, the neighbourhood environment walkability scale (NEWS) is a survey with questions about 68 items [
34]. A short form of NEWS called NEWS-A has been proposed by Cerin et al. [
35]. It includes multiple environmental characteristics, e.g., residential density, proximity to nonresidential land uses, ease to access to nonresidential uses, street connectivity, walking/cycling facilities (sidewalks, pedestrian/bike trails), aesthetics, pedestrian traffic safety, and crime safety. Moura et al. [
36] measured walkability through a participatory assessment by considering two distinct geographical groups, highlighting clear differences between adults, seniors and impaired pedestrians. Seven key dimensions were considered in their survey, i.e., connected, convenient, comfortable, convivial, conspicuous, coexistence, and commitment. Nonetheless, sense perceptions are not considered in their assessment framework. Zhang and Mu [
37] developed a new assessment method to account for the perceived importance of walkability in combination with objective measurements, resulting in a hybrid framework. In their study, pedestrian preferences based on a walking preference survey were included.
1.3. Research Contributions
This study accommodates for the aforementioned shortcomings by considering sense perception for pedestrians. In this regard, we propose a hierarchical framework for assessing perceived neighbourhood walkability and the existing relationships with socio-demographics and the contributing items. The results of this study can help explore the effects of sense perception on neighbourhood walkability. It should be noted that sensation and perception have different processes, but are strongly correlated. Sensations can be defined as direct inputs from the physical world to our sensory receptors, and perception is the brain process to interpret these sensations that can be different for individuals. While the sensation is the same for people, perception of the same senses may not be the same for individuals. In this regard, three critical research questions will be addressed in this paper:
Do the socio-demographics have an influence on PNW?
What are the most relevant items that explain PNW?
What are the predictive capabilities of the relevant items?
2. Methods
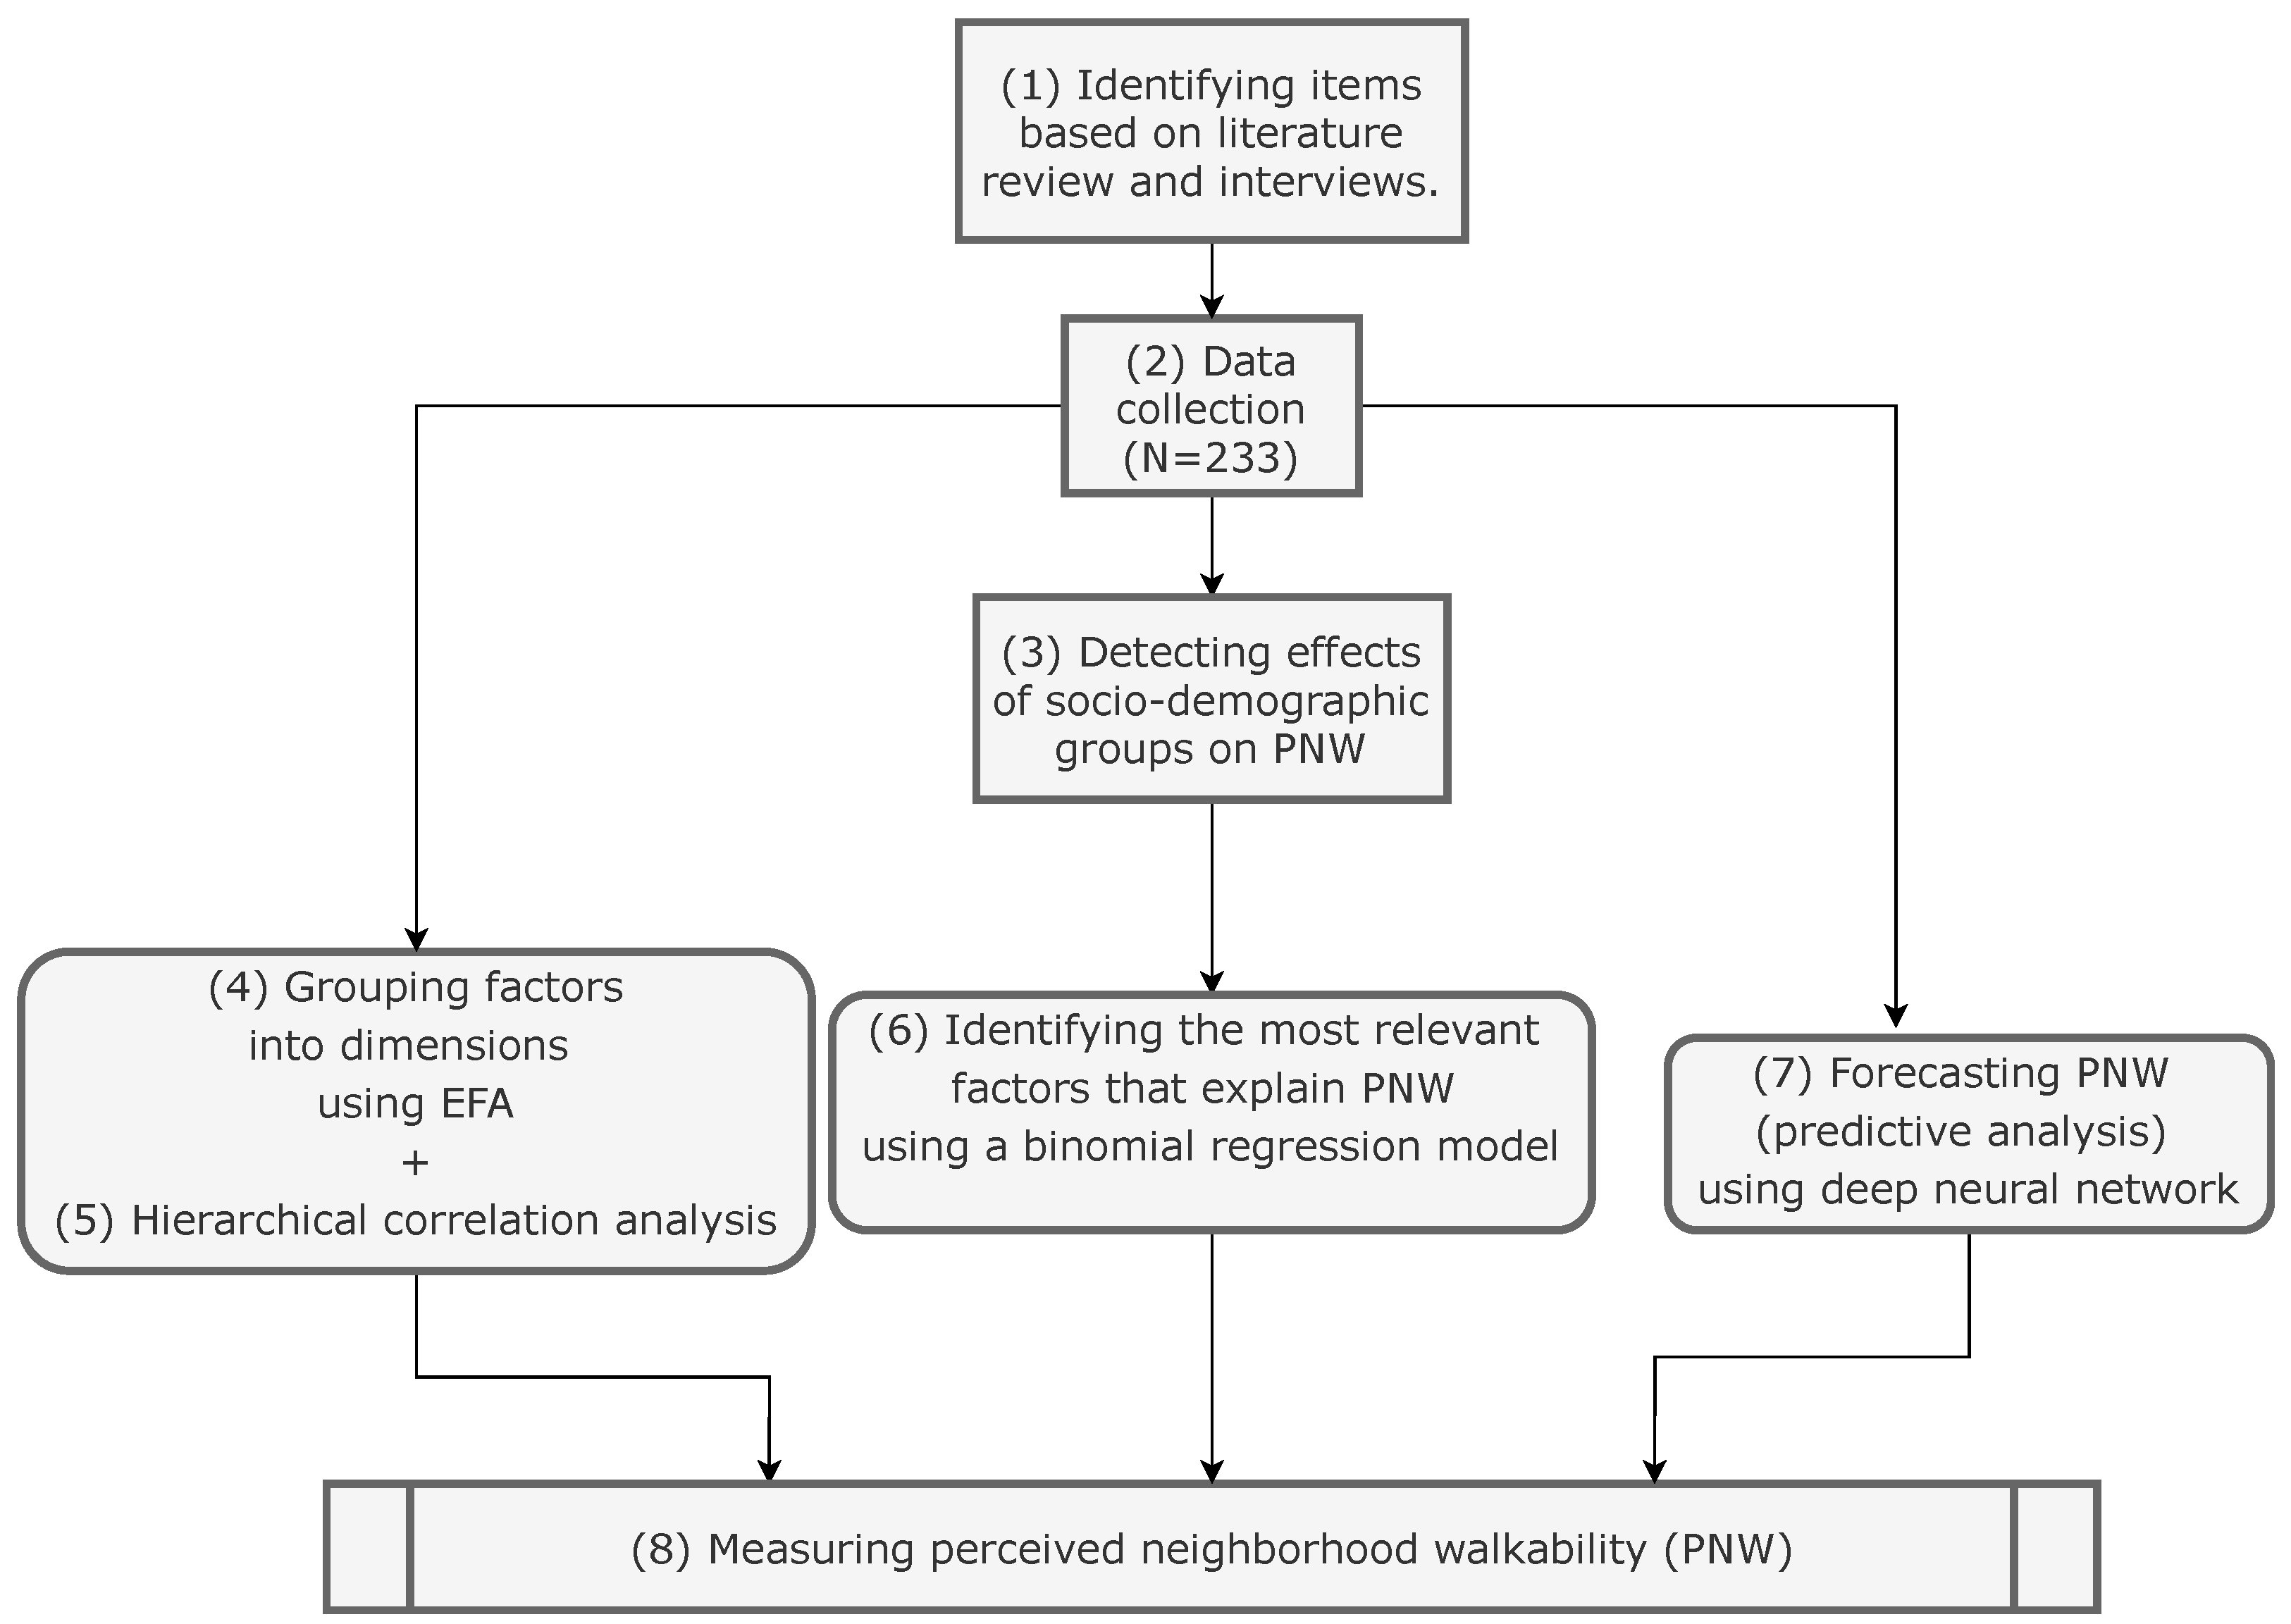
We describe the entire process we went through over the assessment of the perceived neighbourhood walkability (PNW) in
Figure 1. Having identified the determinants of PNW from the literature in combination with new suggestions from interviews of a wide range of professionals and experts (1), we conducted the field study among 233 participants (2).
We use Cronbach’s alpha to check the internal consistency and reliability of the questionnaire. Then, we examine the possibility of aggregating the 22 contributing factors into multiple dimensions using an exploratory factor analysis (EFA) (4). To provide more insights into the grouping mechanisms, we also compute the hierarchically distributed correlation structure (pair-wise correlation analysis) of perceived neighbourhood walkability based on the contributing items (5). This will enable the validation of the questionnaire. Five dimensions have been defined based on both the literature and expert knowledge. Thus, we also conduct a posteriori analysis to compare the theoretical and empirical structures of the same questionnaire.
The data were descriptively analyzed, after which the hypothesis tests were performed in order to look into whether there are any differences between groups regarding their perception of neighbourhood walkability (direct effects) (3). The effects of socio-demographics on PNW are investigated using chi-square tests. Depending on the results of the significance tests, a decision will be made on whether or not to consider socio-demographics as explanatory variables in the parametric (binomial regression model) (6)/non-parametric models (deep neural network) (7). Further descriptions of the parametric/non-parametric models are provided below.
2.1. Binomial Regression Model
The assessment of PNW includes some degree of subjectivity. Although we defined a scale from 1 to 10, the interpretation of that measurement scale may change across the participants and the environment in which the field survey was conducted. In this regard, the outcome that was scaled from 1 to 10 in the survey is rescaled, i.e., standardized in the form of a z-score. We estimate a generalized binomial regression model in order to measure the relative effects of the explanatory variables on PNW. In doing so, PNW is computed as a relative measure with either a high (1) or a low (0) outcome. We had to make this decision because of the potential inherent subjectivity of the PNW. For example, participants may have the same perception/feeling but score it differently because they have different interpretations of how good or how bad is a neighbourhood in terms of walkability. To mitigate this sense-perception mismatch, we use a z-score instead, where each appreciation is defined in comparison with the average score of all the participants. We first estimate a full model that contains all the explanatory variables and a null model, which stands as the reference. Based on these estimated models, the best model is selected based on a forward/backward selection of the explanatory variables associated with the lowest AIC. Here the odds ratio is defined as the probability of perceiving the environment as highly walkable environments and the probability of lowly walkable environments.
Besides, we show that the contributing items may present some important level of correlation, which may invalidate the use of conventional parametric models. Thus, we also use non-parametric models to handle the presence of correlated variables better. Our methodological choice is geared toward the use of a deep classification neural network for mapping the relationship between PNW and the contributing items. The accuracy of the models is checked on the basis of a conventional training/test dataset split procedure.
2.2. Deep Neural Network Model for Classification
The deep neural network is a powerful non-parametric approach for classification and regression based on the sequential addition of weak learners, i.e., neural network classifiers. It is characterized by flexibility as various loss functions and different learning functions can be used. Additionally, compared to other conventional approaches, e.g., Support Vector Machines (SVM) or ensemble decision trees, deep neural networks are relatively fast, robust, and show competitive performances. In addition to the previous advantages, a deep neural network explicitly handles missing values and does not require any normalization of the input predictors in contrast to SVM, for instance.
The model has been implemented with Keras and Tensorflow using Python. In particular, the deep neural network has three hidden layers, 128/64/32 neurons each, in addition to the input (100) and output layers (10). ReLu activation functions are used at the output of the hidden layers, whereas the Softmax activation function is used at the output layer for classification purposes. As a result, a categorical cross-entropy loss function is adopted to measure the estimated model’s predictive capabilities. The model is optimized/estimated by using stochastic gradient descent. To obtain quick simulations, we use a batch size of 16. After 2000 runs, the model clearly converges. We set up a deep neural network model to map the relationship between the contributing factors and the PNW. Thus, the relationship is formulated by means of a non-parametric classification model. Furthermore, it is assumed that the contributing factors are categorical. Handling the latter variables as continuous would not affect the results. Considering them as categorical will require a shift towards dummy variables. Based on the factor analysis, we handle a set of 20 contributing factors, as two of them have been dropped out. The variables collected in the first part of the questionnaire are not included in the model because they do not affect the outcome. Thus, only predictor variables of PNW collected in the second part of the questionnaire are incorporated in the model.
3. Data
Data collection has been conducted in the commune of Ixelles, one of the 19 municipalities of the Brussels capital region. Ixelles covers eight districts, offering some very attractive places. The commune is the repository of multiple geographical places where the accessibility for pedestrians is important: green areas, pools, and a variety of urban forms where the conditions of walkability vary: quite favourable, in areas of high activity, rather negative in centralities. Zones of centrality present compact neighbourhoods where accessibility for pedestrians is limited because of high traffic volumes. Nonetheless, those spaces are strategic for enabling enough proximity, guaranteeing accessibility and walkability. Each district has its particularities, as there exist diverse realities in the different parts of the commune of Ixelles.
The survey is designed to capture the perception of walkability based on sense perception. The questionnaire (
Supplementary Materials) includes two different components, i.e., an individual’s socio-demographic background and perception of walkability.
Table 1 presents the socio-demographic information from the participants, i.e., age, gender, and education, as well as questions about knowledge of the area, the frequency of visits and mode choice.
Table 2 describes the different items considered in this study based on the recommendations of the literature and several interviews with different experts of varying skills, i.e., architects, professors, urban planners, and mobility experts.
As a result, we identified 22 items that can be grouped into 5 factors. The first factor is related to cleanness (streets, pavements, etc.). The second relates to the visual aesthetics (architecture, colours, panorama, etc.). The third factor covers landscape/nature-related items (green spaces, water, natural scenes and overall noise level). A fourth factor captures the urban morphology, its density and how it can influence the feeling of pressure. The fifth factor relates to safety aspects (security, traffic volumes/density, risks, lighting, especially during nights, and suspicious persons). Of course, some overlapping may exist over the different factors. Therefore, an EFA analysis is conducted to confirm/extend the 5-factors structure.
The conceptual framework of the qualitative analysis draws on the work of Chibane and Gwiazdzinski [
3] as qualitative aspects are taken into account. A preliminary version of the work has been presented to the experts in order to foster rational thoughts and get deeper insights into the concept of walkability based on sense perception and some new dimensions such as landscape and nature were added. The items are grouped into different initial dimensions before finalizing dimensions by applying exploratory factor analysis (EFA).
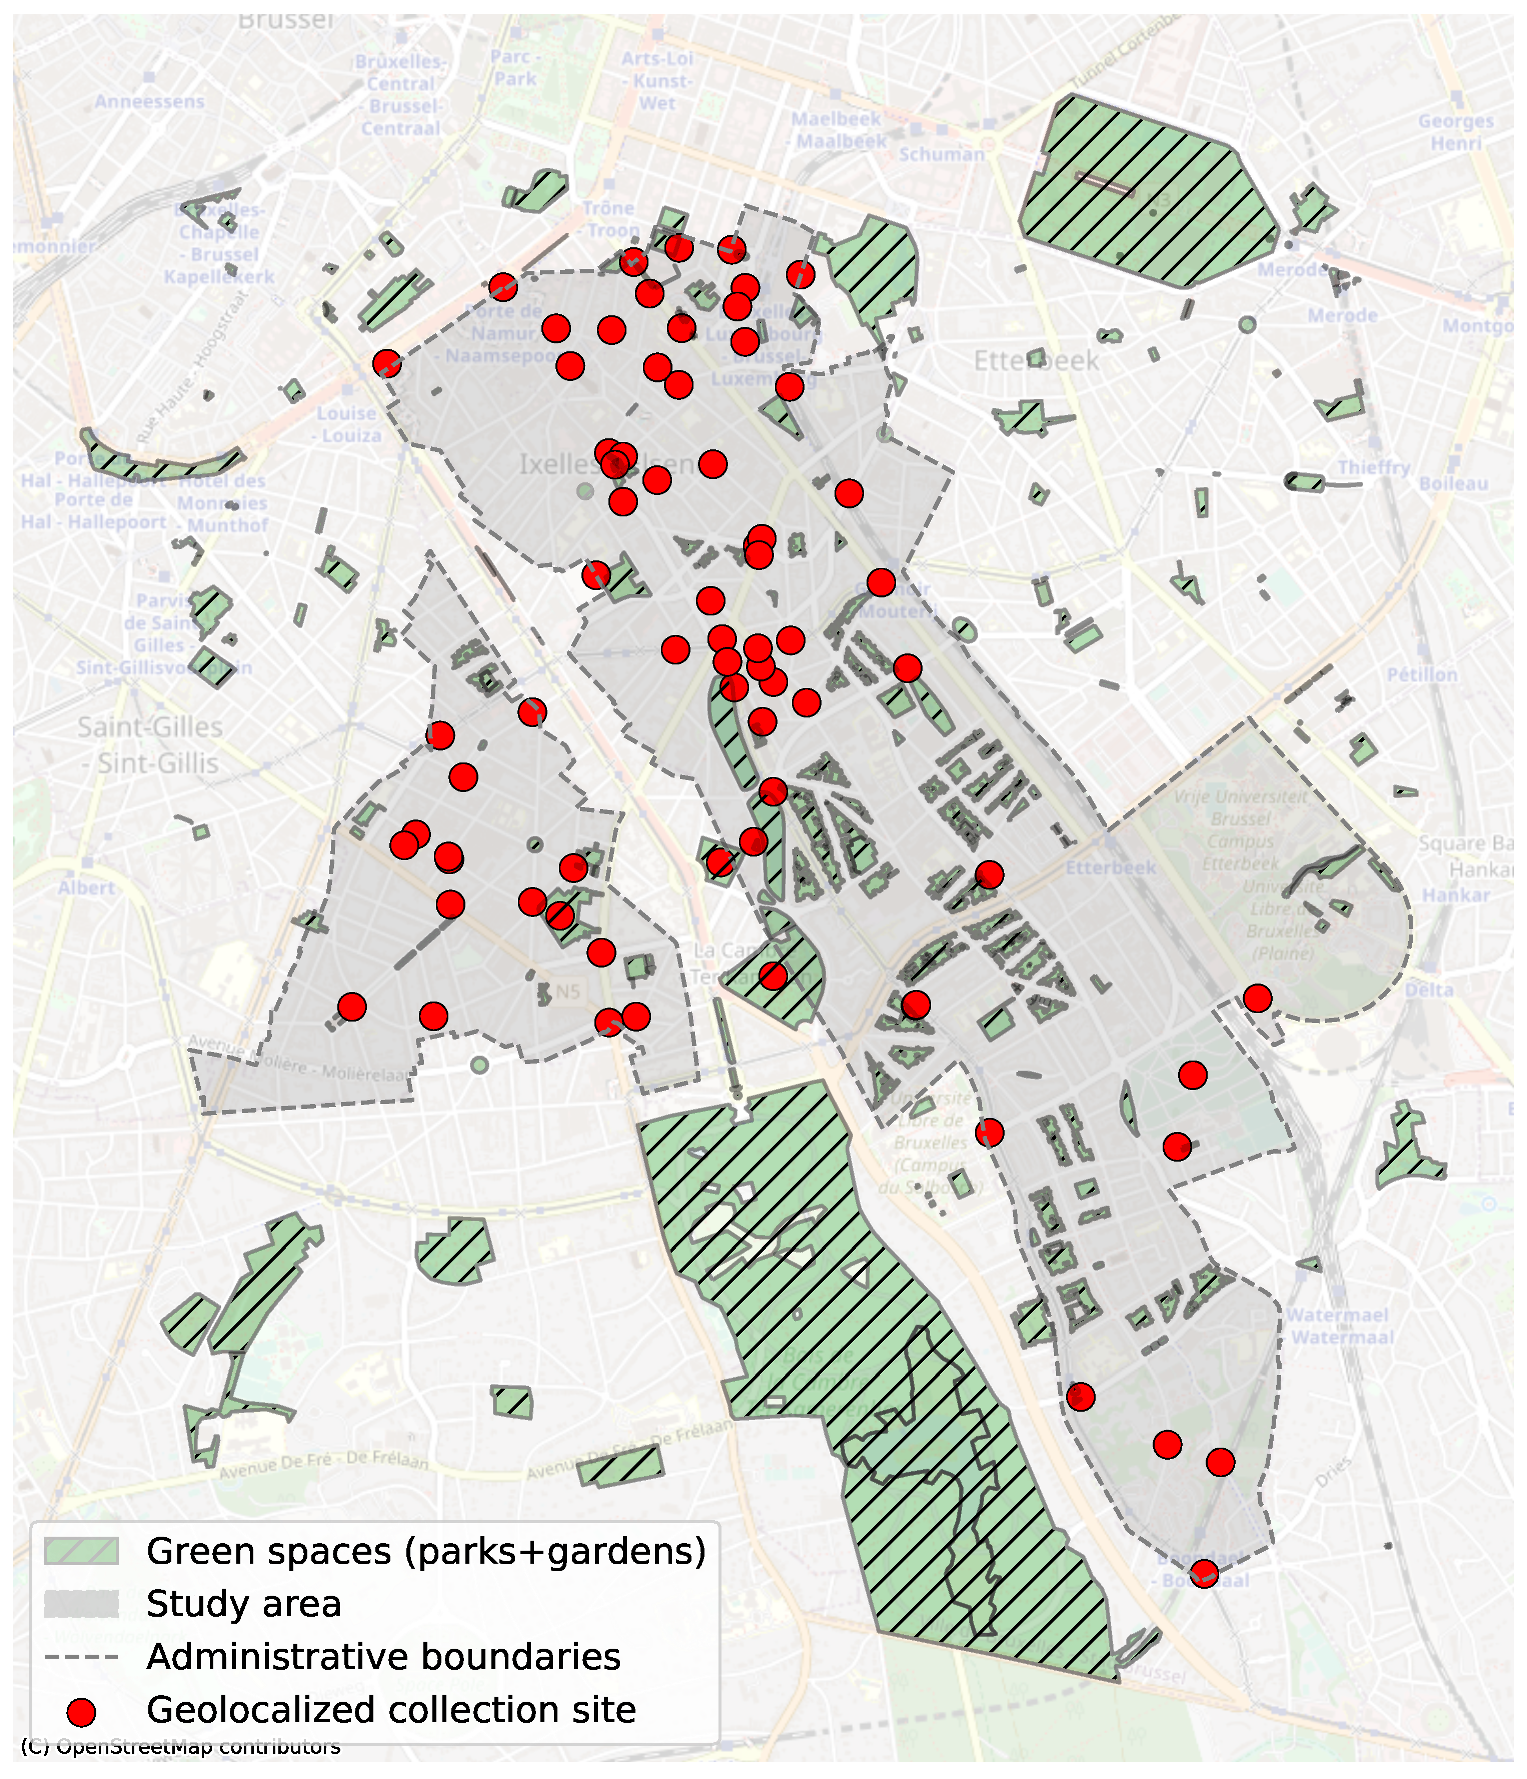
The minimum sample size for a margin of error of 6.5% and a confidence level of 95% is 228. Therefore, at least 228 respondents were required in this study. Data were collected over four days between April and May 2018, resulting in a total of 233 completed questionnaires. The participants were pedestrians randomly selected at different locations in the study area. The participants involved were both residents and non-residents.
Figure 2 shows the spatial distribution of the collection sites (red points). They uniformly cover the entire study area. Ixelles is located in the southeast of Brussels. It has a surface of 6.34 km
. The density is around 13,882.5 inhabitants/km
. Because of the presence of two large universities (ULB and VUB), Ixelles is highly frequented by students.
4. Results
4.1. Summary Statistics
Table 3 presents a statistical description of the variables of the first part of the collected dataset. 233 respondents answered the questionnaire. Almost an equal distribution of males and females was obtained. Most of the respondents are between 25 and 39, while people aged at least 60 are under-represented. Furthermore, most participants (58%) are of a higher education level and are familiar (74.7%) with the environment. The travel mode with which they accessed the survey environment was primarily on foot (35.2%), followed by public transport (25.8%) and car either as driver or passenger (16.3%).
4.2. Associations between Socio-Demographics and PNW
We conducted multiple chi-square tests in order to reveal the existence of statistically significant associations between the predictors and PNW. Note that the statistical tests which resulted in no significant associations are not reported for the sake of clarity. The tested categorical predictors include age, gender, education level, knowledge of the environment, frequency of visits, and transport mode. We systematically tested the associations between these variables and PNW (direct effects). We found no significant associations between the considered predictors and PNW, apart from the education level predictor (chi-square stat. = 10.02, p-value < 0.05). It seems that socio-demographics do not influence sense perception at the neighbourhood scale. Regarding the groups from different education backgrounds, the statistical tests show that there exist significant differences between highly and lowly educated individuals. Highly educated individuals have a higher perception of neighbourhood walkability in comparison with lowly educated individuals.
4.3. Emergence of Grouping Factors
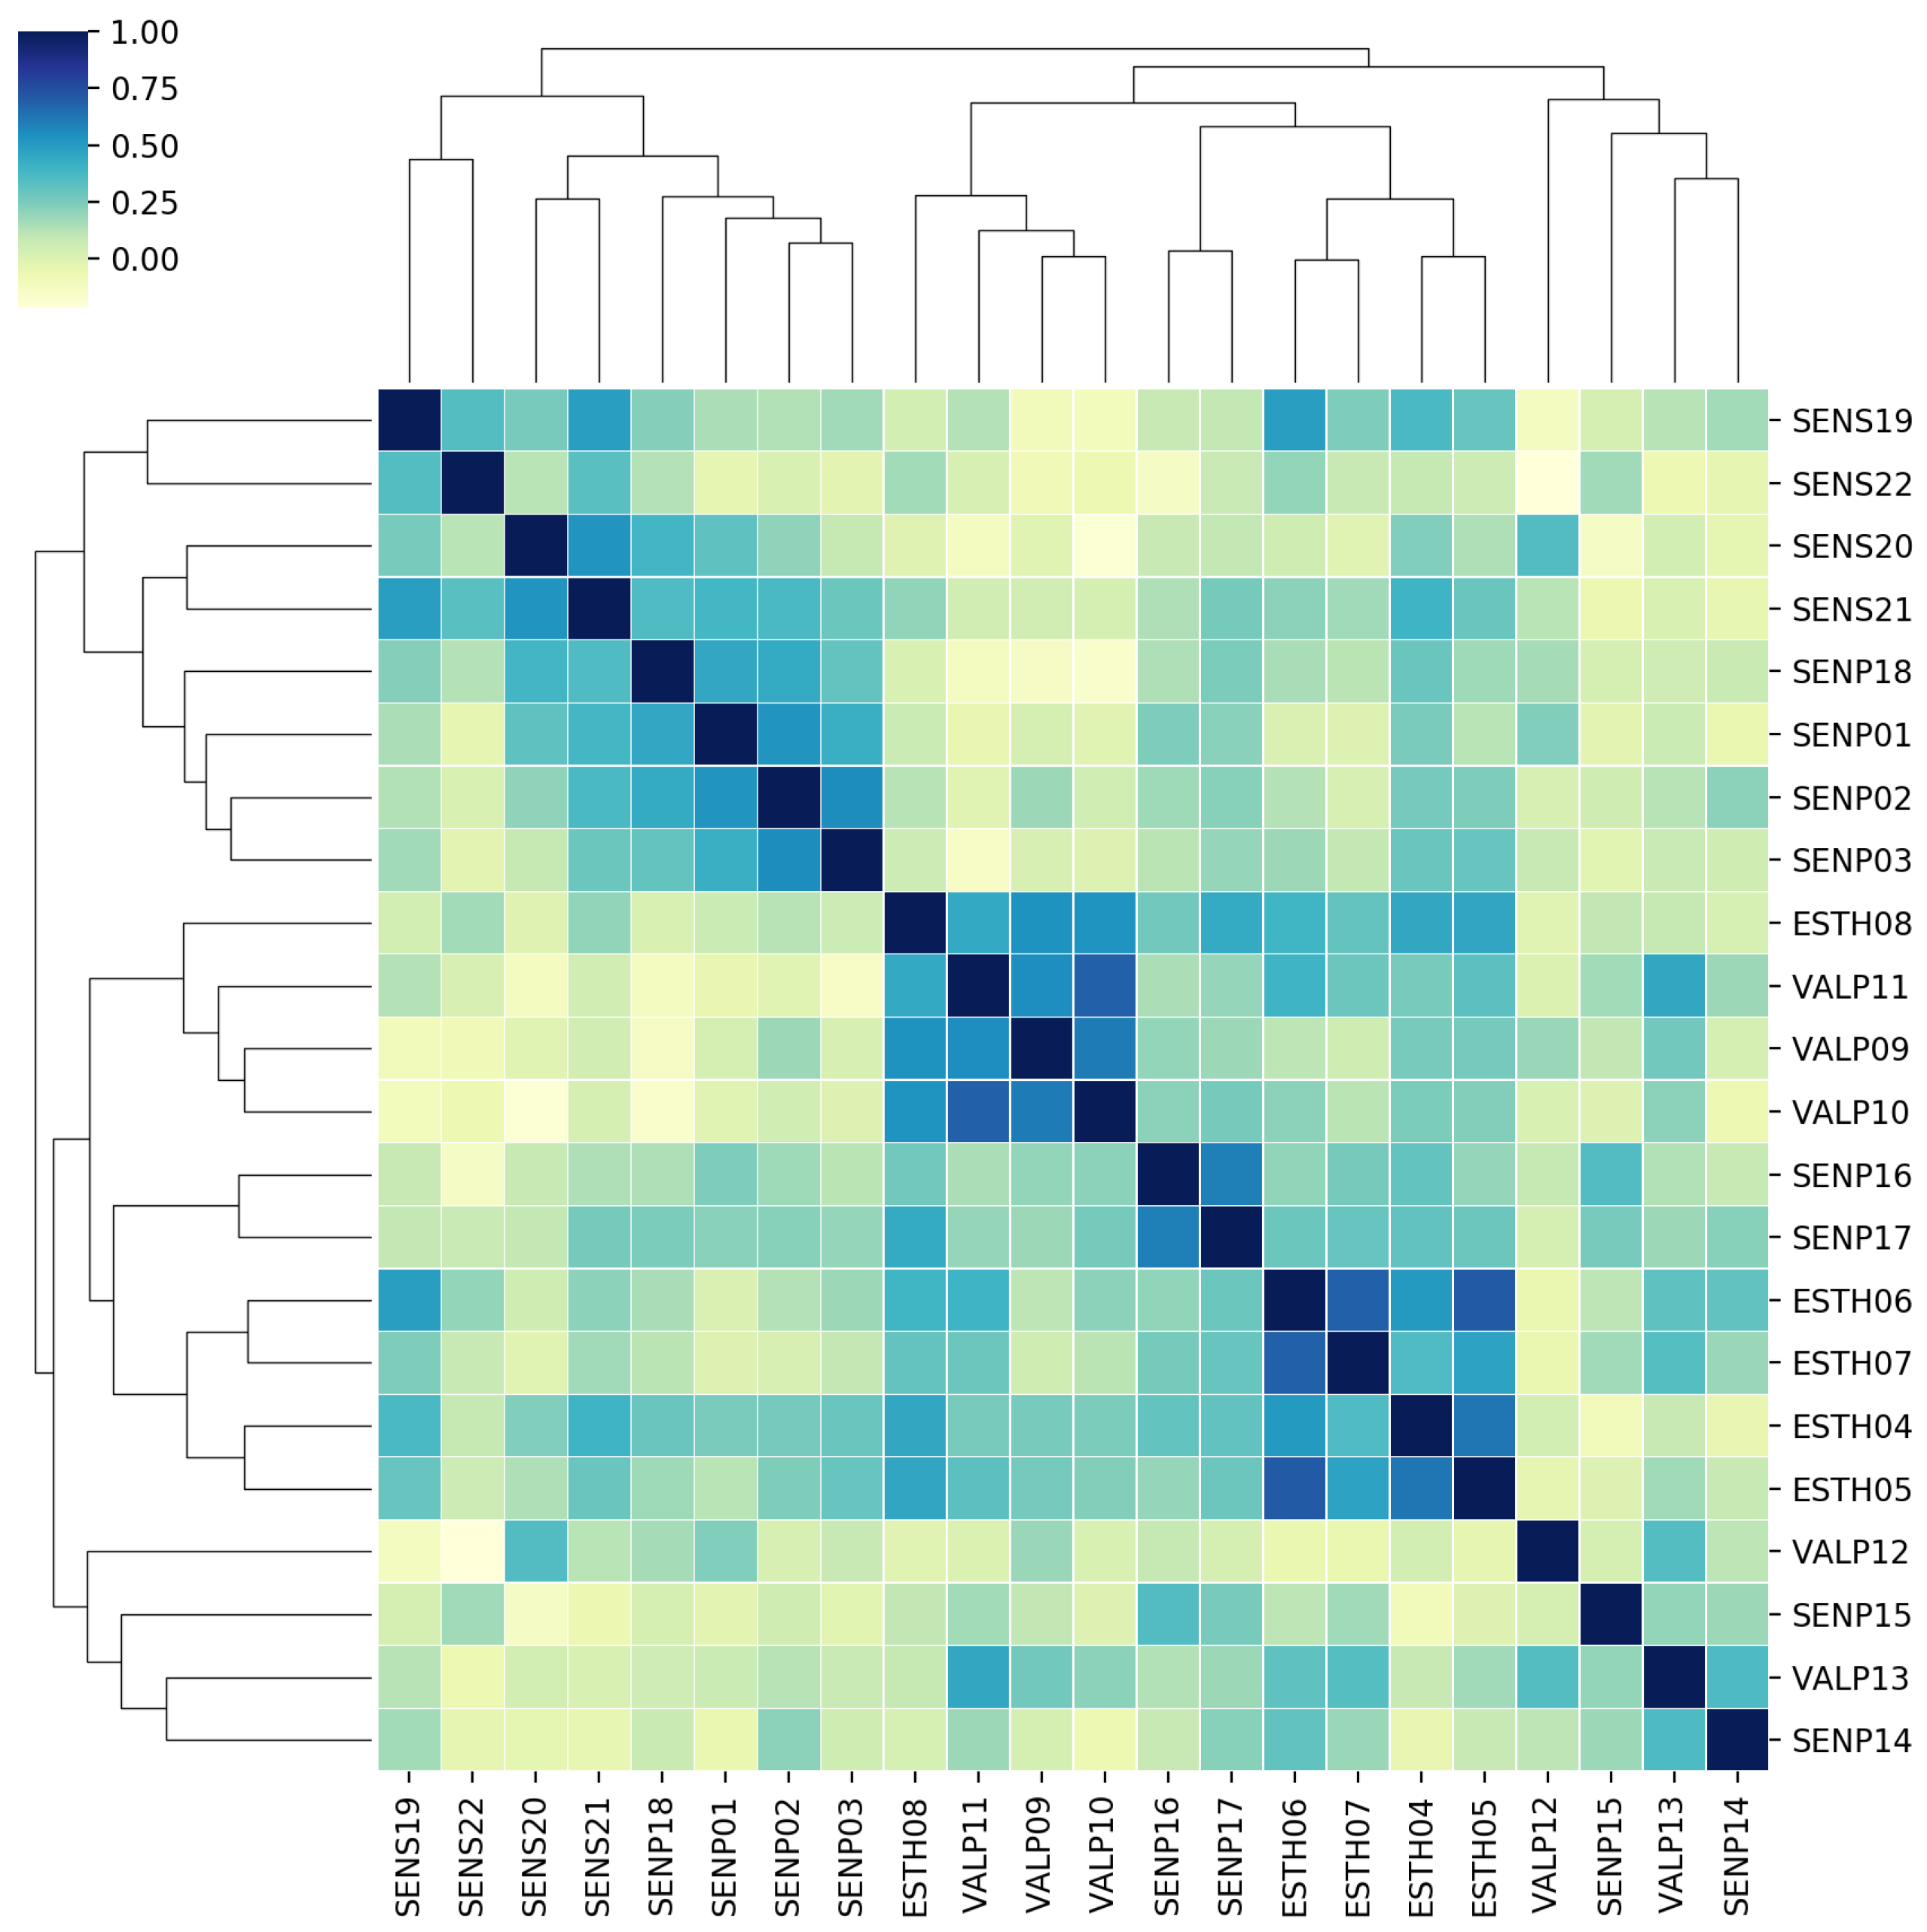
Having highlighted the lack of effects of socio-demographics, we show how the variables are distributed on the basis of a hierarchical clustering algorithm (
Figure 3). The correlation-based decision tree shows how the clustering operates at each decision level.
Figure 3 allows us to understand the complexity of the PNW through all the contributing factors. A preliminary analysis based on variable correlation clearly reveals that aesthetic and visual dimensions play an important role in the explanation of PNW. Identified clusters can clearly be distinguished compared to the remaining items.
Table 4 presents the results of the exploratory factor analysis (EFA) conducted on the basis of the 22 contribution factors. EFA suggests that clustering into seven dimensions is required instead of the five initially considered in the questionnaire. The values measure the intensity of belonging to a dimension. Consequently, the closer the value of the rotated factor matrix is to 1, the higher the item belongs to that dimension. The Kaiser–Meyer–Olkin (KMO) test is equal to 0.704, whereas a value higher than 0.7 is commonly required. The approximated chi-square of the Barlett’s test of sphericity is 2332.647 (
p-value < 0.001). Furthermore, the internal consistency and reliability of the questionnaire are also appropriate as the Cronbach’s alpha reaches a value of 0.810 with 0.773/0.844 95% CI, whereas a value of at least 0.7 is recommended. SENP14 and SENP15 are excluded from the analysis because of a communality value lower than 0.4.
4.4. Associations between the Items and PNW
4.4.1. Parametric Model
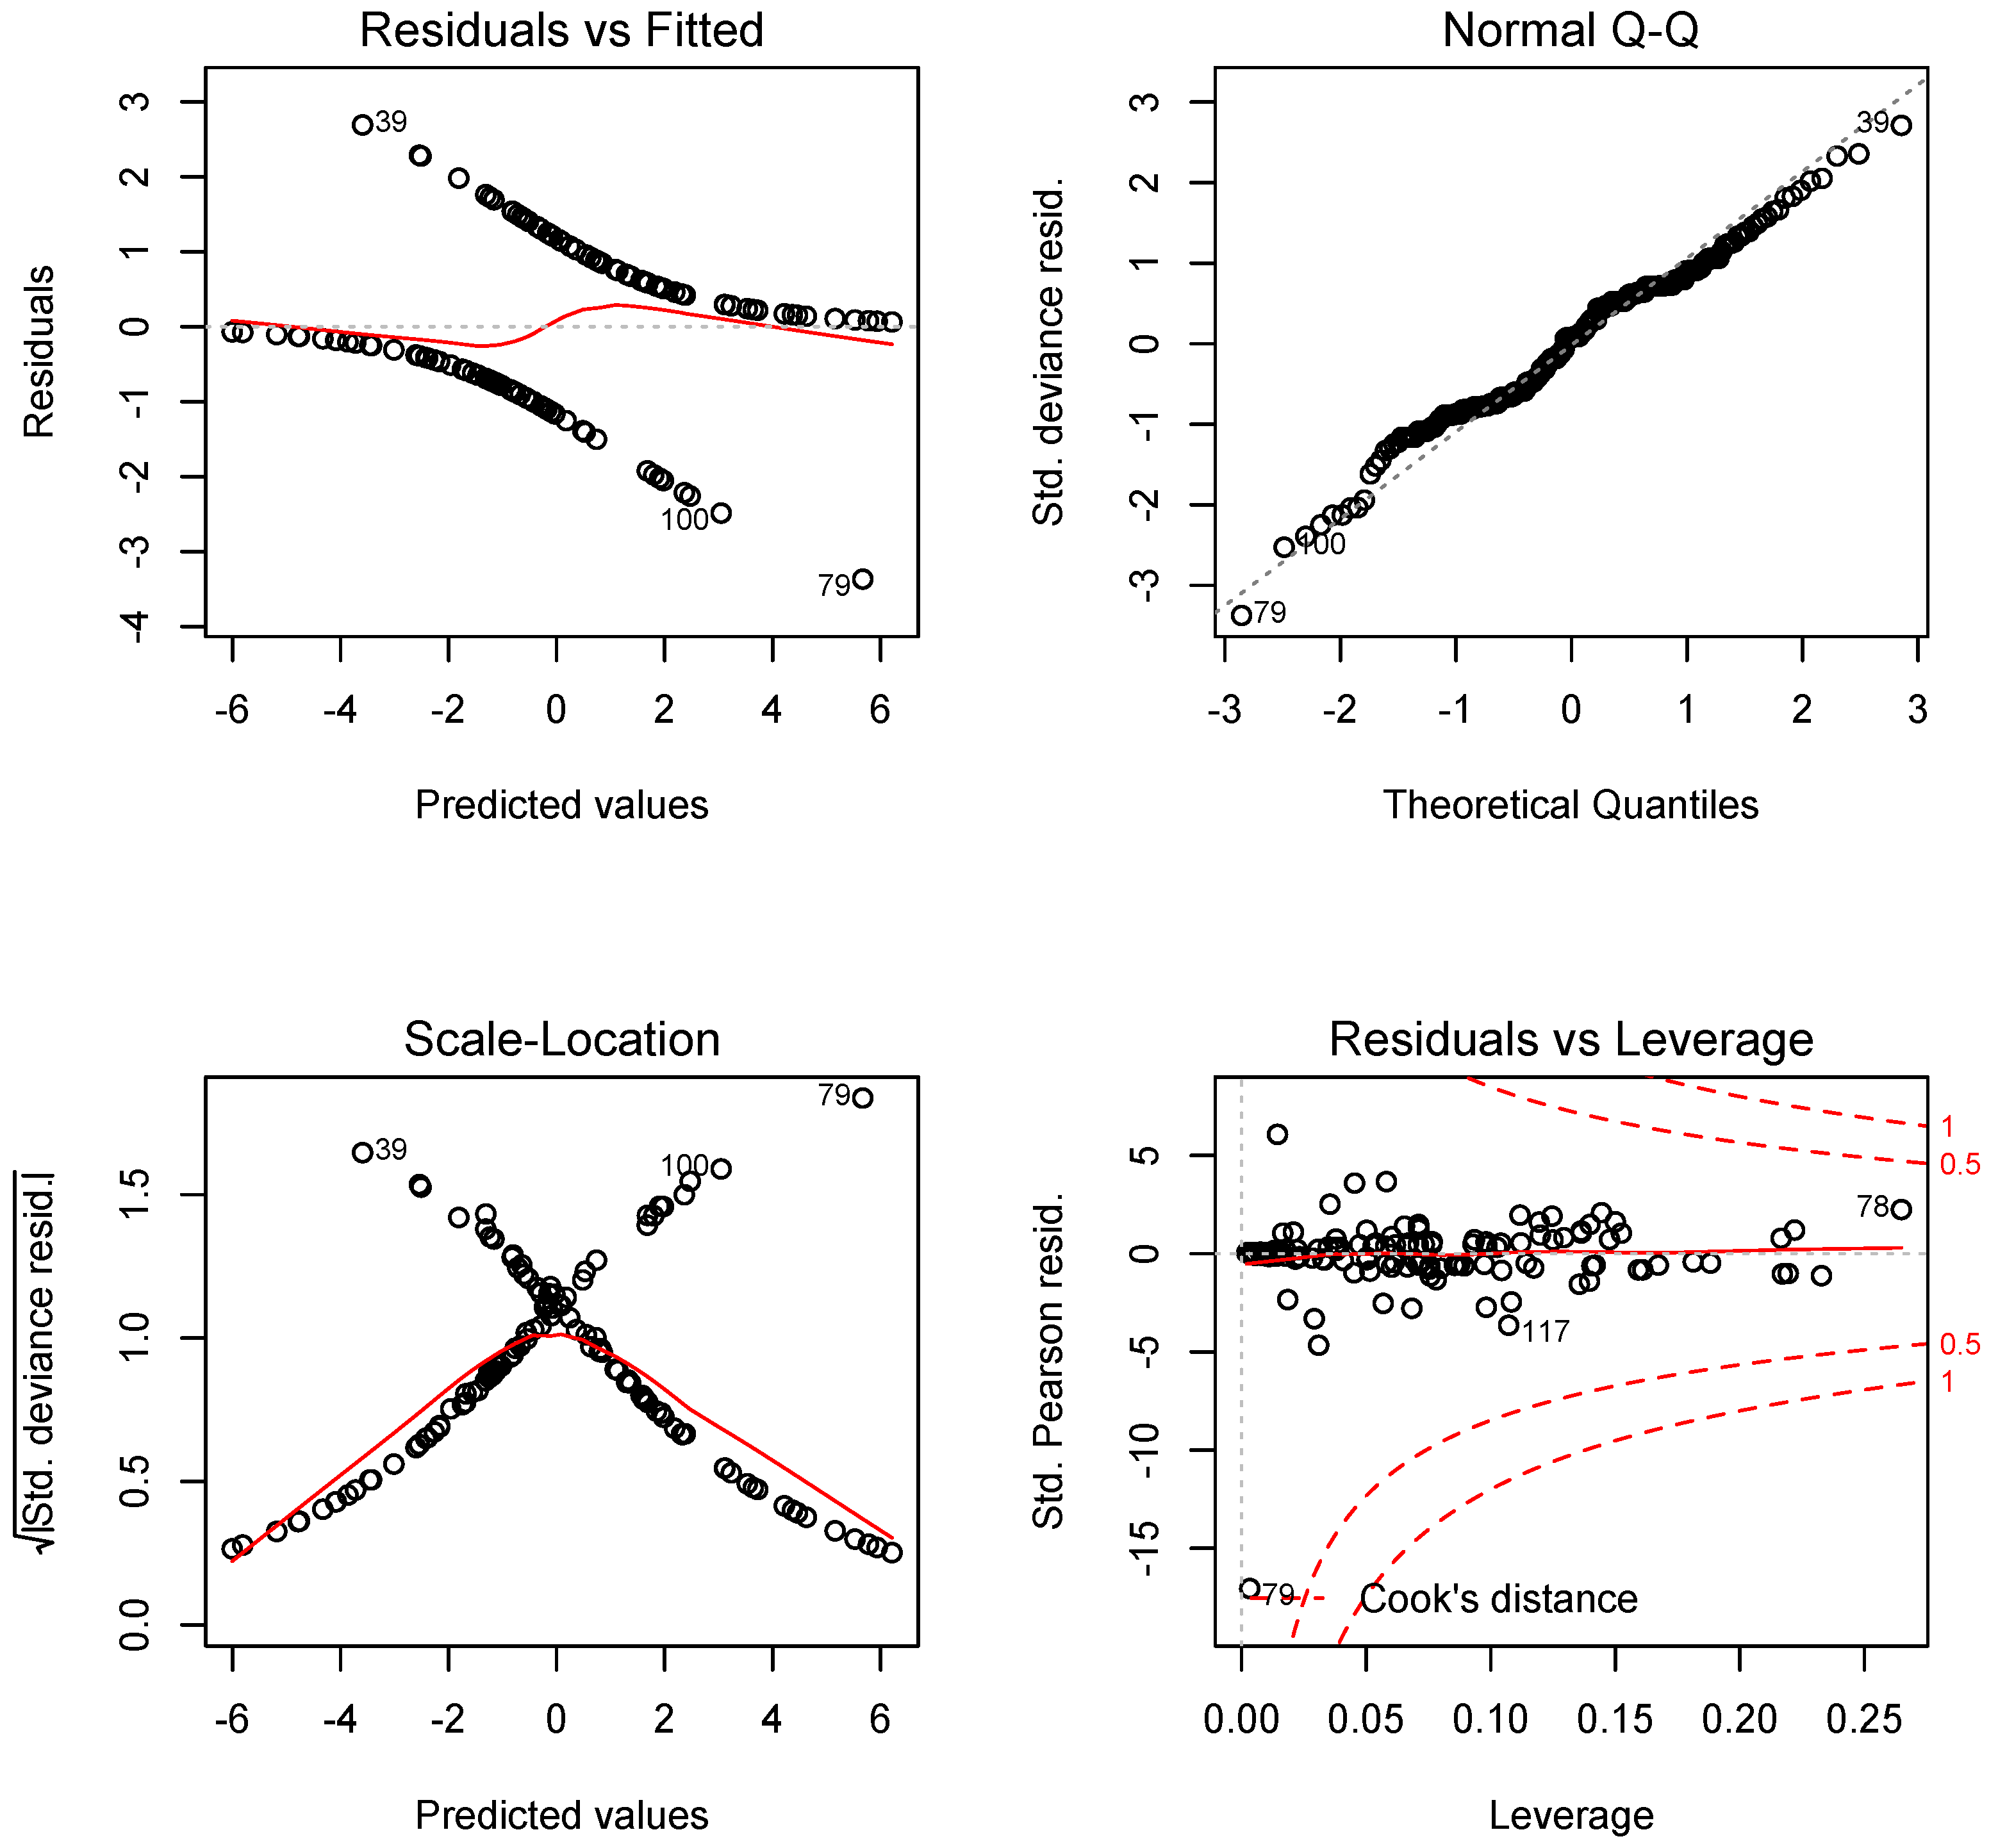
Variable importance is measured by means of a binomial regression model. In this regard, PNW was beforehand standardized. Negative values are associated with 0, the positive values with 1.
Figure 4 shows some key statistical indicators for assessing the best fitted binomial regression model (AIC = 230.49).
Table 5 presents the parameter estimates, the standard errors, the Wald z-statistic and the corresponding
p-values. We can observe that seven predictors were excluded from the full model, SENP03, VALP11, ESTH07, VALP13, VALP09, SENS20, and SENS21. A total of 10 items out of 15 are strongly associated with PNW with a significance level of at least 0.05. Based on the results of that model, “pavement quality and cleanness” SENP02, “playgrounds” VALP12, “general view” ESTH04, “beautiful scenes” ESTH06, “open spaces” ESTH08, “building’s height” SENP14, and “suspicious people” SENS22 are the most relevant predictors of PNW. Considering the items with strong associations (
p-value < 0.001), we observe that for every one unit change in “pavement quality and cleanness” SENP02, “playgrounds” VALP12, “general view” ESTH04, “building’s height” SENP14, and “suspicious people” SENS22 the log odds of perceiving the environment as highly walkable (versus lowly walkable) increases by 0.85, 0.74, 1.87, 0.68, and 0.65 respectively. For every one unit change in “open spaces” ESTH08, the log odds of perceiving the environment as highly walkable (versus lowly walkable) decreases by −0.94.
4.4.2. Non-Parametric Model
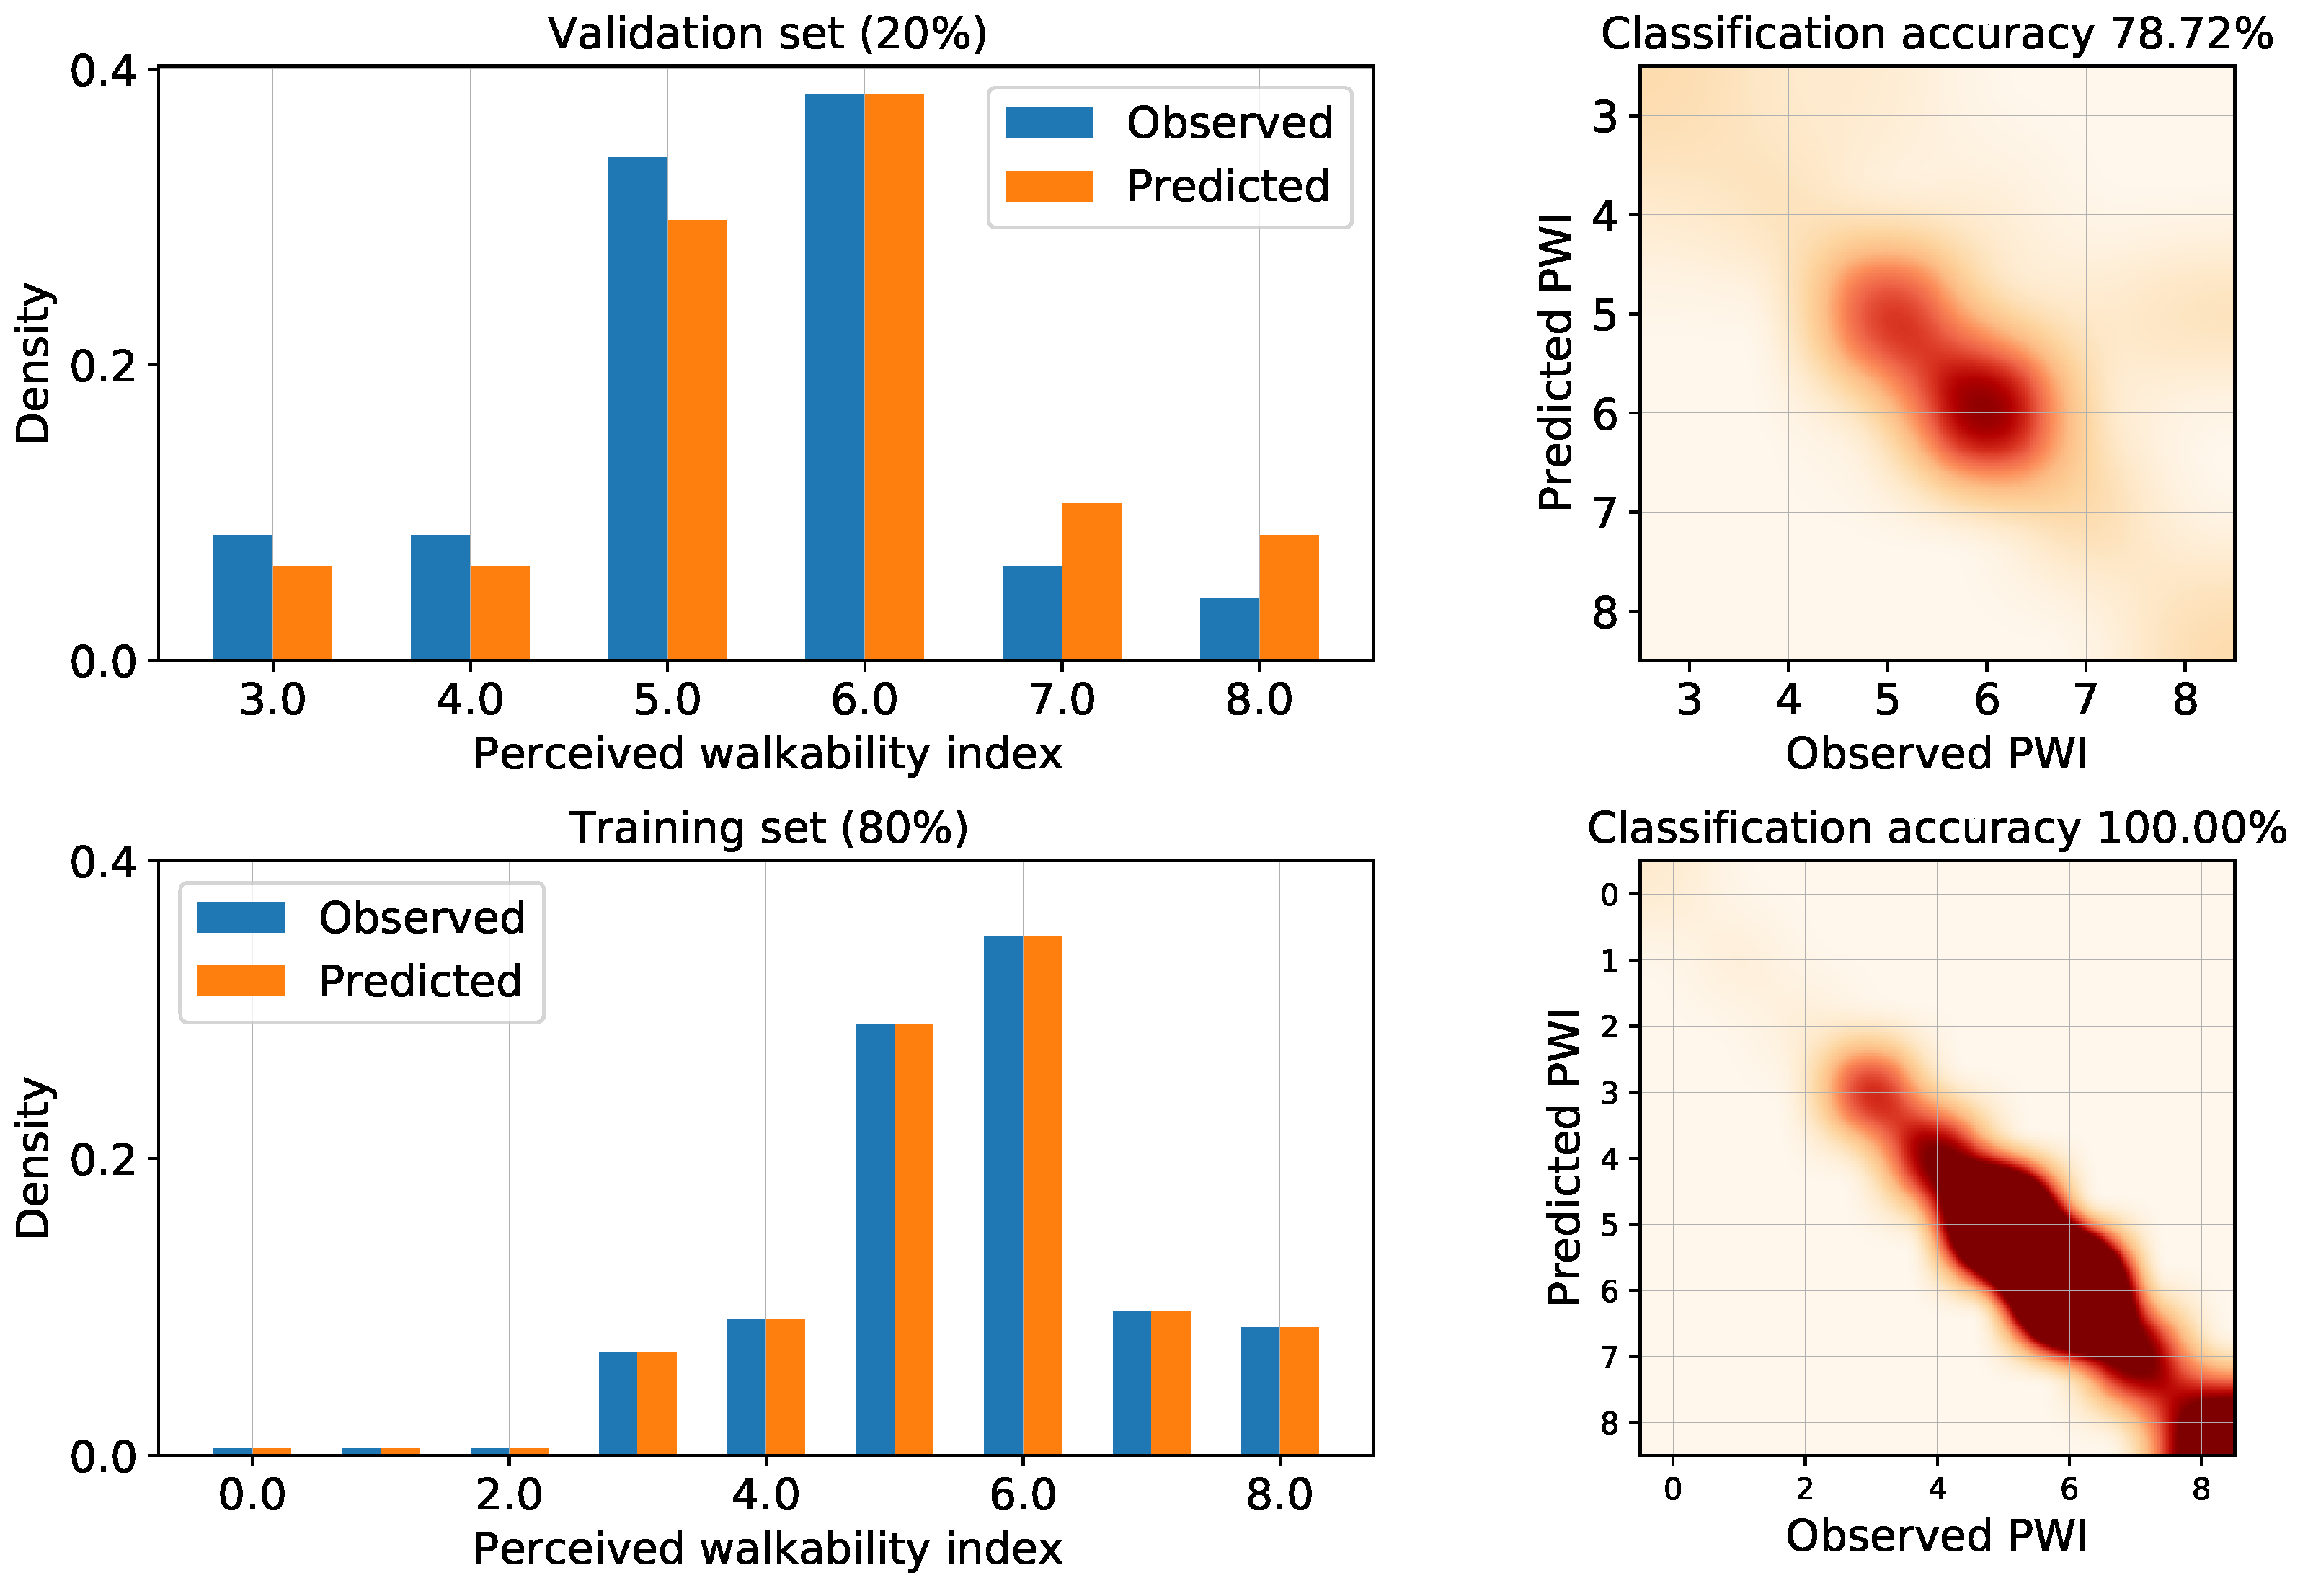
Regarding the predictive analysis,
Figure 5 presents the performances of the fitted deep neural network model. The results show that the model performances are quite good, with a classification accuracy of 78.72%, whereas the validation set represents 20% of the original dataset. The classification accuracy reaches 100% based on the training set.
5. Discussion
Regarding the influence of socio-demographics on PNW, we showed that gender and knowledge of the environment appear to have no effects. This is also true for age, frequency of visits, and transport mode. In contrast, differences between groups (young/adults/elderly people) were found in Moura et al. [
36], while a positive relationship was captured between walkability and active transportation [
1]. Factors influencing women’s propensity to walk are different from those affecting men [
38]. Nonetheless, sense perception was not the scope.
Besides, groups of a particular educational background have a more positive perception of neighbourhood walkability. This new finding highlights the complexity of measuring walkability using objective methods. In this regard, there is evidence that suggests that areas with highly educated people are more walkable [
39]. In general, the results clearly suggest the absence of direct effects on PNW. This may be explained by the fact that elderly people are under-represented in the sample. Thus, potential differences in terms of PNW cannot be captured and highlighted by the model in comparison with other group ages.
Since there are no significant differences between various socio-demographic groups in terms of perceived walkability, the variables collected in the first part of the questionnaire (socio-demographics) have not been considered as important determinants. Moreover, our further experiments show that even if we include them as input for fitting a full model, the analysis of the variable importance reveals once again that their importance with respect to the outcome is not significant. As expected, the predictive deep neural network model shows an effective relationship between the contributing items and PNW.
Based on the binomial regression model, it seems that half of all the contributing factors are relevant enough to explain PNW. Although some other studies also considered some of these factors such as landscape and trees as important factors for walking [
28,
40,
41,
42], the sense perception, which is important for walking, is not included in these studies. Safety and cleanness related factors are considered in many studies [
11,
12,
15,
28,
43,
44,
45], our findings confirm prior research as items related to the feeling of safety (“suspicious people” SENS22) and cleanness (“pavement quality and cleanness” SENP02) appear to play a key role on the PNW. In this regard, factors related to safety have been found to play a substantial role in walking, especially for women [
38].
The results presented showed that the “general view” ESTH04 is by far the most influencing factor. This can be explained by the fact that ESTH04 is a variable that asks for general sense perception.
6. Conclusions
Very few studies address walkability based on sense perception. To fill this gap, we investigated neighbourhood walkability (NW) based on sense perception in a neighbourhood of Brussels. In this paper, we investigated the concept of PNW based on sense perception through the examination of multiple contributing factors. A survey has been conducted in a Brussels district in order to collect information about socio-demographics, travel behaviour and, in particular, PNW. The internal consistency and reliability of the questionnaire were verified using Cronbach’s alpha and EFA. The results from the EFA were also compared to those of the hierarchically distributed correlation structure of the contributing factors (
Figure 3), with the objective of adding more insights into the understanding of the grouping mechanisms. A deep neural network model for classification has been estimated in order to highlight the predictive power of the contributing items on PNW.
This study shows that:
In general, socio-demographics have no particular influence on PNW. Nonetheless, groups from different education levels have different neighbourhood walkability perceptions. This is a new insight that should be investigated in further studies. If the education level is a determinant of PNW, then targeted policy measures should be undertaken in order to promote walkability for less-educated segments of the population. At this stage, the reason is unclear, and it is worthy of special attention.
The following items “pavement quality and cleanness” SENP02, “playgrounds” VALP12, “general view” ESTH04, “beautiful scenes” ESTH06, “open spaces” ESTH08, “building’s height” SENP14, and “suspicious people” SENS22 are the most relevant predictors of PNW. Policymakers should mainly focus on these particular items for promoting walkability.
The relevant factors that were identified in this study have substantial predictive capabilities, which shows that objective measures are not enough and that sense perceptions of individuals play a crucial role in the promotion of more walkable environments.
Nonetheless, prudence is needed when generalizing the results to other geographical contexts, given the sample size (n = 233) and geographical scope of the study area. Furthermore, as elderly people are under-represented, we cannot definitively confirm the absence of sense perception differences between elderly people and the other age groups. Further investigation is needed to clarify this particular point. Besides, additional factors such as seasonal effects, environmental issues, nature and uniformity of physical facilities, etc., could be incorporated in the study. In terms of physical infrastructure, the street width (or the number of lanes), speed limit, presence of signs, signals, crosswalks, sidewalks, etc., could potentially influence perception, safety, and walking-related decisions, and therefore be worthwhile to have been considered as well. Additionally, trip purpose (recreational, physical activity, walking to a bus stop or train station, etc.) could have been considered. Given that we focused on the perceived environment, further research is needed to determine the influence of the physical environment on the perceptions.
Based on the findings of this study, we conclude that it is crucial that the decision-makers pay more attention to improving the identified factors that affect the perception of neighbourhood walkability at neighbourhood scales regardless of the differences in socio-demographic groups. Additionally, we show that it is necessary to promote interactions between the population and local authorities to undertake smart decisions for further enhancing PNW. Additional surveys could be carried out for neighbouring districts in order to compare the PNW measurements. In doing so, policymakers need to define priority areas where improving measures benefits the community.
Author Contributions
Conceptualization, I.S., R.A., M.M. and M.C.; methodology, I.S., R.A., M.M. and M.C.; software, I.S., R.A. and M.M.; validation, I.S., R.A., M.M. and M.C.; formal analysis, I.S., R.A., M.M. and M.C.; data curation, R.A. and M.C.; writing—original draft preparation, I.S.; writing—review and editing, I.S., R.A., M.M., Z.A.-S. and M.C.; supervision, M.C.; project administration, I.S. and M.C.; funding acquisition, I.S. and M.C. All authors have read and agreed to the published version of the manuscript.
Funding
This work was supported by the National Fund for Scientific Research F.R.S.-FNRS (grant no 32730312).
Informed Consent Statement
Informed consent was obtained from all subjects involved in the study.
Data Availability Statement
Data are available upon request.
Conflicts of Interest
The authors declare no conflict of interest.
Abbreviations
The following abbreviations are used in this manuscript:
| PNW | Perceived Neighbourhood Walkability |
| HCM | Highway Capacity Manual |
| PLOS | Pedestrian Level-of-Service |
References
- Kim, E.J.; Kim, J.; Kim, H. Neighborhood walkability and active transportation: A correlation study in leisure and shopping purposes. Int. J. Environ. Res. Public Health 2020, 17, 2178. [Google Scholar] [CrossRef] [Green Version]
- Smith, K.R.; Brown, B.B.; Yamada, I.; Kowaleski-Jones, L.; Zick, C.D.; Fan, J.X. Walkability and body mass index: Density, design, and new diversity measures. Am. J. Prev. Med. 2008, 35, 237–244. [Google Scholar] [CrossRef] [PubMed]
- Chibane, S.R.; Gwiazdzinski, L. La marche enjeu de santé publique et de qualité de vie. Importance d’une analyse spatialisée de la «marchabilité». Le cas de l’agglomération grenobloise. Géocarrefour 2015, 90, 203–216. [Google Scholar] [CrossRef] [Green Version]
- Lo, R.H. Walkability: What is it? J. Urban. 2009, 2, 145–166. [Google Scholar] [CrossRef]
- Shashank, A.; Schuurman, N. Unpacking walkability indices and their inherent assumptions. Health Place 2019, 55, 145–154. [Google Scholar] [CrossRef] [PubMed]
- Arellana, J.; Saltarín, M.; Larrañaga, A.M.; Alvarez, V.; Henao, C.A. Urban walkability considering pedestrians’ perceptions of the built environment: A 10-year review and a case study in a medium-sized city in Latin America. Transp. Rev. 2020, 40, 183–203. [Google Scholar] [CrossRef]
- Peiravian, F.; Derrible, S.; Ijaz, F. Development and application of the Pedestrian Environment Index (PEI). J. Transp. Geogr. 2014, 39, 73–84. [Google Scholar] [CrossRef]
- Yameqani, A.S.; Alesheikh, A.A. Predicting subjective measures of walkability index from objective measures using artificial neural networks. Sustain. Cities Soc. 2019, 48, 101560. [Google Scholar] [CrossRef]
- McCormack, G.R.; Friedenreich, C.; Sandalack, B.A.; Giles-Corti, B.; Doyle-Baker, P.K.; Shiell, A. The relationship between cluster-analysis derived walkability and local recreational and transportation walking among Canadian adults. Health Place 2012, 18, 1079–1087. [Google Scholar] [CrossRef]
- Manaugh, K.; Kreider, T. What is mixed use? Presenting an interaction method for measuring land use mix. J. Transp. Land Use 2013, 6, 63–72. [Google Scholar] [CrossRef]
- Asadi-Shekari, Z.; Moeinaddini, M.; Shah, M.Z. Non-motorised Level of Service: Addressing Challenges in Pedestrian and Bicycle Level of Service. Transp. Rev. 2013, 33, 166–194. [Google Scholar] [CrossRef]
- Zohreh, A.-S.; Mehdi, M.; Muhammad, Z.S. Disabled Pedestrian Level of Service Method for Evaluating and Promoting Inclusive Walking Facilities on Urban Streets. J. Transp. Eng. 2013, 139, 181–192. [Google Scholar] [CrossRef]
- Fruin, J.J. Pedestrian Planning and Design; Metropolitan Assn. of Urban Designers and Environmental Planners: New York, NY, USA, 1971. [Google Scholar]
- Zupan, J.; Pushkarev, B. Pedestrian Travel Demand. Highw. Res. Rec. 1971, 355, 37–53. [Google Scholar]
- Landis, B.W.; Vattikuti, V.R.; Ottenberg, R.M.; McLeod, D.S.; Guttenplan, M. Modeling the Roadside Walking Environment: Pedestrian Level of Service. Transp. Res. Rec. J. Transp. Res. Board 2001, 1773, 82–88. [Google Scholar] [CrossRef]
- Dixon, L.B. Bicycle and Pedestrian Level-of-Service Performance Measures and Standards for Congestion Management Systems. Transp. Res. Rec. J. Transp. Res. Board 1996, 1538, 1–9. [Google Scholar] [CrossRef]
- Jensen, S.U. Pedestrian and Bicyclist Level of Service on Roadway Segments. Transp. Res. Rec. J. Transp. Res. Board 2007, 2031, 43–51. [Google Scholar] [CrossRef] [Green Version]
- Sarkar, S. Qualitative evaluation of comfort needs in urban walkways in major activity centers. Transp. Q. 2003, 57, 39–59. [Google Scholar]
- Brown, A.L.; Khattak, A.J.; Rodriguez, D.A. Neighbourhood Types, Travel and Body Mass: A Study of New Urbanist and Suburban Neighbourhoods in the US. Urban Stud. 2008, 45, 963–988. [Google Scholar] [CrossRef]
- Cao, X.; Handy, S.L.; Mokhtarian, P.L. The Influences of the Built Environment and Residential Self-Selection on Pedestrian Behavior: Evidence from Austin, TX. Transportation 2006, 33, 1–20. [Google Scholar] [CrossRef] [Green Version]
- Ewing, R.; Cervero, R. Travel and the Built Environment: A Synthesis. Transp. Res. Rec. J. Transp. Res. Board 2001, 1780, 87–114. [Google Scholar] [CrossRef] [Green Version]
- Kitamura, R.; Mokhtarian, P.L.; Laidet, L. A micro-analysis of land use and travel in five neighborhoods in the San Francisco Bay Area. Transportation 1997, 24, 125–158. [Google Scholar] [CrossRef]
- Shriver, K. Influence of Environmental Design on Pedestrian Travel Behavior in Four Austin Neighborhoods. Transp. Res. Rec. J. Transp. Res. Board 1997, 1578, 64–75. [Google Scholar] [CrossRef]
- Moeinaddini, M.; Asadi-Shekari, Z.; Sultan, Z.; Zaly Shah, M. Analyzing the relationships between the number of deaths in road accidents and the work travel mode choice at the city level. Saf. Sci. 2015, 72, 249–254. [Google Scholar] [CrossRef]
- Hoogendoorn, S.P.; Daamen, W. Pedestrian behavior at bottlenecks. Transp. Sci. 2005, 39, 147–159. [Google Scholar] [CrossRef]
- Kwon, Y.I.; Morichi, S.; Yai, T. Analysis of Pedestrian Behavior and Planning Guidelines with Mixed Traffic for Narrow Urban Streets. Transp. Res. Rec. J. Transp. Res. Board 1998, 1636, 116–123. [Google Scholar] [CrossRef]
- Petritsch, T.A.; Landis, B.W.; McLeod, P.S.; Huang, H.F.; Challa, S.; Skaggs, C.L.; Guttenplan, M.; Vattikuti, V. Pedestrian Level-of-Service Model for Urban Arterial Facilities with Sidewalks. Transp. Res. Rec. J. Transp. Res. Board 2006, 1982, 84–89. [Google Scholar] [CrossRef]
- Asadi-Shekari, Z.; Moeinaddini, M.; Zaly Shah, M. A pedestrian level of service method for evaluating and promoting walking facilities on campus streets. Land Use Policy 2014, 38, 175–193. [Google Scholar] [CrossRef]
- Moeinaddini, M.; Asadi-Shekari, Z.; Ismail, C.R.; Zaly Shah, M. A practical method for evaluating parking area level of service. Land Use Policy 2013, 33, 1–10. [Google Scholar] [CrossRef]
- Miller, J.S.; Bigelow, J.A.; Garber, N.J. Calibrating Pedestrian Level-of-Service Metrics with 3-D Visualization. Transp. Res. Rec. J. Transp. Res. Board 2000, 1705, 9–15. [Google Scholar] [CrossRef]
- Asadi-Shekari, Z.; Moeinaddini, M.; Aghaabbasi, M.; Cools, M.; Zaly Shah, M. Exploring effective micro-level items for evaluating inclusive walking facilities on urban streets (applied in Johor Bahru, Malaysia). Sustain. Cities Soc. 2019, 49, 101563. [Google Scholar] [CrossRef]
- Aghaabbasi, M.; Moeinaddini, M.; Zaly Shah, M.; Asadi-Shekari, Z.; Arjomand Kermani, M. Evaluating the capability of walkability audit tools for assessing sidewalks. Sustain. Cities Soc. 2018, 37, 475–484. [Google Scholar] [CrossRef]
- Liao, B.; van den Berg, P.E.; van Wesemael, P.J.; Arentze, T.A. Empirical analysis of walkability using data from the Netherlands. Transp. Res. Part Transp. Environ. 2020, 85, 102390. [Google Scholar] [CrossRef]
- Saelens, B.E.; Sallis, J.F.; Black, J.B.; Chen, D. Neighborhood-based differences in physical activity: An environment scale evaluation. Am. J. Public Health 2003, 93, 1552–1558. [Google Scholar] [CrossRef] [PubMed]
- Cerin, E.; Saelens, B.E.; Sallis, J.F.; Frank, L.D. Neighborhood Environment Walkability Scale: Validity and development of a short form. Med. Sci. Sport. Exerc. 2006, 38, 1682. [Google Scholar] [CrossRef] [Green Version]
- Moura, F.; Cambra, P.; Gonçalves, A.B. Measuring walkability for distinct pedestrian groups with a participatory assessment method: A case study in Lisbon. Landsc. Urban Plan. 2017, 157, 282–296. [Google Scholar] [CrossRef]
- Zhang, X.; Mu, L. The perceived importance and objective measurement of walkability in the built environment rating. Environ. Plan. B Urban Anal. City Sci. 2020, 47, 1655–1671. [Google Scholar] [CrossRef]
- Golan, Y.; Wilkinson, N.; Henderson, J.M.; Weverka, A. Gendered walkability: Building a daytime walkability index for women. J. Transp. Land Use 2019, 12, 501–526. [Google Scholar] [CrossRef]
- King, K.E.; Clarke, P.J. A disadvantaged advantage in walkability: Findings from socioeconomic and geographical analysis of national built environment data in the United States. Am. J. Epidemiol. 2015, 181, 17–25. [Google Scholar] [CrossRef] [PubMed] [Green Version]
- Aghaabbasi, M.; Moeinaddini, M.; Zaly Shah, M.; Asadi-Shekari, Z. A new assessment model to evaluate the microscale sidewalk design factors at the neighbourhood level. J. Transp. Health 2017, 5, 97–112. [Google Scholar] [CrossRef]
- Asadi-Shekari, Z.; Moeinaddini, M.; Zaly Shah, M. Pedestrian safety index for evaluating street facilities in urban areas. Saf. Sci. 2015, 74, 1–14. [Google Scholar] [CrossRef]
- Asadi-Shekari, Z.; Moeinaddini, M.; Shah, M.Z. A Bicycle Safety Index for Evaluating Urban Street Facilities. Traffic Inj. Prev. 2015, 16, 283–288. [Google Scholar] [CrossRef]
- Khisty, C. Evaluation of pedestrian facilities: Beyond the level-of-service concept. Transp. Res. Rec. 1994, 45–50. [Google Scholar]
- Lautso, K.; Murole, P. A study of pedestrian traffic in Helsinki: Methods and results. Traffic Eng. Control 1974, 15, 446–469. [Google Scholar]
- Tan, D.; Wang, W.; Lu, J.; Bian, Y. Research on Methods of Assessing Pedestrian Level of Service for Sidewalk. J. Transp. Syst. Eng. Inf. Technol. 2007, 7, 74–79. [Google Scholar] [CrossRef]
| Publisher’s Note: MDPI stays neutral with regard to jurisdictional claims in published maps and institutional affiliations. |
© 2021 by the authors. Licensee MDPI, Basel, Switzerland. This article is an open access article distributed under the terms and conditions of the Creative Commons Attribution (CC BY) license (https://creativecommons.org/licenses/by/4.0/).


 ,
, 


