
An Automatic Tool for the Determination of Housing Rental Prices: An Analysis of the Italian Context


1
Department of Architecture and Design, Sapienza University of Rome, Via Flaminia 359, 00196 Rome, Italy
2
Department of Civil, Environmental, Land, Building Engineering and Chemistry (DICATECh), Polytechnic University of Bari, Via Orabona 4, 70125 Bari, Italy
*
Author to whom correspondence should be addressed.
Sustainability 2022, 14(1), 309; https://0-doi-org.brum.beds.ac.uk/10.3390/su14010309
Submission received: 5 December 2021
/
Revised: 22 December 2021
/
Accepted: 24 December 2021
/
Published: 28 December 2021
(This article belongs to the Special Issue Sustainable Policies to Reduce the Negative Impact of Globalization on Underdeveloped or Developing Countries)
Abstract
:In the last decades, some global events such as the economic crisis of 2008 and the COVID-19 emergency of 2020, have generated more attention towards the housing rental market and its capacity to meet several social needs. In order to study the existent demand for houses, then define the interventions on the residential assets to make them more affordable for the most fragile population groups, adequate evaluation tools are required. With reference to the residential property segment of five metropolitan cities located in the Italian territory, the present research is aimed at analyzing the contribution of the most influencing factors on rental prices. In particular, this research refers to the rented properties of the second half of 2019, with a set of variables that represent the intrinsic and extrinsic factors of the local market. The implementation of an automated valuation model allows the determination of the most significant factors and the functional relationships that they have with housing rental fees. The outputs obtained could support the improvement of equitable public housing policies or could guide private investment decisions, such as refurbishment interventions of certain significant factors that could increase the market rental value. This study is the first step in wider research that is currently in progress, which aims to investigate the effects of the existing COVID-19 pandemic on the residential rental market.
1. Introduction
The recent rental market trend has constantly changed and is characterized by rapid bargaining, increasing rents, and high demand. Leased housing has gradually become an essential supplement to homeownership: worldwide, 1.2 billion people prefer this type of accommodation [1]. In Italy, leased housing has recently grown due to the various forms of leasing that ensure a tax benefit for the owners. The “short-term” rental is the segment affected by a significant transformation, with a constant evolution in the supply of houses for temporary or tourist use. An analysis of the rental market, based on a sample of online ads just prior to the COVID-19 pandemic, showed an increase in rents per m2 in the provincial capital municipalities. This has increased from 1.6% in 2017 to 3.3% in 2019, with the towing of smaller homes that are better furnished and in a good state of conservation [2]”. The situation has changed after the COVID-19 emergency occurred, where the drop in rental fees was higher in the biggest cities (−9.5%) where a larger number of students and workers have been detected, and the supply of housing properties to be leased has increased more than in smaller towns (−3.8%). The number of regularly registered lease contracts have grown by +4.2% compared to 2018, and most of them (about 80% of the total number of properties) are houses [3]. It represents a relevant share of the market demand, where in 2018 the Bank of Italy demonstrated that about 20% of Italian families in 2016 lived in a rented house, which was made up of 38% of the youngest people and 46% the poorest people [4]. In summary, it can be noted that the shorter the period required, the greater the attention both for the structural (or intrinsic) aspects of the apartment (e.g., small size, central area, brightness, and transport) and the accessory elements that are essential in making the apartment more comfortable. In this regard, the pleasantness (as well as the functionality) of the furniture, the services (including tourism) offered, the internet connection, the security, the ease in accessing and returning the apartment, and so on, can be indicated [5].
The related paradox is that since the early 1980s real estate assets have quintupled but this did not lead to an increase in affordable housing [6]. Furthermore, in the Italian context, the economic crisis of 2008 has gradually generated a decrease in rental fees until 2013 and 2014, due to the transfer of properties that, having become difficult to sell, have been placed on the rental market. From 2015, the slow economic recovery, also felt in the sales market, and the transfer of the supply of rental housing from the traditional residential sector to that of short-term rentals, led to a reduction in the supply of rental housing and, consequently, a constant growth in fees which, in 2019, rose to values almost equal to those pre-crisis [7].
In the current context, the spread of COVID-19 has determined significant effects on the Italian residential rental market. A greater number of potential tenants, due to a decrease in the ability to activate bank loans, could lead to a preference for leasing over purchasing, considerably changing the trend of the real estate market and its characterization [8,9]. Moreover, the spread of work digitalization and distance learning have been strongly influenced the relationship between the user and their home, where a significant number of remote workers and students left their rental houses to move to their original houses in which they lived until the COVID-19 spread. This phenomenon has been particularly observed in metropolitan cities such as Milan, Bologna, and Rome, where the rental fees have been decreasing by 0.2% for one-room apartments and 0.9% for two- to three-room apartments [10]. Therefore, the short-term rental market segment has been reconverted into rentals for residential use and it has added to the already available supply [11].
In the current contingence, the rental solution could represent a better way to live in houses, especially when work mobility or precariousness guides choices. It is also an investment opportunity characterized by increasing volatility that has made the sector more unstable and riskier in real estate returns. From a social point of view, the Italian rental housing market has been often seen as the main driver of public policies intended to improve the related needs expressed by the most fragile population groups. For these reasons, understanding the relevant mechanisms in the rental fee’s formation processes could provide support for boosting social interventions that are implementable through several public–private partnerships, such as the emerging Impact Finance [12].
2. Aim of the Study
With reference to the residential property segment of five metropolitan Italian cities in different locations, the aim of the study is to (i) identify the most influential factors on housing rental prices and (ii) analyze the contribution of them in terms of value increases or depreciation. The analysis is carried out on a sample of 220 housing properties rented in the second half of 2019 in each Italian city, i.e., Milan and Turin in Northern Italy, Rome in Central Italy, and Naples and Catania in Southern Italy. In order to detect the relevant indoor and outdoor characteristics, a set of 17 homogeneous intrinsic and extrinsic factors have been collected. According to consultations with local market operators, national and specific sector reports, and scientific research on the matter, the chosen factors are the ones that, most of all, occur in the bargaining phases between the house owners and renters.
The implementation of an automated valuation model (AVM) genetic algorithm on the collected data samples allows the recognition of the complex real functional relationships that interrelate the explanatory factors and the housing rental fees, by making possible the further analysis of the average contribution of each of them. In fact, the AVM has adopted the feature to automatically provide for numerous models, where the irrelevant factors are removed and characterized by different capacities of representing rental fee formation mechanisms in each city. The model that presents the best statistical robustness, empirical consistency, and the mechanisms investigated will be selected for determining the average contribution on rental prices.
For these reasons, the methodology proposed could be useful to understand the distribution and configuration of housing rental price dynamics and it can be a reference for urgent equitable housing policies [13]. In the international context, in fact, specific plans exist for regulating the determination of market rents that are fair and accessible to the weakest groups of the population, seen in Korea [14] and the United States of America (USA), with many programs managed by the US Department of Housing and Urban Development (HUD) that are designed to subsidize rents for low-income households [15]. In Italy, instead, different normative requirements have been promulgated (the latest of which is the Decree of the Ministry of Infrastructure and Transport, 16 January 2017) in order to make property rental prices more affordable [16]. They have been established through the adoption of social criteria which are properly indicated in public agreements among the main local institutions. These agreements, specifically tabulated, are part of the strategies of housing policies that are targeted to meet the primary requirements for adequate housing, in terms of quality and quantity standards, for the needs of the most vulnerable people. For social housing issues, the current modality for the reduced fees assessment is based on a local agreement (i.e., Law No. 431, 9 December 1998) and is periodically updated through a contract between the tenants and owners’ representations that establish the values [17].
The role of the rental market in the social and affordable housing dynamics is, therefore, evident. From this perspective, the present research can support the decisions for achieving the social and community targets set by Goal No. 11 “Sustainable City and Community” of the 2030 Agenda. Moreover, the recent spread of public–private partnerships intended for meeting the gap in funding between required investor returns and revenue based on affordable rents, such as the social impact investing field [18], highlights the need of specific related studies on the trend and dynamics of the rental sector.
The private owners of properties or real estate investors can use the analysis provided to start refurbishment interventions that will enable an increase in market rent, as well as to adapt the property characteristics according to the tenants’ requests, by meeting the demand. From the tenant’s point of view, instead, it could support the investment choices related to renting houses by monitoring the suitability of the required fees to the property attributes, or immediately choosing the city where, based on the presence of necessary domestic spaces and the ability to support the rent required by the market, it meets one’s needs.
It should be noted that the present study is the first step of wider research currently in progress, aimed to investigate the effects of the COVID-19 pandemic on the residential rental market. In particular, this will be done by verifying the modifications in rental prices in the five Italian cities already selected, comparing them to the prices recorded in previous years, and analyzing the likely different rental market appreciations in terms of the most influencing factors on rental fees.
The paper is structured as follows: in Section 3, the main contributions in the existing literature that is concerned with the analysis of different factors on rental prices are reported. In Section 4, a case study relating the five cities is introduced, where the explanatory variables considered are presented and the main descriptive statistics are analyzed. In Section 5, the AVM that will be implemented is described. In Section 6, the application of the technique to the case study is shown and the results are interpreted. In Section 7, the conclusions of the work are discussed, and the further developments are pointed out.
3. Background
The analysis of the most influential factors on selling and rental housing prices provides essential issues for the social purposes of sustainable urban planning included in the Agenda 2030′s goals. Understanding the preferences and decisional processes that characterized both the selling, and the renting, residential markets of an urban context highlight the critical issues that need to be improved for reducing the housing problems. Although the two real estate markets are strongly connected [19,20,21], the choice of buyers and renters derive from extremely different requirements and purposes. Previous studies have often examined the importance of various structural attributes in residential property consumers from the point of view of home buyers or owners, but they miss the perspectives of renters and tenants. Generally, the high quality of urban life strongly affects the purchase demands in the local market, but from the tenant’s point of view, the duration of the job agreement or the proximity to their workplace or university/school, as well as the public transport distances, could constitute the main determinants [22]. Chiwuzie et al. [23,24] have analyzed the tenant’s demands for intrinsic characteristics, such as the number and size of living rooms, bedrooms, toilet/bathrooms, and the type of floor finishes in five categories of residential properties in the city of Ede (Nigeria) in order to orient investors towards structural improvements that are able to enhance rental values. According to the results obtained by Jud, larger rooms and more rooms in a residential property led to higher prices [25]. Moreover, Okorie [26] found that at least 58.65% of residential tenants in Osogbo expressed a willingness to pay higher rent for the improvement of specific residential property structural attributes.
Many authors have pointed out the scarcity of empirical research on the critical factors influencing the rental value of residential properties and the aim is to address this gap in different geographical contexts, except for China, where the rental housing market is extremely relevant and largely addressed. For example, Joshua Adegoke has examined critical factors that influence the rental values of residential properties in the three densest areas of Ibadan metropolis (Nigeria) by showing that number of bathrooms, the number of living rooms, and the existence of burglar alarms are critical to bungalows, while number of toilets is critical to duplex typology. In low-density areas, instead, the residential location had a significant positive impact on the rental value of bungalows [27]. In general terms, the rental values of residential properties are affected by various housing characteristics which are related to the dwelling itself, as well as to the property location and neighborhood [28,29,30,31]. In particular, [32] Zhang and Jia have investigated the influencing factors of residential rent in Guangzhou city using 2845 transactions data. Their results showed that many factors, including the building area, age, total floors, elevators presence, number of bedrooms, aspect, decoration quality, grade of the kindergarten and the primary school nearby, and the distance from the railway station and the commercial center have a higher impact than the other variables on residential rent. In the analysis developed by Yang and Li [33] the major influencing factors on the house rental market in Harbin were examined in order to establish a price index system through an empirical study based on a sample of 260 housing transactions. The Chinese heavy urbanization has led a rapid increase in rental demand due to job mobility requirements, short-term agreements, and an overwhelming index of housing crowding. Due to the social and job dynamics that can occur, in the city of Beijing (China) in 2016, quantile regression of housing rent was conducted by [34], and the results indicated that higher-priced renters preferred to live in newly built houses with a larger living area, more bedrooms, in a higher school quality attendance zone, which is closer to an employment center, park, and school, than lower-priced renters. The analysis carried out on the spatial distribution of residential rentals and the influencing factors denote that the housing rental prices have strong spatial correlations, gradually declining from the city center to the suburb, and that traffic and public service facilities have a decisive impact on regional residential rentals [35]. In fact, the authors demonstrated that the longer the distance from the house to the employment center is, the lower the rental price. For every 1% increase in the distance to the major employment center, the average monthly housing rent will drop by about 0.042% at the 0.1 quantile and approximately 0.11% at the 0.9 quantile, respectively. At the same time, the study revealed that renters prefer to live close to bus stops and subway stations for good public transit convenience.
With reference to the extrinsic characteristics relating to the urban area in which the residential property is located, i.e., the location and the neighborhood, several Authors have extensively explored the impacts of neighborhood factors on housing rental prices, with particular regard to environmental aspects and public services [36]. In particular, Benjamin et al. [37] investigated the influence of public transportation on the apartment rent prices and found a negative relationship between housing rental prices and the distance to a subway station, i.e., a decrease in rent of around 2.50% for each 0.1-mile rise in distance. Using rental housing data in Tokyo (Japan), Sadayuki [38] empirically measured the spatial effects of public transportation, such as trains and subway stations, on housing rental prices by observing a discounting impact for each station’s proximity. Through six machine learning algorithms, Chen et al. [39] estimated the housing rental prices of the metropolitan area of Guangzhou (China) in association with commercial buildings, enterprises, hospitals, and metro stations. Singla and Bendigiri [40] applied four regression models to find out the factors affecting the rent of residential apartments in Pune, India, where higher distances from the nearest police station and fire station leads to lower rental values, as safety and security are the top priorities of residents seeking residential properties on a rental basis. The distance from employment zones, the nearest school/college, and the nearest public transport terminal negatively influences the rental value, as the greater the distance, the lower the rental value, and vice versa. Finally, the distance from the central business district and from hospitals has a positive effect on the rental values of a residential property, implying that higher distances from these places command higher rental values.
In this context, Schlaepfer et al. [41] evaluated how land use and environmental amenities influenced rental prices in Switzerland. Indeed, landscape amenities in urban, suburban, and peri-urban Switzerland were found to have positive effects on rental prices due to their views, different types of recreational infrastructure, and their proximity to lakes, wetlands, undisturbed areas, nationally significant landscapes, and cultural sites. Negative effects were caused by road noise, railways, industries, and power lines. With regards to Jakarta’s (Indonesia) housing market, Yusuf and Resosudarmo [42] applied a hedonic price analysis on housing rental values to investigate whether or not air pollution affected property values, represented by the housing rental price, and to try and infer how much people were willing to pay for an improvement in air quality. The outputs obtained are consistent with the empirical phenomena, where there is a strong correlation between the house’s structural characteristics for reducing the pollution, the neighborhood qualities, and house rent. In order to interpret the existing relationship between real estate rental prices and the geographical location of housing units, a machine learning algorithm was presented by Del Cacho [43]. This analysis was aimed at comparing the performance of both hedonic and non-hedonic pricing models applied to the problem of housing valuations in the city of Madrid (Spain). The research carried out by Oshodi et al. dealt with the development of a neural network model for estimating the rental prices of residential properties in Cape Town, South Africa, and the results revealed that the balcony and floor areas had the most significant impact on the rental price of residential properties, whereas the parking type and the presence of a swimming pool had the lowest influence on rental prices [44]. Ng and Deisenroth [45] described a mobile app that uses a machine learning algorithm to guide prospective renters to areas of London that meet their rental requirements, particularly in regard to the cost of rentals.
Through the hedonic price model, Marks has studied the influencing factors on rent according to 3385 residential units in Vancouver and demonstrated that the presence of a garage, the number of bedrooms, and the building age had a significant impact on the rent prices [46]. Zietz et al. showed that the physical house characteristics such as the number of toilets, the unit size, and the availability of a balcony influenced house rent prices [47]. Clark and Lomax [48], when referring to the English housing rental market and using regression analyses, observed that the number of rooms in the property, the proximity to central London and to railway stations, being located in more affluent neighborhoods, being closer to local amenities, and a closeness to performing schools were the most significant factors that affected the rental listing price. Ezebilo [49] studied the housing rent prices in Port Moresby for a period of 13 months and confirmed that rental prices are strongly linked to the number of bedrooms and the location, where the lack of basic trunk infrastructure and services attracted the lowest rental prices and houses located in and around the central business district had higher rental prices.
In this regard, it should be pointed out that in the Italian context the literature has often focalized on the social aspects of the residential rental market, such as its ethnic and disability discrimination [50,51] and affordable and collaborative housing solutions [52,53,54]. These aspects highlight the role of the rental market in the provision of an improved public policy that fills the existing Italian critical issues of rental properties.
4. Case Study
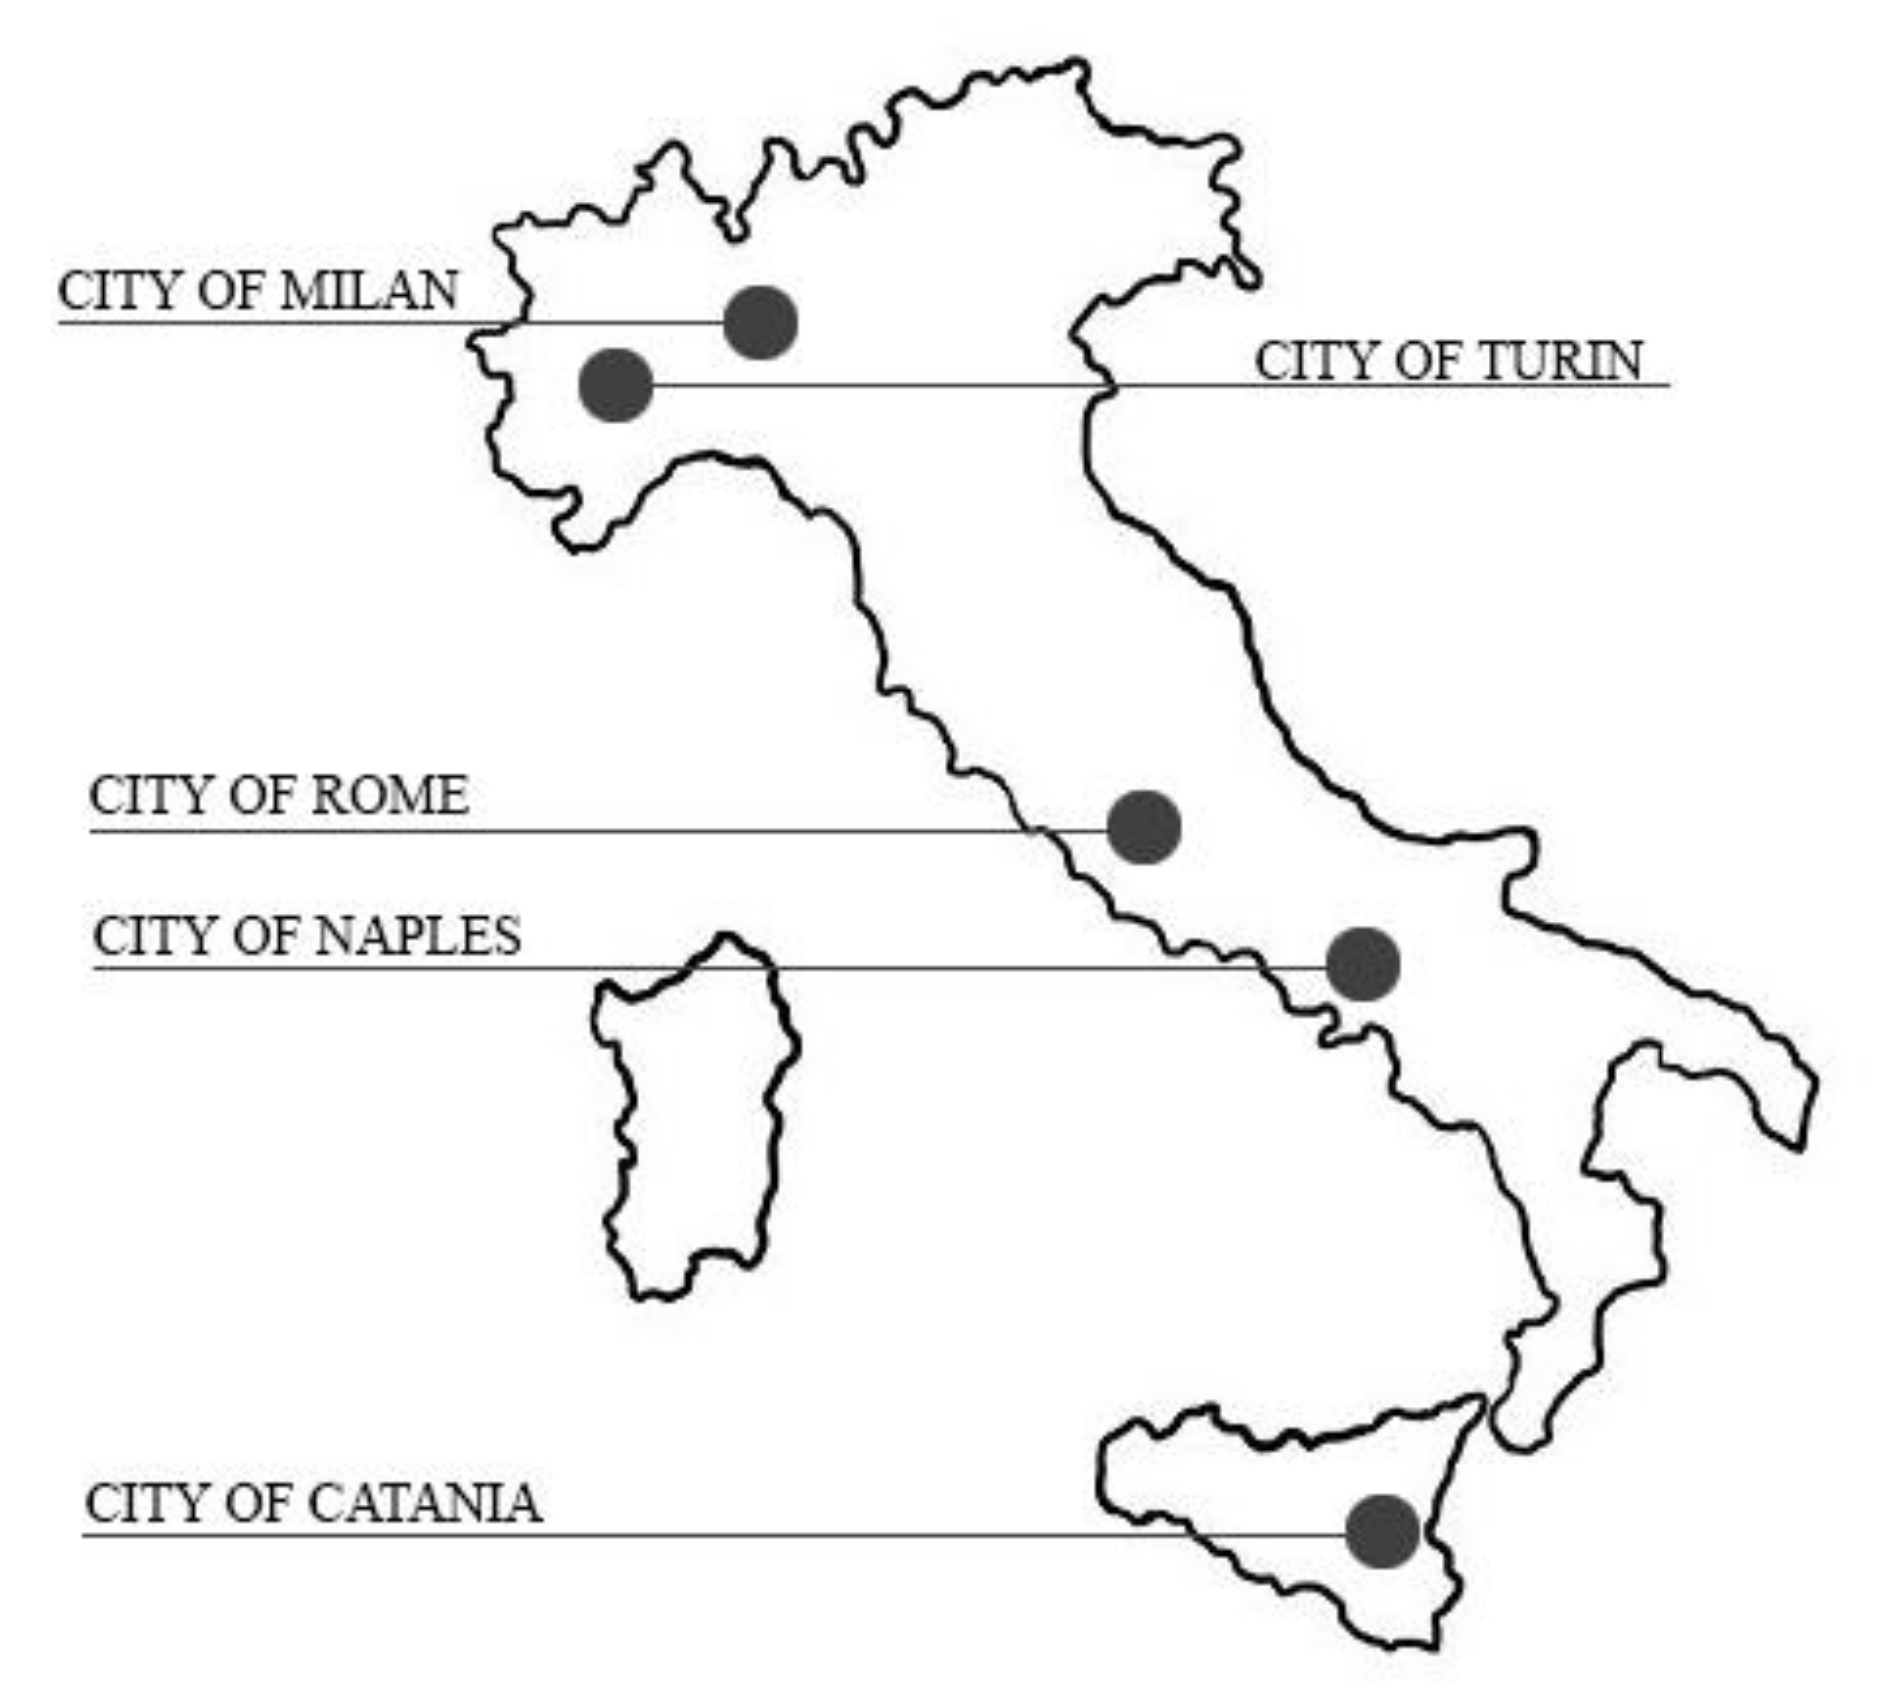
The case study concerns five samples of 220 residential properties rented in the second half of 2019 located in five Italian cities, Milan and Turin in the Northern Italy macro area, Rome in Central Italy, and Naples and Catania in Southern Italy. In Figure 1, the locations of the five cities considered are shown.
Each property presents a set of known variables relating to the characteristics of the property, as well as to the external layout of the associated urban spaces and services.
Variables
According to the local residential market and the reference literature, the determinants selected in the research constitute the main influential intrinsic (technological and physical) and extrinsic (locational) characteristics, whose contributions to the housing rental prices differently affects the market. For each residential unit, the rental price (Rp), expressed in €/m2 per month, is the dependent variable of the analysis. The other attributes selected, which have been validated through direct surveys carried out by consulting local market operators and real estate agents, are the independent ones. The sizes of the data samples satisfied the “rule-of-thumb” where N is the number of subjects detected and m is the number of influencing factors considered. The rule states that N ≥ 50 + 8m is required for multiple correlation, and N ≥ 104 + m is required for partial correlation. For each city, 17 independent variables and 220 dependent ones were collected.
It should be pointed out that the variable values selected have been normalized by the maximum found for each category in order to obtain a unique range of variation between 0 and 1, allowing the comparison of the data.
In Table 1, the variables considered are described, their acronyms given, their typology (cardinal or dummy) provided, and the description and measurement units are specified.
Tables S1–S5 reported in the Supplementary File show the main descriptive statistics of the rental prices and the influencing factors detected for the five study samples considered. This analysis is fundamental to understanding their features with respect to the aim of the work in order to verify the consistency of the results.
5. Methodology
In the present research, the methodology implemented is part of the AVM category and is known as “evolutionary polynomial regression” (EPR). It is an econometric technique able to integrate the best features of numerical regression with genetic programming [56]. EPR is able to search for the model that simultaneously maximizes the accuracy of the data and the parsimony of the final mathematical functions by using multi-objective genetic algorithms. The results provided by its application consist of different number of models expressed by a polynomial structure in which each term is composed by a numerical coefficient, an input variable, or a combination of both, as well as an exponent. In the processing preliminary phase, the user chooses the exponents from a range of candidate real numbers to select the maximum terms number. Thus, according to the initial conditions established by the user and the specific aim of the work, each model generated by the technique presents various complexities in terms of the mathematical expression of the form. In Equation (1), the generic symbolic expression returned by the EPR technique application is shown:
where m is the number of model additive terms, aj are numerical coefficients to be valued, Xi are the candidate input variables among those initially considered in the analysis, (j, z)-with z = 1,..., 2k is the exponent of the z-th explanatory variable within the j-th term, a0 is the equation constant term, and f is a function selected by the user between a set of different mathematical expressions. In this regard, it should be specified that in the functions chosen by the user, there is also the no function option. The functional form of the different models, defined by EPR, is the best combination of the input variables Xi, which are identified for each one of the exponents and the numerical coefficients ai, which are estimated through a least squares linear problem.
A relevant advantage of the EPR technique concerns its ability to simultaneously pursue different objective functions, i.e., to define an optimal Pareto frontier of the conflictual objectives in order to (i) maximize the model accuracy through the satisfaction of appropriate statistical indicators, (ii) maximize the model parsimony by minimizing the number of coefficients (ai) of the equation, and (iii) decrease the complexity of each model through the minimization of the number of explanatory variables (Xi) of the final equation.
The statistical performance of each equation is determined through the Coefficient of Determination (CoD) that is calculated as shown in Equation (2) and it varies from the value “0” (minimum statistical accuracy) to the value “1” (maximum statistical accuracy). In particular, the fitting of each model is higher when the CoD is close to the unit value, which confirms the model structure’s suitability to represent the overall observed dataset.
where ye are the values of the dependent variable assessed by the EPR methodology, yd are the collected values of the dependent variable, and N is the sample size. Therefore, the user selects the model that best fits with the analysis by choosing from among the several models generated by the methodology and characterized by different algebraic forms, variable combinations, and levels of CoD.
Application of the Methodology
In the present analysis, the EPR methodology is iteratively implemented for each sample collected, by considering the structure of the generic expression identified in Equation (1) without the function (f) and with the dependent variable Rp (rental price) in logarithmic form (Y = ln(Rp)).Each additive monomial term of the mathematical expression is assumed to be a combination of the input variables raised to the proper numerical exponents. In particular, the candidate exponents selected from the research belong to the set (0; 0.5; 1; 2) and the maximum number l of additive terms in the final expressions are assumed to be eight.
The implementation of the econometric technique for each Italian city considered has generated several models. For each study sample, the choice of the “best” model to be analyzed for the functional relationships between the explanatory variables and the rental prices has been carried out, taking into account (i) the statistical performance level, (ii) the complexity of the algebraic expressions, and (iii) the empirical coherence of the coefficient’s signs. The first aspects mentioned are immediately examined as the CoD is associated by EPR with each model and the mathematical form is visible in the quantity of the terms of the equation and in the combination of the variables in each term. The empirical coherence of the functional relationships between the input variables in each model and the rental prices, is a less immediate operation to be carried out by the user, especially if there are more variables combined in the terms of the equation and they occur repeated more times
The five models chosen between those provided by the EPR technique for each study sample are reported in Table 2.
First of all, it should be noted that the models selected are characterized by a different algebraic form complexity, and that they have an average CoD equal to about 80% (88.69% for the city of Milan, 79.31% for the city of Turin, 86.87% for the city of Rome, 74.92% for the city of Naples, and 67.06% for the city of Catania).
The statistical performance indicator associated by EPR to each model shows a high statistical reliability in terms of the coherence of the detected data. This is confirmed by other calculated statistical indices, i.e., the root mean square error (RMSE), which refers to the square root of the mean of the squared errors between the prices of the original sample and the values estimated through the model the mean absolute percentage error (MAPE), which refers to the average percentage error between the detected prices and the values estimated; and the maximum absolute percentage error (MaxAPE), which refers to the maximum percentage error between the detected prices and the values estimated through the model. Furthermore, in order to analyze the stability of each functional model selected, and to flag problems like overfitting (or selection bias), a ten-fold cross-validation [57] has been implemented on the starting database of each study sample, where the outputs obtained confirm the good performance prediction of the functional models.
With reference to each sample detected for the Italian cities analyzed in the present research, in Table 3 the variables selected by EPR as the most influential on the residential rental prices are reported. Regarding the intrinsic variables selected by the model for the five cities, it should be pointed out that the internal area and the number of bathrooms are included in all models, whereas the bad quality of the property maintenance conditions are not in any models. The presence of the kitchen located in the same living room of the property is considered only in the case of the city of Catania, whereas the property EPC labels from C to E are relevant in the residential market of the city of Rome. With reference to the extrinsic variables, the property location in the central municipal trade area constitutes one of the most influencing factors considered by potential renters, as it is included in all models obtained for the study samples of the cities analyzed in the present research.
6. Results Interpretation
The determination of the contribution of each selected influencing factor on housing rental prices is carried out through an exogenous approach, where the empirical consistency of the functional links between the variables in each model, the rental prices, and the determination of the contribution of the variables are verified through the variation of the i-th variable analyzed in the interval of the observed sample by keeping the values of the other variables constant and equal to the respective average.
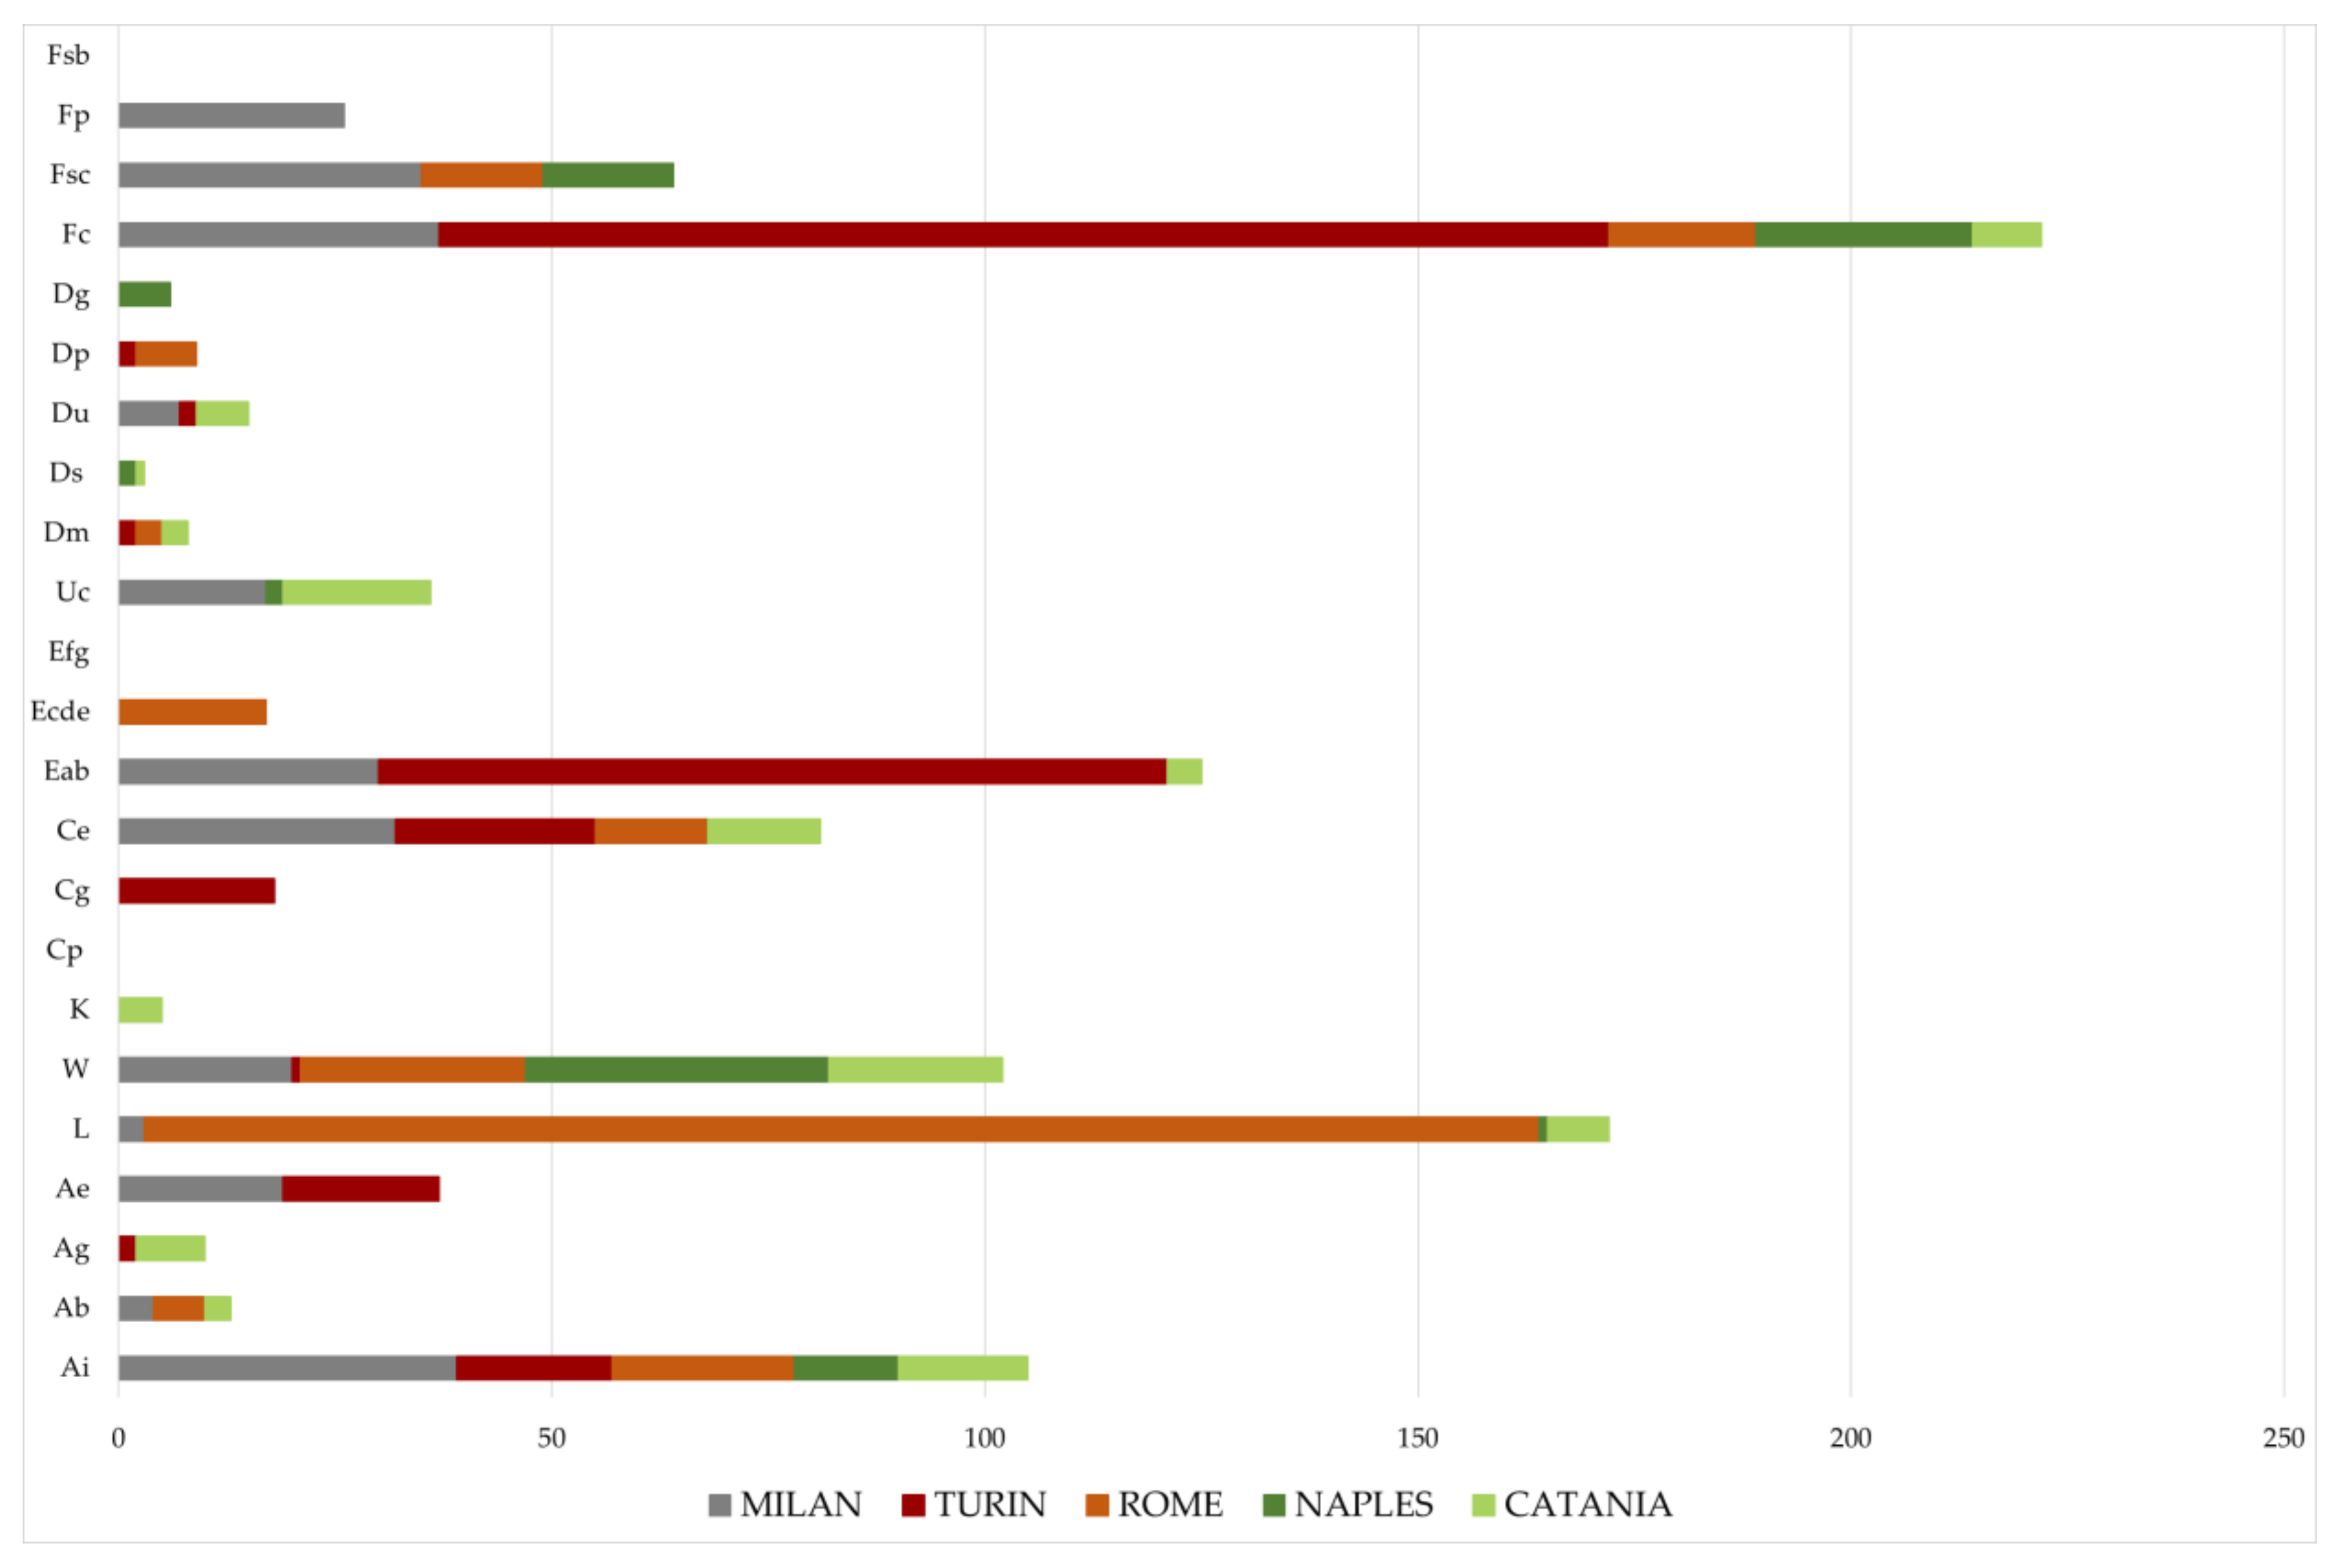
The considerations to be raised on the outputs obtained for each city are illustrated below. Firstly, the expected functional correlations between the explanatory variables and the rental prices have been confirmed by the EPR models by verifying the empirical coherence of the coefficient’s signs of the selected factors with the dependent variable of the rental price. For each Italian city, in Table 4, Table 5, Table 6, Table 7 and Table 8, the typology of the functional links between the main influential characteristics selected, the rental prices, and the variations in rental prices related to each variable in terms of the average percentage of contribution are reported. In Figure 2, instead, the average percentage contributions (in absolute terms) are represented.
The results obtained can be analyzed by carrying out some considerations. First of all, with reference to the intrinsic variable related to the internal area of the property (Ai), it is evident that this variable represents the most relevant influential factor on rental prices in all study samples considered. The factor Ai is linked to the rental prices through a direct correlation: for all the samples, the positive percentage of variation on rental prices gradually decreases with the increasing property surface area. This can be explained with the reduction in market demand in terms of the number of potential renters able to afford higher monetary amounts for property renting.
In the cities of Milan, Rome, and Catania the surface areas of balconies, terraces, and patios (Ab) had a positive impact on rental prices, where the presence of these domestic spaces led to an increase in rental values approximately equal to 4% compared to their absence in the city of Milan, as well as an increase of 20% seen in the city of Rome, and an increase of 10% in the city of Catania. The contribution of the factor Ab on rental prices decreased progressively as the balconies, terraces, and patio surface areas increased, denoting a greater importance for these spaces rather than their dimensions.
According to the study samples collected, and according to the EPR models, the surface of the private external space (Ag) had a significant influence on the housing rental prices for the Italian cities of Turin and Catania, whereas it was not included among the main characteristics in the rental price formation mechanisms in the other cities. For both cities, the functional relationship was consistent with the expected trend, and it directly shows a growth in rental prices related to the private external space extension (+2% for the city of Turin, +8% for the city of Catania).
A direct functional relationship was also found between the presence of condominium areas (Ae) and the property rental prices for the two selected cities located in Northern Italy (Milan and Turin), equal to +19% and +18%, respectively.
The average influence of the floor level on which the property is located (L) on the housing rental prices was equal to +3% in the residential market of the city of Milan, to 16% in the city of Rome, to +1% in the city of Naples, and +2% in the city of Catania. In particular, from the ground floor to the first floor, the increase in price was about 11% in Milan, whereas from the first to the second floor, the price was 5% higher, and from the second floor to the upper floors, there was a constant increase of 3%. The lowest appreciation of renters for residential units located at the ground floors was identified also in the city of Catania, with a rental price drop equal to 6%, whereas the top floor position led to a value increase equal to 4% compared to the middle floors. For the cities of Rome and Naples, the percentage of positive variation on rental fees was constant for each floor level passage.
The presence of the dummy variable related to the quality of the property maintenance conditions, in four models out of five, demonstrated a fundamental role played by this factor on potential renters’ decision processes. Firstly, as previously discussed, the bad quality of the property maintenance conditions (Cp) was not included in any EPR models. For the city of Turin, the simultaneous presence of the good (Cg) and excellent (Ce) quality of the property maintenance conditions in the model generated by EPR allowed the analysis of the average contribution on rental prices related to the variation from the worse state (Cp) (by keeping both Cg and Ce = 0) to a better one (Cg) (by Ce = 0and Cg = 1) and to the best state (Ce) (by keeping Cg = 0 and Ce = 1).
With regards to the impacts of the energy component (Eab and Ecde), this factor was related to the cities of Milan, Turin, and Catania (for which the Eab variable was found in the models selected) and for the city of Rome (for which the variable Ecde was detected). The significant residential market appreciation for the highest energetic labels was confirmed by the high attention paid to the energy retrofit in buildings aimed at containing the energy consumption of buildings and, in general, to reduce the impact of CO2 emissions and greenhouse gases into the environment [58,59].
For the variable of the age of the building in which the residential unit is located (Uc), the direct relationship with the rental prices was detected for the cities of Milan, Naples, and Catania, which showed a greater appreciation by the market for properties located in historical/old buildings compared to those in more recently made buildings (+17% for the city of Milan, +2% for the city of Naples, and +17% for the city of Catania).
According to the models generated by EPR for each study sample selected for the analysis, the number of bathrooms (W) represented a relevant factor for housing renters and owners in all the Italian cities analyzed, as it was strongly connected to the property surface. The expected direct trend that linked this variable with the rental prices was verified for all the models obtained, demonstrating that an increase in the bathroom number corresponded to higher rental values (+20% for the city of Milan, +1% for the city of Turin, +35% for the city of Naples, +26% for the city of Rome, and +20% for the city of Catania).
From the analysis of the influence of extrinsic variables on rental prices in the five Italian cities, an interesting consideration arose. Firstly, only for the city of Catania, the two variables related to the accessibility level of the urban area in which the property was located, that is, the distance from the nearest subway (Dm) and the distance from the central train station (Ds), are included in the model. This denotes the important role played by the closeness of public transportation in the renter decision processes. In particular, by analyzing the marginal variations in rental prices according with variations of (Dm) in the range of values allowed in the study sample, from 0 to 4.4 km for (Dm) and from 0.4 to 9.5 km for (Ds), a contribution of each variable was observed if the apartments were located near the subway, attesting a constant decrease in prices for the furthest residential units. The inverse functional relationships detected (−3% for Dm and −1% for Ds) confirmed the empirical evidence of a decrease in housing rental prices at a higher distance from the nearest metro stop.
With reference to the cities of Turin and Rome, an increase in rental prices was observed at a progressively higher distance from the nearest subway (+2% for the city of Turin and + 3% for the city of Rome). The result obtained could appear contrary with the expected phenomena, as a closer metro stop is essential for workers and students to reach their offices and schools/universities. However, it could be relative, or also associated with negative issues such as nuisances (e.g., congestion and noise/air pollution). For example, Zhang et al. [32] reported a negative effect of public transport accessibilities on housing prices in Hangzhou, China. The influence of metro accessibility on Xi’an residential property values has been studied by Li [60], where the author pointed out that within two kilometers of the road network distances from metro stations, property value uplift is lowest in areas immediately adjacent to metro stations, explained by negative externalities around metro stations outweighing the accessibility gains. In the case study, for both the cities, the output was valid in the situation for which the property was in the non-central area (e.g., semi-central, peripheral, or suburban). In these specific cases, the metro stations are set in socially, culturally, and aesthetically degraded urban portions, and are a repository of illegal actions and unsafe places.
Similar observations are seen with the variable of the distance from the central train station (Ds) because the analysis showed a direct relationship between this factor and the rental prices for the cities of Naples (+2%). The output obtained confirmed the absence of appreciation for buildings located closer to the rail station due to the acoustic and air pollution deriving from the frequent trains’ passage, but also for the presence of insecure conditions and often degraded urban spaces.
Among the most influential factors in rental prices formations, in the models obtained for the cities of Milan, Turin, and Catania, is the distance from the nearest university center (Du). In fact, the property rental values of the city of Turin increased with shorter distances from the nearest university (−2%). On the contrary, for the study samples related to the cities of Milan and Catania, an increase in rental price was observed, connected to other extrinsic factors that characterize the university district for which the closeness of the university center was not appreciated by potential renters (+7% for the city of Milan and +6% for the city of Catania). Furthermore, the properties near universities are often for student renting, and this could lead to a separate market segment where the rental price formation mechanisms could be different from the general rental market.
The models of the cities of Milan, Turin, and Rome attested to a market appreciation for the proximity to the central pole of each city; in particular, an inverse correlation observed between the distance from the central pole (Dp) and the rental prices confirmed the relevance of the residential units close to them (−1% for the city of Milan, −2% for the city of Turin, and −7% for the city of Rome). As the distance from the central pole grew, the rental values dropped, as with semi-central and peripheral areas where other factors that negatively influence the prices were reached.
For the distance from the nearest urban green space (Dg), exclusively for the city of Naples, a decrease in rental prices equal to 6% was observed. The output confirmed the empirical evidence of a rise in rental fees for a reduced distance from the main green spaces of the city, demonstrating its importance for potential renters as a place to socialize, meet people, especially, for the several advantages that the green areas provide (e.g., the so-called ecosystem services). The case of Naples was associated with bad maintenance and qualities of green spaces near the properties detected, which were often unsafe, dirty, and poorly lit.
The municipal trade area in which properties are located represented one of the most influencing factors on the rental price dynamics. First of all, it should be noted that the property location in a specific municipal area presupposed the residential unit proximity to a less or more qualified portion of the city, characterized by the absence or presence of some city landmarks (green areas, the central pole, amenities, etc.) and by specific accessibility and an infrastructure level. In this sense, the variables related to the municipal trade area in which the property is located, such as the central area (Fc), the semi-central area (Fsc), and the peripheral area (Fp) constituted a summary indication of the spatial context near the house, as it could represent a proxy variable of other characteristics that have a relevance on the residential market that have not been considered in the present analysis. The models for all the cities selected in the analysis have pointed out a significant influence of the property position in the central trade area (Fc). In particular, for the city of Milan, the contribution of this variable on rental fees was equal to +37% considering the transfer of a property ceteris paribus from the peripheral municipal area to the central one and +1% from the semi-central area to the central one. For the city of Turin, the positive variation on the rental values recorded if the property was located in the central area was equal to 135%; for the city of Rome, the increase in rental prices was equal to 17%; for the city of Naples it was equal to 44% from the peripheral area to the central one, and 25% from the semi-central area to the central one; and, finally, for the city of Catania, a growth equal to 8% was observed. An inverse correlation between the housing rental prices and the location of the property in the peripheral trade area (Fp) was detected for the city of Milan by determining a decrease in the prices equal to 27% passing from the central area to the peripheral one and a decrease of 26% from the semi-central area to the central one. Finally, the contribution of the property location in the semi-central municipal trade area (Fsc) on the rental prices was appreciated by the model for the cities of Milan, Rome, and Naples, equal to about +35% for the city of Milan, +15% for the city of Naples, and +76% for the city of Rome.
7. Conclusions
In recent years, the role of rental housing as a tool for social policies has risen in its prominence. In the Italian context, it has recently developed due to the critical issues regarding the most fragile segments of the population (e.g., the disabled, poor, immigrants, and students). However, there is still a gap between the interventions implemented to increase affordable housing and the real needs. Moreover, the exacerbated economic crisis deriving from the reduced financial stability due to the COVID-19 pandemic effects raised public and private attention to the rental market more than the selling market. Numerous studies have investigated the housing rental price determinants to understand the mechanisms that lead to rental price formation, to then provide support for the public subjects that want to detect the real types of solutions necessary for reducing the housing crisis. In the Italian context, the lack of specific tools to support the development of policies to improve existing housing standards were highlighted [61].
The present research is part of the framework that was outlined. Five rental housing markets of five Italian cities (Milan, Turin, Rome, Naples, and Catania) have been studied to understand the most influential factors in the rental price formation processes. Therefore, a sample of 220 residential properties rented in the second half of 2019 in each of the cities were considered. The application of the AVM allowed the identification of a model for each city that was able to represent the complex existing linkages among the sets of variables considered (both intrinsic and extrinsic factors) and the dependent variable (rental price). The results obtained are consistent with those expected. The internal area and the number of bathrooms were included in all models, whereas the bad quality of the property maintenance conditions appeared to be irrelevant for all the cities. The presence of the kitchen located in the living room of the property was considered only in the case of the city of Catania, whereas the property EPC labels from C to E was relevant to the residential market of the city of Rome. With reference to the extrinsic variables, the property location in the central municipal trade area constituted one of the most influencing factors considered by potential renters, as it was included in all models obtained for the study samples of the cities analyzed in the present research. The number of bathrooms, the central location, the proximity to the central pole, and the distance from noisy and polluted urban elements (e.g., the subway and train stations) represented the most significant factors for the markets considered.
In the case of affordable housing needs, the development of effective public policies could be supported by these results in order to guide the subjects involved in the provision of interventions that take into account the detected factors. The outputs of this research could be a valid reference for public administration in the following ways: (i) to manage, in a more effective way, residential assets; (ii) to draw up rules and regulatory actions to better govern the rental market in order to protect the most fragile groups of the population; and (iii) to have a framework of reference for updating the public agreements used to define affordable social rentals. Also, the results could be helpful for private investors to individuate the most influential factors in the rental sector in order to update and/or innovate the construction process to meet the technological and environmental comfort requirements of the tenants by increasing the property values [62,63,64].
The present research constitutes the first step of wider research currently in progress, aimed at investigating the effects of the still ongoing COVID-19 pandemic on residential rental market segments. For future insights, the results will be used as term of comparison for the analysis of the effects generated by the pandemic, showing the different appreciations of certain influential factors before and after its spread in the Italian territory. Furthermore, the assessment of private investors’ convenience deriving from the refurbishment interventions carried out on the most influential factors detected could be also developed in order to determine the most profit achievable in each of the five cities and to identify the cities that are potentially more remunerative.
Supplementary Materials
The following supporting information can be downloaded at: https://0-www-mdpi-com.brum.beds.ac.uk/article/10.3390/su14010309/s1, Table S1: Descriptive statistics of the variables for the city of Turin; Table S2: Descriptive statistics of the variables for the city of Milan; Table S3: Descriptive statistics of the variables for the city of Rome; Table S4: Descriptive statistics of the variables for the city of Naples; Table S5: Descriptive statistics of the variables for the city of Catania.
Author Contributions
Conceptualization, F.T.; methodology, F.T.; software, F.D.L.; validation, D.A., F.T. and F.D.L.; formal analysis, D.A.; investigation, R.R.; resources, R.R.; data curation, F.D.L. and R.R.; writing—original draft preparation, R.R.; writing—review and editing, D.A. and R.R.; visualization, F.D.L.; supervision, F.T.; project administration, F.T.; funding acquisition, F.T. All authors have read and agreed to the published version of the manuscript.
Funding
This research received no external funding.
Institutional Review Board Statement
Not applicable.
Informed Consent Statement
Not applicable.
Conflicts of Interest
The authors declare no conflict of interest.
References
- Gilbert, A. Rental housing: The international experience. Habitat Int. 2016, 54, 173–181. [Google Scholar] [CrossRef]
- Banca d’Italia. Il Mercato Degli Affitti Nelle Città Italiane: Un’Analisi Basata Sugli Annunci Online, di Michele Loberto, Temi di Discussioni, n. 1228. 2019. Available online: Https://www.bancaditalia.it/pubblicazioni/temi-discussione/2019/2019-1228/tema_1228.pdf (accessed on 27 October 2021).
- Rapporto sul Mercato Immobiliare della Locazione in Italia. 2020. Available online: https://www.agenziaentrate.gov.it/portale/documents/20143/263076/RI2020_20200521 (accessed on 15 March 2021).
- Banca d’Italia. Indagine sui Bilanci delle Famiglie Italiane Nell’anno 2018. Available online: https://www.bancaditalia.it/pubblicazioni/indagine-famiglie/index.html (accessed on 27 September 2021).
- Requadro. Gli Affetti Brevi tra Mercato e Future. L’impatto della Pandemia da COVID-19 sul Mercato Degli Affetti Brevi. Available online: https://www.bancaditalia.it/pubblicazioni/interventi-vari/int-var-2021/Donato_convegno_Requadro_affitti_brevi_07102021.pdf (accessed on 27 September 2021).
- Rondinelli, C.; Veronese, G. Housing rent dynamics in Italy. Econ. Model. 2011, 28, 540–548. [Google Scholar] [CrossRef]
- Ufficio Studi Solo Affitti. Available online: www.soloaffitti.it (accessed on 27 September 2021).
- Ilsole24Ore–Condominio. Available online: https://www.quotidianocondominio.ilsole24ore.com/art/gestione-affitti/2021-10-13/affitti-indagine-tecnocasa-provenienza-inquilini-184811.php?uuid=AEy1xip&refresh_ce=1 (accessed on 27 September 2021).
- Idealista. Available online: www.idealista.it (accessed on 27 September 2021).
- Housinganywhere. Available online: www.housinganywhere.com (accessed on 27 September 2021).
- Ufficio Studi Tecnocasa. Available online: www.tecnocasa.it (accessed on 27 September 2021).
- Corvo, L.; Pastore, L. The challenge of social impact bond: The state of the art of the Italian context. Eur. J. Islamic Financ. 2019. [Google Scholar] [CrossRef]
- Hu, L.; He, S.; Han, Z.; Xiao, H.; Su, S.; Weng, M.; Cai, Z. Monitoring housing rental prices based on social media: An integrated approach of machine-learning algorithms and hedonic modeling to inform equitable housing policies. Land Use Policy 2019, 82, 657–673. [Google Scholar] [CrossRef]
- Ha, S.K. The urban poor, rental accommodations, and housing policy in Korea. Cities 2002, 19, 195–203. [Google Scholar] [CrossRef]
- McMillen, D.; Singh, R. Fair market rent and the distribution of rents in Los Angeles. Reg. Sci. Urban Econ. 2020, 80, 103397. [Google Scholar] [CrossRef]
- Decree of Ministry of Infrastructure and Transport; General criteria for the implementation of agreements to be defined at local level for the stipulation of lease contracts for residential use at an agreed rent, pursuant to article 2, paragraph 3, of Law 9 December 1998, no. 431, as well as transitional leases and leases for university students, pursuant to article 5, paragraphs 1, 2 and 3 of the same law; Ministry of Infrastructure and Transport: Rome, Italy, 2017.
- Discipline of Leases and Release of Properties for Residential Use; Italian Parliament Law no. 431 of 9 December 1998; Italian Parliament: Rome, Italy; p. 1998.
- Pawson, H.; Milligan, V.; Yates, J. Financing and governing affordable rental housing. In Housing Policy in Australia; Palgrave Macmillan: Singapore, 2020; pp. 259–298. [Google Scholar]
- Bracke, P. House prices and rents: Micro evidence from a matched data set in Central London. Real Estate Econ. 2015, 43, 403–431. [Google Scholar] [CrossRef] [Green Version]
- Gallin, J. The long-run relationship between house prices and rents. Real Estate Econ. 2008, 36, 635–658. [Google Scholar] [CrossRef] [Green Version]
- Winters, J.V. Differences in quality of life estimates using rents and home values. Ann. Reg. Sci. 2013, 51, 377–409. [Google Scholar] [CrossRef] [Green Version]
- Frew, J.; Wilson, B. Estimating the connection between location and property value. J. Real Estate Pract. Educ. 2002, 5, 17–22. [Google Scholar] [CrossRef]
- Chiwuzie, A.; Dabara, D.I. Housing construction costs and house rents fluctuations in an emerging property market: The case of Osogbo, Nigeria. Prop. Manag. 2021, 39, 527–545. [Google Scholar] [CrossRef]
- Chiwuzie, A.; Aiyepada, E.G.; Prince, E.M.; Ajiboye, B.O.; Olawuyi, S.T. Analyzing the dynamics of residential properties’ rent in Ede, Nigeria. J. Res. Bus. Econ. Manag. 2019, 13, 2555–2563. [Google Scholar]
- Jud, G.D.; Winkler, D.T. The dynamics of metropolitan housing prices. J. Real Estate Res. 2002, 23, 29–46. [Google Scholar]
- Okorie, A. Housing infrastructural facilities as determinants of rental values of residential properties in Osogbo, Osun State–Nigeria. J. Res. Bus. Econ. Manag. 2015, 1, 7–14. [Google Scholar]
- Joshua Adegoke, O. Critical factors determining rental value of residential property in Ibadan metropolis, Nigeria. Prop. Manag. 2014, 32, 224–240. [Google Scholar] [CrossRef]
- Aluko, O. The effects of location and neighborhood attributes on housing values in metropolitan Lagos. Ethiop. J. Environ. Stud. Manag. 2011, 4, 69–82. [Google Scholar]
- De, U.K.; Vupru, V. Location and neighborhood conditions for housing choice and its rental value: Empirical examination in an urban area of North-East India. Int. J. Hous. Mark. Anal. 2017, 10, 519–538. [Google Scholar] [CrossRef]
- Schernthanner, H.; Asche, H.; Gonschorek, J.; Scheele, L. Spatial modeling and geovisualization of rental prices for real estate portals. In Computational Science and Its Applications-ICCSA 2016; Lecture Notes in Computer Science; Gervasi, O., Ed.; Springer: Cham, Switzerland, 2016; Volume 9788. [Google Scholar]
- Prunty, P. An Investigation into the Effectiveness of Hedonic Features in Regression Models for Domestic Rental Prices; Technological University Dublin: Dublin, Ireland, 2016. [Google Scholar]
- Zhang, R.X.; Jia, S.J. Study on the influencing factors of Guangzhou city’s residential housing rent. J. Eng. Manag. 2014, 28, 118–123. [Google Scholar]
- Yang, X.D.; Li, Z.F. A study on pricing of residential house rental: Evidence from Harbin. J. Syst. Manag. 2012, 21, 486–493. [Google Scholar]
- Cui, N.; Gu, H.; Shen, T.; Feng, C. The impact of micro-level influencing factors on home value: A housing price-rent comparison. Sustainability 2018, 10, 4343. [Google Scholar] [CrossRef] [Green Version]
- Su, Y.; Zhu, D.; Geng, B. The spatial structure and affecting factors of the housing rental in Beijing. Econ. Geogr. 2014, 34, 64–69. [Google Scholar]
- John, B. Mass transportation, apartment rent and property values. J. Real Estate Res. 1996, 12, 1–8. [Google Scholar] [CrossRef]
- Manganelli, B.; Tataranna, S.; De Paola, P. A Comparison of Short-Term and Long-Term Rental Market in an Italian City. In International Conference on Computational Science and Its Applications; Springer: Cham, Switzerland, 2020; pp. 884–898. [Google Scholar]
- Sadayuki, T. Measuring the spatial effect of multiple sites: An application to housing rent and public transportation in Tokyo, Japan. Reg. Sci. Urban Econ. 2018, 70, 155–173. [Google Scholar] [CrossRef]
- Chen, Y.; Liu, X.; Li, X.; Liu, Y.; Xu, X. Mapping the fine-scale spatial pattern of housing rent in the metropolitan area by using online rental listings and ensemble learning. Appl. Geogr. 2016, 75, 200–212. [Google Scholar] [CrossRef]
- Singla, H.K.; Bendigiri, P. Factors affecting rentals of residential apartments in Pune, India: An empirical investigation. Int. J. Hous. Mark. Anal. 2019, 12, 1028–1054. [Google Scholar] [CrossRef]
- Schläpfer, F.; Waltert, F.; Segura, L.; Kienast, F. Valuation of landscape amenities: A hedonic pricing analysis of housing rents in urban, suburban and periurban Switzerland. Landsc. Urban Plan. 2015, 141, 24–40. [Google Scholar] [CrossRef]
- Yusuf, A.A.; Resosudarmo, B.P. Does clean air matter in developing countries’ megacities? A hedonic price analysis of the Jakarta housing market, Indonesia. Ecol. Econ. 2009, 68, 1398–1407. [Google Scholar] [CrossRef]
- Del Cacho, C. A Comparison of Data Mining Methods for Mass Real Estate Appraisal; MPRA Paper: Munich, Germany, 2010. [Google Scholar]
- Oshodi, O.S.; Thwala, W.D.; Odubiyi, T.B.; Abidoye, R.B.; Aigbavboa, C.O. Using neural network model to estimate the rental price of residential properties. J. Financ. Manag. Prop. Constr. 2019, 24, 217–230. [Google Scholar] [CrossRef]
- Ng, A.; Deisenroth, M. Machine Learning for a London Housing Price Prediction Mobile Application; Technical Report; Imperial College: London, UK, 2015. [Google Scholar]
- Marks, D. The effect of rent control on the price of rental housing: A hedonic approach. Land Econ. 1984, 60, 81–94. [Google Scholar] [CrossRef]
- Zietz, E.N.; Sirmans, G.S. Determinants of house price: A quantile regression approach. J. Real Estate Financ. Econ. 2008, 37, 317–333. [Google Scholar] [CrossRef]
- Clark, S.D.; Lomax, N. A mass-market appraisal of the English housing rental market using a diverse range of modelling techniques. J. Big Data 2018, 5, 43. [Google Scholar] [CrossRef] [PubMed]
- Ezebilo, E. Evaluation of house rent prices and their affordability in Port Moresby, Papua New Guinea. Buildings 2014, 7, 114. [Google Scholar] [CrossRef] [Green Version]
- Baldini, M.; Federici, M. Ethnic discrimination in the Italian rental housing market. J. Hous. Econ. 2011, 20, 1–14. [Google Scholar] [CrossRef]
- Fumarco, L. Disability discrimination in the Italian rental housing market: A field experiment with blind tenants. Land Econ. 2017, 93, 567–584. [Google Scholar] [CrossRef]
- Poggio, T.; Boreiko, D. Social housing in Italy: Old problems, older vices and some new virtues? Crit. Hous. Anal. 2017, 4, 112. [Google Scholar] [CrossRef] [Green Version]
- Belotti, E. The importation of social mix policy in Italy: A case study from Lombardy. Cities 2017, 71, 41–48. [Google Scholar] [CrossRef]
- Ferri, G.; Pogliani, L.; Rizzica, C. Towards a collaborative way of living: Innovating social and affordable housing in Italy. In Affordable Housing Governance and Finance; Routledge: Abington-on-Thames, UK, 2018; pp. 59–86. [Google Scholar]
- Observatory of the Real Estate Market—Revenue Agency. Available online: www.agenziaentrate.gov.it (accessed on 15 March 2021).
- Giustolisi, O.; Savic, D. Advances in data-driven analyses and modelling using EPR-MOGA. J. Hydroinf. 2009, 11, 225–236. [Google Scholar] [CrossRef]
- Efron, B. Estimating the error rate of a prediction rule: Improvement on cross-validation. J. Am. Stat. Assoc. 1983, 78, 316–330. [Google Scholar] [CrossRef]
- La Repubblica. Available online: www.larepubblica.it/economia/rapporti/osserva-italia/stili-di-vita/2017/02/09/news/co2_il_riscaldamento_domestico_inquina_6_volte_piu_dei_trasporti-157903916/ (accessed on 20 October 2021).
- Chamber of Deputies and CRESME, the Recovery and Energy Requalification of the Building Stock: An Estimate of the Impact of Incentive Measures, First Edition, No. 3. Available online: https://temi.camera.it/leg18/dossier/OCD18-14395/il-recupero-e-riqualificazione-energetica-del-patrimonio-edilizio-stima-impatto-misure-incentivazione.html (accessed on 30 October 2021).
- Li, Q.; Chand, S. House prices and market fundamentals in urban China. Habitat Int. 2013, 40, 148–153. [Google Scholar] [CrossRef]
- Gilbert, C.; Rowley, S.; Gurran, N.; Leishman, C.; Mouritz, M.; Raynor, K.; Cornell, C. Urban Regulation and Diverse Housing Supply: An Investigative Panel; AHURI Final Report; Center for Open Science: Charlottesville, VA, USA, 2020; pp. 1–96. [Google Scholar]
- Crook, T.; Whitehead, C. Intermediate housing and the planning system. In Making Housing More Affordable: The Role of Intermediate Tenures; Brown, S., Henneberry, J., Chau, K.W., Worzala, E., Eds.; Blackwell Publishing Ltd.: Hoboken, NJ, USA, 2011; pp. 101–119. [Google Scholar]
- Nesticò, A.; Endreny, T.; Guarini, M.R.; Sica, F.; Anelli, D. Real estate values, tree cover, and per-capita income: An evaluation of the interdependencies in Buffalo City (NY). In International Conference on Computational Science and Its Applications; Springer: Cham, Switzerland, 2020; pp. 913–926. [Google Scholar]
- Morano, P.; Tajani, F.; Anelli, D. A decision support model for investment through the social impact bonds. The case of the city of Bari (Italy). Valori Valutazioni 2020, 24, 163–179. [Google Scholar]
Figure 1.
Location of the five Italian cities considered in the analysis.

Figure 2.
Average percentage contributions (in absolute terms) for each variable of the five Italian cities considered.
Figure 2.
Average percentage contributions (in absolute terms) for each variable of the five Italian cities considered.


Table 1.
Description of the variables.
| Variable | Acronym | Typology | Description | Measurement Unit |
|---|---|---|---|---|
| Rental prices | Rp | Cardinal | Housing rental prices | €/m2 per month |
| Internal area | Ai | Cardinal | The internal area of the property (gross floor area) | m2 |
| Surface of balconies | Ab | Cardinal | The surface of private external areas of balconies, terraces, and patios (gross floor area) | m2 |
| Surface of green areas | Ag | Cardinal | The surface of private external space of gardens, green areas etc. (gross floor area) | m2 |
| Condominium areas | Ae | Dummy | The presence of condominium areas to be used by the housing complex residents | 1: presence, 0: absence |
| Floor | L | Cardinal | The floor on which the property is located | Number |
| Bathroom | W | Cardinal | The number of bathrooms in the property | Number |
| Kitchen | K | Dummy | The presence of the kitchen located in the living room of the property (the value “one” verifies this situation, whereas the value “zero” indicates that the kitchen and the living room are in two different home spaces separated by internal walls and doors) | 1: presence, 0: absence |
| Property maintenance conditions | Cp | Dummy | The quality of the property maintenance conditions is considered a qualitative variable and is differentiated, through a synthetic evaluation, by three categories: “bad or to be restructured”, “good”, and “excellent”. Each of the three categories denotes different qualities and conditions: the “to be restructured” condition (Cp) indicates residential properties for which substantial restructuring interventions are necessary,; the “good” state (Cg) indicates houses that are immediately usable and in which the maintenance conditions are acceptable; and the “excellent” state (Ce) refers to properties characterized by high aesthetic and structural values with superior trimmings and architectural qualities | 1: category that defines the specific quality of each property, 0: the remaining two categories |
| Cg | ||||
| Ce | ||||
| EPC label | Eab | Dummy | The EPC label, expressed, according to the current regulations, through the denominations from A4 (the highest level) to G (the lowest level). The EPC labels are gathered in three categories: from A4 to B (Eab); from C to E (Ecde); and F and G (Efg). If the property EPC level is F or G, both the variables Eab and Ecde are equal to a “zero” score | 1: EPC label of the property, 0: if not |
| Ecde | ||||
| Efg | ||||
| Age of the building | Uc | Cardinal | The age of the building in which the residential unit is located, calculated as the difference between the year 2019 and the year of construction of the building | Number |
| Subway | Dm | Cardinal | The distance from the nearest subway | Kilometers by walking |
| Central train station | Ds | Cardinal | The distance from the central train station | Kilometers by walking |
| University center | Du | Cardinal | The distance from the nearest university center | Kilometers by walking |
| Central pole | Dp | Cardinal | The distance from the central pole (Dp) of each city. This is defined as a historical or religious monument located in the center of the city or a relevant square from which the main arterial roads develop; for this study, the “Duomo”, “Piazza Castello”, “Altare della Patria”, “Castel Nuovo”, “Maschio Angioino” and “Piazza del Duomo”, for the cities of Milan, Turin, Rome, Naples, and Catania, respectively, have been considered | Kilometers by walking |
| Urban green space | Dg | Cardinal | The distance from the nearest urban green space | Kilometers by walking |
| Municipal trade area | Fc | Dummy | The municipal trade area in which the property is located, considering the geographical distribution developed by the Italian Revenue Agency [55]. This synthetizes the different location characteristics (extrinsic factors) that affect the formation of the rental prices because it represents an urban area where the features are similar and, therefore, have homogeneously contributed to the local real estate market prices. In particular, four trade areas are included in the analysis among those defined by the Italian Revenue Agency: “central” (Fc), “semi-central” (Fsc), “peripheral” (Fp), and “suburban” (Fsb) | 1: if the property belongs to the specific trade area, 0: if not |
Table 2.
EPR models for each study sample.
| City | Equation |
|---|---|
| MILAN | Y = +0.74039 * Fc + 0.65355 * W0.5 Fp0.5 + 0.85473 * W0.5 * Fsc2 + 11.8431 * Ae0.5 * Uc * Dp0.5 * Du * Fsc0.5 + 0.91529 * Ab * L0.5 * Ce0.5 + 3.1017 * Ai0.5 − 2.0858 * Ai0.5 * L0.5 * Dp + 2.5784 * Ai * L0.5 * Ce0.5 * Eab2 + 5.2917 |
| TURIN | Y = + 0.20484 * Fc + 0.20638 * Ce + 2.3667 * Ai0.5 − 0.90861 * Ai0.5 * Dp0.5 * Du0.5 + 3.1746 * Ai0.5 * Eab0.5 * Du * C + 0.79503 * Ai0.5 * Ae0.5 Cg * Du + 4.2823 * Ai *Ag0.5 * W0.5 * Dm + 5.1051 |
| ROME | Y = −0.95769 * Dp0.5 + 0.32292 * Ce2 * Dm0.5 + 0.72193 * W2 + 8.6191 * L * Ecde * Fsc + 0.58693 * Ab0.5 * Fc2 + 2.4715 * Ai0.5 + 6.3407 |
| NAPLES | Y = −0.65252 * Dg + 0.79149 * W2 Fsc2 + 0.72862 * L * Uc + 1.5006 * Ai0.5 + 0.96063* Ai0.5 * Ds0.5 * Fc0.5 + 5.7416 |
| CATANIA | Y = + 2.9701 * Eab0.5 * Ds * Dm2 + 0.11784 * Ce0.5 + 0.57677 * W2 + 4.2099 * L0.5 * Uc * Fc0.5 + 3.3906 * Ab0.5 * K * Du2 + 0.73513 * Ag2 + 1.5162 * Ai0.5 − 13.4711 * Ai0.5 * Uc0.5 * Ds * Dm + 5.5681 |
Table 3.
The variables selected by EPR for each city’s model.
| MILAN | TURIN | ROME | NAPLES | CATANIA | |
|---|---|---|---|---|---|
| Internal area | ◉ | ◉ | ◉ | ◉ | ◉ |
| Surface area of balconies | ◉ | ◉ | ◉ | ||
| Surface area of green areas | ◉ | ◉ | |||
| Condominium areas | ◉ | ◉ | |||
| Floor | ◉ | ◉ | ◉ | ◉ | |
| Bathroom | ◉ | ◉ | ◉ | ◉ | ◉ |
| Kitchen | ◉ | ||||
| Bad quality of property maintenance conditions | |||||
| Good quality of property maintenance conditions | ◉ | ||||
| Excellent quality of property maintenance conditions | ◉ | ◉ | ◉ | ◉ | |
| EPC labels from A4 to B | ◉ | ◉ | ◉ | ||
| EPC labels from C to E | ◉ | ||||
| Age of the building | ◉ | ◉ | ◉ | ||
| Subway | ◉ | ◉ | ◉ | ||
| Central train station | ◉ | ◉ | |||
| University center | ◉ | ◉ | ◉ | ||
| Central pole | ◉ | ◉ | ◉ | ||
| Urban green spaces | ◉ | ||||
| Property location in the central municipal trade area | ◉ | ◉ | ◉ | ◉ | ◉ |
| Property location in the semi-central municipal trade area | ◉ | ◉ | ◉ | ||
| Property location in the peripheral municipal trade area | ◉ |
Table 4.
Functional relationship typologies and average percentage contributions for the city of Milan.
Table 4.
Functional relationship typologies and average percentage contributions for the city of Milan.
| City | Variable | Functional Relationship Typology | Average Contribution on Rental Price [%] |
|---|---|---|---|
| MILAN | Internal area | DIRECT | +39% |
| Surface are of balconies | DIRECT | +4% | |
| Condominium areas | DIRECT | +19% | |
| Floor | DIRECT | +3% | |
| Bathroom | DIRECT | +20% | |
| Excellent quality of the property maintenance conditions | DIRECT | +32% | |
| EPC labels from A4 to B | DIRECT | +30% | |
| Age of the building | DIRECT | +17% | |
| Distance from the nearest university centre | DIRECT | +7% | |
| Property location in the central municipal trade area | DIRECT (from Fp to Fc) | +37% | |
| DIRECT (from Fsc to Fc) | +1% | ||
| Property location in the semi-central municipal trade area | DIRECT (from Fp to Fsc) | +35% | |
| INVERSE (from Fc to Fsc) | −1% | ||
| Property location in the peripheral municipal trade area | INVERSE (from Fc to Fp) | −27% | |
| INVERSE (from Fsc to Fp) | −26% |
Table 5.
Functional relationship typologies and average percentage contributions for the city of Turin.
Table 5.
Functional relationship typologies and average percentage contributions for the city of Turin.
| City | Variable | Functional Relationship Typology | Average Contribution on Rental Price [%] |
|---|---|---|---|
| TURIN | Internal area | DIRECT | +18% |
| Surface area of green areas | DIRECT | +2% | |
| Condominium areas | DIRECT | +18% | |
| Bathroom | DIRECT | +1% | |
| Good quality of the property maintenance conditions | DIRECT (from Cp to Cg) | +18% | |
| INVERSE (from Ce to Cg) | −4% | ||
| Excellent quality of the property maintenance conditions | DIRECT (from Cp to Ce) | +23% | |
| DIRECT (from Cg to Ce) | +5% | ||
| EPC labels from A4 to B | DIRECT | +91% | |
| Subway | DIRECT | +2% | |
| University Center | INVERSE | −2% | |
| Central pole | INVERSE | −2% | |
| Property location in the central municipal trade area | DIRECT | +135% |
Table 6.
Functional relationship typologies and average percentage contributions for the city of Rome.
Table 6.
Functional relationship typologies and average percentage contributions for the city of Rome.
| City | Variable | Functional Relationship Typology | Average Contribution on Rental Price [%] |
|---|---|---|---|
| ROME | Internal area | DIRECT | +21% |
| Surface area of balconies | DIRECT | +6% | |
| Floor | DIRECT | +161% | |
| Bathroom | DIRECT | +26% | |
| Excellent quality of the property maintenance conditions | DIRECT | +13% | |
| EPC labels from C to E | DIRECT | +17% | |
| Subway | DIRECT | +3% | |
| Central pole | INVERSE | −7% | |
| Property location in the central municipal trade area | DIRECT (from Fsc to Fc) | +17% | |
| Property location in the semi-central municipal trade area | INVERSE (from Fc to Fsc) | −14% | |
| DIRECT (from Fp to Fsc) | +76% |
Table 7.
Functional relationship typologies and average percentage contributions for the city of Naples.
Table 7.
Functional relationship typologies and average percentage contributions for the city of Naples.
| City | Variable | Functional Relationship Typology | Average Contribution on Rental Price [%] |
|---|---|---|---|
| NAPLES | Internal area | DIRECT | +12% |
| Floor | DIRECT | +1% | |
| Bathroom | DIRECT | +35% | |
| Age of the building | DIRECT | +2% | |
| Central train station | DIRECT | +2% | |
| Urban green space | INVERSE | −6% | |
| Property location in the central municipal trade area | DIRECT (from Fsc to Fc) | +25% | |
| DIRECT (from Fp to Fc) | +44% | ||
| Property location in the semi-central municipal trade area | INVERSE (from Fc to Fsc) | −20% | |
| DIRECT (from Fp to Fsc) | +15% |
Table 8.
Functional relationship typologies and average percentage contributions for the city of Catania.
Table 8.
Functional relationship typologies and average percentage contributions for the city of Catania.
| City | Variable | Functional Relationship Typology | Average Contribution on Rental Price [%] |
|---|---|---|---|
| CATANIA | Internal area | DIRECT | +15% |
| Surface area of balconies | DIRECT | +3% | |
| Surface area of gardens | DIRECT | +8% | |
| Floor | DIRECT | +7% | |
| Bathroom | DIRECT | +20% | |
| Kitchen | DIRECT | +5% | |
| Excellent quality of the property maintenance conditions | DIRECT | +13% | |
| EPC labels from A4 to B | DIRECT | +4% | |
| Age of the building | DIRECT | +17% | |
| Subway | INVERSE | −3% | |
| Central train station | INVERSE | −1% | |
| University center | DIRECT | +6% | |
| Property location in the central municipal trade area | DIRECT | +8% |
Publisher’s Note: MDPI stays neutral with regard to jurisdictional claims in published maps and institutional affiliations. |
© 2021 by the authors. Licensee MDPI, Basel, Switzerland. This article is an open access article distributed under the terms and conditions of the Creative Commons Attribution (CC BY) license (https://creativecommons.org/licenses/by/4.0/).
Share and Cite
MDPI and ACS Style
Tajani, F.; Di Liddo, F.; Ranieri, R.; Anelli, D. An Automatic Tool for the Determination of Housing Rental Prices: An Analysis of the Italian Context. Sustainability 2022, 14, 309. https://0-doi-org.brum.beds.ac.uk/10.3390/su14010309
AMA Style
Tajani F, Di Liddo F, Ranieri R, Anelli D. An Automatic Tool for the Determination of Housing Rental Prices: An Analysis of the Italian Context. Sustainability. 2022; 14(1):309. https://0-doi-org.brum.beds.ac.uk/10.3390/su14010309
Chicago/Turabian StyleTajani, Francesco, Felicia Di Liddo, Rossana Ranieri, and Debora Anelli. 2022. "An Automatic Tool for the Determination of Housing Rental Prices: An Analysis of the Italian Context" Sustainability 14, no. 1: 309. https://0-doi-org.brum.beds.ac.uk/10.3390/su14010309
Note that from the first issue of 2016, this journal uses article numbers instead of page numbers. See further details here.