
A Nonintrusive and Real-Time Classification Method for Driver’s Gaze Region Using an RGB Camera


1
College of Electromechanical Engineering, Qingdao University of Science & Technology, Qingdao 266101, China
2
Collaborative Innovation Center for Intelligent Green Manufacturing Technology and Equipment of Shandong Province, Qingdao 266101, China
*
Author to whom correspondence should be addressed.
Sustainability 2022, 14(1), 508; https://0-doi-org.brum.beds.ac.uk/10.3390/su14010508
Submission received: 24 November 2021
/
Revised: 27 December 2021
/
Accepted: 30 December 2021
/
Published: 4 January 2022
(This article belongs to the Special Issue Data-Driven Analysis and Control Methods in ITS and Accident Prevention)
Abstract
:Driver distraction has become a leading cause of traffic crashes. Visual distraction has the most direct impact on driving safety among various driver distractions. If the driver’s line of sight deviates from the road in front, there will be a high probability of visual distraction. A nonintrusive and real-time classification method for driver’s gaze region is proposed. A Multi-Task Convolutional Neural Network (MTCNN) face detector is used to collect the driver’s face image, and the driver’s gaze direction can be detected with a full-face appearance-based gaze estimation method. The driver’s gaze region is classified by the model trained through the machine learning algorithms such as Support Vector Machines (SVM), Random Forest (RF), and K-Nearest Neighbors (KNN). The simulated experiment and the real vehicle experiment were conducted to test the method. The results show that it has good performance on gaze region classification and strong robustness to complex environments. The models in this paper are all lightweight networks, which can meet the accuracy and speed requirements for the tasks. The method can be a good help for further exploring the visual distraction state level and exert an influence on the research of driving behavior.
1. Introduction
According to published reports from the World Health Organization (WHO), traffic accidents are one of the top 10 causes that lead to death in the world. Driver distraction [1,2], fatigue [3,4], and emotion [5,6] have a great impact on traffic safety. It was found that almost 80% of traffic crashes involved driver distraction, and it was pointed out that the line of sight off the road for a long time more easily causes traffic crashes [7]. According to the statistics by NHTSA [8] (National Highway Traffic Safety Administration), 8% of fatal crashes, 15% of injury crashes, and 14% of all police-reported motor vehicle traffic crashes in 2018 were reported as distraction-affected crashes. There were 2841 people killed and an estimated additional 400,000 people injured in motor vehicle crashes involving distracted drivers. Distracted drivers accounted for 5% of all drivers in fatal crashes.
Research on driver distraction began to receive attention in 1991 when NTHSA realized that drivers could be distracted by the influence of onboard equipment [9]. Teart et al. [10] first defined driver distraction as a state, which would occur if a driver was delayed to obtain the information to complete the driving task and the driver’s attention was forced or induced to shift due to some events, activities, or people inside or outside the vehicle. It was defined by NTHSA that driver distraction could be a state prone to traffic crashes when the driver was disturbed by onboard equipment or external objects during driving and the driver’s attention cannot be allocated to the driving task reasonably. That was, NTHSA believed that distraction was a specific type and a subset of inattention. It would occur when the driver’s attention shifted from driving tasks to other activities. Streff et al. [11] defined driver distraction as a shift of attention away from critical stimuli to safe driving toward stimuli that were not related to safe driving.
Young et al. [1] believed that not all attention shifts or distractions would cause driver distraction. If the driving performance was not influenced by the secondary task that drivers participated in, driver distraction would not happen. Therefore, they defined driver distraction as a state that driver’s attention automatically or involuntarily shifted from driving tasks to a point where the driver could not fully or safely complete driving tasks. There are many reasons for driver distraction, such as calling while driving or the driver is attracted by the scenery outside the vehicle. According to the different performance of driver distraction, it can be divided into visual distraction, auditory distraction, biomechanical distraction, and cognitive distraction [2]. Visual distraction and cognitive distraction are considered to be the two most important distracted behaviors that have a great impact on traffic safety [9]. Among them, visual distraction refers to the state when the driver’s line of sight is off the road [12]. Wanli Li et al. [13] presented a comprehensive review on vision-based methods for driver distraction analysis. They were the first to propose driver behavior distraction and analyze it in a hierarchical way. Alexey Kashevnik et al. [14] reviewed the published scientific literature on driver distraction detection methods and integrated the identified approaches into a holistic framework.
Detection methods of visual distraction can be classified into two aspects, which were research based on the driver’s state [15,16,17,18,19,20] and the dynamics parameters of the vehicle [21,22,23,24,25]. In 2004, Torkkola et al. [26] proposed a method to determine whether the driver was distracted through the vehicle’s sensors, and their work reached an accuracy of 80%. Richard et al. [27] conducted a statistical analysis of traffic crashes caused by visual dis-traction based on the actual driving data of truck drivers in a natural driving state. The results showed that secondary tasks with high visual resource requirements easily caused great driving risk. Engstrom et al. [12] used an arrow recognition task to study the influence of visual distraction in the process of changing lanes. Yee et al. [28] studied the resource allocation relationship of the four channels (visual, auditory, motion, and cognition) for the driver during driving based on real-vehicle experiments, and pointed out that the driver had different requirements for the four channels.
The driver’s state can be also directly monitored by vision, bioelectricity, and other sensors during driving. The data obtained by sensors could be processed using machine learning and deep learning. It can be classified into different states of the driver, which can be used to determine whether the driver is distracted. Lethaus et al. [20] established a discrete dynamics Bayesian network to classify the severity level of driver distraction. Five nonoverlapping viewing zones were defined inside the vehicle to analyze the driver’s gaze behavior, including the windscreen, left window/wing mirror, rearview mirror, speedometer, and right-hand side region. A mapping model between lane changing intention and line of sight data was established to study the correlation between the driver’s lane changing behavior and the line of sight. Jimenez et al. [16] calculated the sight direction based on the position of the corner of the eye and the pupil. The regions in the vehicle were divided into various regions, which were used to detect the driver’s distraction state. Dukic et al. [29] collected the data of 41 drivers and analyzed the degree of distraction caused by electronic billboards to drivers. The SMI glasses eye tracker was used to obtain the gaze information of drivers, and a Volvo V70 vehicle equipped with a data acquisition system was used to collect the vehicle dynamics parameters. Son et al. [30] collected vehicle dynamics parameters in two driving distraction modes (visual distraction and cognitive distraction), as well as the driver’s ECG, GSR, and eye movement information through the study of drivers of different ages.
Tango et al. [31] designed a surrogate visual task to activate the state of visual dis-traction and collected the vehicle dynamics parameters in the state of normal driving and visual distraction. A nonintrusive and real-time detection method was proposed by training the machine learning model. Visual distraction in their paper was defined as a state when the driver’s visual attention was away from the road within 1–2 s. Marco et al. [32] defined visual distraction as a state when the driver’s line of sight was away from the road for more than 2 s and the driver was performing the secondary task. A nonintrusive and real-time method based on vehicle dynamics parameters was proposed and the visual distraction detection model was established through inversion, random projection, and genetic algorithms. Cabrall et al. [33] researched visual distraction using the telemetry eye tracker in a simulated experiment and the driving states in the research were divided into two states: automatic driving state and manual driving state. When the driver’s line of sight was away from the road for more than 1.5 s, the driver was in a state of visual dis-traction. Morris et al. [34] studied the glance time when the driver used the onboard equipment. The results showed that it rarely lasted for more than 2 s when the driver used the onboard equipment, and most of the glance time was 0.2–1 s. Kuo et al. [35] designed a driver monitor system installed in the vehicle and monitored the driver’s face in real time. The driver’s attention region was the intersection point of the gaze vector tracked in the predefined three-dimensional world model and the scene object. Whether the driver was in a state of visual distraction could be judged with the driver’s attention region. Consequently, how to detect whether the driver’s line of sight deviates from the front road can be the most important point for visual distraction detection.
The object of this paper is to develop a real-time and nonintrusive method detecting the region of the driver’s gaze directions. The driver’s visual distraction can be judged through various regions of gaze directions. It will be a great help for predicting whether the driver is in a state of visual distraction. The longer the line of sight is off the road, the greater the risk of a traffic crash is. The driver’s face image can be detected by the MTCNN face detector [36] and the gaze directions can be estimated with a full-face appearance-based gaze estimation method [37]. The driver’s gaze region is classified by the model trained through the machine learning algorithms such as Support Vector Machines (SVM), Random Forest (RF), and K-Nearest Neighbors (KNN). The simulated experiment and the real vehicle experiment were conducted to test the method.
The remainder of the paper is organized as follows: the experimental setup and the method for data collection are proposed in Section 2. The data analysis, the training state, and test results are shown in Section 3. We discuss the results and compare our methods to the others in Section 4. Finally, we summarize our work and put forward prospects for future research.
2. Methods
2.1. Participants
A total of 30 experimenters participated in the experiment, including 23 men and 7 women. The mean age of the sample was 28.2 years, and the average driving experience was 4.5 years. Participants did not have short sight or far sight issues, who could complete the tasks in the experiment without wearing glasses. Participants could get cash rewards when they completed the tasks. They were not informed of the relevant content of the experiment, and the experimental assistants instructed them to take corresponding driving behaviors according to the situations.
2.2. Apparatus
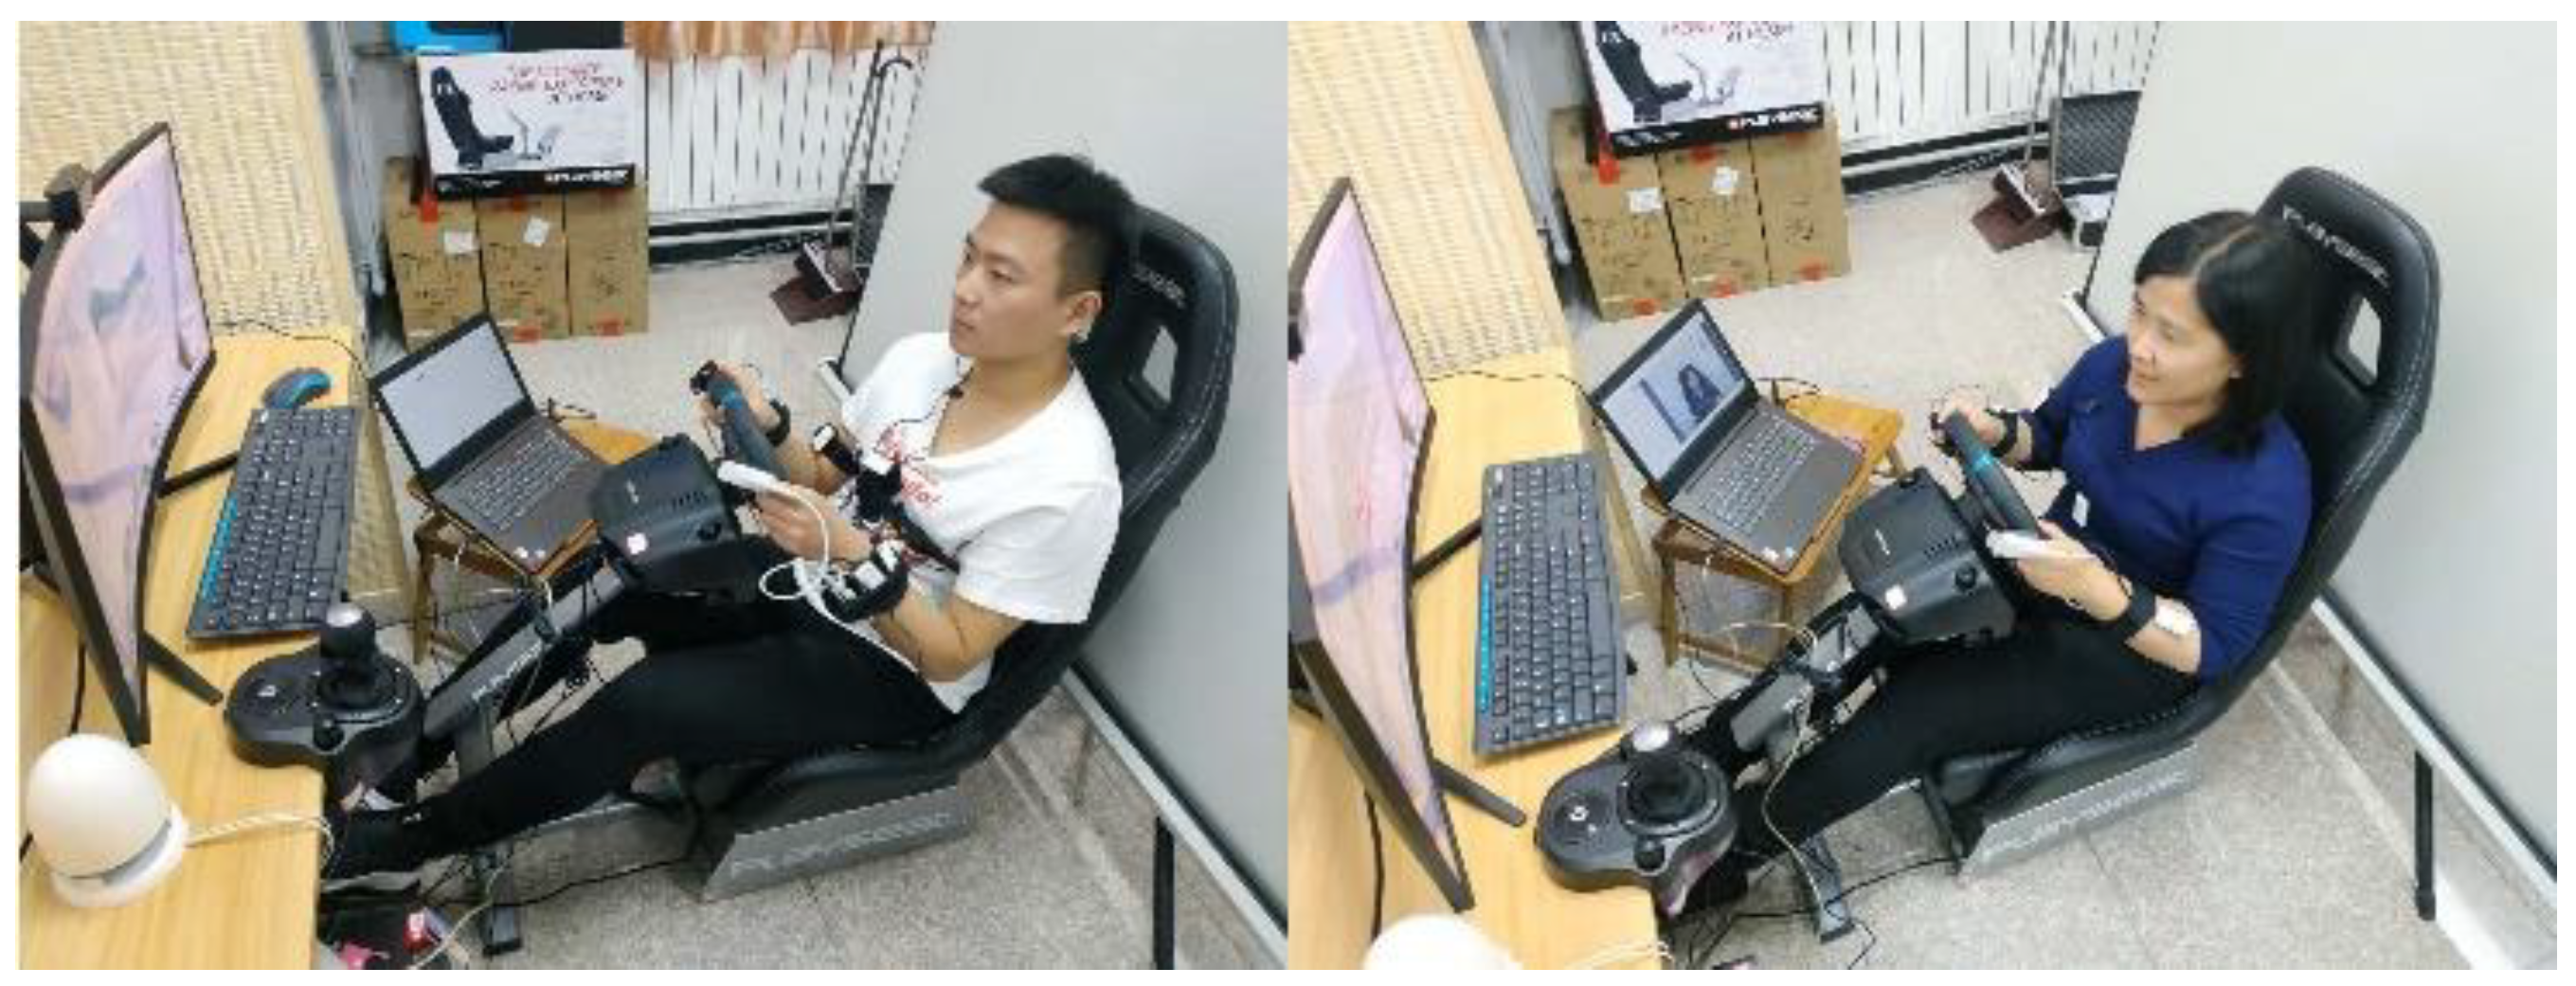
The environment of the simulated experiment is shown in Figure 1. The traffic environment generated by the simulation software was random and there were no specific requirements in the simulated experiment. However, the generated environment should not be too simple. It should be similar to the traffic environment in daily driving so that the data could be consistent with the natural driving states. Participants were trained in advance before using the simulator to ensure that they could master the use of the simulator.
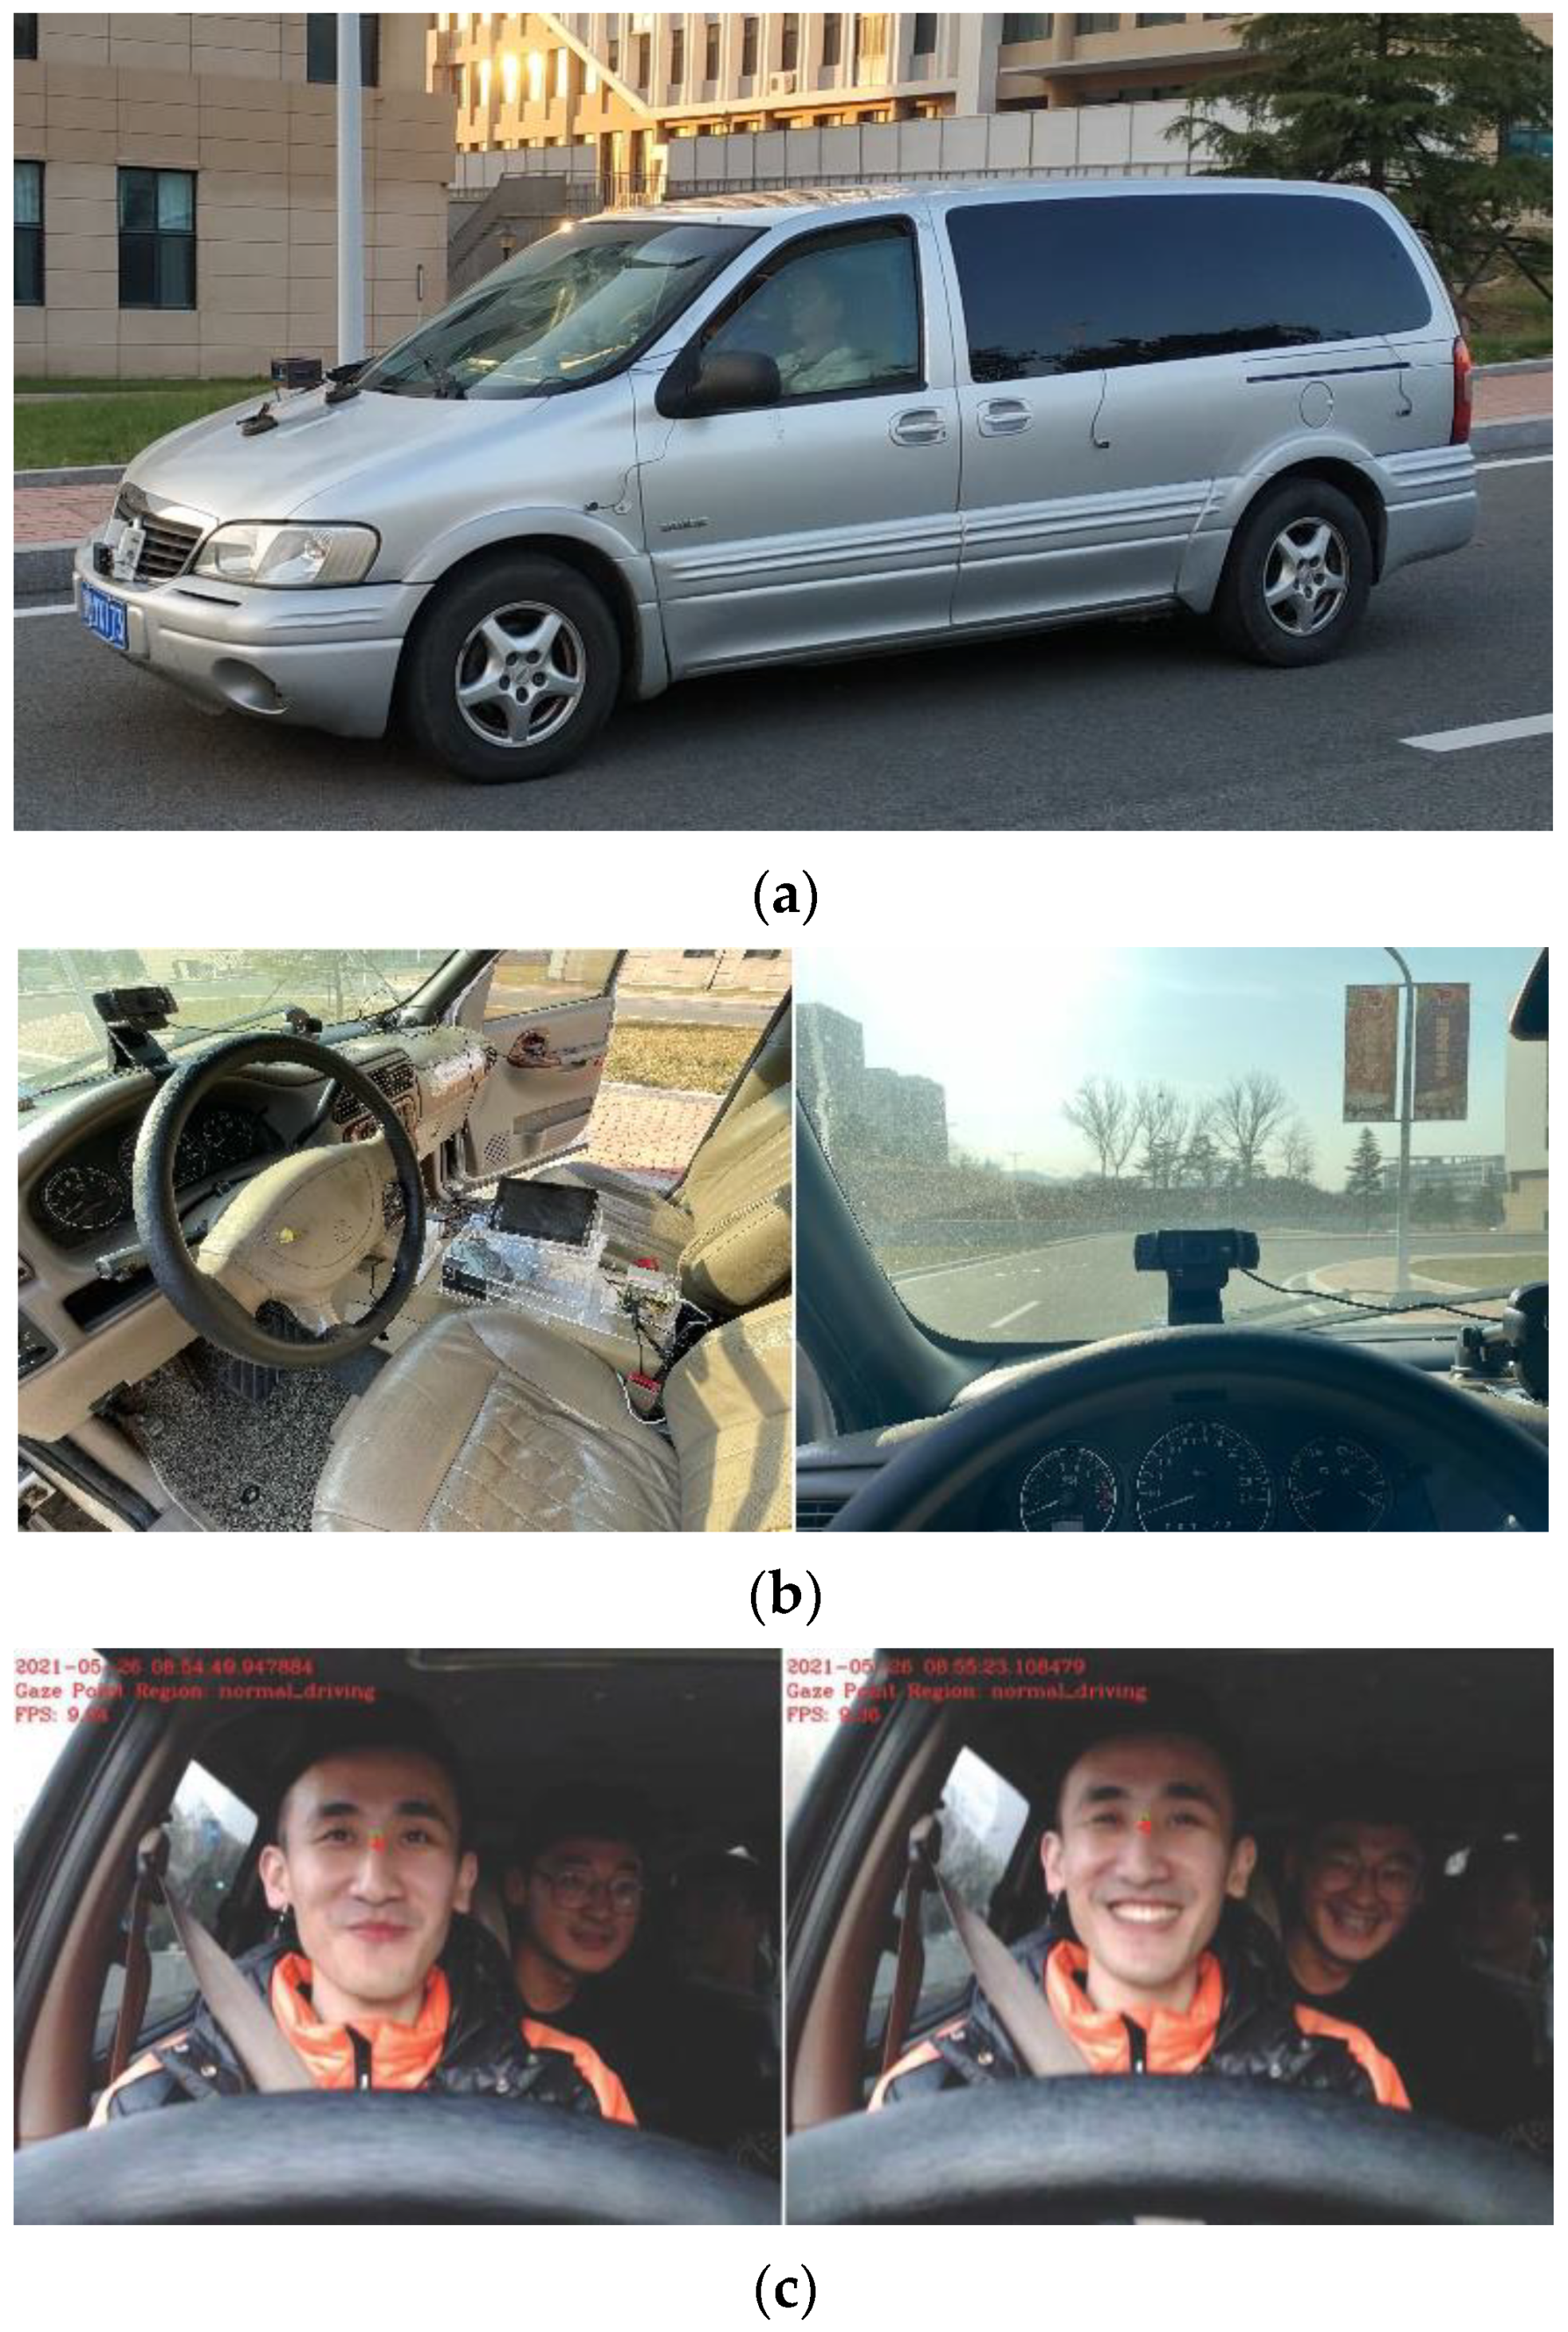
The environment of the actual vehicle experiment is shown in Figure 2.
2.3. Procedure
In the simulated driving experiment, the data to calibrate the driver’s visual distraction model was collected by inducing the driver’s visual distraction. The driver was in-structed by the experimental assistant to watch the left and right rearview mirrors. The driver was instructed to observe the left and right rearview mirrors every 1 min in turn for 10 s. The driver’s sightline data was divided into three categories: normal driving (watching the front road), watching the left rearview mirror, and watching the right rear-view mirror.
To ensure that the data was close to the actual application, the actual vehicle experiment was undertaken on any urban road and the driving path was chosen arbitrarily. The driver was not disturbed by the experimental assistant during driving.
On the one hand, due to safety considerations, excessive demands on the driver or interference with the driver’s behavior during driving will affect the driver’s driving judgment, which can increase the risk of traffic crashes. On the other hand, the actual vehicle experiment can be closer to the driver’s natural driving state in daily life, and the experimental results can be more easily applied to the actual vehicles.
The driver’s facial video information was collected by the camera during driving. The effective video could be screened out with the driver and the experiment assistant. The final collected data was divided into four categories: normal driving line of sight (looking at the front road), looking at the left rearview mirror, looking at the right rearview mirror, and looking at the dashboard.
Limited by the gaze estimation method, the driver’s sight state when looking at the car’s center console and the right copilot position was classified as the state of looking at the right rearview mirror. The reason was that the right rearview mirror was far from the driver’s position, and the deviation of the gaze direction was larger when the driver looked at the right rearview mirror. Since the deflection angle of the face was usually too large, the face image was unable to be detected. The accuracy of the experimental results was not affected because the camera was installed directly in front of the driver in this paper. For the driver under normal driving conditions, the face can be well detected and the corresponding gaze direction can be estimated by the face image. Regardless of being in the actual vehicle experiment or the simulated experiment, if the face image cannot be detected by the MTCNN face detector, the driver must be in the visual distraction state.
2.4. Data Collection
The MTCNN face detector was used to detect and extract the human face in the image. The gaze data can be obtained from the face image through the full-face appearance-based gaze estimation method. The full-face CNN architecture for gaze estimation that takes the full-face image as input and directly regresses to 2D gaze estimates. A spatial weights mechanism efficiently encodes information about different regions of the full face into a standard CNN architecture. The line of the sight estimation error of the gaze estimation method is between 4.8° and 6° [37]. The estimation error of the eye trackers is between 0.5° and 1.5°. Compared with the eye trackers, this method is not very accurate, but it is enough for the situation in the experiment. The detection of the driver’s gaze region is not required to be accurate to a tiny region, and the accuracy of the full-face appearance-based method already meets the needs for gaze estimation.
An ordinary RGB camera was needed in the full-face appearance-based gaze estimation method used in this paper, and the gaze data obtained by the method is easily used for further processing and application.
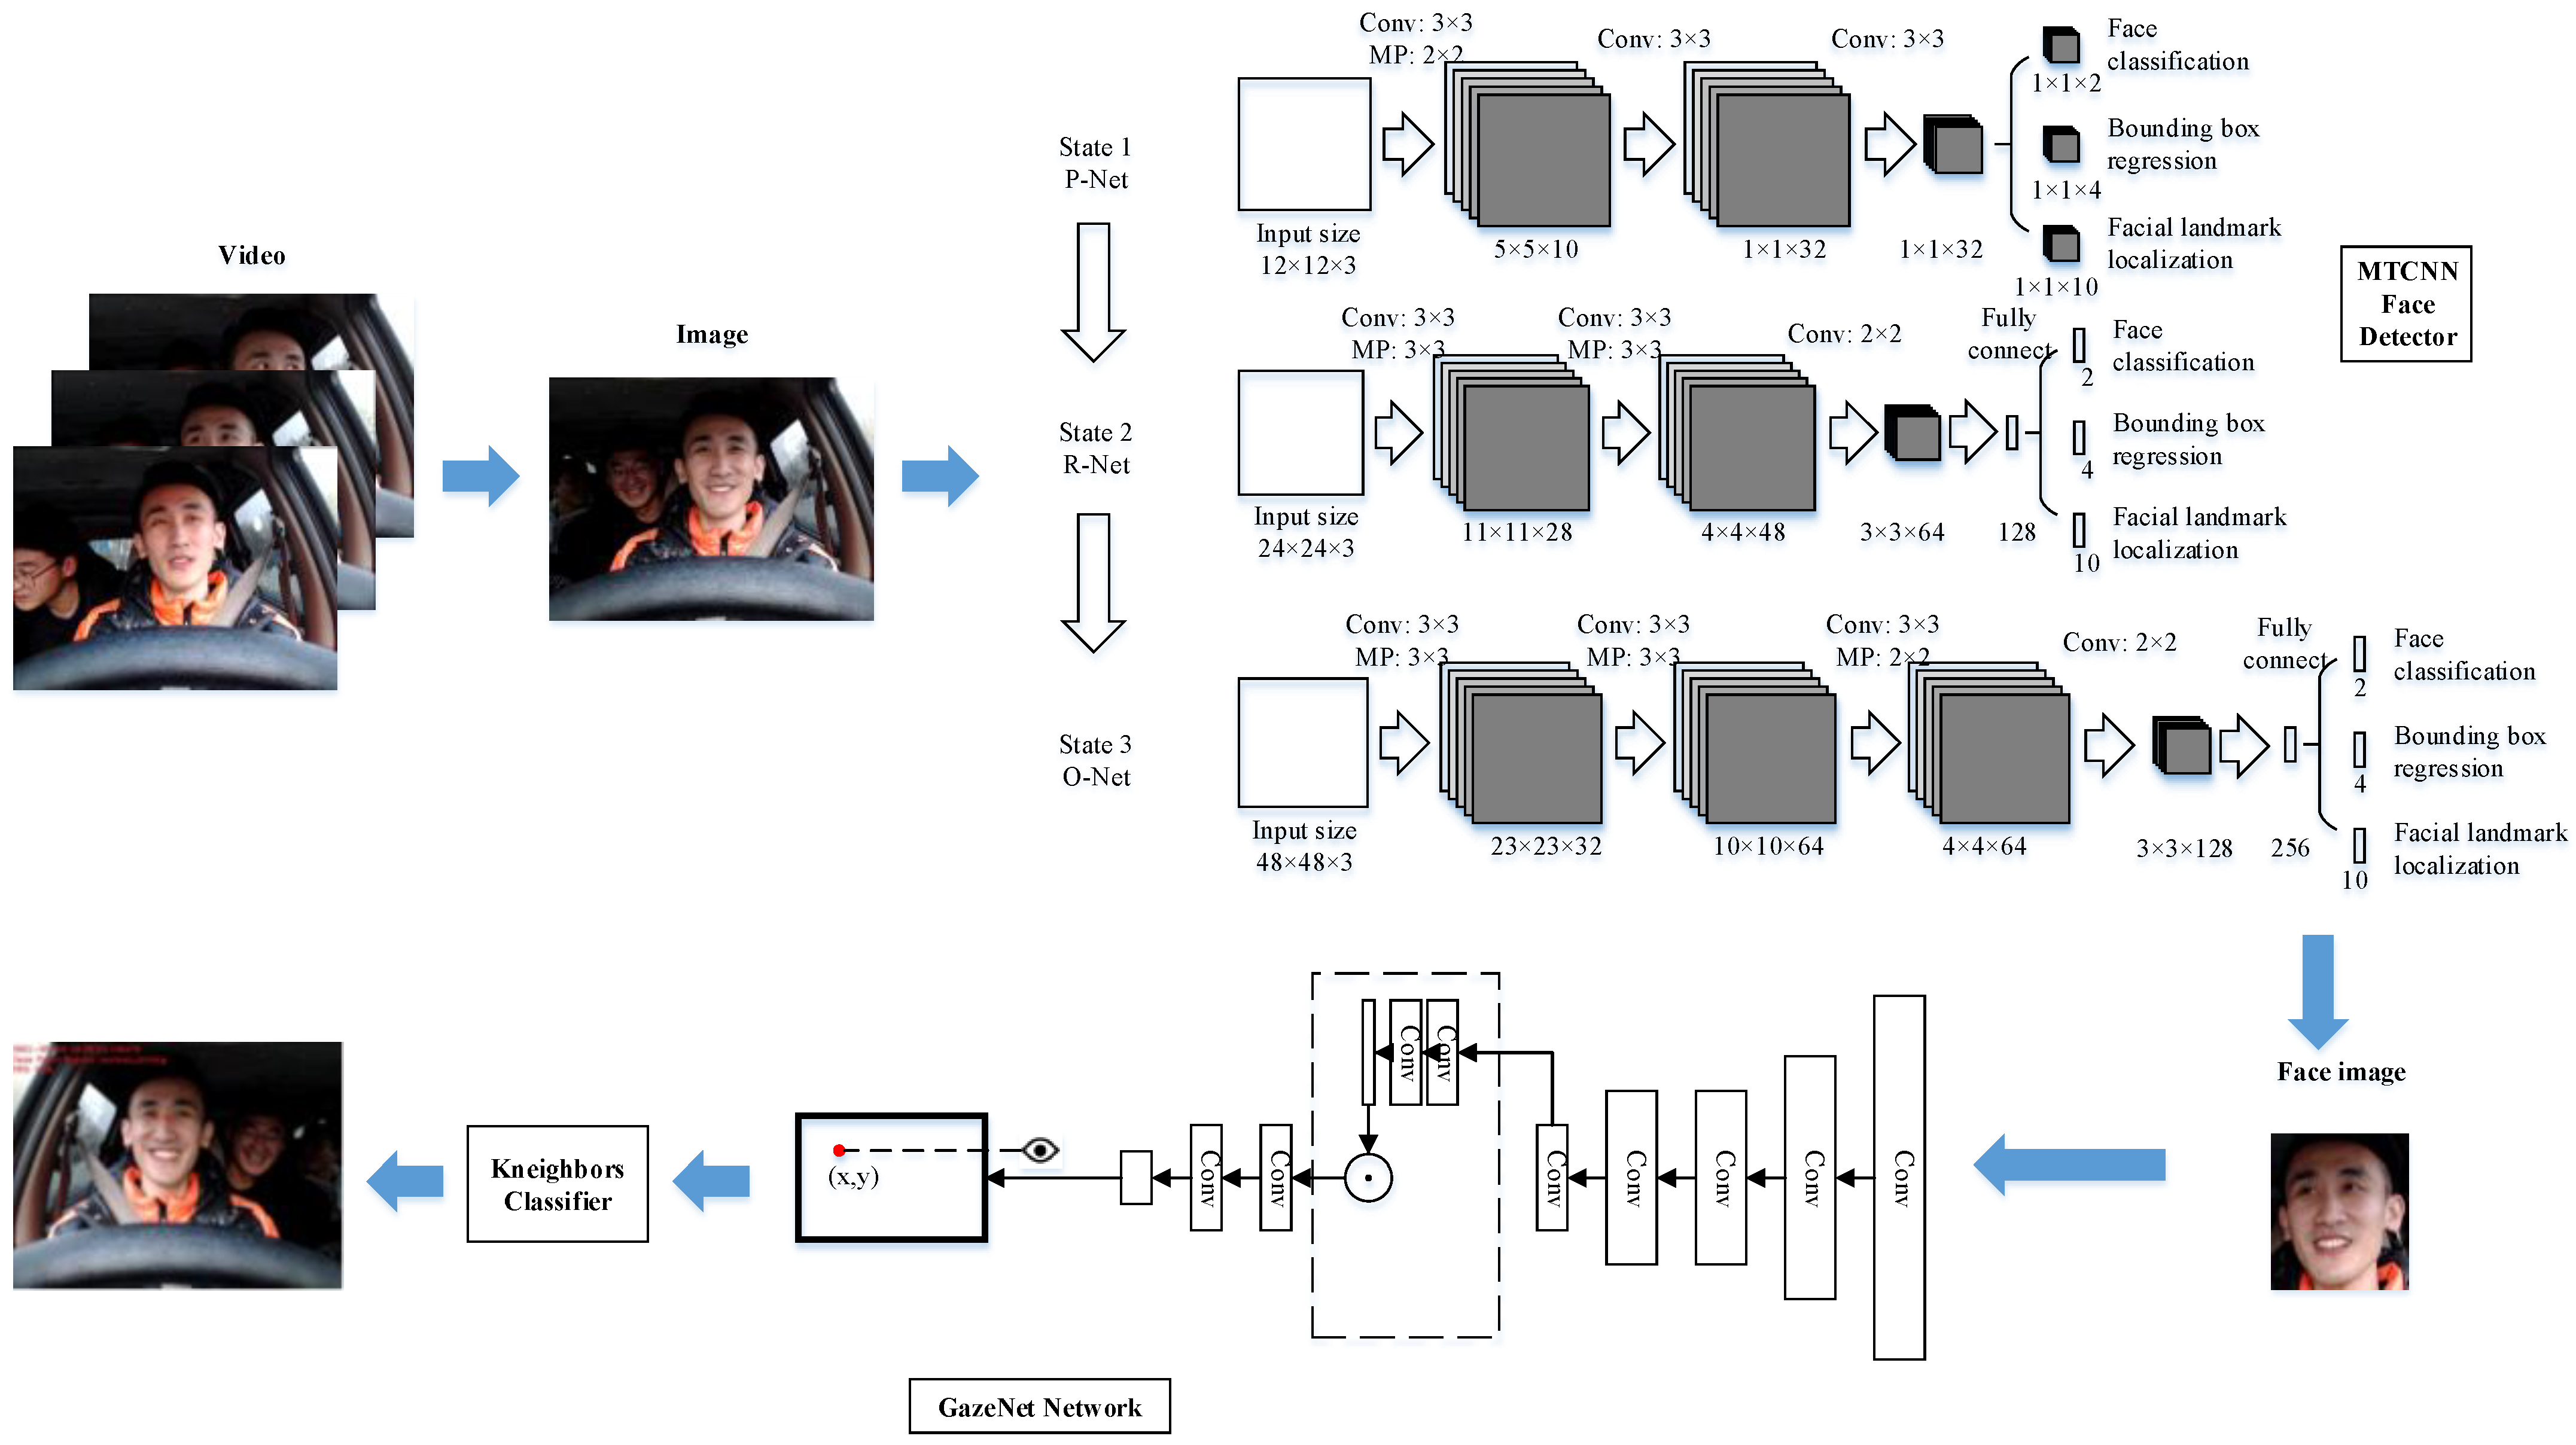
The process for estimating the line of sight is as follows: the video information obtained from the camera is transformed into the image of each frame. Then the image can be detected by the MTCNN face detector to extract the face image. The face image will be input into the full-face appearance-based gaze estimated network after normalization. The results of gaze direction are output from the Gazenet network. The flow chart is shown in Figure 3.
The process of using the MTCNN face detector to recognize and locate faces can be divided into three tasks: the classification for faces or non-faces, the regression of face frames, and the location of feature points. These three stages are named P-Net, R-Net, and O-Net. The cross-entropy loss function is used for every sample in the classification which can be calculated as follows:
Among these, is the possibility that the input sample is a face and is the label of the ground truth.
The offset between the candidate box and the ground truth is used to predict in the regression tasks. The Euclidean distance loss function was chosen for the regression tasks, which can be calculated as follows:
Among these, is the regression result from the network and is the ground truth. There are four values, which are the coordinate of the left and top point of the candidate box, and the height and weight of the candidate box, so .
The location for feature points is similar to the filter of the face candidate box, which used the minimum Euclidean distance loss function for every input sample. The loss function can be calculated as follows:
Among these, is the coordinate point of face feature from the network and is the ground truth coordinate. There are five face feature points, which are left eye, right eye, the tip of the nose, left corner of the mouth, and right corner of the mouth, so .
In the learning process, different types of input images are trained by the convolutional neural network, such as human faces, non-faces, and partially aligned faces. The partial loss function is no longer used in this case. For example, the loss function is used in the learning process of the background and the other two loss functions are set to 0. The calculating process can be simplified and the loss function of the whole learning target can be calculated as follows:
Among these, is the number of the training task. The values of , , and can be set to 1, 0.5, and 0.5 in the P-Net and R-Net. In the O-Net, the three values can be set to 1, 0.5, and 1. is the sample type indicator and the value is .
3. Results
3.1. Data
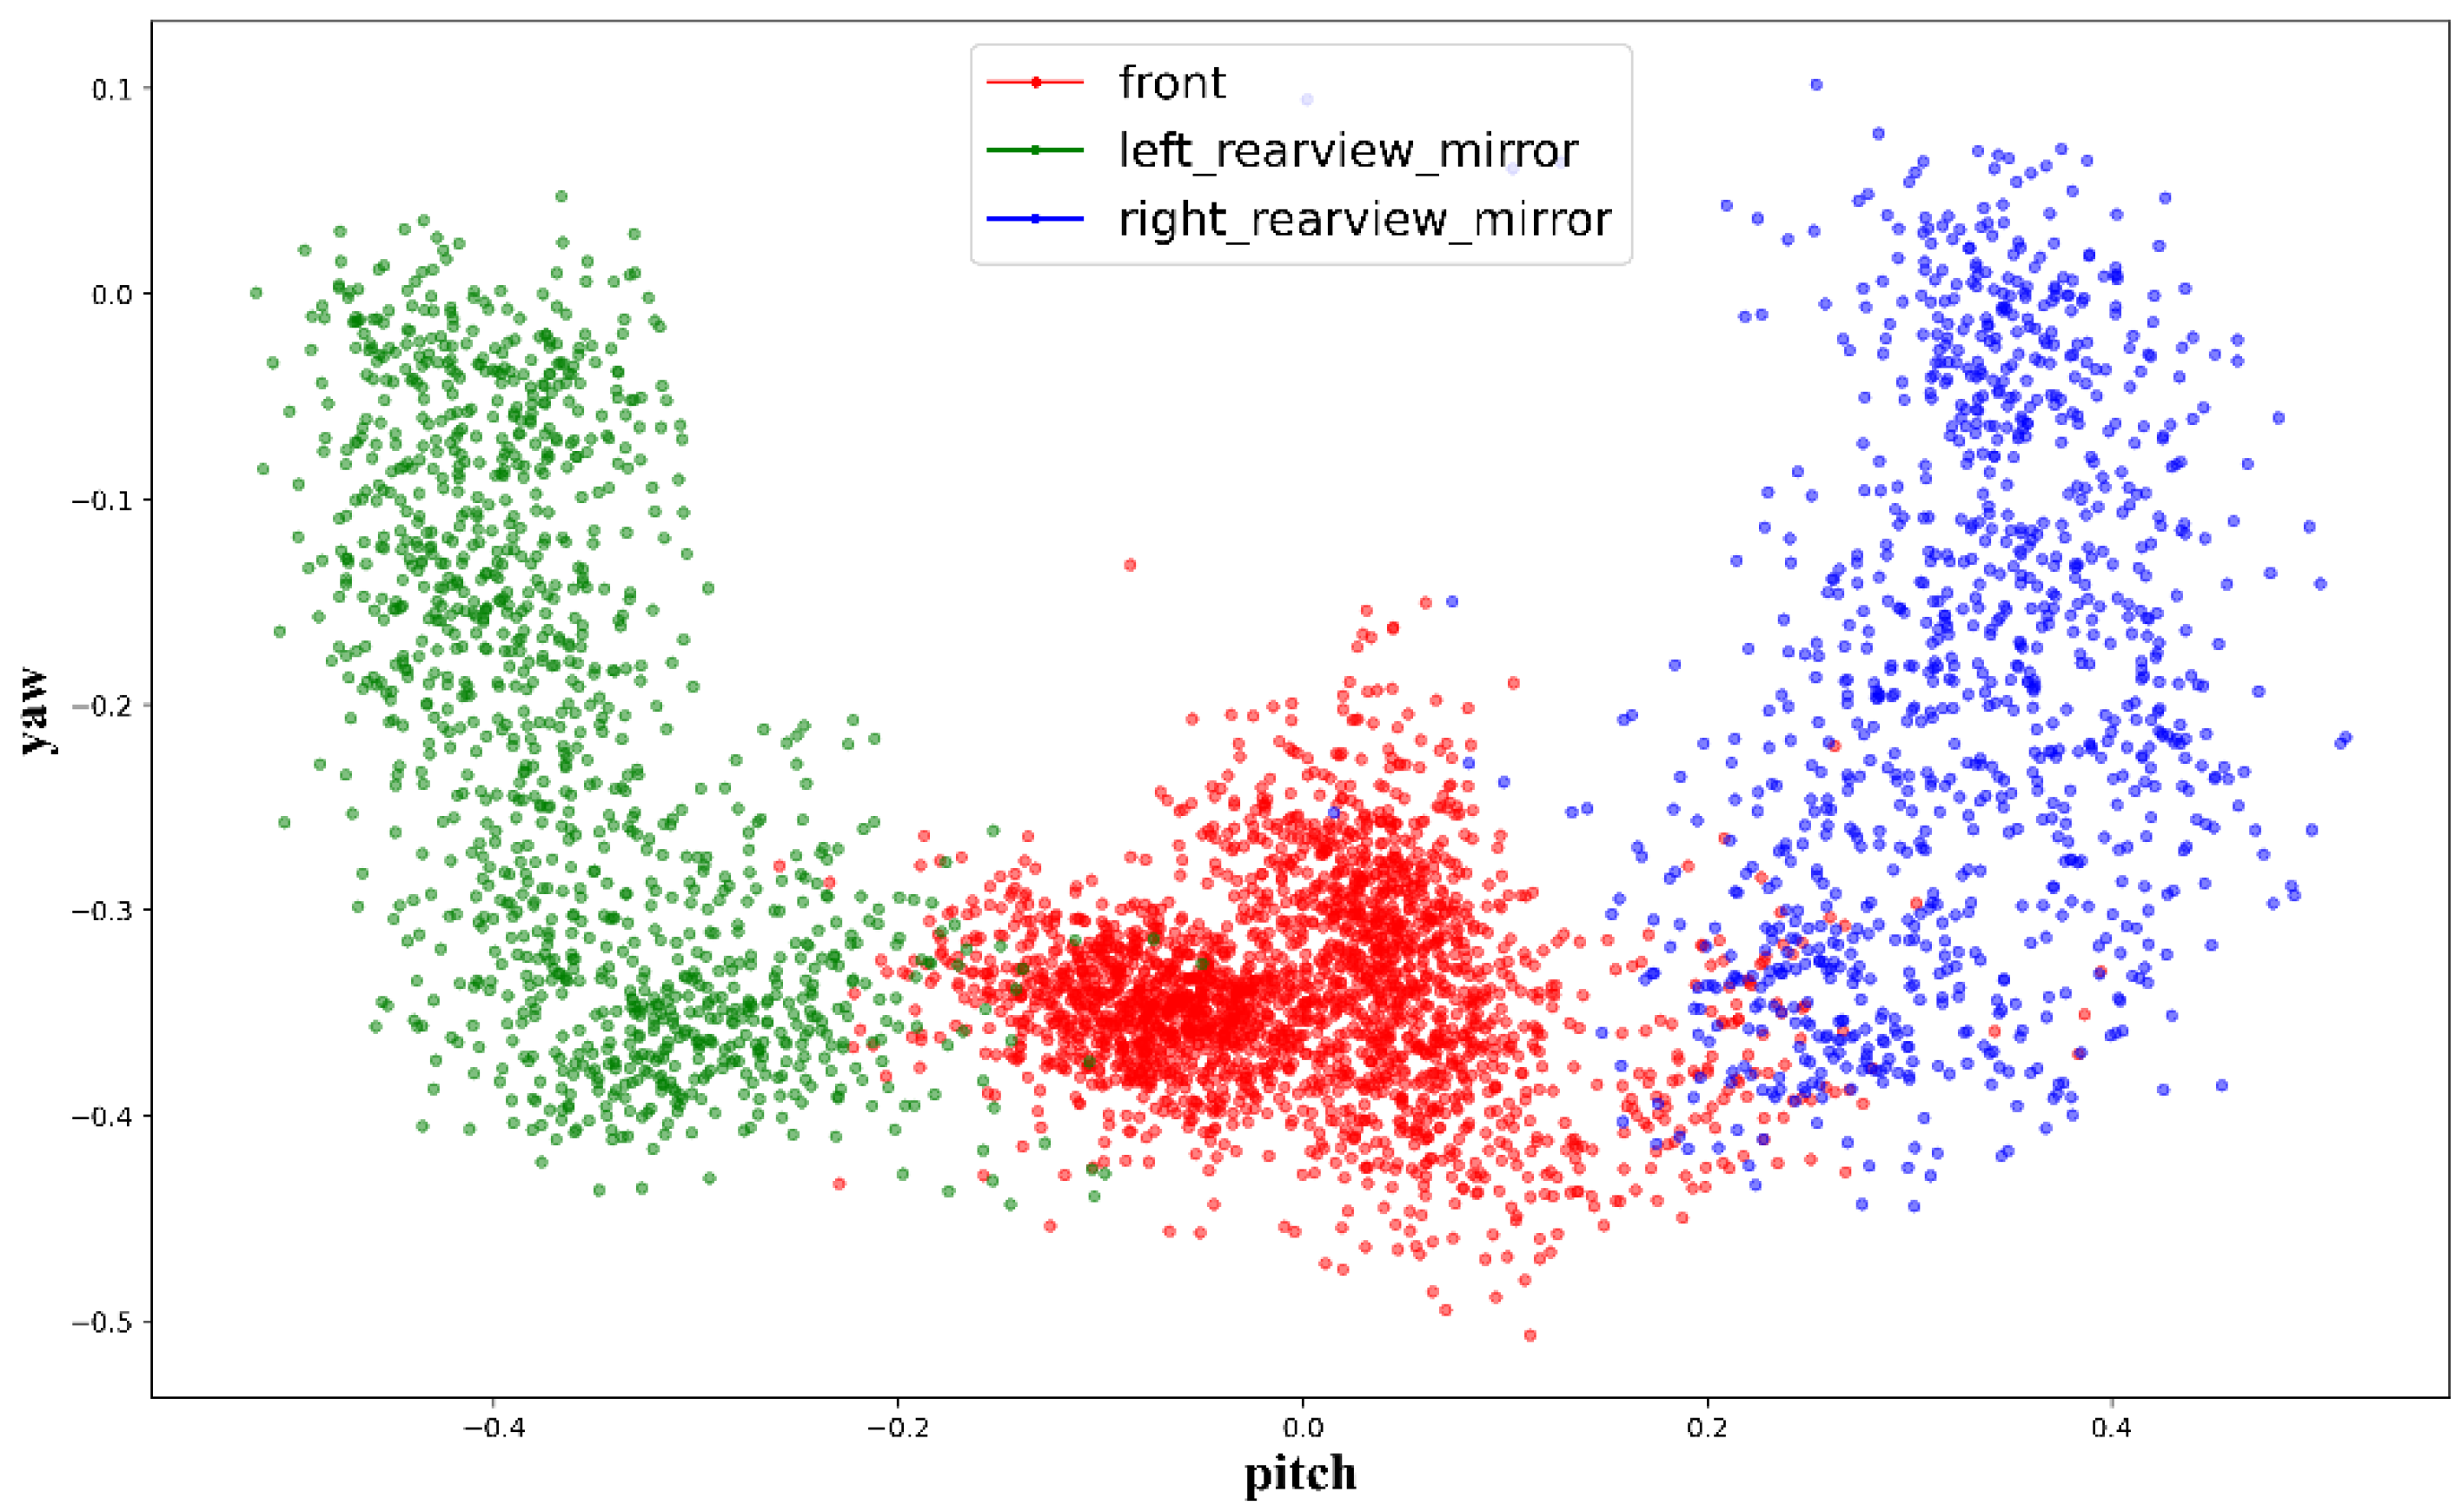
We collected a total of 4477 groups of data, which included 2323 groups of normal driving, 980 groups of gaze direction viewing the left rearview mirror, and 1174 groups of gaze direction viewing the right rearview mirror after removing invalid data in the simulation experiment, the gaze point data of one participant is shown in Figure 4.
The distribution of the driver’s gaze direction can be seen in Figure 4. The dashboard was located on the computer screen in the simulated experiment, which was different from the actual vehicle experiment. The driver would not be disturbed by the gaze direction viewing the dashboard in the simulated experiment. Therefore, the gaze direction viewing the dashboard was classified as normal driving.
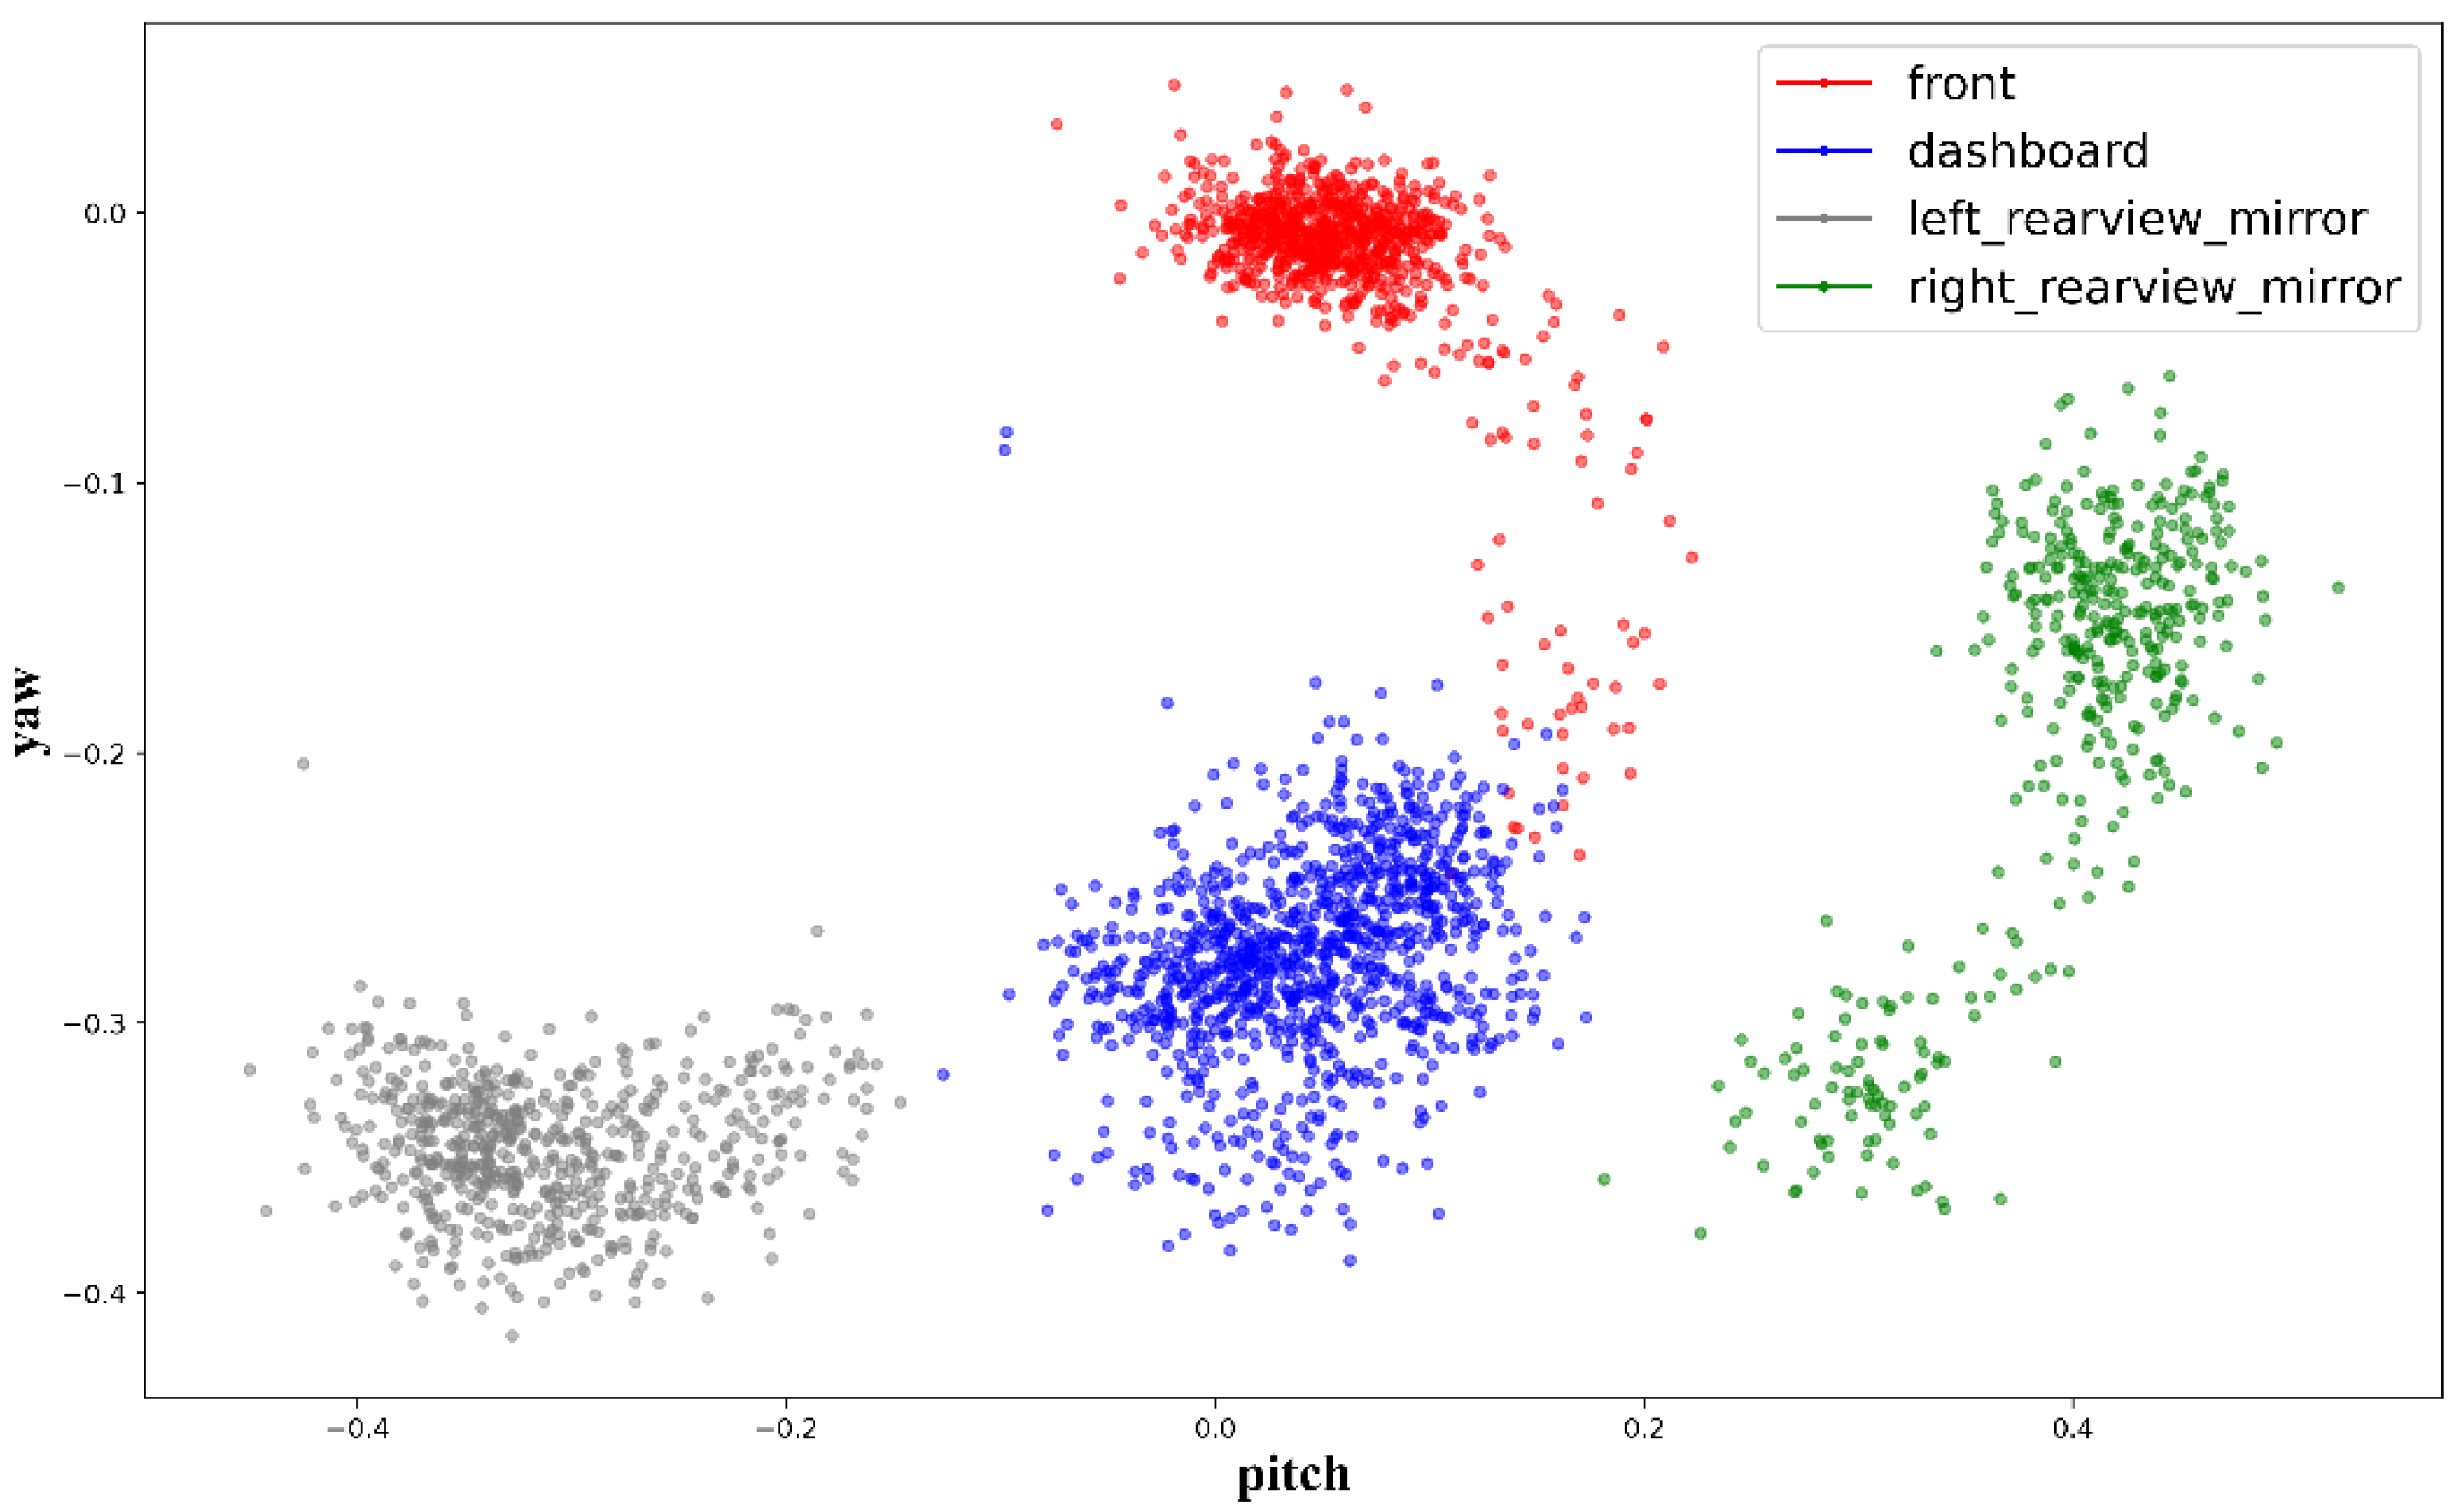
A total of 2841 groups of data were collected in the actual vehicle experiment, which included 806 groups of normal driving, 1034 groups of gaze direction viewing the dashboard, 399 groups of gaze direction viewing the left rearview mirror, and 602 groups of gaze direction viewing the right rearview mirror after being screened by the experiment assistant and the driver, the gaze point data of one participant is shown in Figure 5. The gaze direction viewing the dashboard can be well distinguished from the normal driving, which was different from the simulated experiment.
3.2. Model
The input data of the model was the pitch angle and the yaw angle, so the K Nearest Neighbors (KNN) algorithm, the Random Forest (RF) algorithm, and the Support Vector Machine (SVM) algorithm were considered to train the classified model.
The principle of the KNN algorithm is that when a new value is predicting, it belongs to the category of points closest to . The two most important aspects of the KNN algorithm are the selection of values and the calculation of the distance. The value can be set to a certain value by experimenting with multiple attempts. The distance can be calculated as follows:
The Random Forest algorithm can be divided into two stages. One is the stage of creating the random forest. The steps are as follows:
- (1)
- Randomly select features from all features, ;
- (2)
- Calculate node with the best split point from features;
- (3)
- Split a node into child nodes with the best split point;
- (4)
- Repeat the previous steps until the number of nodes is ;
- (5)
- Repeat the first four steps times to create a forest with trees.
The SVM algorithm used in this paper is the nonlinear support vector machine. The specific learning steps are as follows:
(1) Select the appropriate nuclear function and penalty function . Construct and solve the problem of convex secondary planning as follows:
Among this, , , . The value of the optimal solution is .
(2) Select a component of , which meets the criteria that can be calculated as follows:
(3) The classification decision function can be computed as follows:
If the Radial Basis Function is , the classification decision function can be calculated as follows:
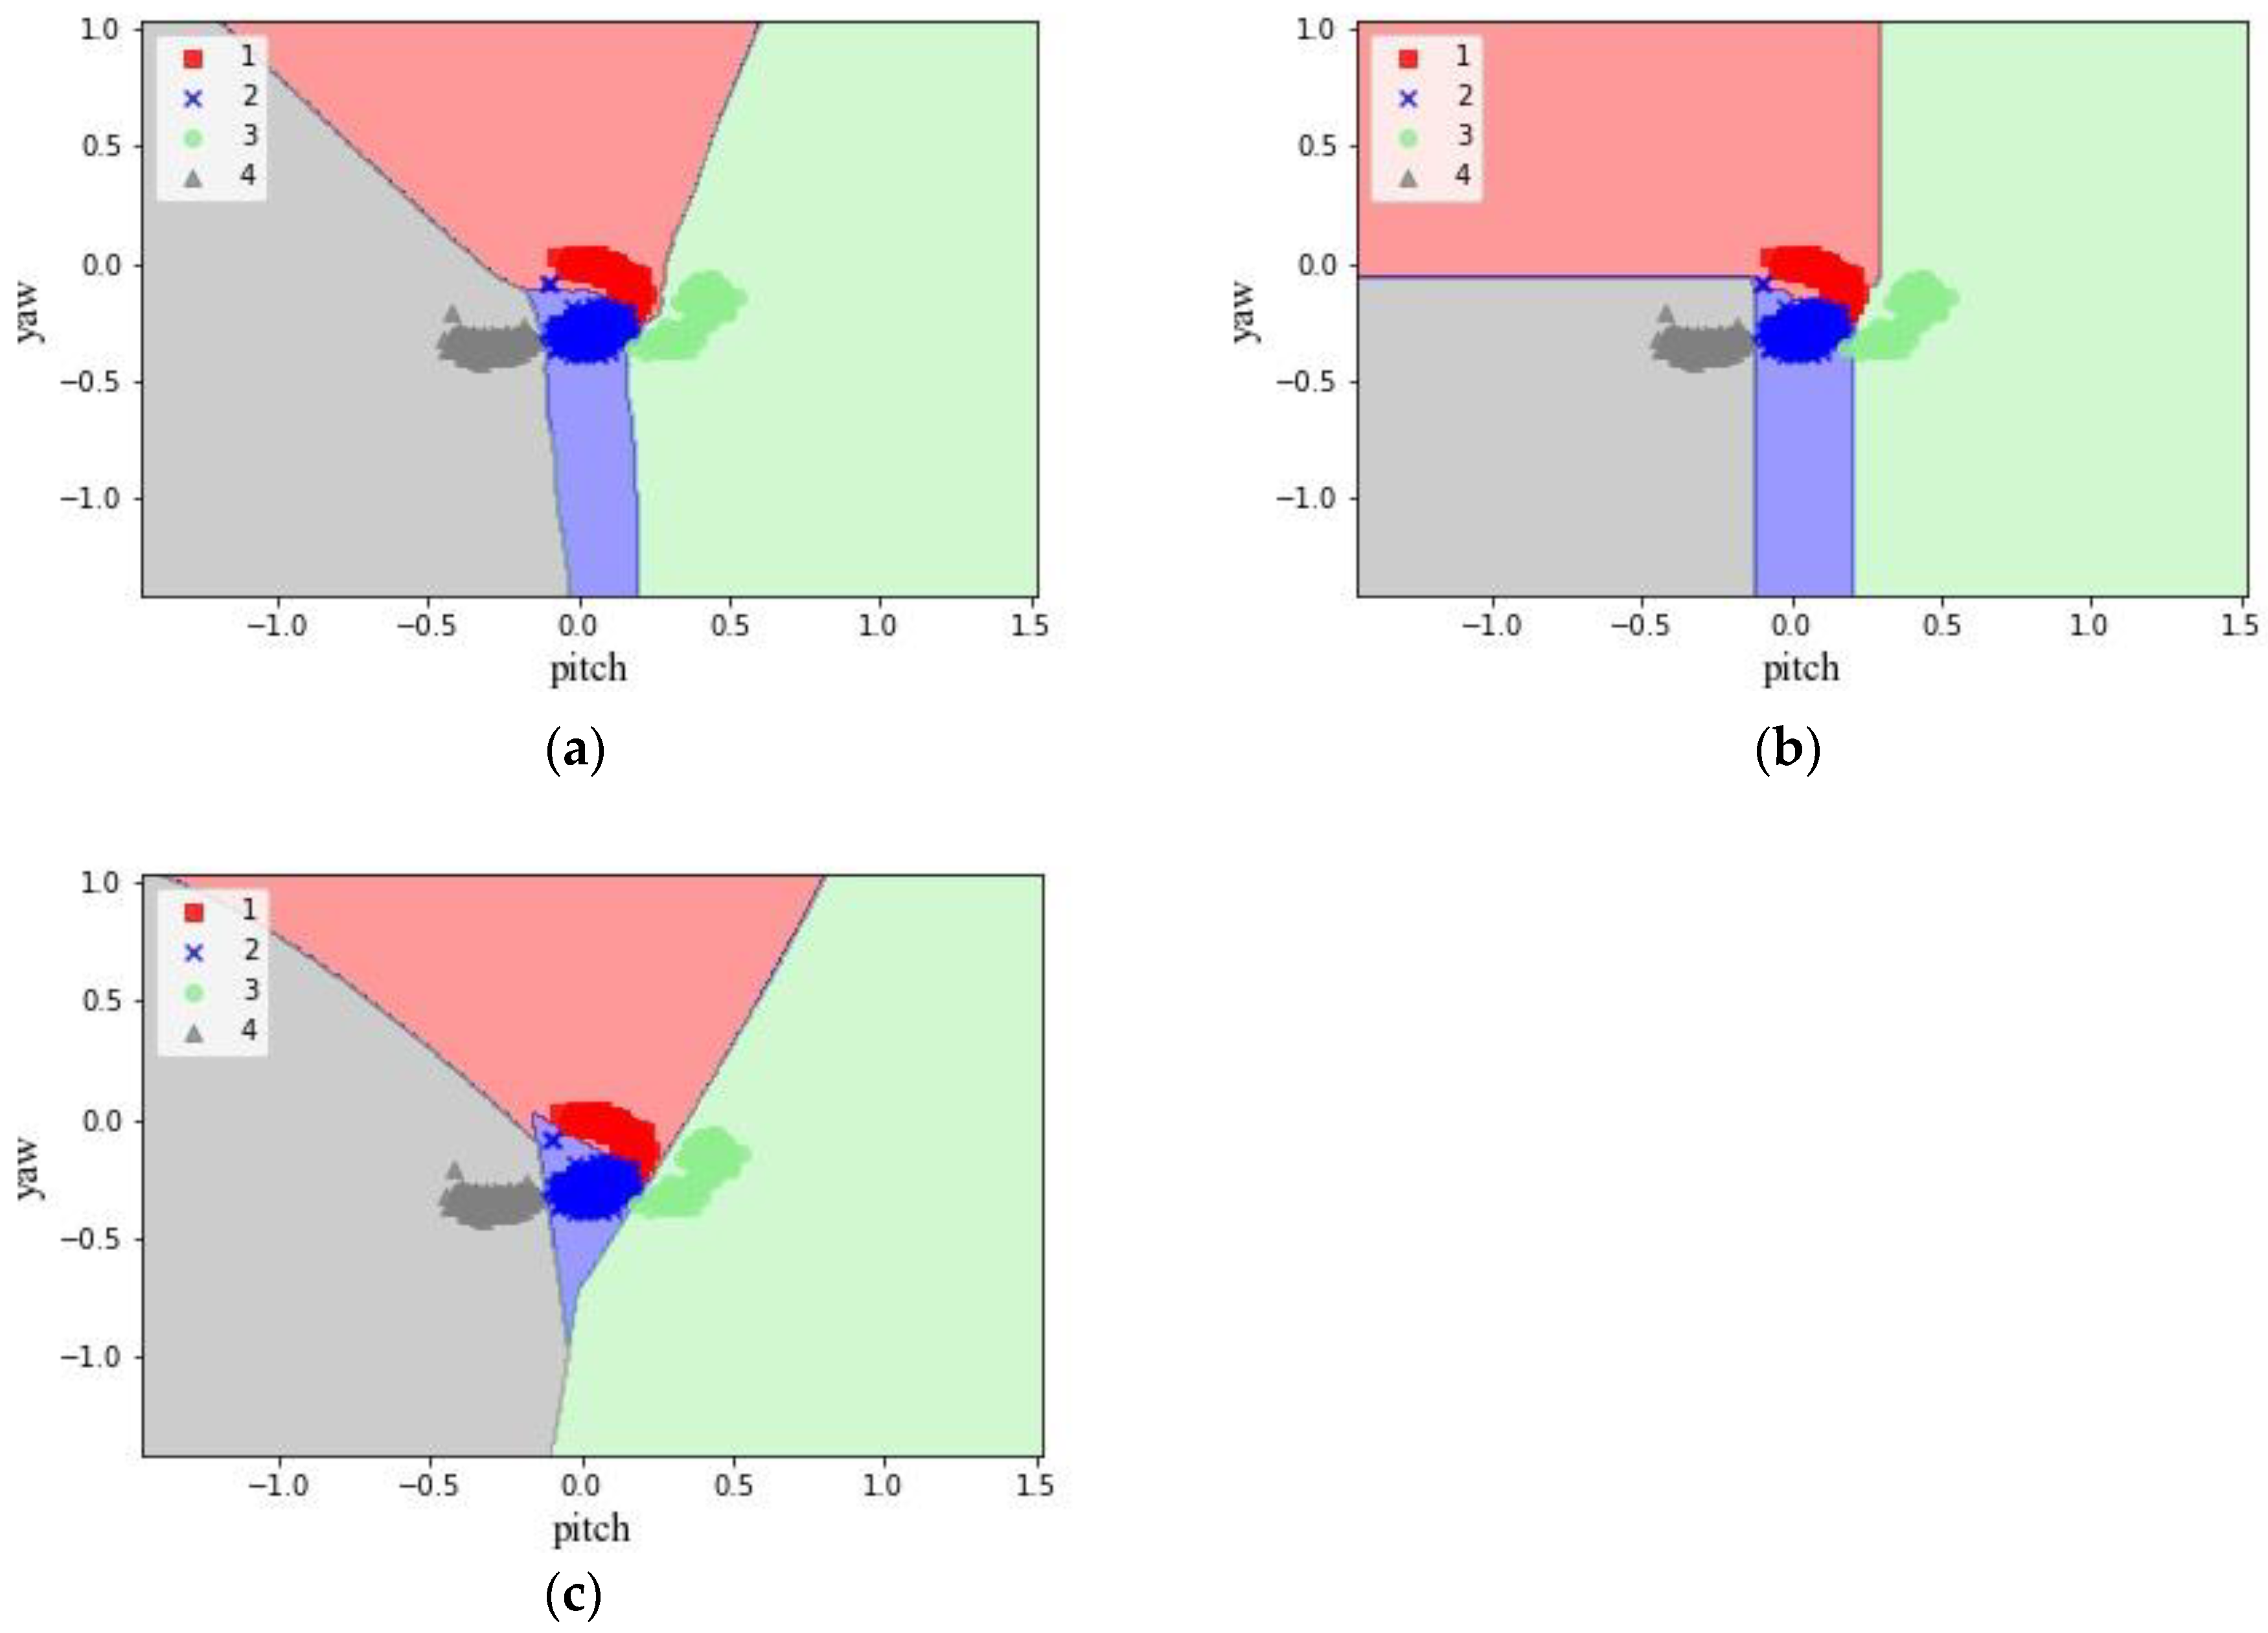
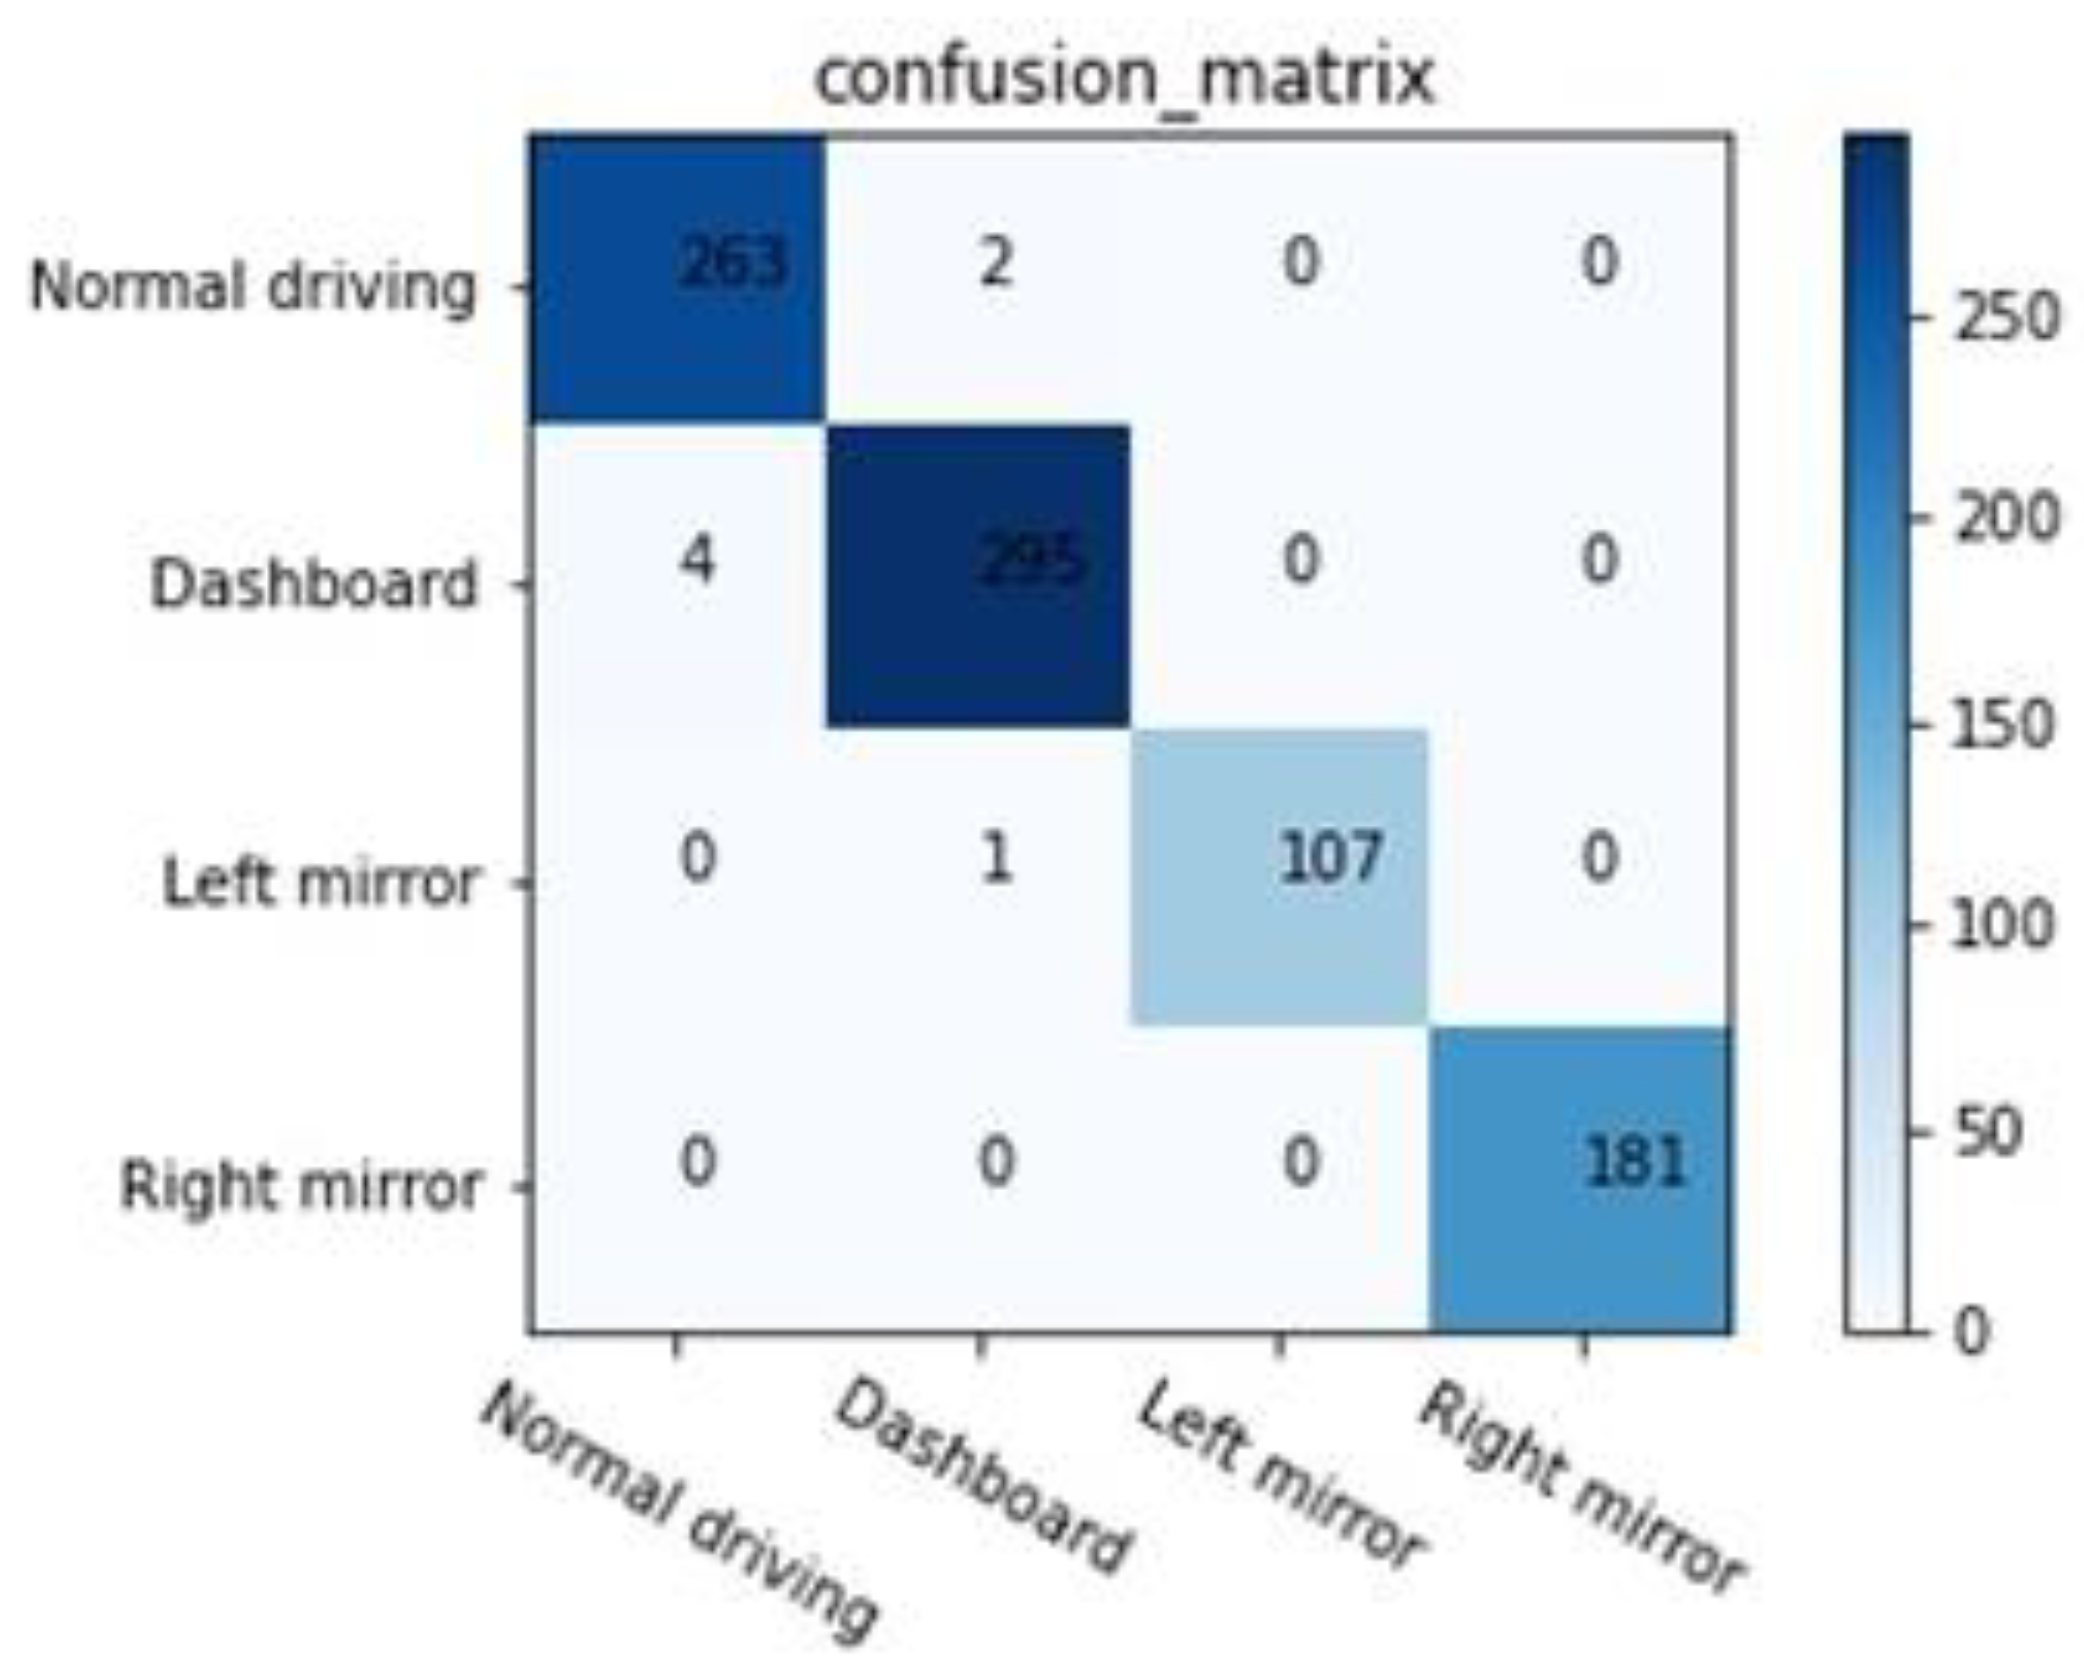
For the different regions of gaze direction, four labels which were normal driving, gaze direction viewing the dashboard, gaze direction viewing the left rearview mirror, and gaze direction viewing the right rearview mirror were used to classify it. The results are shown in Figure 6 and Table 1. It can be seen from Figure 6 that the results with the KNN algorithm were closer to the factual situation. Compared to the SVM algorithm and the RF algorithm, the KNN algorithm is simple and easy to use. The training process of the KNN model is fast and is not sensitive to outliers. The detection results are accurate. Therefore, the KNN algorithm was chosen to train the model and classify the region of the driver’s gaze direction. The confusion matrix is shown in Figure 7 and the relevant evaluation parameters are shown in Table 2.
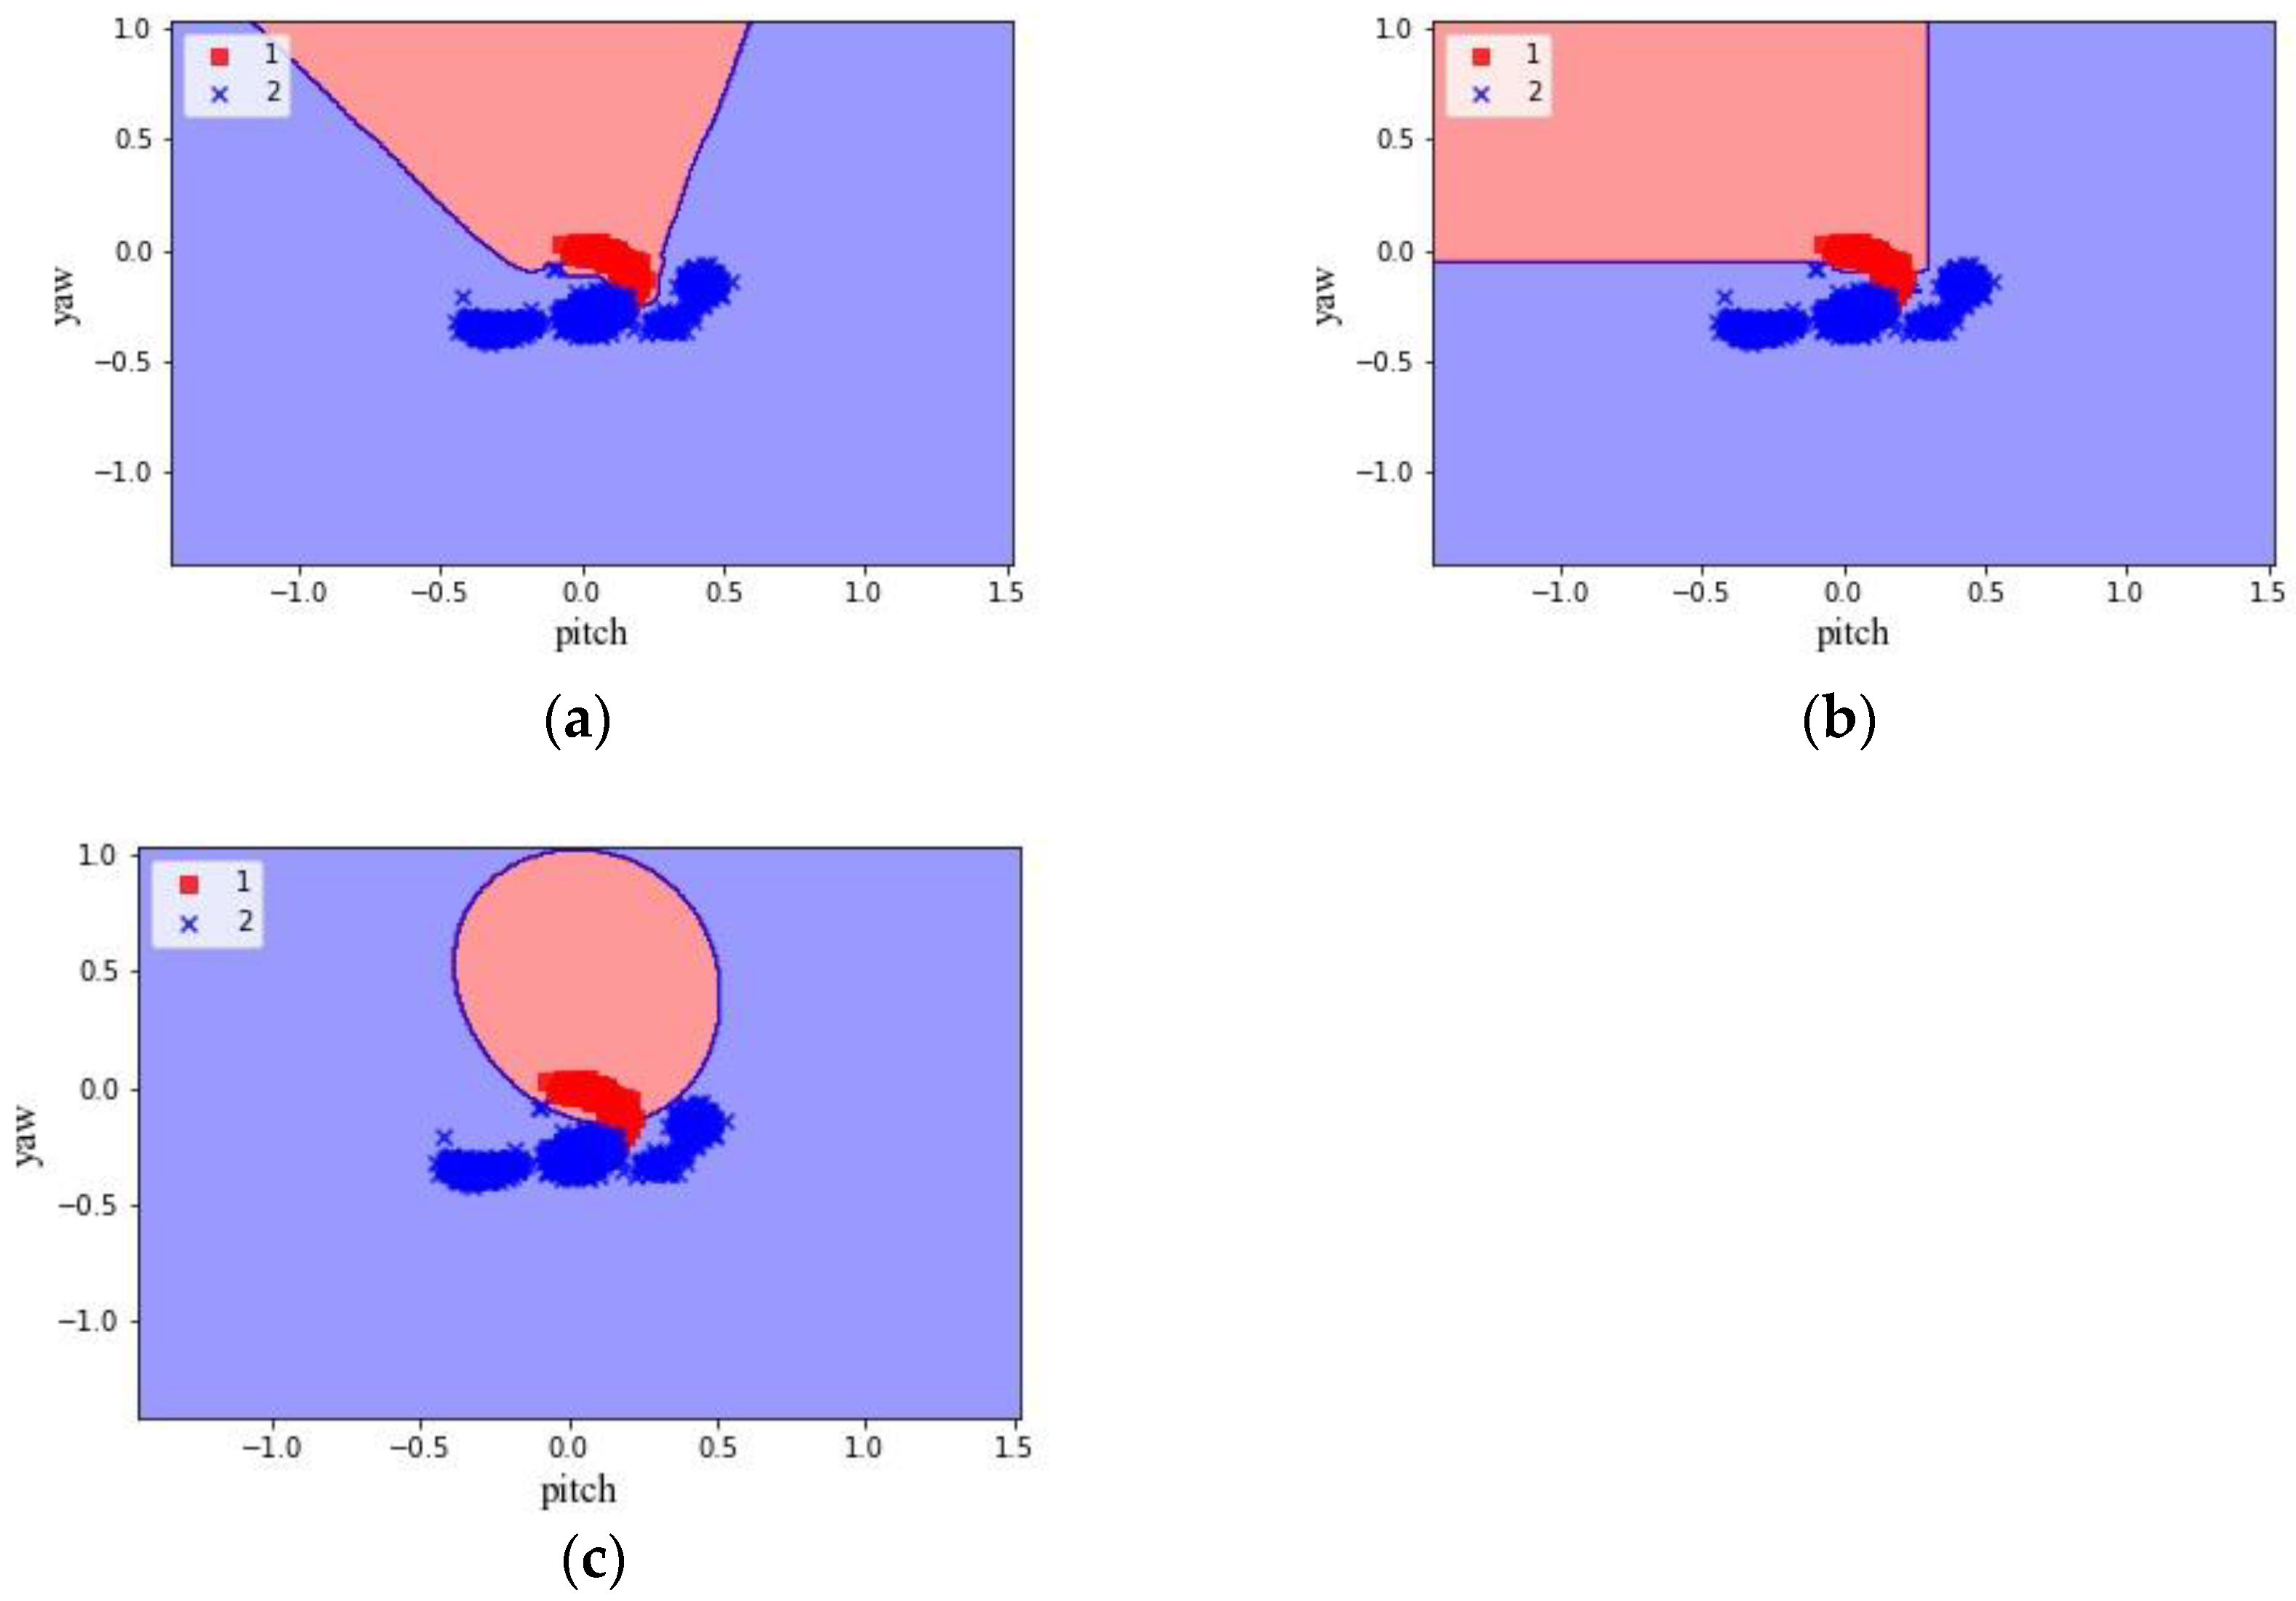
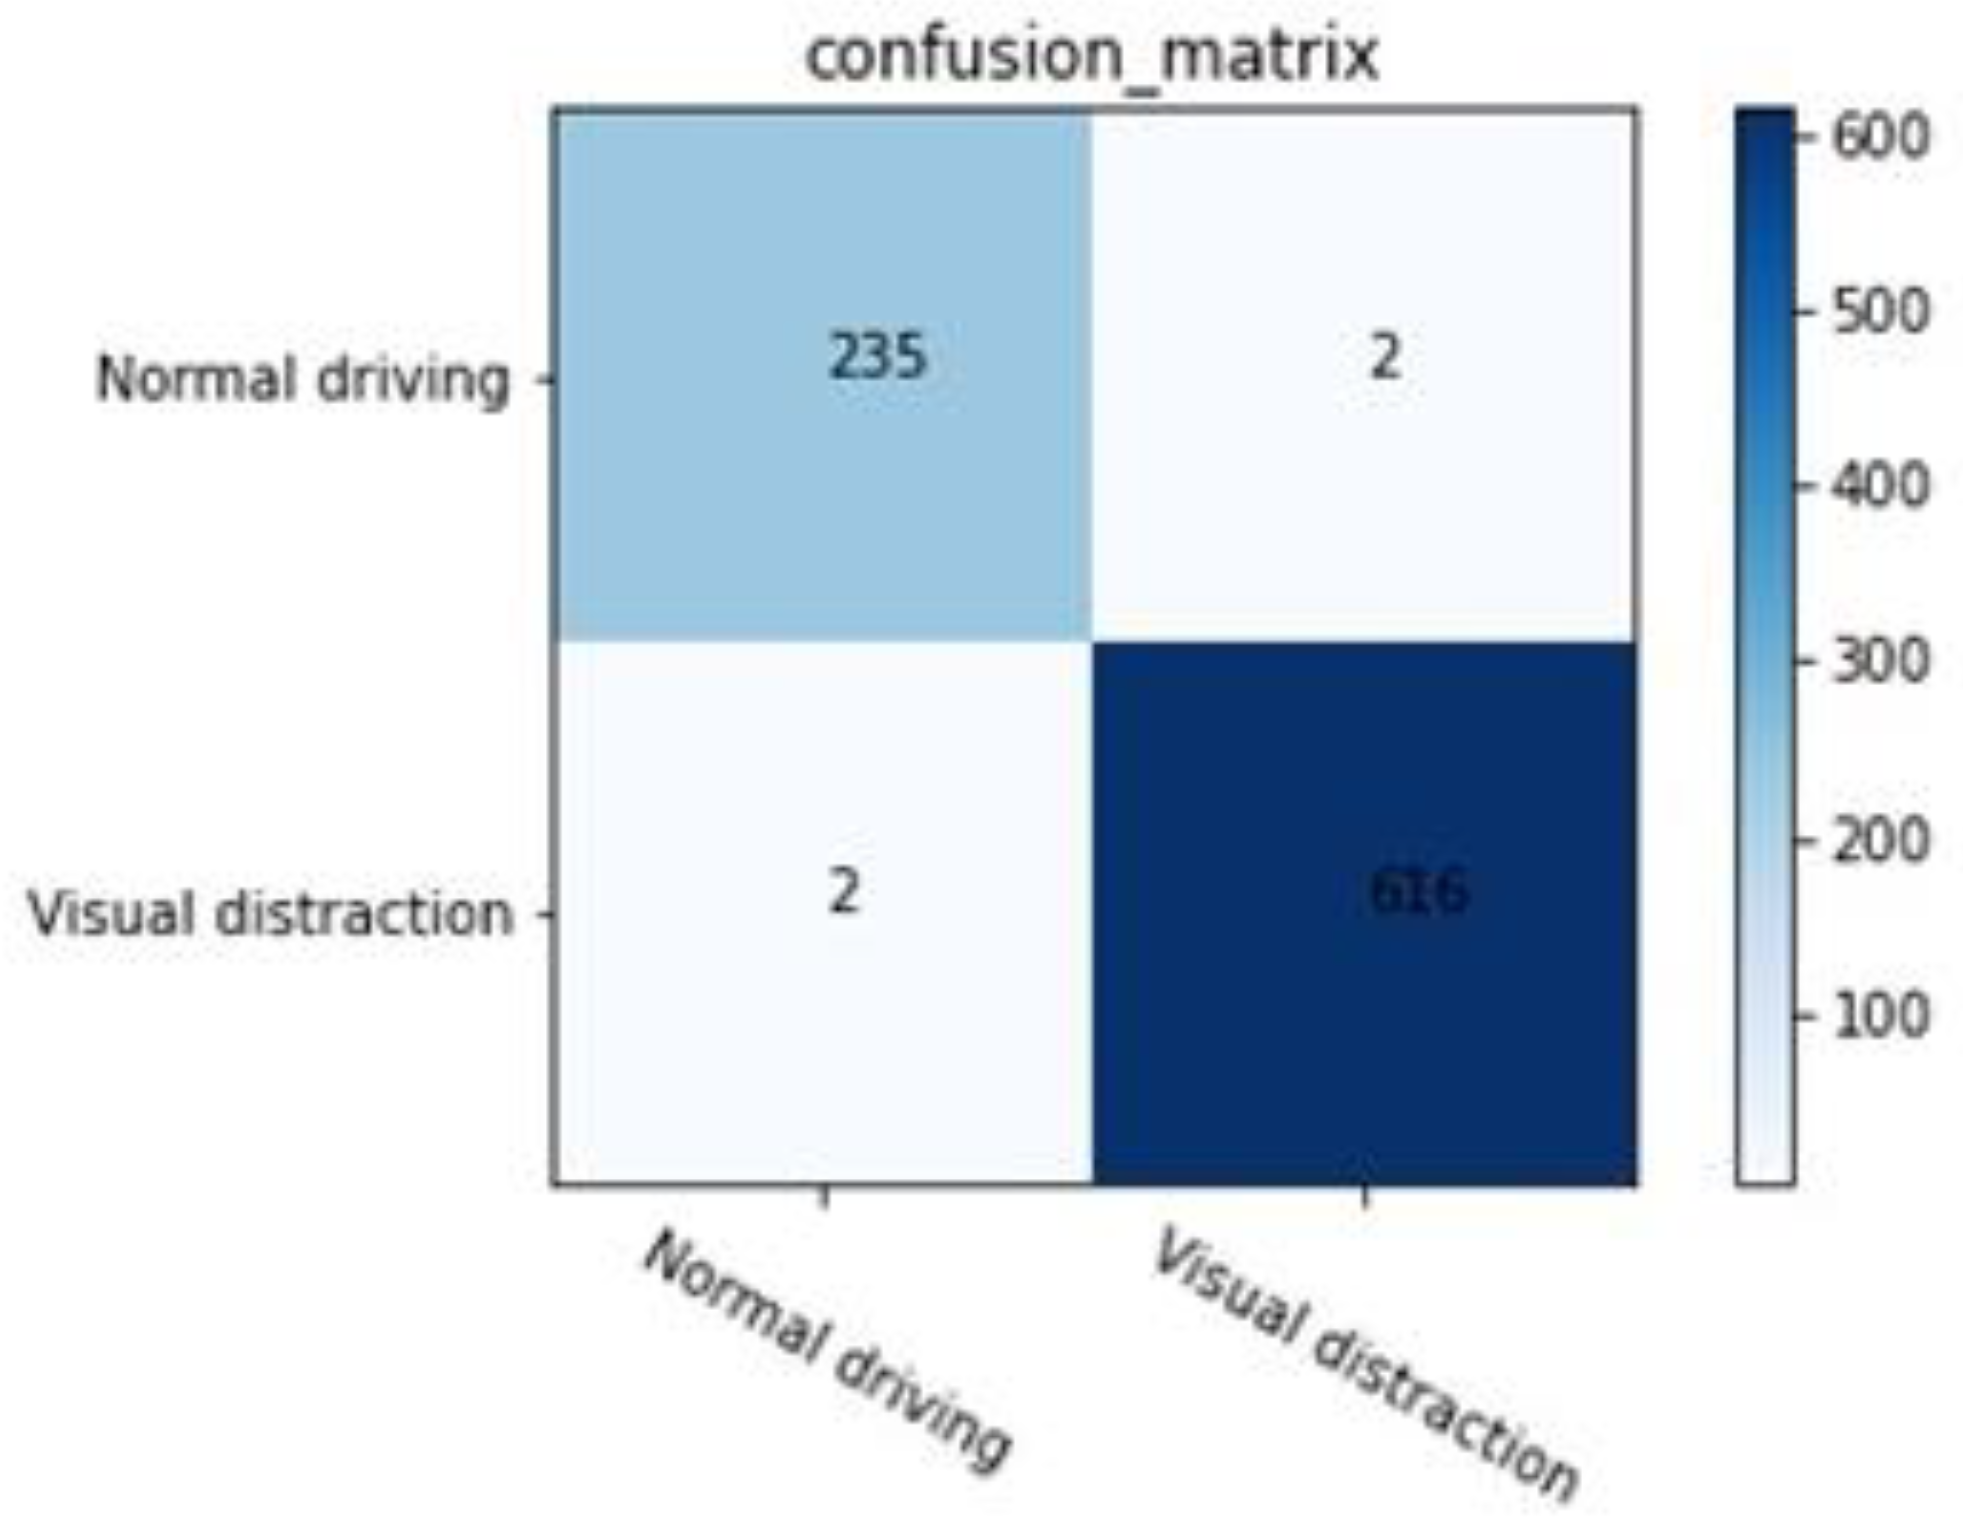
If the region of the driver’s gaze direction which deviates from the front road is recognized as the driver’s visual distraction, two labels which are the visual distraction state and the normal driving state can be used in the model training or predicting the results. The results are shown in Figure 8 and Table 3. It can be seen that the result of the KNN algorithm was closer to the actual situation, whereas the other two algorithms were far from the actual situation. Therefore, the KNN algorithm was chosen to train the model and predict whether the driver was in a state of visual distraction. The confusion matrix is shown in Figure 9 and the relevant evaluation parameters are shown in Table 4.
3.3. Test Results
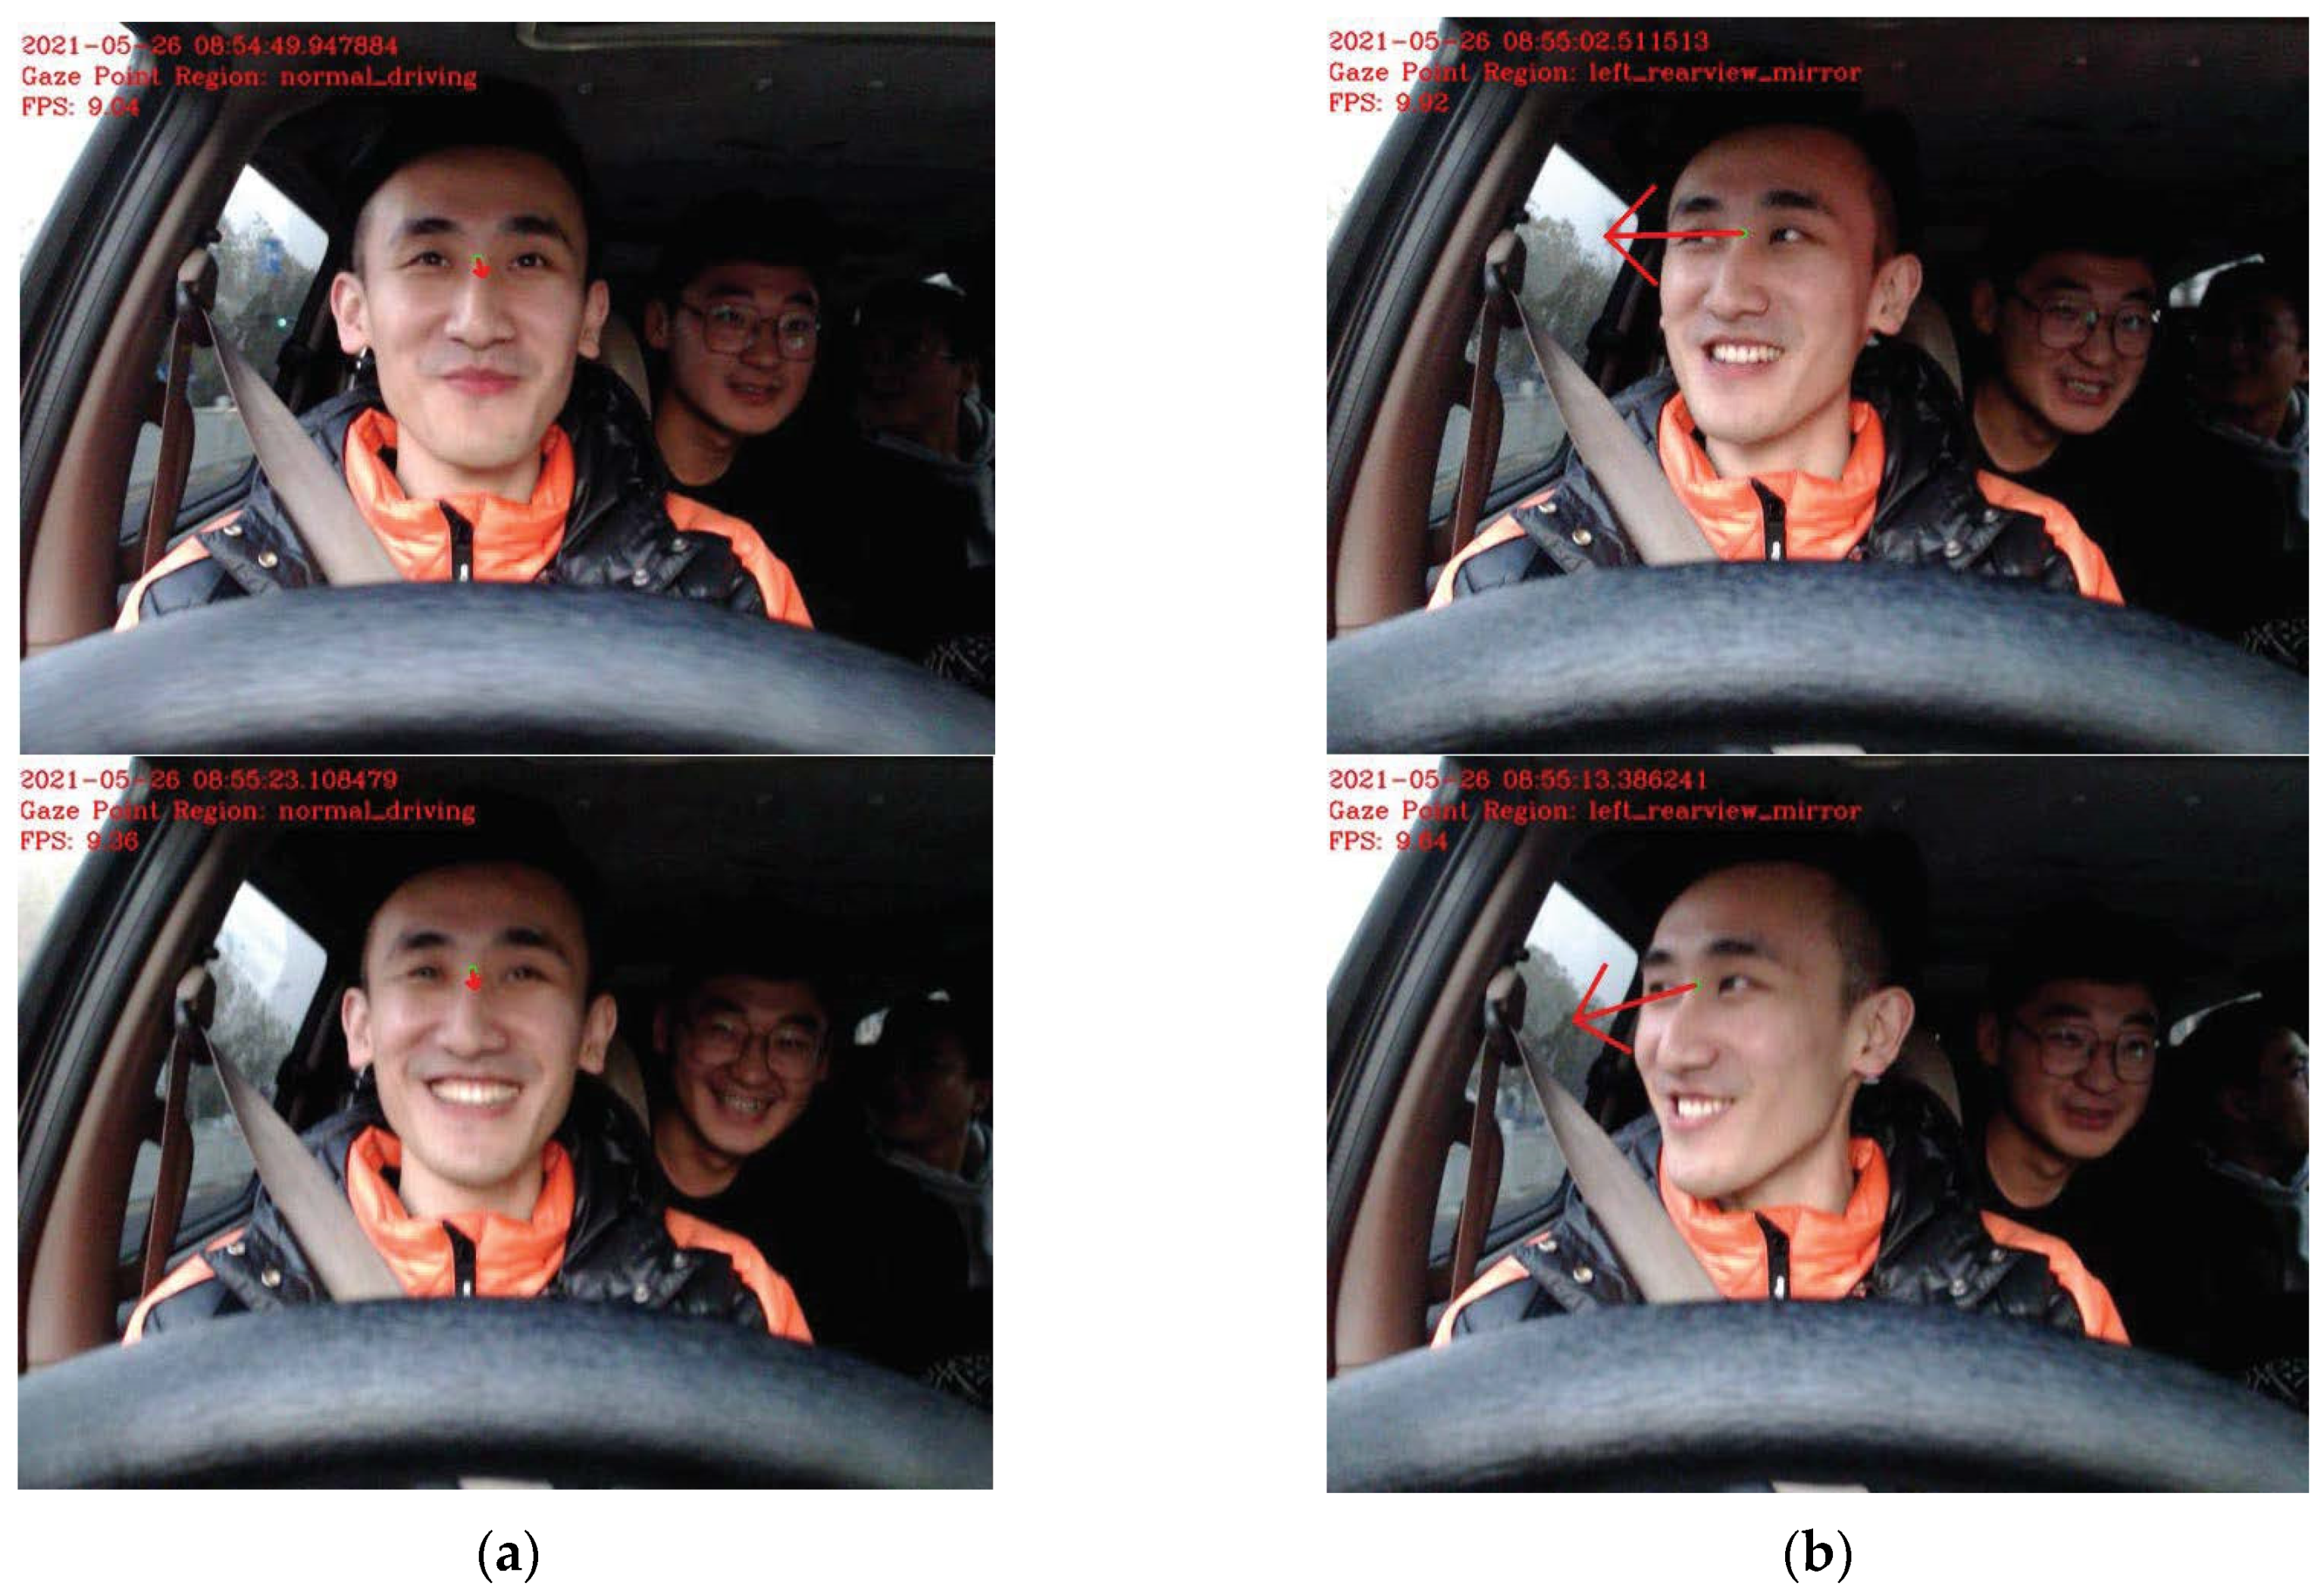
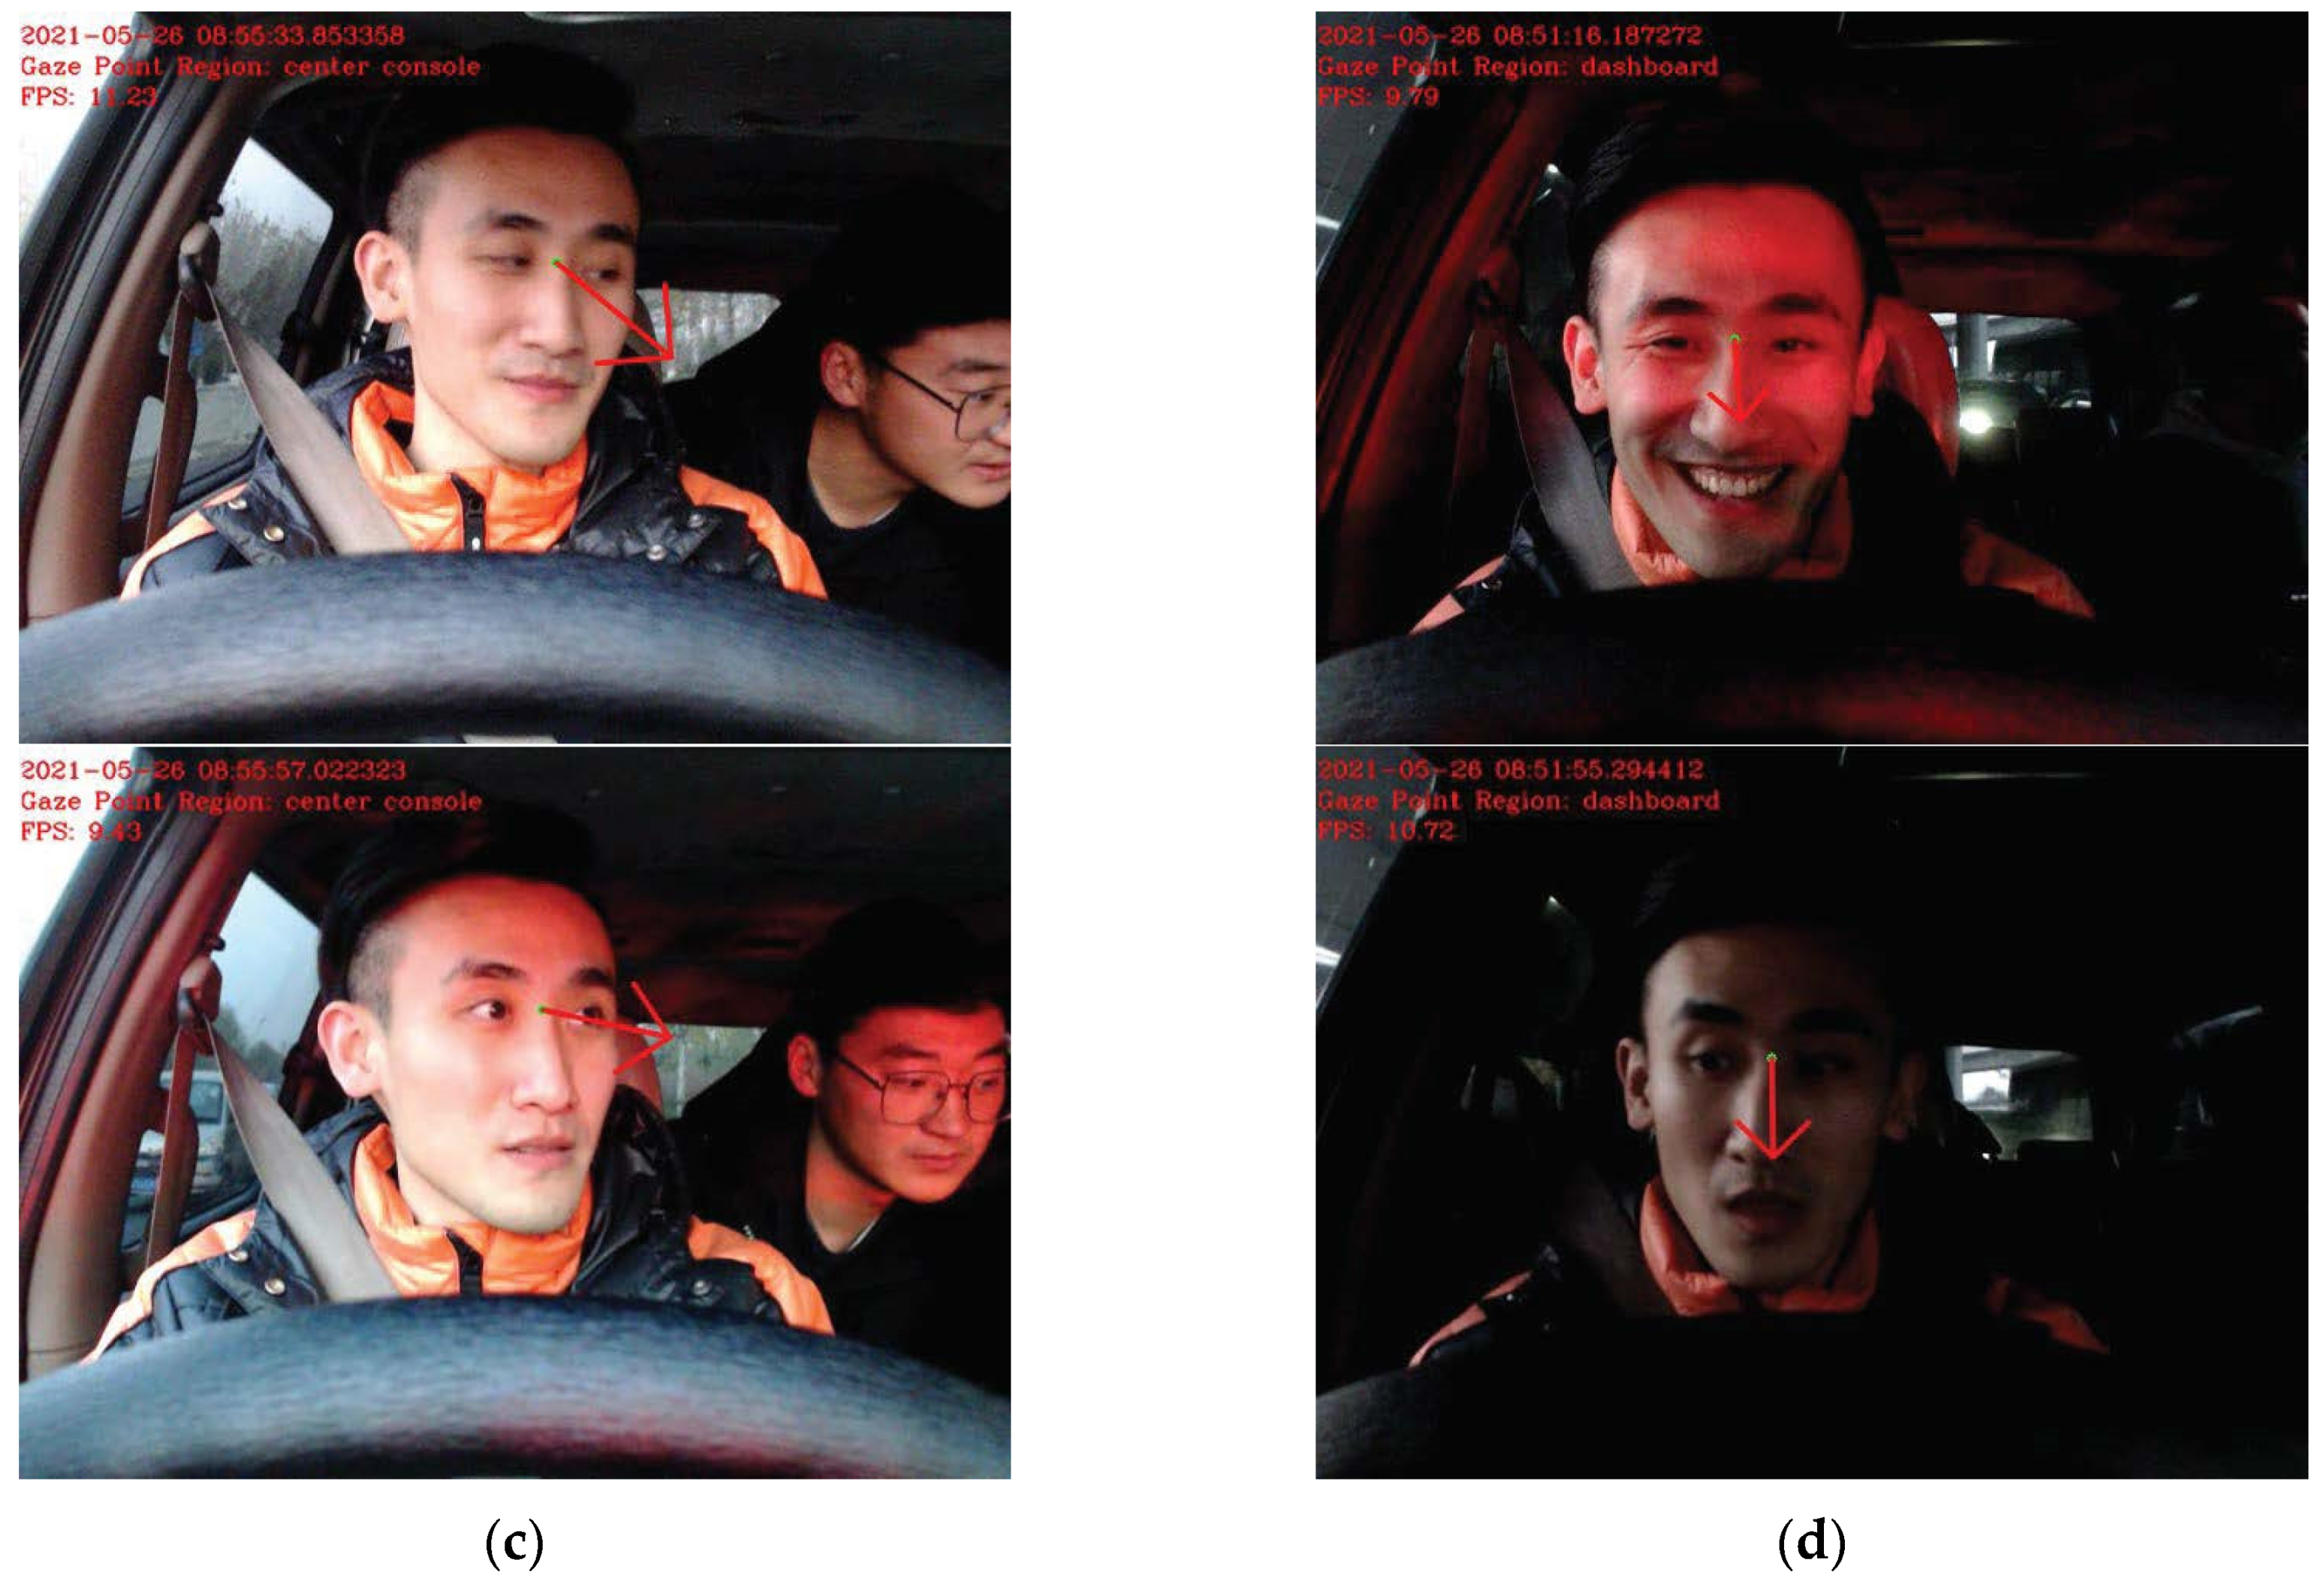
The model was tested in the real vehicle experiment. The route selected in the experiment was arbitrary, and the driver was under natural driving states. The driver cannot be disturbed by the experiment assistant during driving. The face image was collected by the RGB camera, and the experiment assistant needed to record the region of the driver’s gaze direction, which included the four regions. The driver immediately watched the video playback after driving and reported the region of his gaze direction during driving. The recorded video was processed to obtain the classified results which were the regions of the driver’s gaze direction at each moment by the visual distracted model. Compared to the data recorded by the experiment assistant, the model could be verified and assessed. The driver’s face image and the results detected by the model are shown in Figure 10.
Considering that the other passengers’ faces may appear in the view of the camera, the threshold of face size was set to a certain value for avoiding interference. The human face of the passenger in the back row was too small to be detected by the MTCNN face detector. It can be seen that a passenger in the back row, who was not recognized by the face detector, was in the view of the camera. As shown in Figure 10, the driver’s gaze region can be detected and classified in low light conditions.
After assessment and verification, the driver’s gaze region during driving can be well detected by the visual distraction detection method used in this paper. The gaze region data can be further converted to the driver’s visual distraction states.
4. Discussions
The visual distraction detection methods can be divided into two ways. One of the two ways is detecting the driver’s state [18,19,20]. This method is widely used in the drivers’ visual distraction detection, which can be detected by the eye tracker or the camera. The eye trackers are mainly divided into two types: glasses eye tracker and telemetry eye tracker. The glasses eye tracker is invasive and can interfere with the normal driving state of the driver. The extra burden can be added to the driver by wearing the glasses eye tracker. Although the telemetry eye tracker is unintrusive, it is difficult to install in the vehicle because the gaze direction can be only shown on the display with the telemetry eye tracker. Machine learning or deep learning is commonly used in most of the detection methods by the camera to detect the position of the pupil to calculate the gaze direction.
The other methods are indirect detection methods [15,21,22,23]. The driver’s visual distraction classification model can be established with the vehicle dynamics parameters. It is easy to collect the vehicle data by sensors during driving and the data is accurate. However, this method is an indirect detection method that cannot directly detect the driver’s state. Although the distraction state is induced by a single secondary task, such as visual task, motion task, or auditory task, it is difficult to ensure that the vehicle dynamics data collected in the experiment corresponds to a certain distraction state one-to-one. The distraction states cannot be well classified by the vehicle dynamics parameters. The level of distraction induced by the secondary tasks is relatively high in most experiments. For example, in the design of the visual distraction experiment, visual distraction is defined as the time when the driver’s line of sight is off the road for 1 s or even more than 2 s. Therefore, it is impossible to detect visual distraction when the line of sight is off the road for a short time or with a high frequency. In these two states, the driver is also in a state of visual distraction, which has a certain impact on driving safety.
In this paper, an RGB camera was used to collect the driver’s facial image in real time, and the data was processed by the NVIDIA Jetson Xavier NX. The region of the driver’s gaze direction can be detected with the processed gaze direction data, which can be further used to judge whether the driver is in a state of visual distraction. This detection method has many advantages. The driver’s information can be collected just by one RGB camera. Additional equipment was not required to be worn. It is easy to install and has no intrusive impact on the driver. A suitable installation location can be easily found in any vehicle, and it will not affect or change the layout of the vehicle. Therefore, the driver will not be disturbed during driving. The results of the experiment can be closer to the natural driving state, and the method can be more easily generalized to the actual vehicles.
The process of detecting whether the driver is in a state of visual distraction is as follows:
- (1)
- The video streaming is collected by the camera and converted into a single frame image.
- (2)
- The single frame image is used as the input of the MTCNN face detector. A face image can be obtained after processing.
- (3)
- As the full-face appearance-based gaze estimation method was used in this paper, the eye image did not need to be extracted from the face image. The face image can be used as the input of the full-face appearance-based gaze estimation method directly, and gaze directions can be calculated by the method.
- (4)
- The gaze directions can be classified by the KNN algorithm, and the gaze region can be detected by the trained model.
- (5)
- Finally, whether the driver is in a state of visual distraction can be judged from the gaze region.
The whole framework ran at 12 FPS. The model trained by the MTCNN face detector and the full-face appearance-based gaze estimation method are all lightweight networks, which can meet the accuracy and speed requirements for our tasks. The region of the driver’s gaze direction can be detected in real-time, and related operations can be completed such as early warning. It can be seen in Figure 6 that the region of the driver’s gaze direction can be well distinguished with the model trained by the KNN algorithm. The division of the gaze region is also close to the real situation in vehicles. The method used in this paper is also robust to the environmental changes, which is shown in Figure 10. The accuracy will not be affected when the light changes to a certain extent. The threshold range of the face size in the image is set at a certain value, which can be determined by multiple attempts. The interfering factors when multiple faces enter the view of the camera can be circumvented by this setting so that the camera can always focus on the driver while the facial information of other passengers can be ignored. Compared with the method based on the vehicle dynamics parameters, the gaze direction region detection method used in this paper is a direct detection method and has a better recognition effect for the short and subtle distraction state of the driver. Unlike the previous detection method based on the driver’s state, the driver’s gaze direction rather than the position of the pupil is used in this method to determine the region where the driver’s current visual attention is concentrated, and whether the driver is in a state of visual distraction can be further estimated by the KNN model.
5. Conclusions
A real-time and nonintrusive method was proposed to detect the region of the driver’s gaze direction by machine learning in this paper. The region of the driver’s gaze direction was divided into four categories: normal driving line of sight (looking at the road ahead), looking at the left side mirror, looking at the right side mirror, and looking at the dashboard. A full-face appearance-based gaze estimation method was used in this paper to obtain the gaze directions of the driver. The gaze direction data can be collected just by an RGB camera. A suitable installation location can be easily found in any vehicle, and it will not affect or change the layout of the vehicle. The KNN algorithm was selected to train the driver’s visual distraction detection model. The accuracy rate reached 99.88%. The method proposed in this paper is a nonintrusive and real-time approach which is a direct detection method, and it has a better recognition effect for the short and subtle dis-traction state of the driver. The region of the driver’s gaze directions can be well detected by the method in this paper, which is of great significance for further exploring the visual distraction state level and its influence on driving behavior.
Author Contributions
All of the authors contributed substantially to the conception and design of the study. Conceptualization, X.W. and H.S.; methodology, H.S., X.W. and L.C.; software, L.C., G.W. and Q.W.; validation, G.W.; formal analysis, H.S. and L.C.; investigation, G.W. and Q.W.; resources, X.W.; data curation, L.C.; writing—original draft preparation, L.C.; writing—review and editing, H.S., X.W. and L.C.; visualization, L.C.; supervision, X.W.; project administration, X.W.; funding acquisition, X.W. All authors have read and agreed to the published version of the manuscript.
Funding
This research was funded by the Natural Science Foundation of Shandong Province, grant number ZR2020MF082; the Qingdao Top Talent Program of Entrepreneurship and Innovation, grant number 19-3-2-8-zhc; the Collaborative Innovation Center for Intelligent Green Manufacturing Technology and Equipment of Shandong Province, grant number IGSD-2020-012; the National Key Research and Development Project, grant number 2018YFB1601500.
Institutional Review Board Statement
The study was conducted in accordance with the Declaration of Helsinki, and approved by the Ethics Committee of the College of the Electromechanical Engineering, Qingdao University of Science & Technology, on 24 November 2020.
Informed Consent Statement
Informed consent was obtained from all subjects involved in the study. Written informed consent has been obtained from the participants to publish this paper.
Data Availability Statement
Data will be made available from the corresponding author on reasonable request.
Conflicts of Interest
The authors declare no conflict of interest.
References
- Young, K.; Regan, M.; Hammer, M. Driver distraction: A review of the literature. Distracted Driv. 2007, 2007, 379–405. [Google Scholar]
- Regan, M.A.; Lee, J.D.; Young, K. Driver Distraction: Theory, Effects, and Mitigation; CRC Press: Boca Raton, FL, USA, 2008. [Google Scholar]
- Friswell, R.; Williamson, A. Exploratory study of fatigue in light and short haul transport drivers in NSW, Australia. Accid. Anal. Prev. 2008, 40, 410–417. [Google Scholar] [CrossRef] [PubMed]
- Wang, Q.; Yang, J.; Ren, M.; Zheng, Y. Driver fatigue detection: A survey. In Proceedings of the 2006 6th World Congress on Intelligent Control and Automation, Dalian, China, 21–23 June 2006; pp. 8587–8591. [Google Scholar]
- Liu, Y.; Wang, X. The analysis of driver’s behavioral tendency under different emotional states based on a Bayesian Network. IEEE Trans. Affect. Comput. 2020. [Google Scholar] [CrossRef]
- Wang, X.; Guo, Y.; Bai, C.; Yuan, Q.; Liu, S.; Han, J. Driver’s intention identification with the involvement of emotional factors in two-lane roads. IEEE Trans. Intell. Transp. Syst. 2020, 22, 6866–6874. [Google Scholar] [CrossRef]
- Klauer, S.G.; Dingus, T.A.; Neale, T.V.; Sudweeks, J.D.; Ramsey, D.J. The Impact of Driver Inattention on Near-Crash/Crash Risk: An Analysis Using the 100-Car Naturalistic Driving Study Data; U.S. Department of Transportation: Washington, DC, USA, 2006.
- National Center for Statistics and Analysis. Distracted Driving 2018 (Research Note. Report No. DOT HS 812 926); National Highwasy Traffic Safety Administration: Washington, DC, USA, 2020.
- Ranney, T.A.; Garrott, W.R.; Goodman, M.J. NHTSA Driver Distraction Research: Past, Present, and Furture. 2001. Available online: https://www-nrd.nhtsa.dot.gov/departments/Human%20Factors/driver-distraction/PDF/233.PDF (accessed on 1 December 2021).
- Treat, J.R. A study of precrash factors involved in traffic accidents. HSRI Res. Rev. 1980, 10, 35. [Google Scholar]
- Streff, F.M. Driver Distraction, Aggression, and Fatigue: Synthesis of the Literature and Guidelines for Michigan Planning. 2000. Available online: https://deepblue.lib.umich.edu/bitstream/handle/2027.42/1318/93390.0001.001.pdf?sequence=2 (accessed on 1 December 2021).
- Engstrom, J.; Markkula, G. Effects of Visual and Cognitive Distraction on Lane Change Test Performance. 2007. Available online: https://trid.trb.org/view/814580 (accessed on 1 December 2021).
- Li, W.; Huang, J.; Xie, G.; Karray, F.; Li, R. A survey on vision-based driver distraction analysis. J. Syst. Archit. 2021, 121, 102319. [Google Scholar] [CrossRef]
- Kashevnik, A.; Shchedrin, R.; Kaiser, C.; Strocker, A. Driver distraction detection methods: A literature review and framework. IEEE Access. 2021, 9, 60063–60076. [Google Scholar] [CrossRef]
- Liu, T.; Yang, Y.; Huang, G.-B.; Lin, Z. Detection of drivers’ distraction using semi-supervised extreme learning machine. In Proceedings of ELM-2014 Volume 2; Springer: Berlin/Heidelberg, Germany, 2015; pp. 379–387. [Google Scholar]
- Jimenez, P.; Bergasa, L.M.; Nuevo, J.; Hemandez, N.; Daza, I.G. Gaze fixation system for the evaluation of driver distractions included by IVIS. IEEE Trans. Intell. Transp. Syst. 2012, 13, 1167–1178. [Google Scholar] [CrossRef]
- Ohn-Bar, E.; Martin, S.; Tawari, A.; Trivedi, M.M. Head, eye, and hand patterns for driver activity recognition. In Proceedings of the 2014 22nd International Conference on Pattern Recognition, Stockholm, Sweden, 24–28 August 2014; pp. 660–665. [Google Scholar]
- Eraqi, H.M.; Abouelnaga, Y.; Saad, M.H.; Moustafa, M.N. Driver distraction identification with an ensemble of convolutional neural networks. J. Adv. Transp. 2019, 2019, 4125865. [Google Scholar] [CrossRef]
- Jegham, I.; Khalifa, A.B.; Alouani, I.; Mahjoub, M.A. A novel public dataset for multimodal multiview and multispectral driver distraction analysis: 3MDAD. Signal Process. Image Commun. 2020, 88, 115960. [Google Scholar] [CrossRef]
- Lethaus, F.; Baumann, M.R.; Koster, F.; Lemmer, K. A comparison of selected simple supervised learning algorithms to predict driver intent based on gaze data. Neurocomputing 2013, 121, 108–130. [Google Scholar] [CrossRef]
- Ersal, T.; Fuller, H.J.; Tsimhoni, O.; Stein, J.L.; Fathy, H.K. Model-based analysis and classification of driver distraction under secondary tasks. IEEE Trans. Intell. Transp. Syst. 2010, 11, 692–701. [Google Scholar] [CrossRef]
- Wollmer, M.; Blaschke, C.; Schindl, T.; Schuller, B.; Farber, B.; Mayer, S.; Trefflich, B. Online driver distraction detection using long short-term memory. IEEE Trans. Intell. Transp. Syst. 2011, 12, 574–582. [Google Scholar] [CrossRef] [Green Version]
- Iranmanesh, S.M.; Mahjoub, H.N.; Kazemi, H.; Fallah, Y.P. An adaptive forward collision warning framework design based on driver distraction. IEEE Trans. Intell. Transp. Syst. 2018, 19, 3925–3934. [Google Scholar] [CrossRef]
- Aksjonov, A.; Nedoma, P.; Vodovozov, V.; Petlenkov, E.; Herrmann, M. A method of driver distraction evaluation using fuzzy logic: Phone usage as a driver’s secondary activity: Case study. In Proceedings of the 2017 XXVI International Conference on Information, Communication and Automation Technologies (ICAT), Sarajevo, Bosnia and Herzegovina, 26–28 October 2017; pp. 1–6. [Google Scholar]
- Aksjonov, A.; Nedoma, P.; Vodovozov, V.; Petlenkov, E.; Herrmann, M. Detection and evaluation of driver distraction using machine learning and fuzzy logic. IEEE Trans. Intell. Trasp. Syst. 2018, 20, 2048–2059. [Google Scholar] [CrossRef]
- Torkkola, K.; Massey, N.; Wood, C. Driver inattention detection through intelligent analysis of readily available sensors. In Proceedings of the 7th International IEEE Conference on Intelligent Transportation Systems (IEEE Cat. No. 04TH8749), Washington, WA, USA, 3–6 October 2004; pp. 326–331. [Google Scholar]
- Hanowski, R.J.; Perez, M.A.; Dingus, T.A. Driver distraction in long-haul truck drivers. Transp. Res. Part F Traffic Psychol. Behav. 2005, 8, 441–458. [Google Scholar] [CrossRef]
- Yee, S.; Nguyen, L.; Green, P.; Oberholtzer, J.; Miller, B. Visual, Auditory, Cognitive, and Psychomotor Demands of real in-Vehicle Tasks; University of Michigan, Ann Arbor, Transportation Research Institute: Ann Arbor, MI, USA, 2007. [Google Scholar]
- Dukic, T.; Ahlstrom, C.; Patten, C.; Kettwich, C.; Kirche, K. Effects of electronic billboards on driver distraction. Traffic Inj. Prev. 2013, 14, 469–476. [Google Scholar] [CrossRef] [PubMed]
- Son, J.; Park, M. The Effects of Distraction Type and Difficulty on Older Drivers’ Performance and Behaviour: Visual vs. Cognitive. Int. J. Automot. Technol. 2021, 22, 97–108. [Google Scholar] [CrossRef]
- Tango, F.; Botta, M. Real-time detection system of driver distraction using machine learning. IEEE Trans. Intell. Transp. Syst. 2013, 14, 894–905. [Google Scholar] [CrossRef] [Green Version]
- Botta, M.; Cancelliere, R.; Ghignone, L.; Tango, F.; Gallinari, P. Real-Time Detection of Driver Distraction: Random Projections for Pseudo-Inversion-Based Neural Training. Knowl. Inf. Syst. 2019, 60, 1549–1564. [Google Scholar] [CrossRef] [Green Version]
- Cabrall, C.D.; Janssen, N.M.; de Winter, J.C. Adaptive automation: Automatically (dis) engaging automation during visually distracted driving. PeerJ Comput. Sci. 2018, 4, e166. [Google Scholar] [CrossRef] [PubMed] [Green Version]
- Morris, A.; Reed, S.; Welsh, R.; Brown, L.; Birrell, S. Distraction effets of navigation and green-driving systems-results from field operational tests (FOTs) in the UK. Eur. Transp. Res. Rev. 2015, 7, 26. [Google Scholar] [CrossRef] [Green Version]
- Kuo, J.; Lenné, M.G.; Mulhall, M.; Sletten, T.; Anderson, C.; Howard, M.; Collins, A. Continuous monitoring of visual distraction and drowsiness in shift-workers during naturalistic driving. Saf. Sci. 2019, 119, 112–116. [Google Scholar] [CrossRef]
- Zhang, K.; Zhang, Z.; Li, Z.; Qiao, Y. Joint Face Detection and Alignment Using Multitask Cascaded Convolutional Networks. IEEE Signal Process. Lett. 2016, 23, 1499–1503. [Google Scholar] [CrossRef] [Green Version]
- Zhang, X.; Sugano, Y.; Fritz, M.; Bulling, A. It’s written all over your face: Full-face apperance-based gase estimation. In Proceedings of the IEEE Conference on Computer Vision and Pattern Reconition Workshops, Honolulu, HI, USA, 21–26 July 2017; pp. 51–60. [Google Scholar]
Figure 1.
Simulated driving experiment environment. The Logitech C920 PRO camera was used to collect the facial information. The Logitech G29 driving kits were used to simulate the driving of the vehicle, and the simulation environment was generated by UC-win/Road software which was shown in a 27-inch curved display.

Figure 2.
Vehicle experiment environment. A GL8 commercial vehicle was used as the experimental platform. The distraction detection system was established with NVIDIA Jetson Xavier NX mobile device and a camera. The fixed position of the camera is shown in (b), and the mobile device was fixed in a specially designed pedestal on the right side of the driver’s seat. (a) Vehicle experiment platform. (b) Internal environment and fixed position of the camera. (c) Driver’s facial image.

Figure 3.
Gaze direction estimation process.

Figure 4.
Visual distraction driving gaze direction in the simulated driving experiment.

Figure 5.
Visual distraction driving gaze direction in the vehicle experiment.

Figure 6.
Classification of driver’s gaze region. The gaze direction regions of normal driving, dashboard, right rearview mirror, and left rearview mirror are represented by the red (1), blue (2), green (3), and gray (4) regions. The K value was set to 9 by experiment with multiple attempts. (a) Classifier results of KNN. (b) Classifier results of RF. (c) Classifier results of SVM.

Figure 7.
The confusion matrix of real vehicle experiment.

Figure 8.
The classification of driver’s visual distracted state. Here the region of driver’s gaze direction data that deviates from the front road is recognized as the visual distraction state. The normal driving state can be represented by the red (1) region and the visual distraction state can be represented by the blue (2) region. (a) Classifier results of KNN. (b) Classifier results of RF. (c) Classifier results of SVM.

Figure 9.
The confusion matrix of real vehicle experiment.

Figure 10.
Gaze direction detection region. (a) Normal driving condition. (b) Looking at the left rearview mirror region. (c) Looking at the right side. (d) Looking at the dashboard region.
Figure 10.
Gaze direction detection region. (a) Normal driving condition. (b) Looking at the left rearview mirror region. (c) Looking at the right side. (d) Looking at the dashboard region.


Table 1.
The classification results.
| Algorithm | Accuracy |
|---|---|
| KNN | 99.76% |
| RF | 99.41% |
| SVM | 99.41% |
Table 2.
The relevant evaluation parameters.
| Precision | Recall | F1-Score | Number of Images | |
|---|---|---|---|---|
| Normal driving | 99.25% | 98.50% | 98.87% | 265 |
| Dashboard | 98.66% | 98.99% | 98.83% | 299 |
| Left mirror | 99.07% | 100% | 99.53% | 108 |
| Right mirror | 100% | 100% | 100% | 181 |
| Average | 99.25% | 99.37% | 99.31% |
Table 3.
The classification results.
| Algorithm | Accuracy |
|---|---|
| KNN | 99.88% |
| RF | 99.65% |
| SVM | 98.83% |
Table 4.
The relevant evaluation parameters.
| Precision | Recall | F1-Score | Number of Images | |
|---|---|---|---|---|
| Normal driving | 99.16% | 99.16% | 99.16% | 237 |
| Visual distraction | 99.68% | 99.68% | 99.68% | 618 |
| Average | 99.42% | 99.42% | 99.42% |
Publisher’s Note: MDPI stays neutral with regard to jurisdictional claims in published maps and institutional affiliations. |
© 2022 by the authors. Licensee MDPI, Basel, Switzerland. This article is an open access article distributed under the terms and conditions of the Creative Commons Attribution (CC BY) license (https://creativecommons.org/licenses/by/4.0/).
Share and Cite
MDPI and ACS Style
Shi, H.; Chen, L.; Wang, X.; Wang, G.; Wang, Q. A Nonintrusive and Real-Time Classification Method for Driver’s Gaze Region Using an RGB Camera. Sustainability 2022, 14, 508. https://0-doi-org.brum.beds.ac.uk/10.3390/su14010508
AMA Style
Shi H, Chen L, Wang X, Wang G, Wang Q. A Nonintrusive and Real-Time Classification Method for Driver’s Gaze Region Using an RGB Camera. Sustainability. 2022; 14(1):508. https://0-doi-org.brum.beds.ac.uk/10.3390/su14010508
Chicago/Turabian StyleShi, Huili, Longfei Chen, Xiaoyuan Wang, Gang Wang, and Quanzheng Wang. 2022. "A Nonintrusive and Real-Time Classification Method for Driver’s Gaze Region Using an RGB Camera" Sustainability 14, no. 1: 508. https://0-doi-org.brum.beds.ac.uk/10.3390/su14010508
Note that from the first issue of 2016, this journal uses article numbers instead of page numbers. See further details here.