
Cost Estimations of Water Pollution for the Adoption of Suitable Water Treatment Technology


1
Graduate School of Engineering, Kochi University of Technology, Tosayamada, Kami City 782-8502, Japan
2
School of Economics and Management, Kochi University of Technology, 2-22 Eikokuji, Kochi City 780-8515, Japan
*
Author to whom correspondence should be addressed.
Sustainability 2022, 14(2), 649; https://0-doi-org.brum.beds.ac.uk/10.3390/su14020649
Submission received: 10 December 2021
/
Revised: 2 January 2022
/
Accepted: 4 January 2022
/
Published: 7 January 2022
(This article belongs to the Special Issue Benefits and Co-benefits of Natural and Built Environment Requalification and Conservation Strategies: Advances in Multidisciplinary Valuation Approaches and Assessment Models)
Abstract
:This study analyzed the cost implications of using suitable technologies and the cost of inaction when addressing water pollution. This was achieved by developing three main models for the costs (model one) and benefits (model two and model three). The first model accounts for the operational costs of adopting suitable technologies, namely the use of diatomaceous earth for textile wastewater treatment. The second model analyzed the cost of inaction through analyzing the cost of treatment for water pollution-related diseases for the affected population. The occurrence and cost of treatment for three diseases, namely diarrhea, amoebiasis and bacterial infection, were used as indicators of water pollution in the area. The third model included the contingent valuation method (CVM) data on the willingness to pay for environmental restoration of the surveyed population. The benefit–cost ratio (BCR) of the resulting data from the three models were used to highlight the economic viability of the proposed project. A BCR of (0.67) for the cost of the proposed project versus the benefits of the project on human health using data from one hospital was obtained. There is a high possibility that the real BCR would increase if more data from other hospitals or other diseases were included. The results imply that the use of D.E can be considered a good candidate for treating wastewater. To thoroughly discuss the BCR of treating wastewater from one factory, the BCR of the proposed restoration project along River Sosiani, and the value of using DE as suitable technology, more studies are needed to evaluate the unaccounted costs and benefits for accurate economic estimations of the proposed project. The outcome of the study is a framework of numbers and figures that can be presented to decision makers and policy makers as critical information when making decisions.
Keywords:
benefits; benefit-cost ratio; costs; suitable technology; willingness to pay; stakeholders1. Introduction
The world currently faces a water quality crisis attributed to increased pollution from urbanization, fast-paced development, industrialization and increased food production. The health impacts of water pollution and declining water quality are of increasing concern, especially for policy makers [1]. Globally, it is estimated that at least one billion people have no access to potable water, and 2.5 billion people lack sufficient sanitation facilities [2]. These inadequate sanitation facilities worldwide have resulted in the occurrence of approximately 4 billion water borne diseases. This is a leading cause of death, especially among children under 5 years of age. In developing countries, the situation is worse [3], with a reported 3.2 million deaths in children each year as a result of poor sanitation and unsafe drinking water. According to previous studies, there has been a link between water pollution and the occurrence of acute waterborne diseases reported. These water borne diseases include typhoid, diarrhea, cholera, hepatitis and dysentery [1,4,5,6]. Other studies have also reported an increased risk of carcinogenic diseases as a result of the negative effects of water pollution [7,8,9]. This is a result of limited access to wastewater treatment facilities, especially in developing countries, and malpractices such as the dumping of human waste products and garbage into water bodies that are treated as open sewers. This calls for proper wastewater management systems in both developed and developing countries to minimize the impacts of water pollution. The impacts of poor wastewater management not only include health impacts but also increased greenhouse gas emissions, degraded ecosystems, reduced industrial and agricultural productivity, bad odors and decreased biodiversity.
One of the major reasons for the lack of adequate wastewater treatment facilities and regulations in developing countries is the limited funds available to support appropriate infrastructure to curb water pollution. This often leads to economic losses resulting from both environmental and human health costs. For example, globally approximately $7.3 million is spent in the health sector to treat waterborne diseases [10]. Additionally, economic losses also result from the citizen’s inability to work because of health related issues resulting from waterborne diseases thus loss of income and productivity in the work environments. The situation in developing countries is also intensified by the lack of standards and industries’ refusal to adhere to established guidelines when discharging their waste in water bodies. In Kenya, for example, the lack of review data and a baseline for the existing guidelines limits the enforcement and implementation of new or existing standards to manage the wastewater treatment. Moreover, the changing environmental conditions have not been factored in over the years, as the guidelines are rarely reviewed. Other issues that have constrained the enforcement of standards in Kenya include: practices such as standard testing or accredited testing centers, a lack of incentives for cleaner production measures and routine monitoring of the situation [11]. Further, the lack of an updated published interim pollution limit that has resulted in a negotiation approach that has been marred by cases of corruption, political interference and low awareness that increased the effects of water resulting economic losses [11].
To reduce the economic losses and costs imposed by water pollution, there is a need for affordable cost-effective solutions to deal with the wastewater menace. This approach requires a reliance on natural resources in developing countries to minimize the cost of treatment for wastewater. The use of local resources reduces the burden of importing wastewater treatment materials, thus cutting down on the cost of water treatments resulting to reduced water pollution and increased motivation to abide with the set standards. Furthermore, a reliance on naturally available materials makes the technologies and materials more readily available to the users, thus promoting the economy of the country while saving time and costs. Therefore, cost effective technologies that promote the use of local resources should be promoted and adopted especially in developing countries.
For these cost effective technologies and similar technologies to be introduced and adopted in a country or region, the project’s feasibility should be analyzed. A project’s viability is important, as it informs the decision about whether a project should be implemented, delayed or canceled. Part of a project feasibility analysis involves cost estimation and analysis. Cost estimations regarding toxic chemical contamination have received relatively limited attention. This is partly because of the complexity of the process, especially in water pollution cases, and the lack of adequate data, such as accurate records of the extent of infections linked to chemical contamination [12]. Other factors that have contributed to the complexity of cost estimations include the unavailability of public information, the severity of the contamination and factors such as water demand for the contaminated bodies. Estimating these costs is a crucial component when assessing the impacts of water pollution; the cost of the proposed projects or technological changes should not exceed the projected benefits of cleaner water [13]. Calculating the costs of water pollution requires hydrological, agronomic, medical and behavioral models [14] to ensure the accuracy and certainty of the numbers; however, such information is currently not available in Kenya.
This forms the premise of the current research, which attempts to analyze the cost of using diatomaceous earth as an adsorbent in textile wastewater treatment and the recurring benefits from pollution control. The cost of the improvement should not outweigh the benefits of cleaner water enabled by the proposed technological changes. The study identifies two types of costs, namely the operational costs of using the proposed technology and the cost of treatment for the diseases caused by water pollution in the region. These can reveal the potential benefits of adopting the proposed technological changes. Following other studies, we use waterborne diseases as a primary indicator of water quality and water pollution impacts and employ adsorption technology using diatomaceous earth (DE) based on the results obtained during experimental work conducted in a laboratory. The experiments utilized diatomaceous earth as an adsorbent using simulated textile wastewater in the removal of methylene blue dye component. The objectives of the study are as follows: (i) to determine the costs and benefits of suitable technologies, specifically the use of DE in textile wastewater treatment industries; (ii) to determine the cost of inaction in relation to the potential benefits of pollution control for human health using the stated preference method, namely the contingent valuation method (CVM); (iii) and to derive the economic feasibility of the project using the benefit-cost ratio (BCR).
2. Literature Review
2.1. Waterborne Diseases
The consumption of microbial contaminated water leads diseases such as paratyphoid, bacterial infections, typhoid and dysentery that are water related [15]. The current study, as in previous studies, took these diseases into account when analyzing the impacts of water pollution. According to Gwimbi (2011) [16], the microorganisms total coliforms (TCs) and Escherichia coli are responsible for making water unsuitable for human consumption and are used as indicators of fecal contamination in water which leads to diarrheal diseases [2]. Other parasites responsible for water related infections include, Cryptosporidium spp. (cryptosporidiosis), Entamoeba spp. (that causes amoebiasis) and helminths [17]. Of these microbes, schistosomiasis has the highest occurrence prevalence, followed by giardiasis and then amoebiasis [17]. Although the occurrence of these diseases is mainly associated with domestic water pollution, other factors such as industrial or agricultural pollution might cause them, which is why they were accounted for in this study. Cancer (liver, skin and pancreas), melanomas, endocrine disorders and other related diseases have been linked to industrial and agricultural pollution resulting from the pesticides that have been found in drinking water. In Kenya, there is no quantitative assessment that exists of the link between health related issues and chemical pollution; thus, the aforementioned diseases were used in the study.
2.2. Low-Cost Adsorbents
In wastewater treatment, the cost of adsorption processes is dependent on the adsorbent material being used. Activated Carbon is the most commonly used adsorbent when treating wastewater. Activated carbon is a form of processed carbon that has a higher surface area due to its low volume pores. The high surface area increases its adsorption capacity and chemical reaction sites. Activated carbon is efficient but expensive, which makes the adsorption process costly as a result. This can be problematic, especially in developing countries, where the cost might be too high due to a reliance on the importation of the material. As a result, there is a need for alternative, efficient options that utilize locally available materials. These materials should have equally efficient adsorption capacity, be economically feasible and be readily available. Multiple studies have assessed the use of natural resources as treatment options for wastewater, especially for developing nations [18,19]; for example, a study by Wagai, Samuel et al. [18] that employed the use of Moringa oleifera seed extracts and aluminum sulfate to purify rainwater to address the issue of water problems in Kenya. They deduced a solution that relied on cheap materials that were accessible for use to purify rainwater and make it safe for consumption.
Diatomaceous earth, also known as diatomite, has shown promising results in the removal of dyes from wastewaters and is a promising alternative to high-cost adsorbents used in wastewater treatment [19,20]. Diatomaceous earth has been recommended as an alternative to the expensive adsorbents such as activated carbon, commonly used in wastewater treatment because is cheaper, naturally occurring and readily available especially in countries where it is mined. Several characteristics of Diatomite make it a suitable alternative especially for use in wastewater treatment as shown in Table 1. The characteristics of Diatomite and its chemical composition are displayed in Table 1 below.
Diatomite mining and processing is a complicated process that requires large processing equipment and facilities. To cut down on the mining and processing costs of the process, open-pit methods or quarrying are used with the processing stages, which involve crushing and drying the mineral at the mining sites to reduce the operational costs of the process. In Kenya, diatomite is mined at Kariandusi near Gilgil and Soysambu on the floor of the Rift Valley, mainly for export purposes. The Africa Diatomite Industries Limited (ADIL), established in 1942, majorly mines the deposits [22]. In Kenya, a kilogram of KensilF (locally branded diatomite) costs approximately $0.2 (dollars) (African Diatomite Industries Company), making it affordable in the country for retail to individuals and industries who use it for many purposes. Its availability, especially in Kenya, its low cost and its chemical and physical characteristics make it a better alternative for use in the treatment of textile wastewater in Kenya. With the vast majority of the mineral being exported, Kenya has the potential to utilize the material for wastewater treatment and cut down costs of using expensive imported adsorbents such as activated carbon.
2.3. Cost Analysis of Suitable Technology
Cost analysis is the most common method used in decision-making and selection processes related to alternative and suitable technologies. In water and wastewater treatment processes, it is the most important criterion for the selection of treatment choices. Cost estimates should not only be performed for the technology in question but also for the effects and the severity of the problem (i.e., contaminants) if left in place. This provides a more persuasive case when lobbying authoritative bodies, the government and companies to adopt new technologies. Cost–benefit analysis (CBA) is commonly used to determine the economic feasibility associated with the implementation of different proposals. CBA operates under the premise that the benefits of a proposed project exceed the aggregated costs. In wastewater treatment, an economically viable proposal means that the benefits arising from the process exceed the costs; thus, the proposal not only promises environmental benefits but also economic benefits.
2.4. Cost Estimation Methods
Several methods can be adopted to evaluate the costs and benefits of wastewater treatment and management projects to provide critical information to decision makers. These methods enable decision makers to evaluate the costs of taking action versus the cost of no action in wastewater management. To estimate the cost of pollution, that is, the costs of water pollution, various methods can be used; these include: (i) the avoidance cost method that refers to the actions taken to reduce damages from exposure to the contaminants through reducing exposure to the contaminants thus averting the cost. This includes methods such as point-of-use treatment systems, use of cleaner water (e.g., bottled water) to substitute for the polluted water and changing behaviors to minimize exposure to the contaminants (e.g., reducing the length or frequency of showers) in the case of a volatile organic chemical present in the water. This can be achieved with a household system or at the organizational level [23]; (ii) The recreational choice method: The recreational site choice includes the indirect benefits of the use of surface waters. For example, this applies to water use through fishing, swimming, boating and sightseeing [23]; (iii) The cost of illness calculation method: This includes calculating the number of workdays lost because of an illness related to the pollutant and the medical expenses to treat the illness. This method is mostly preferred when the contaminants damage the human body. The cost of illness can be measured in numerous ways: (i) the number of workdays lost multiplied by the commensurate wage rate; (ii) the medical costs for treating the illness; and (iii) contingent valuation to estimate reduced health risks. When the diseases are curable and treatable, the first and second methods can be used. Contingent valuation may be used to estimate the value of avoiding life-threatening illnesses such as cancer [12]. The cost of illness approach has been used in air pollution studies; however, a major difficulty with this method is that the contaminants have multiple health effects [24].
3. Methodology
3.1. Study Area
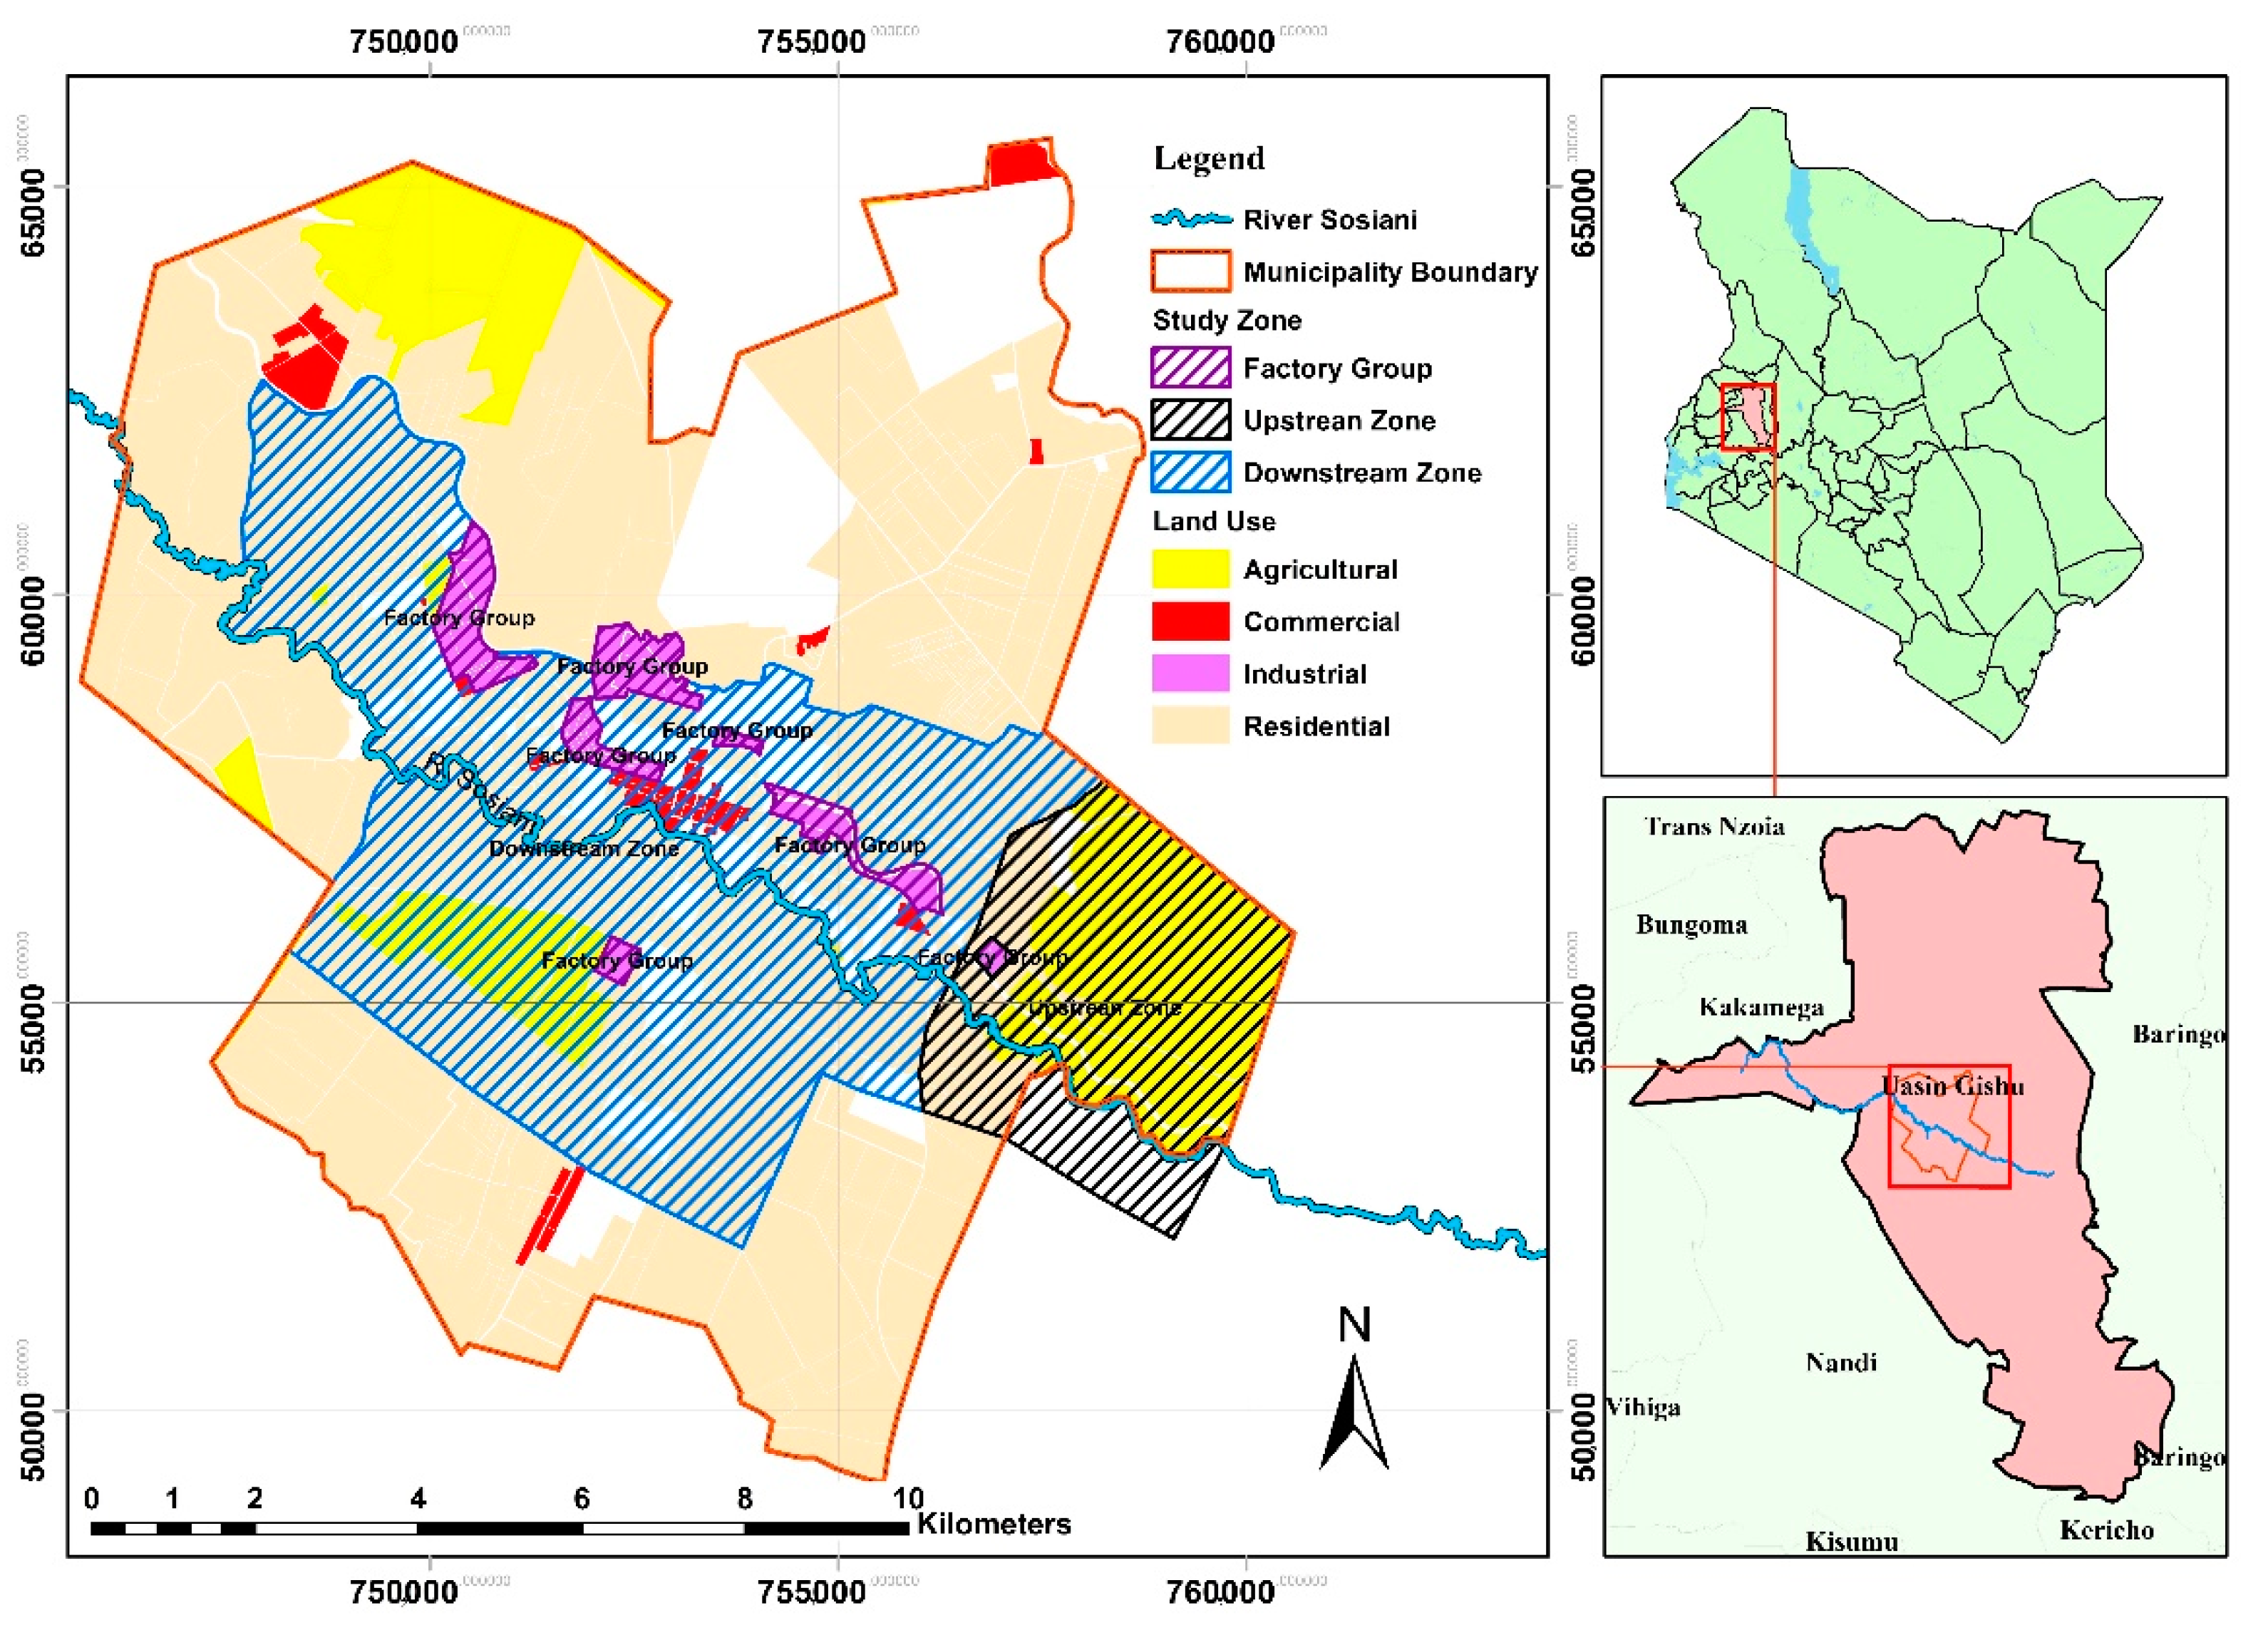
The study was conducted along River Sosiani located along longitude and latitudes, (00°–03′ S and 00°–55′ N; 34°–50′ E and 35°–37′ E) [25]. The river is located in Eldoret town in the Rift Valley region in Kenya and is 67 km long with an approximate area of 647 km2 [26]. Eldoret town is the capital center of Uasin Gishu County and is the fifth largest town in Kenya. It has an estimated population size of 1,163,186 and a population density of 343 (persons/sq.km) and is classified as one of the fastest-growing towns in Kenya [27,28]. There has been an emphasis on the need to conserve River Sosiani for both local and international tourism as the government proposes building the River Sosiani Nature Park to preserve the urban heritage of the region [27]. Unfortunately, the water in River Sosiani has been polluted over the years, which has been attributed to industrial wastewater, agricultural sources and domestic sources. This has resulted in serious issues in the region, such as water borne diseases, a water shortage and a decline in the water quality in the region [29,30]. This has prompted the government of Kenya to initiate environmental restoration activities along the river to improve the water quality of the river and the living conditions of the people in the region.
3.2. Data Collection
The CVM data reported in the study have been published in our previous publication [31]. The data were collected using a questionnaire survey with a pretest survey of 50 respondents completed prior to the actual survey. As reported, the 300 questionnaire surveys were administered randomly to the community in the study area displayed in Figure 1 [31]. The respondents included both residents living close to the river and factory workers in the selected areas (see Figure 1). The residents were divided into two groups based on their location relative to the river, that is, upstream and midstream/downstream. The factory group surveyed was restricted to only factory workers in three selected factories [31]. The questionnaire was developed to solicit the respondents’ willingness to pay and willingness to participate in environmental remediation projects. Additional data on their socio-demographic characteristics were also collected for the study. [31].
3.3. Research Design
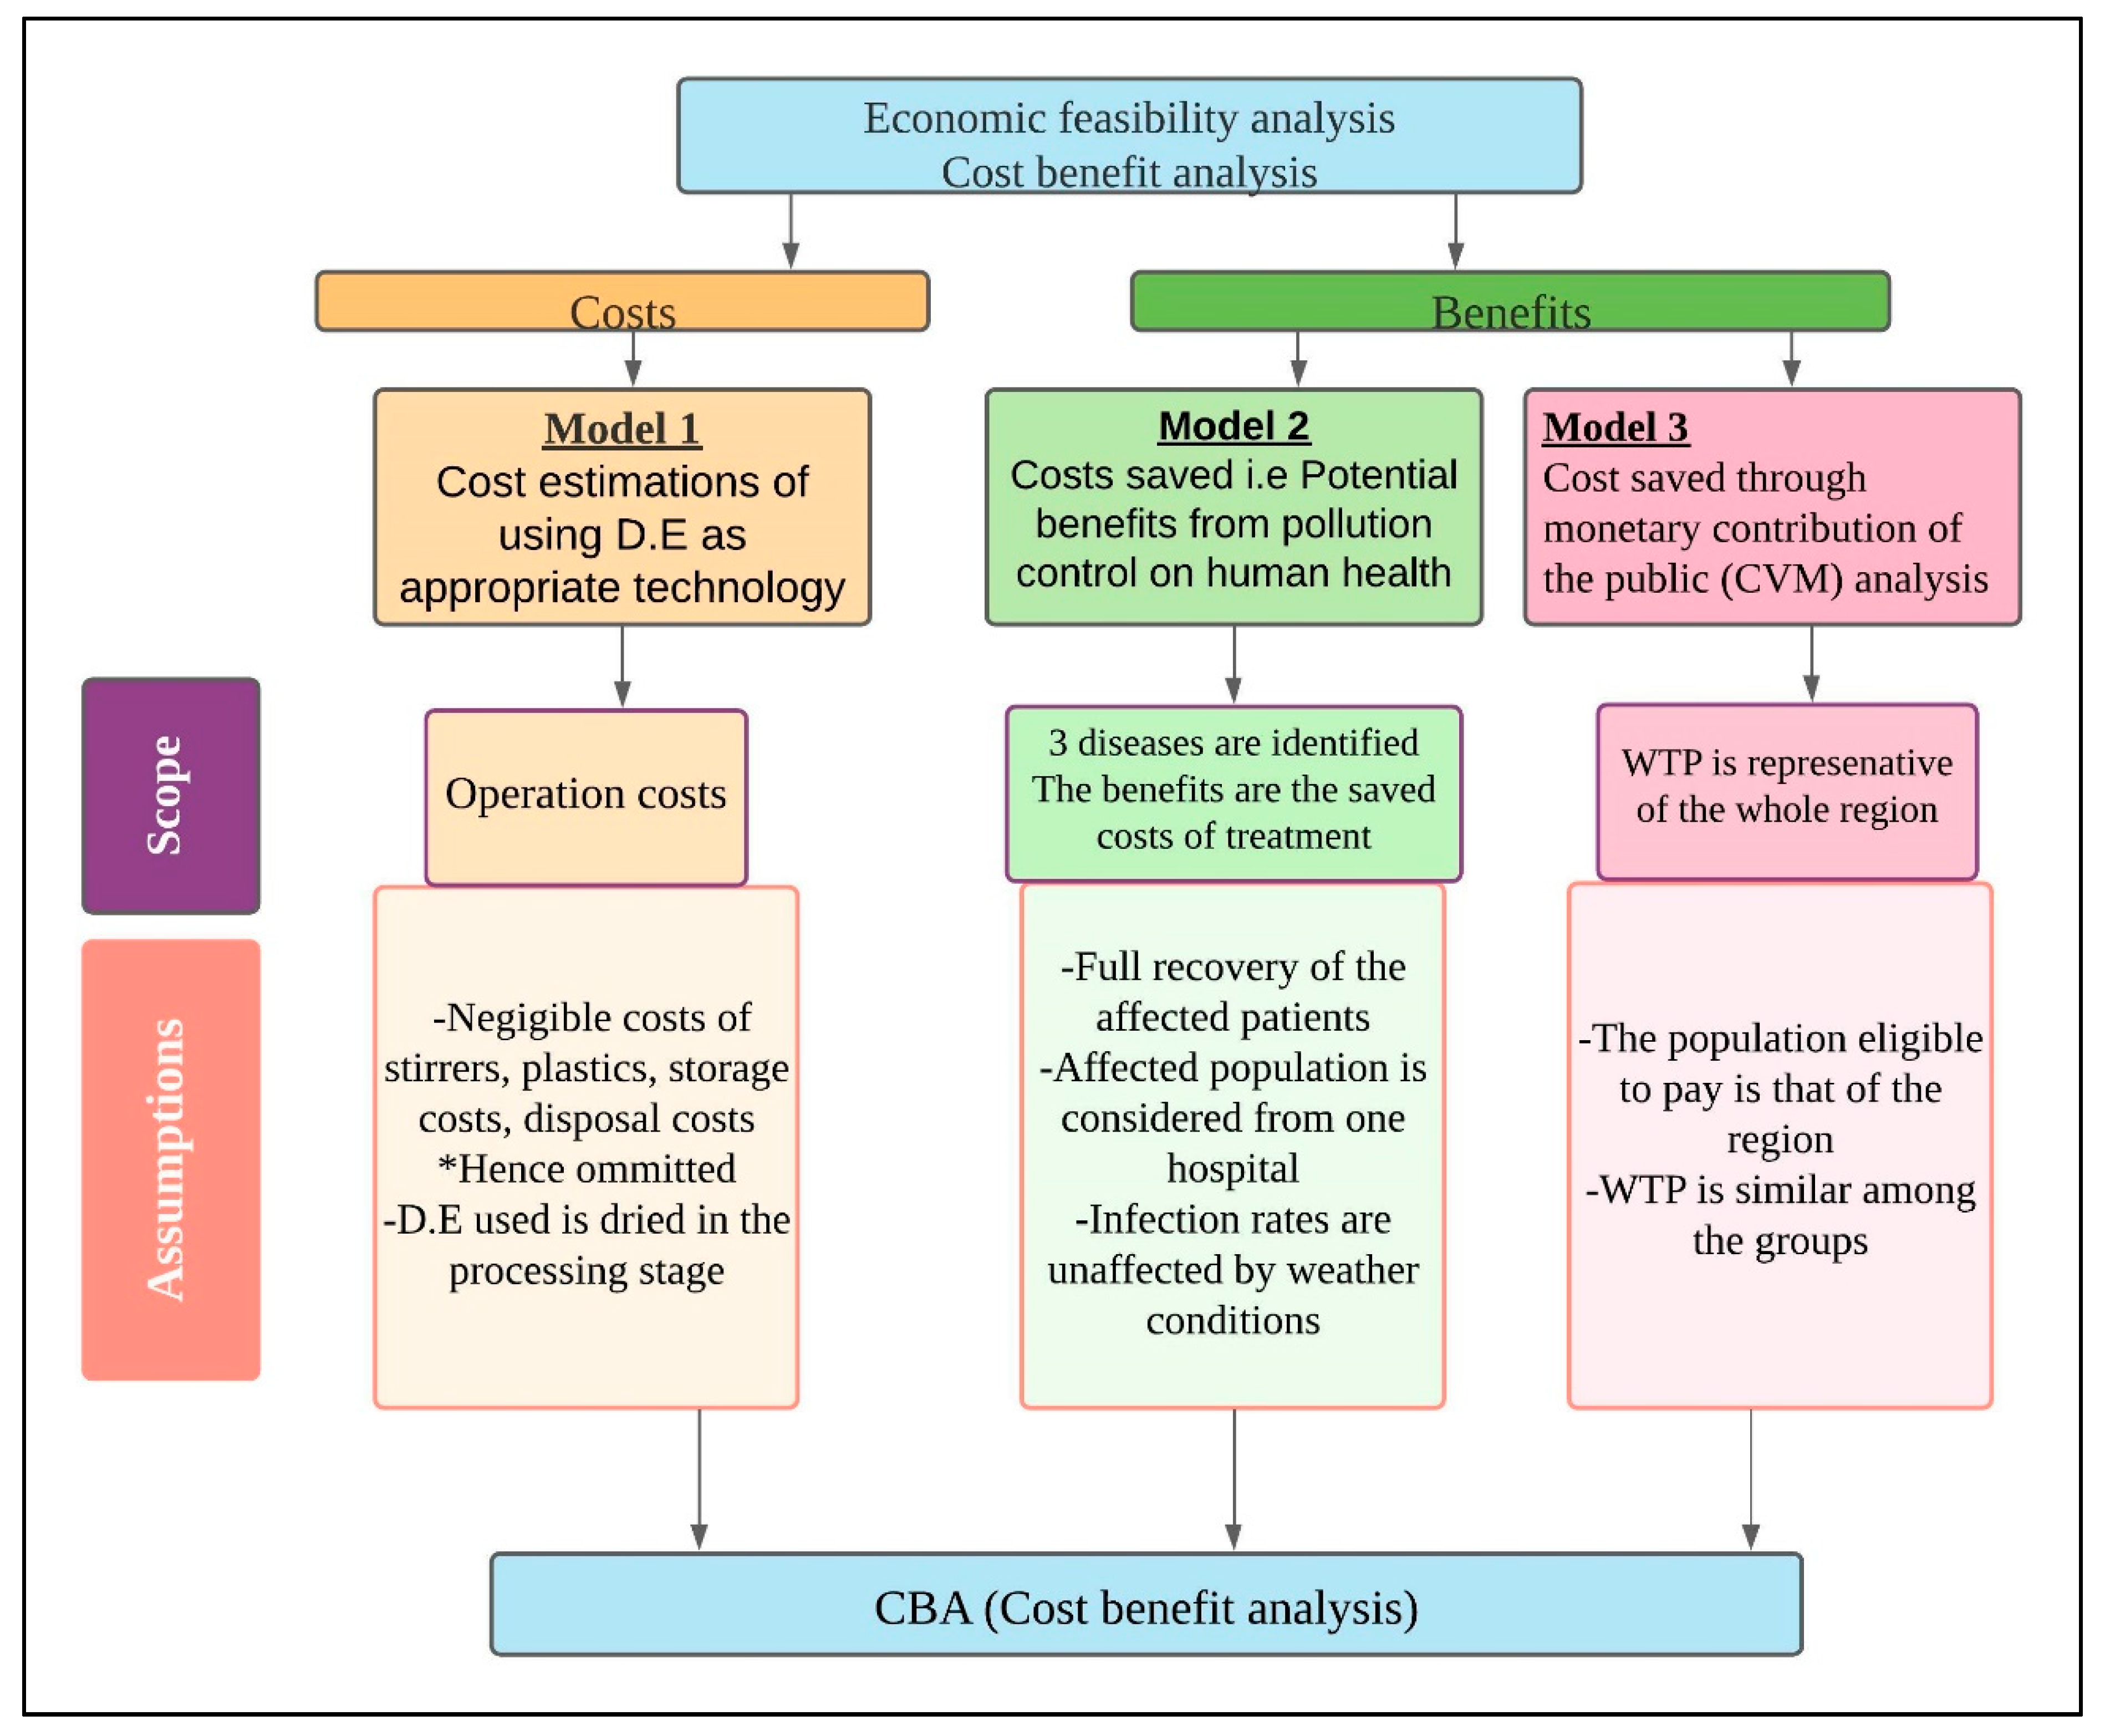
Multiple calculations and analyses were performed to determine the objectives of the paper. Three models were developed for the study. Model 1 analyzed the cost breakdown of using the proposed materials in the wastewater treatment. The proposed method of treatment used in the study was the use of diatomaceous earth as an adsorbent for treating textile wastewater. For this model, data on a cost-effective adsorbent (DE) were outlined based on previous experiments conducted in the laboratory using DE as an adsorbent and simulated textile wastewater using methylene blue dye and polyacrylamide (PAM) as a coagulant in the experiments. The detailed procedures are described in the results section.
Model 2 attempts to calculate the cost of inaction by deriving the potential benefits from pollution control on human health. Here, survey data from the hospitals in the area were collected concerning the occurrence of three diseases that are associated with water pollution in the area, namely amoebiasis, diarrhea and bacterial infection. The number of daily recorded cases of the diseases and their treatment cost estimates were obtained to model the cost-of-treatment calculations.
Model 3 determines the cost of inaction by deriving potential benefits from pollution control through the stated preference method, namely the contingent valuation method (CVM). While there has been controversy surrounding the values obtained in the CVM analyses, the values obtained in this study were representative of the value placed on the resource in question. The contingent valuation question was presented in a fashion aimed at understanding the participants’ valuation of the resource in question. As reported by Mumbi and Watanabe (2021) [31], a hypothetical scenario where the expected activities and the recurring benefits from these activities were enumerated as follows:
Suppose that the County government and central government is considering implementing a program to ensure river Sosiani clean up in order to improve the water quality of the river through a proposed list of activities. The activities proposed include: cleaning the rivers through solid waste removal, removal of structures from the river, planting of trees along the river bank. The program would lead to major ecological benefits in the area such as improved water quality and water clarity in the river leading to improved water quality within the required standard. The river water will also be improved for use and in a much better condition as a result of the activities [31].
To collect data on the willingness to participate, the respondents were asked to state whether they would participate in such a program. A five-point Likert scale ranging from 1 = Very likely to 5 = Unlikely was used to collect the responses. To collect data on the willingness to pay, the respondents were asked, using a dichotomous choice question, to state yes or no to their likelihood to pay an additional fee collectable every month to support the program in the area. Those that answered ‘yes’ were asked to write down the amount they were likely to pay for the program (i.e., willingness to pay). Detailed data collection procedures and the CVM data and analysis results were reported in our previous publication [31]. To determine the sample size of the affected population, estimates were made based on the size of the River Sosiani basin and previous studies [30]. Finally, the results from the three models were combined to map a cost–benefit ratio that can evaluate the economic feasibility of the proposed project.
3.4. Assumptions and Scope of the Study
Calculating the impacts of water pollution requires access to detailed data that may be limited in some cases if there is minimal record-keeping or no data available at all. In such scenarios, making assumptions enables researchers to proceed with the study despite the limited resources available to them. In estimating the costs and benefits, this study has made the following underlying assumptions:
- It has been assumed that the DE purchased is already dried during its processing; thus, no additional drying is required before use. The fixed costs such as the costs of operational materials, such as stirrers, plastics, storage space and disposal costs are regarded as negligible. The study assumes a one-time cost or an already existing cost, for example, the storage space, thus these are not accounted for in the calculations.
- The value placed on one’s life after death cannot be calculated; thus, it has been assumed that the affected population eventually receives treatment and recovers completely.
- The benefits derived are calculated from saving costs that would otherwise be used to treat a sick patient, and the probability that the cause of the disease is water pollution has been assumed to be 0.5.
- The rate of infections from water-related disease is not affected by the weather conditions (i.e., dry and wet period).
Aside from these assumptions, the study was restricted within a certain scope to ensure that easy and accurate calculations could be done.
As illustrated in Figure 2, certain assumptions were made in line with the scope of the study. Outlining the scope of the study limits the assumptions of the research to the elements that are specific to the study. In model 1, the only costs that were accounted for were operational costs related to the technology’s adoption. For model 2, only data from one hospital and three diseases were accounted for. This scope allowed the study to focus on common water-related diseases in the region, as in previous research. The scope of the third model was restricted to the WTP, which was representative of the region of study. This was based on the assumption that the observed WTP from the previous study was representative of the entire region and was similar throughout the groups [31].
4. Results and Discussion
4.1. Partial Cost Analysis
The partial cost analysis model analyzes the costs that would be incurred by adopting the proposed technology in a factory. The initial cost of setting up new technologies is a one-time cost; these costs are mainly incurred due to machinery installation and new constructions or modifications [32]. Some of these costs may be negligible; hence, the term partial cost analysis. The partial costs that would be incurred in this study are calculated based on the assumptions and scope delineated in Section 3. The amount of wastewater discharged by textile industries varies depending on the output, type of output, fashion season, fabric type, and so forth. According to [33], the dyeing and bleaching departments account for the highest percentage of wastewater produced per day at 102,000 and 238,000 liters per day. Given the same trajectory, a hypothetical scenario is evaluated as follows. A sample factory, while in production and processing, will produce 20 tons of textile products while discharging 3000 m3 in wastewater-containing dyes. The amount of dyed wastewater for every metric ton produced is 150 m3 of dyed wastewater.
The amount of adsorbent used was determined by previous experiments [34]. To determine the amount of DE used, simulated textile wastewater was made using methylene blue dye. A stock solution for the dye was made by weighing 100 mg of methylene blue dye and dissolving it in 1000 mL of distilled water. The stock solution was diluted and 50 mg/L of the resulting solution was tested against the adsorbent solution. To create the adsorbent solution, 20 g of DE powder was mixed with 180 mL of water, and 10 mL of the solution was used to decolorize the 50 mL of the dye concentration. The resulting solution was put on a magnetic stirrer for 3 min at a speed of 350 rpm. Thereafter, two drops of PAM were added to aid the coagulation process. The mixture was stirred again at a speed of 150 rpm and allowed to settle for two hours. The samples were then pipetted into the clear tubes and measured for color, turbidity and COD [34].
The main task for this model is to determine what quantity of DE is required to treat 150 m3 of dyed wastewater. The experimental results show that 50 mL of methylene blue was decolorized by 10 mL of the adsorbent solution. The amount of DE would be 1.0 × (150 m3)/50, which is (1.0 g × 15 × 107)/50, which is 33 × 106 g of DE to treat 150 m3 of wastewater. This translates to 3.0 MT for every 150 m3 per day. This is 1095 MT of DE per year for this particular factory. The total costs can be obtained as presented in Table 2. Other than the adsorbent material, coagulants are an important material for the proposed adsorbent to work. Coagulants bind with impurities to form particles of sufficient size and mass for removal by sedimentation or filtration [13]. Depending on the type used, the cost of the coagulants used varies. PAM, which is a flocculant, is used in wastewater treatment as a coagulant. Because of its nature, it is mostly preferred in cases where the wastewater has high turbidity, such as textile wastewater. The amount of PAM used as per the experiments is two drops, which are roughly 0.1 mL. Based on the amount of wastewater in the sample, 300 L would be needed (i.e., 300 kg of PAM).
As observed from Table 2, the total cost incurred when using activated carbon is six times the cost incurred when using DE. Therefore, selecting diatomaceous earth would be a much more economically feasible option, especially for developing countries that have to import the product.
4.2. Calculations of the Potential Benefits from Pollution Control
The most thorough attempt to calculate the cost of inaction was by [35], who attempted to calculate the cost of environmental degradation in India. The aim of their study was not to provide precise figures but to provide gross estimates of the different economic burdens imposed on India by environmental degradation [35]. As mentioned earlier, such studies are limited due to the unavailability of data required to capture all the effects of environmental degradation [14].
To determine the possible benefits that would be incurred if suitable technologies were implemented, the costs that would be averted to treat the diseases that result from water pollution have been calculated and classified as possible benefits. This has been done through modelling the direct impacts of water pollution on human resources through accounting for the additional medical cost of treatment from water pollution related diseases. These costs include the cost of medicine and treatment services, equipment, and wages of doctors [36]. In this study, the only quantified cost was the health burden due to water pollution in the study area, similar to [35].
As proposed by [36], we employed a model that accounts for these costs and made calculations for the estimated treatment costs (ETC) using Equation (1) as follows:
where:
ETC = ∑di = 1NiAYiACiP,
d = the identified set of diseases caused by water pollution;
i = the index for the identified diseases used in the study;
Ni = the number of affected people by the identified disease (These data was obtained from the hospital records);
AYi = the assumed average period of time to treat each identified disease (i) (These records were obtained from the hospital records);
ACi = the average cost of treatment and follow up costs (These records were obtained from the hospital records Ac) for each identified disease (i);
Pi = refers to the probability that the identified disease (i) is due to water pollution.
The accurate number of the affected population can be obtained from hospital records. (Pi) can be estimated as the difference between the affected population in a clean area (Nca) and a polluted area (Npa). Where (Nca) is expressed as a percentage of (Npa): Pi = (Npa − Nca)/Npa). The study defined (Nca) as 0.5 Npa and Pi as 0.5.
The study identified certain diseases that result from water pollution, namely amoebiasis, diarrhea and bacterial infections [14,37]. The omitted health cost in the study was the association with cancer occurrences due to chemical pollution in the water. The public records for these diseases were obtained from one local hospital (Uasin Gishu Hospital) in the area, as shown in Table 3. As is also shown in Table 3, amoebiasis is the most prevalent disease in the region, with the highest number of reported daily cases, while bacterial infections had the least reported cases. The reported cases in Table 3 were used to make cost estimations using Equation (1).
To estimate the cost of treatment, Equation (1) was used. As displayed in Table 4, the treatment cost for the bacterial infection was the highest among the three diseases, while the estimated costs for treating diarrhea were the lowest. This is because, despite the number of bacterial infection cases being lower than for amoebiasis, the treatment costs are different, resulting in variation in the cost of treatment.
4.3. Contingent Valuation Method Analysis
The CVM approach was used to determine the willingness to pay for improved water services in the region. The CVM explores an individual’s preferences for an environmental change for goods that cannot be traded in an economic market [31]. The CVM has been applied in many studies measure the economic value or resources and aid decision makers and governing bodies in policy adjustments and formation [31,38,39,40,41,42]. The results obtained indicated that 79% of the 279 surveyed respondents were willing to pay an average of KSH 182.51 ($1.66) per month and ($19.92) per year for improved water conditions if the government would run a project in the region [31].
The estimation of the affected population is required for an accurate description of the plausible cumulative amount obtainable in the CV analysis. To estimate the affected population required for the calculation, a study similar to [30] used certain locations within the basin area to make estimations that capture the effect of sewage treatment effluent on the River Sosiani. They delineated the study area by dividing the area according to various uses and locations (i.e., forested zone, agricultural zone, urban zones), which were divided into upstream and downstream areas similar to our study [30]. From a basin size of 647 km2, an area of 225 km2 was selected for the study based on these characteristics; similarly, we employed the same basin size in our study. With the population density of 343 (people per sq. km of land area) [28] and a selected basin area of 225 km2, the affected population could be estimated as (343 × 225) = 77,175 (people per sq. km of land area on the River Sosiani basin). However, based on factors such as proximity to the river, differences in water usage and water sources, the affected population could vary. As shown in Table 5 below, the value calculated based on the population at the basin is $1,537,326 per year, a value that can offset the cost of introducing the new technology in the area. This value is indicative of the costs that would be saved in the area through the public’s contribution.
4.4. Cost–Benefit Analysis
The third analysis of the study included the CBA. This is a useful method used to inform decision-making processes for resource allocation. The CBA does not provide all the information necessary to inform the policy processes or the costs and benefits of the entire project. Thus, the cost–benefit ratio (BCR) is used to commonly used as indicator of the relationship between the benefits and costs of a proposed project. The general rule of thumb when using the BCR is that a BCR greater than 1.0 for any project is expected to deliver a positive net present value when implemented, while the reverse would be observed for a lower BCR value. The BCR for a tentative project that incorporates data obtained in Table 2 and Table 4 were developed to analyze the feasibility of the project. While the CBR value is less than one for the three diseases as shown in Table 6, these values combined with the CVM values could be used to indicate the feasibility of the project, as discussed in Section 5.
5. Cost–Benefit Analysis and Its Implications
Overall, the findings of this study hint at valuating natural resources (the CVM analysis) and conducting cost–benefit analyses related to water resources and technological adoptions. This is because such issues will become critically important in Kenya and other developing countries poised for economic growth. The results from such analyses will thus promote better allocation of project funds and resources in the future, especially through project evaluations. Planners, financial aid organizations and governments, such as the government of Kenya, should set aside a given amount of money to invest in a clean water supply and protection of the environment every financial year [43]. If such organizations do not have access to specific data or a breakdown of the costs and intended benefits of a project, they may not fund such projects, or in other cases, corruption and misuse of the funds is highly likely. Thus, with adequate data, proper measures can be implemented to promote the better utilization of these funds. Presenting the results side by side, as displayed in Table 7, provides an opportunity for a clear description of the tentative costs and provision of accurate information for decision-makers and key stakeholders. Table 7 breaks down the plausible benefits and costs of the proposed project and presents the scope explored for these analyses to help derive numerical values that are presentable to economists or financial organizations. The analysis includes two major identifiable benefits which account for the total benefits of undertaking the project (B1 and B2), specifically the total willingness to pay and willingness to participate. The cost analysis, on the other hand, was limited to the scope presented in Figure 1 and, as described in Section 3.3, only to the outlined costs of implementing the project.
As shown in Table 7, the BCR ratio, including the total degree of the willingness to pay for eligible residents (B1) versus the operating costs of the new technology (C1.1), is significant (7). This indicates that, although not all of the costs are accounted for, the benefits of treating wastewater in the region exceed the costs; thus, the project is economically viable. Meanwhile, benefits such as the total willingness to participate (B2) which are unquantifiable would increase the value of the benefits derived from the project, thereby increasing the feasibility of the project.
It is also important to note that (B1.1.1) only accounts for the value of one hospital in the region indicating that if the value were to include other hospitals in the region, the BCR ratio comparing this benefit versus the operating cost of the project (C1.1) would be higher than the present value of 0.67. Highlighting this, the table explores various avenues that can be considered in the future when making decisions about implementing such a project. Therefore, similar studies should be conducted in various regions of the country to draft proposals that would help improve the allocation of resources. In this case, it would be wise for the government to invest in technological changes, which would be a one-time cost that would offset future costs of environmental pollution. As shown in Table 7, side-by-side cost estimations of the total benefits and the costs can help highlight missed opportunities in utilizing local resources to solve local problems in the country; consequently, including the unquantified value in the willingness to pay makes the BCR value of the project feasible.
The CVM analysis results presented in this paper should also not be ignored, although the amount pledged by community members appears to be an insignificant amount. It would help immensely in offsetting the cost of environmental pollution to the community members when combined with other benefits of the project, as shown in Table 8. Furthermore, involving the public through financial contributions and participation in projects would help them take ownership of the projects initiated in the region, thus promoting the longevity of the projects. After all, public participation is a key component of the success of local projects targeting them. Aside from the assumptions presented in Section 3.4, the study was confined within certain parameters to ensure seamless and accurate calculations, as shown in Table 7, and the study is without uncertainties.
The limited scope and omitted analyses are dependent on the variables used in the study and the potential uncertainties presented in the study, as elaborated in Table 8. The table highlights the uncertainties and provides potential errors of analyses conducted in the study. Tabulating the information addresses accountability and possible research gaps that can be explored by future studies.
6. Limitations of the Study and Future Research Implications
This paper has a number of limitations. The selected water pollution effects in the study are restricted due to the data constraints in the region; thus, only three diseases were used in the study. Additionally, as noted in previous literature, the problem with identifying accurate health costs is that individuals compensate for the increased pollution by reducing their exposure to protect themselves and their health, such as by sourcing alternative means of accessing water [44,45,46]. The results of the diseases used do not capture individuals migrating into the area and out of the area, which might cause the impacts recorded to fluctuate, leading to underestimation or overestimation, especially if the population is characterized by constant free migration [44]. In addition, although the study attempts to capture all the resource costs in its calculations, other costs, such as the additional costs of the purification of drinking water and health damages related to other issues not tied to water pollution, are not fully accounted for. This is because the study primarily focuses on water pollution and certain costs and benefits, as shown in Table 7 and Table 8. The study did not include the discount rates calculations as the estimates were only done for one year, thus, we propose that future studies consider a longer time frame.
The study thus recommends that future research explores the unaccounted for costs and benefits for a comprehensive feasibility analysis. As shown in Table 7, the scope of the study was strictly limited, providing room for future studies to explore other costs and benefits not included in this study. For example, other studies could explore other benefits of treating wastewater in the area (B1.1.2) and other environmental benefits (B1.2), as well as account for the complete installation costs (C1.1) that were assumed as negligible in this study due to the design of the proposed technology.
This study also recommends that future studies draft a comprehensive proposal plan that extends beyond the scope used in this paper. The plan should indicate clear costs and benefits, accounting for the implementation of the project, the financial/economic viability of the project and other aspects such as the design, social designs and historical elements. This will provide the necessary information to assist with green accounting and maintaining accurate financial records of environmental projects [36].
7. Conclusions
The economic valuation of wastewater management is important as it guides various stakeholders, such as investors and policymakers, to make informed decisions. The complexity of the process should not deter the valuation process, as critical information is obtainable to justify suitable investments in wastewater management. This study, using a restricted scope, was able to deduce values that are representative of the costs and benefits of the proposed project of using diatomaceous earth for wastewater treatment. These numbers and figures are presentable to accountants, financial organizations and the government for consideration when making decisions. The benefits of the projects using the CVM analysis versus the operational costs of the project were seven times higher. Understanding these figures and numbers could help the government and other authoritative bodies to impose taxes and fees on polluters, thus establishing green accounting while keeping accurate financial statements for interested parties. Additionally, such information would prove useful when making decisions about what projects would be implemented and what technological options are more appropriate. When effective technologies are adopted, the resulting effects are better aquatic environmental conditions, enhanced usage of residents’ incomes through reduced disease, improved use of the citizens’ taxes in other sectors of the economy, enhanced environmental conditions and the promotion of the utilization and exploitation of the local resources of a country.
Author Contributions
Conceptualization, A.W.M. and T.W.; data collection, A.W.M.; data and result analysis, A.W.M. and T.W.; methodology, A.W.M.; supervision, T.W.; writing—original draft, A.W.M.; writing—review and editing, A.W.M. and T.W. All authors have read and agreed to the published version of the manuscript.
Funding
This research received no external funding.
Informed Consent Statement
Informed consent was obtained from all subjects involved in the study.
Data Availability Statement
Not applicable.
Conflicts of Interest
The authors declare no conflict of interest.
References
- Wang, Q.; Yang, Z. Industrial water pollution, water environment treatment, and health risks in China. Environ. Pollut. 2016, 218, 358–365. [Google Scholar] [CrossRef] [PubMed]
- Osiemo, M.M.; Ogendi, G.M.; M’Erimba, C. Microbial Quality of Drinking Water and Prevalence of Water-Related Diseases in Marigat Urban Centre, Kenya. Environ. Health Insights 2019, 13, 1178630219836988. [Google Scholar] [CrossRef] [Green Version]
- WHO. Drinking Water Factsheets; WHO: Geneva, Switzerland, 2017. [Google Scholar]
- Dutta, A.; Hajra, G.; Ramani, S.V. On incidence of diarrhoea among children in India. Econ. Polit Wkly 2016, 51, 121. [Google Scholar]
- Roushdy, R.; Sieverding, M.; Radwan, H. The Impact of Water Supply and Sanitation on Child Health: Evidence from Egypt; New York Population Council: New York, NY, USA, 2012. [Google Scholar]
- Cutler, D.; Miller, G. The role of public health improvements in health advances: The twentieth-century United States. Demography 2005, 42, 1–22. [Google Scholar] [CrossRef]
- Lu, Y.; Song, S.; Wang, R.; Liu, Z.; Meng, J.; Sweetman, A.; Jenkins, A.; Ferrier, R.C.; Li, H.; Luo, W.; et al. Impacts of soil and water pollution on food safety and health risks in China. Environ. Int. 2015, 77, 5–15. [Google Scholar] [CrossRef] [Green Version]
- Ebenstein, A. The Consequences of Industrialization: Evidence from Water Pollution and Digestive Cancers in China. Rev. Econ. Stat. 2012, 94, 186–201. [Google Scholar] [CrossRef] [Green Version]
- Lin, N.-F.; Tang, J.; Ismael, H.S.M. Study on environmental etiology of high incidence areas of liver cancer in China. World J. Gastroenterol. 2000, 6, 572–576. [Google Scholar] [CrossRef] [PubMed]
- Dakkak, A. Water Pollution Worries in Developing World. Available online: https://www.ecomena.org/water-pollution/ (accessed on 29 June 2016).
- Ntambirweki, J. Report. UNEP/UNDP Joint Project on Environmental Law and Institutions in Africa-Environmental Impact Assessment Regulations for Uganda; 1997. Available online: https://stg-wedocs.unep.org/handle/20.500.11822/29138?show=full (accessed on 2 January 2022).
- Easter, K.W.; Konishi, Y. Estimating Economic Health Costs of Not Controlling Toxic Water Pollution. (No. 1004-2016-78483). In Proceedings of the Conference International Association of Agricultural Economists (IAAE), Queensland, Australia, 12–18 August 2006. [Google Scholar]
- Dearmont, D.; McCarl, B.A.; Tolman, D.A. Costs of water treatment due to diminished water quality: A case study in Texas. Water Resour. Res. 1998, 34, 849–853. [Google Scholar] [CrossRef]
- Maria, A. The costs of water pollution in India. In Proceedings of the Conference on Market Development of Water & Waste Technologies through Environmental Economics, Delhi, India, 30–31 October 2003; pp. 30–31. [Google Scholar]
- Vaziri, M.; Tolouei, R. Urban Water Resources Sustainable Development: A Global Comparative Appraisal. Iran. J. Sci. Technol. 2010, 34, 93–106. [Google Scholar]
- Gwimbi, P. The microbial quality of drinking water in Manonyane community: Maseru District (Lesotho). Afr. Health Sci. 2011, 11, 474–480. [Google Scholar]
- Ngowi, H.A. Prevalence and pattern of waterborne parasitic infections in eastern Africa: A systematic scoping review. Food Waterborne Parasitol. 2020, 20, e00089. [Google Scholar] [CrossRef]
- Wagai, S.; Arama, P.; Ogur, J.A.; Otieno, W.A.; Ochieng, O.S. Harvesting Surface Rainwater–Purification Using Moringa Oleifera Seed Extracts and Aluminum Sulfate. J. Agric. Ext. Rural. Dev. 2011, 3, 102–112. [Google Scholar]
- Al-Ghouti, M.; Khraisheh, M.; Allen, S.; Ahmad, M. The removal of dyes from textile wastewater: A study of the physical characteristics and adsorption mechanisms of diatomaceous earth. J. Environ. Manag. 2003, 69, 229–238. [Google Scholar] [CrossRef]
- Gupta, V. Application of low-cost adsorbents for dye removal–a review. J. Environ. Manag. 2009, 90, 2313–2342. [Google Scholar] [CrossRef]
- Crini, G. Non-conventional low-cost adsorbents for dye removal: A review. Bioresour. Technol. 2006, 97, 1061–1085. [Google Scholar] [CrossRef] [PubMed]
- Maghanga, J.K. Electrochemical Treatment of Textile Dye Waste Water by Anodic Oxidation; University of Eldoret: Eldoret, Kenya, 2014. [Google Scholar]
- Abdalla, C.W. Measuring Economic Losses from Ground Water Contamination: An Investigation of Household Avoidance Costs. JAWRA J. Am. Water Resour. Assoc. 1990, 26, 451–463. [Google Scholar] [CrossRef]
- Alberini, A.; Krupnick, A. Cost-of-Illness and Willingness-to-Pay Estimates of the Benefits of Improved Air Quality: Evidence from Taiwan. Land Econ. 2000, 76, 37. [Google Scholar] [CrossRef]
- Achieng, A.O.; Raburu, P.O.; Kipkorir, E.C.; Ngodhe, S.O.; Obiero, K.; Ani-Sabwa, J. Assessment of water quality using multivariate techniques in River Sosiani, Kenya. Environ. Monit. Assess. 2017, 189, 280. [Google Scholar] [CrossRef]
- Barasa, B.N.; Perera, E.D.P. Analysis of land use change impacts on flash flood occurrences in the Sosiani River basin Kenya. Int. J. River Basin Manag. 2018, 16, 179–188. [Google Scholar] [CrossRef]
- Governement, U.G.C. The River Sosiani Nature and Amusement Park. Available online: https://www.uasingishu.go.ke/project/river-sosiani-nature-amusement-park/ (accessed on 2 January 2022).
- The Kenya National Bureau of Statistics (KNBS). 2019 Kenya Population and Housing Census Reports: 2020. Available online: https://www.knbs.or.ke/2019-kenya-population-and-housing-census-reports/ (accessed on 2 January 2022).
- Correspondent, N. Pollution threatens River Sosiani, experts warn. Daily Nation. 2014. Available online: https://www.nation.co.ke/counties/eldoret/Pollution-River-Sosiani/1954186-2330416-10b9t81z/index.html (accessed on 2 January 2022).
- Chibole, O.K. Modeling River Sosiani’s water quality to assess human impact on water resources at the catchment scale. Ecohydrol. Hydrobiol. 2013, 13, 241–245. [Google Scholar] [CrossRef]
- Mumbi, A.W.; Watanabe, T. Willingness to Pay and Participate in Improved Water Quality by Lay People and Factory Workers: A Case Study of River Sosiani, Eldoret Municipality, Kenya. Sustainability 2021, 13, 1934. [Google Scholar] [CrossRef]
- Reddy, V.R.; Kullappa, M.; Rao, D.M. Social cost-benefit analysis of improved water quality in rural areas: An exploratory study in coastal AP. J. Soc. Econ. Dev. 2008, 10, 68. [Google Scholar]
- Weru, P.K. The Chemical Precipitation and Biological Treatment of Cotton Textile Wastes; The University of Nairobi: Nairobi, Kenya, 1978. [Google Scholar]
- Mumbi, A.W. The Decolorization of Textile Wastewater in Kenya by Diatomaceous Earth; Tongji University: Shanghai, China, 2018. [Google Scholar]
- Brandon, C.; Homman, K. The cost of inaction: Valuing the economy-wide cost of environmental degradation in India. Asia Environment Division, World Bank 7. Oct. Memo. 1996. Available online: https://digitallibrary.un.org/record/256047?ln=en (accessed on 2 January 2022).
- Al Barghouthi, S.; Marie, A. Estimation of the cost of the direct damage on human resources caused by water pollution. Electron. J. Appl. Stat. Anal. 2016, 9, 502–519. [Google Scholar]
- Yongguan, C.; Seip, H.M.; Vennemo, H. The environmental cost of water pollution in Chongqing, China. Environ. Dev. Econ. 2001, 6, 313–333. [Google Scholar] [CrossRef]
- Cooper, P.; Poe, G.L.; Bateman, I.J. The structure of motivation for contingent values: A case study of lake water quality improvement. Ecol. Econ. 2004, 50, 69–82. [Google Scholar] [CrossRef]
- Li, S.; Zhang, Y.; Zhang, Y.; Zhang, L.; Wang, L. Willingness to pay for the urban river ecosystem restoration in Hangzhou and Nanjing, China. World Rev. Sci. Technol. Sustain. Dev. 2014, 11, 14–25. [Google Scholar] [CrossRef]
- Loomis, J.; Kent, P.; Strange, L.; Fausch, K.; Covich, A. Measuring the total economic value of restoring ecosystem services in an impaired river basin: Results from a contingent valuation survey. Ecol. Econ. 2000, 33, 103–117. [Google Scholar] [CrossRef]
- Shang, Z.; Che, Y.; Yang, K.; Jiang, Y. Assessing Local Communities’ Willingness to Pay for River Network Protection: A Contingent Valuation Study of Shanghai, China. Int. J. Environ. Res. Public Health 2012, 9, 3866–3882. [Google Scholar] [CrossRef] [Green Version]
- Zhongmin, X.; Guodong, C.; Zhiqiang, Z.; Zhiyong, S.; Loomis, J. Applying contingent valuation in China to measure the total economic value of restoring ecosystem services in Ejina region. Ecol. Econ. 2003, 44, 345–358. [Google Scholar] [CrossRef]
- Planning, T.N.T.A. Budget statement. In Stimulating the Economy to Safeguard Livelihoods, Jobs, Businesses and Industrial Recovery; The National Treasury: Kampala, Uganda, 2020. [Google Scholar]
- Arceo-Gomez, E.O.; Hanna, R.; Oliva, P. Does the Effect of Pollution on Infant Mortality Differ Between Developing and Developed Countries? Evidence from Mexico City. Econ. J. 2016, 126, 257–280. [Google Scholar] [CrossRef]
- Moretti, E.; Neidell, M. Pollution, health, and avoidance behavior evidence from the ports of Los Angeles. J. Hum. Resour. 2011, 46, 154–175. [Google Scholar] [CrossRef] [Green Version]
- Zhang, J.; Mauzerall, D.; Zhu, T.; Liang, S.; Ezzati, M.; Remais, J.V. Environmental health in China: Progress towards clean air and safe water. Lancet 2010, 375, 1110–1119. [Google Scholar] [CrossRef] [Green Version]
Figure 1.
Study area of the present study.

Figure 2.
Scope and assumptions of the study.


Table 1.
Characteristics and composition of diatomaceous earth.
| Method of Wastewater Treatment: Adsorption | ||
|---|---|---|
| Category | Characteristics | Properties |
| Physical properties of Diatomite, | Color Form | White, Solid, |
| Chemical composition | Composition pH | Contains the siliceous remains of diatoms that are responsible for the high composition of SiO2, the composition may range from 58% to 90% [19,21]. 9.0–10.0 |
| Permeability | High permeability and surface area increases its adsorption and filtration [19,20]. | |
| Porosity | High porosity increases its adsorption capacity (80–85%) [20] | |
| Density | Low (1.95 to 2.3 g/cm3) [19,21]. | |
| Thermal conductivity | Low [21]. | |
Table 2.
Cost breakdown of the materials used in the treatment process.
| Material | Unit Cost | Amount | Net Price |
|---|---|---|---|
| Raw D.E | $200 per MT | 1095 MT | $219,000 |
| PAM | $2 per Kg | 300 Kg | $600 |
| Total cost | $219,600 |
Cost of D.E: https://www.exportersindia.com/nova-industries-limited/diatomaceous-earth-powder-2979495.html (accessed on 2 January 2022).
Table 3.
Public data records from Uasin Gishu hospital of the annual number of cases for the three diseases understudy.
Table 3.
Public data records from Uasin Gishu hospital of the annual number of cases for the three diseases understudy.
| Number of Cases | Yearly |
|---|---|
| Disease Type | |
| Amoebiasis | 2555 |
| Diarrhea | 1825 |
| Bacterial infection | 1460 |
Table 4.
Sample calculations using available data.
| Diarrhea | Amoebiasis | Bacterial Infection | ||
|---|---|---|---|---|
| N | Annual number of cases | 2555 | 1825 | 1460 |
| AY | Average period of time | 5 | 10 | 7 |
| AC | Average Cost of treatment $ | 8 | 5 | 10 |
| P | Probability that the cause is water pollution | 0.5 | 0.5 | 0.5 |
| ETC | Estimated treatment cost $ | 51,100 | 45,625 | 51,100 |
Notes: Number of affected individuals = the population size of basin area. Average costs and periods are estimates. Number of diseases in a clean area = half the number of diseases in a polluted area.
Table 5.
Willingness to pay amount of the affected population.
| Basin Population | Yearly | Annual Amount (USD) | |
|---|---|---|---|
| WTP | |||
| CVM estimations of the affected population | 77,175 | 19.92 | 1,537,326 |
Table 6.
Cost benefit analysis of using DE.
| Treatment Cost | Diarrhea | Amoebiasis | Bacterial Infection | Total |
|---|---|---|---|---|
| Cost of new technology | 219,600 | 219,600 | 219,600 | 219,600 |
| Benefits (Amount saved from treating the diseases) | 51,100 | 45,625 | 51,100 | 147,825 |
| Cost benefit ratio | 0.23:1 | 0.21:1 | 0.23:1 | 0.67:1 |
Notes: Cost in USD, significant value, ratio > 1.
Table 7.
Benefits vs. costs of environmental purification.
| Scope of this Study and Description | Amount (US$/Year) | Data Source | |||||
|---|---|---|---|---|---|---|---|
| B | Total Benefits (B) | ||||||
| B1 | Total amount of willingness to pay for all eligible residents | Calculated | 1,537,326 | Mumbi and Watanabe, 2021 | |||
| B1.1 | Benefits of improving the health of residents by purifying the environment | ||||||
| B1.1.1 | Benefits of improving the health of downstream residents by treating factory wastewater | Calculated | 147,825 | Data from one local hospital | |||
| B1.1.2 | Other benefits of improving the health of residents by purifying water | Not accounted for | |||||
| B1.2 | Other benefits of environmental purification | Not included | |||||
| B2 | Total willingness to participate | Unquantified in monetary terms | Mumbi and Watanabe, 2021 | ||||
| C | Total costs (C) | ||||||
| C1 | Textile factory wastewater treatment cost | ||||||
| C1.1 | Operating costs | Calculated | 219,600 | Mumbi, 2018 | |||
| C1.2 | Installation cost | Assumed as negligible | |||||
| C2 | Other environmental purification measure costs | Assumed as negligible | |||||
Notes: Benefit Cost Ratios: B1/C1.1 = 7.00, B1.1.1/C1.1 = 0.67 significant value, ratio > 1.
Table 8.
Tabulation of the uncertainties in the study.
| Category | Variables | Uncertainty | Description |
|---|---|---|---|
| Wastewater treatment | Exact volume of water | Relationship between textile production and wastewater volume | Hypothetical scenario based on previous literature was used for this study [33] |
| Benefit | Affected population | Number of people affected | The basin area of River Sosiani was used as the baseline |
| Estimation | Number of cases in an affected area | Number of cases (daily fluctuation) | Hospital data was used; however, it does not capture the patients who do not pay a visit to the hospitals. Only records from one hospital were used |
| Probability | Probability of disease occurrence due to treatment | Calculations require data on number of cases in a clean area which was estimated based on a hypothetical probability | |
| Probability that the diseases are fully caused by water pollution | |||
| WTP | Total WTP | Distribution of WTP among affected people | The population in the whole region is assumed as willing to pay in the CVM analyses |
| Treatment cost | Number of cases | Minimum value estimated | Records from one hospital used |
Publisher’s Note: MDPI stays neutral with regard to jurisdictional claims in published maps and institutional affiliations. |
© 2022 by the authors. Licensee MDPI, Basel, Switzerland. This article is an open access article distributed under the terms and conditions of the Creative Commons Attribution (CC BY) license (https://creativecommons.org/licenses/by/4.0/).
Share and Cite
MDPI and ACS Style
Mumbi, A.W.; Watanabe, T. Cost Estimations of Water Pollution for the Adoption of Suitable Water Treatment Technology. Sustainability 2022, 14, 649. https://0-doi-org.brum.beds.ac.uk/10.3390/su14020649
AMA Style
Mumbi AW, Watanabe T. Cost Estimations of Water Pollution for the Adoption of Suitable Water Treatment Technology. Sustainability. 2022; 14(2):649. https://0-doi-org.brum.beds.ac.uk/10.3390/su14020649
Chicago/Turabian StyleMumbi, Anne Wambui, and Tsunemi Watanabe. 2022. "Cost Estimations of Water Pollution for the Adoption of Suitable Water Treatment Technology" Sustainability 14, no. 2: 649. https://0-doi-org.brum.beds.ac.uk/10.3390/su14020649
Note that from the first issue of 2016, this journal uses article numbers instead of page numbers. See further details here.