Article

The Improvement of the Regional Regulatory Governance System for Radiation Risk Management: Spatial Analysis on Radiation Hazards in South Korea

1
Korea Institute of Nuclear Safety, Daejeon 34142, Korea
2
School of Public Policy & Leadership, University of Nevada, Las Vegas, NV 89154, USA
3
Department of Public Administration, Chungnam National University, Daejeon 34134, Korea
*
Author to whom correspondence should be addressed.
Sustainability 2022, 14(2), 966; https://0-doi-org.brum.beds.ac.uk/10.3390/su14020966
Submission received: 17 December 2021 / Revised: 10 January 2022 / Accepted: 13 January 2022 / Published: 15 January 2022

Abstract

:
Since the 2011 Fukushima nuclear power plant accident, nuclear regulators have strengthened safety standards or decided to decommission the nuclear power plant. The vast majority of radiation is from nuclear power plants, so safety measures are also concentrated in nuclear power plants. Radioactive materials located much closer to the people are scattered around the nation. However, it is difficult for citizens to predict the radiation risk around them because regulatory agencies do not provide adequate information on radiation. The main goal of this study is to analyze the spatial distribution patterns of radioactive materials that serve as indicators for potential risk from a radiological hazard. The empirical findings in this study demonstrate the presence of spatial autocorrelation for the number of radiation licenses among 244 regions in the Republic of Korea. The policy implications are three-fold: (1) it is necessary to improve regulatory governance in consideration of permitted use; (2) the regional offices of regulatory agency can be established based on the identified spatial distribution of permitted use; (3) it is required to improve the information-disclosure system for materials. This study provides an opportunity to create a safer society by understanding the radiation around the public in general.

1. Introduction

After the Chernobyl nuclear power plant explosion in the former Soviet Union in 1986, there were no major accidents at nuclear power plants around the world. Consequently, the perception that nuclear power plants were safe even among experts was widespread. However, the 2011 Fukushima nuclear power plant accident triggered a global re-evaluation of nuclear power and radiation hazards. The International Atomic Energy Agency (IAEA, hereafter), as well as nuclear regulators, have heightened the standards for nuclear safety. Additionally, many countries have reformulated their policy to decommission nuclear power plants. In the case of South Korea (Korea, hereafter), the ‘Nuclear Safety Act’ was enacted in October 2011 by choosing to switch to a management system that can strengthen safety, and the Nuclear Safety and Security Commission (NSSC, hereafter) under the direct control of the President was launched. As such, for the safety management of nuclear power plants, each country is preparing multiple safety devices to prevent nuclear accidents or to prepare for radiation leakage in the event of an accident. The regulatory system maintains a cooperative system between the central and local governments, including regulatory agencies. In the regulatory agency, safety supervision is usually performed by resident experts through on-site offices. In addition, many people are starting to pay more attention to radiation from nuclear power plants as well as the hazardous impacts of radiation on human health. It becomes more important for safety agencies to fully disclose the relevant information through effective communication with citizens. For this reason, in the United States, the Nuclear Regulatory Commission (NRC, hereafter) discloses all information about nuclear energy and radioactive materials in accordance with the ‘Freedom of Information Act’. Korea’s NSSC also discloses information held and managed by public institutions in accordance with the ‘Official Information Disclosure Act’. However, these safety regulations and new acts for information disclosure tend to focus on nuclear power plants because the radiation risk from nuclear power plants is much greater than that of radioactive materials [1]. While radiological hazards of nuclear power plants can be predicted due to their spatial concentration in certain areas, radioisotopes utilizations are scattered among sub-national regions (regions hereafter) around the nation, and it is difficult to identify their locations, making it difficult for citizens to predict radiological hazards. Nevertheless, regulatory agencies did not properly provide detailed information about radiation safety compared to information on nuclear power plants.
The IAEA stated that regulators should set safety standards and ensure that emergency management systems are established and maintained properly. The radiation hazards associated with its use are not well known [2]. The release of radioactive contamination may be inhaled and/or ingested as well as a result in the accidental external radiation exposure to penetrating radiation [3]. In fact, as of December 2020, there have been 21 radiation accidents reported in Korea over the past 5 years and 455 special cases in the process of radiation safety management for workers in the radioactive utilization facilities over the past 5 years (see Table 1) [4]. In recent years, accidents and exposures in radioisotopes utilizations still continue.
In Korea, radiation risks are widespread among regions across the country, but radiation information, safety rules, and emergency response of regions are managed and implemented by a central government agency, NSSC. On the other hand, in the United States, NRC’s role is mainly granting the ownership of by-product materials and licenses for the possession and use of by-products contained in certain items [5]. However, NRC’s safety management is carried out separately in partnership with the state governments that signed the agreement. In nuclear governance, the necessity of a governance system in which all stakeholders participate in government-centered unilateral decision-making was analyzed [6]. People may perceive radiation-related risks differently depending on their interests and acceptable safety levels. Additionally, the size and the potential risk from radiation hazards vary by region. However, regulatory policies are decided and implemented by the central government in a top–down approach. This can be one of the problems with the centralized governance structure, where the decision-making process of policymakers or practitioners in safety management regulation for safety regulation policies can lead to regulatory failure. A multi-layered structure is needed to effectively secure the safety of nuclear power plants. For this, the active participation of scientists, government agencies, nuclear power plant companies, civic groups, local residents, and even local governments is important [7].
The elected officials of local governments are very interested in the safety and living environment of their local residents. Therefore, local governments want to actively participate in radiation safety management practice and policy development. Can a central regulatory agency effectively collaborate with local governments to manage the safety of radioactive materials? Ultimately, by changing the top–down decision-making process of the central agencies, a new governance system in nuclear safety regulation should be sought. This study aims to analyze the effectiveness of current nuclear safety regulations in Korea and suggest alternative ways to enhance the public’s awareness of safety about radiation risks. The main research question of this study is how radioactive material licenses and permitted use are geographically distributed in Korea. More importantly, if distinctive geographic distribution patterns exist among the regions of Korea, is it necessary to change the current regulatory system to meet the local needs? The analytical results from spatial analyses on radioactive material licenses in this study will be utilized as base evidence for regulatory system reforms.
The geographic distribution of radioactive isotopes in Korea has rarely been studied, and the data are rarely available for public use. Understanding the spatial distribution of radioactive isotopes use in Korea is the first step to analyzing the potential risk among the regions in Korea. This study utilizes spatial information that can identify local and regional disparities [8]. For the sustainable and resilient management of radioactive risk, the first step would be to develop a comprehensive database system about the spatial distribution of radioactive materials. Based on the developed spatial analyses in this study, the utilization of collected information/analytical results at the spatially disaggregated level can enhance the effective management of radioactive risk through the collaborative policy development between the central regulatory agency and local stakeholders.
In terms of re-evaluating social values or the role of the public, this study analyzes the need to adjust the current regulatory governance in the direction of cooperation with local governments rather than monopolizing regulatory safety management activities by the central government’s regulatory bodies. This study’s main goal is to suggest viable paths to improve the current regulatory governance system so that the improved system can better maintain public safety from radioactive hazards across the country, enhance the perceived safety level of residents, and ultimately increase the public’s acceptance of radioactive material use in Korea.

2. Literature Review

The interest in research on nuclear safety policy has mainly focused on analyzing policy’s role in the rapid growth of nuclear science and technology. Unlike the global trend in which the nuclear power industry is declining due to major accidents such as the Three Mile nuclear accident and the Chernobyl nuclear accident, the government’s support for nuclear energy is being strengthened in Korea’s nuclear policy [9].
Existing literature on the nuclear safety regulatory system has mainly focused on strengthening the independence of the nuclear safety regulatory agency. Regulatory independence is sometimes classified as legal independence and de facto independence [10]. Additionally, it is noteworthy that independent regulators have become socially valuable organizations to implement regulatory governance and that such a phenomenon has spread throughout the country. This concept of regulatory independence has been expanded more recently [11]. These are the clear independence of the regulatory agency through the amendment of the law and the independence of the judiciary from intervening with the regulator. In the nuclear sector, the independence of regulators is even more important [12]. The reason for this is that at the time of the Fukushima nuclear accident, Japanese regulators did not make independent decisions on nuclear safety and showed a pattern of regulatory capture. [13]. The regulatory agency is dominated by nuclear power operators, which leads to regulatory capture, which can lead to regulatory failure [14]. Operators also defined regulatory capture as inducing regulators to hide safety information from the public. Many studies on the independent activities of nuclear safety regulatory agencies suggest that it is necessary to separate the ministries that are responsible for nuclear power generation and those that regulate safety within the government [15]. The need for an independent decision-making system of the regulatory body was suggested, as well as a stakeholder participation system [16]. There are plenty of studies in nuclear energy safety regulations in Korea. Among others, there are the following: a study on the independence of nuclear safety regulations [17], a study on the ideal nuclear safety administrative system in terms of public administration [18], and a study examining the process of the separation of nuclear power promotion and safety [19]. As a more direct policy study, there were studies that suggested enhancing the independence of nuclear safety regulations, strengthening the supervision power of the National Assembly, diversifying the manpower of nuclear safety regulatory agencies, and securing expertise to improve the nuclear safety regulation system [20].
Among the studies on nuclear safety regulation, there were many studies on nuclear governance. The need to form governance through formal communication channels with regulators, nuclear operators, and local governments was proposed [21]. In nuclear governance, the necessity of a governance system in which all stakeholders participate in a government-centered unilateral decision-making system was suggested [6]. It was proposed to enact a law to ensure the expansion of local governments’ nuclear safety organizations and the participation of local experts in the Nuclear Safety and Security Committee [7].
What follows is a study of the acceptability of nuclear hazards. Among the factors influencing the confirmed nuclear power acceptance, the effect of the reliability of the regulatory body on the nuclear power acceptance was analyzed as the most important [22]. The necessity of an approach from technical and psychological aspects such as safety culture for securing nuclear safety was presented [23]. A two-way process is required for public communication about nuclear risks and nuclear accidents [24]. In particular, when communicating risk, regulators need to know how to listen to the public, not just one-way disclosure. Nuclear safety information management is important to verify and evaluate compliance with regulatory requirements for safety in nuclear power plants [25].
Among the studies, studies on the safety culture of nuclear safety managers and nuclear operators were included to analyze the causes of continuous accidents in nuclear and radiation facilities. The term ‘safety culture’ was first mentioned in the OECD investigation report on the Chernobyl nuclear accident in 1986 [26]. In 1991, IAEA defined safety culture as ‘a set of characteristics and attitudes of organizations and individuals that allow nuclear power plant safety issues to receive legitimate attention according to their importance’ [27]. In the case of the Fukushima nuclear accident, the implicit social culture in Japan inappropriately affected the safety culture and weakened the safety of nuclear power plants [28]. A positive safety culture contributes to radiation safety and the protection of human life [29].
There are many technical studies to ensure human safety with radiation generated from nuclear power or radioactive materials. Nearly 90% of radiation-exposure cases in the United States are due to the use of medical radiation [30]. There is also the possibility that uncontrolled exposure to radiation will occur during radiation accidents and that such exposures may go undetected. According to the effects of long-term exposure to low-dose radiation on the human body, relevant information should be used to prepare NRC safety standards [31].
Maintaining a balance between the potential risk of radiation and the use of radiation is an important factor in establishing a radiation safety policy [32]. In particular, ALARA (a reasonably low, achievable level) can be achieved through the leadership of management and active participation of employees [33].
The IAEA stated that operators should fulfill their organizational and technical responsibilities for on-site safety in preparation for a radiological emergency, and regulatory authorities should set safety standards and establish an emergency management system in advance [2]. NRC emphasized the importance of information on radiation exposure for establishing an accurate radiation policy [2,34]. Through this, NRC tried to compare the radiation exposure to workers and the potential public risk and to establish necessary policy alternatives [35]. In order to effectively achieve radiation safety, it is important that many countries share international standards and technologies [36].
The purpose of spatial analysis is to support policy with spatially segmented information [8]. Despite the spatially granular level of data, most policies are being formulated on a spatially integrated scale. Explicit spatial analysis of social indicators can reveal ‘interesting patterns’. Therefore, emphasizing regional characteristics through spatial analysis is helpful in policymaking. In particular, spatial distribution offers insight into spatial heterogeneity and spatial trends [37]. There are many studies of spatial analysis on topics related to social science, such as the gender wage gap and COVID-19 [38,39]. However, spatial analysis of science and technology for regional safety policies such as nuclear power and radioactive materials seems insufficient.
Previous studies on nuclear policy, the nuclear safety regulatory system, acceptance of nuclear risks, disclosure of nuclear safety information, and safety culture were mainly focused on nuclear power plants. Additionally, in the research on radiation technology and radiation policy, there is a very limited number of research on effective safety management policies, information on what radioactive materials are used in each country, and how the facilities are distributed around people. The geographic distribution of radioactive isotopes in Korea has rarely been studied, and the data are rarely available for public use.

3. Overview of the Radiation Safety Regulation System

Radiation is the emission or transmission of energy in the form of waves or particles through space or through a material medium. A radioactive material is a material that has the ability to emit radiation [40]. A radioactive isotope (RI) is an unstable element that spontaneously decays or decays to emit radiation. RI and radioactive material are used interchangeably. There are about 5000 natural and artificial radioactive isotopes on our planet. Radioactive materials are used for various purposes such as academic, research, medical, military, and industrial purposes [41]. In order to protect the health of people from the hazardous radiation from radioactive materials, many countries are conducting safety management at nuclear safety regulatory agencies or local governments.
In the case of Korea, the NSSC is a centralized safety regulatory agency, and the KINS under the NSSC is the agency that performs technical reviews and inspection of radiation safety (see Figure 1) [42]. In the case of the United States, the NRC is a regulatory agency, and regulations on radioactive materials are implemented in cooperation with local governments and other sub-national institutions. The radiation safety regulation system in Korea is as follows. A person who intends to produce, sell, use, or transfer radioactive materials should obtain permission from the NSSC. According to NSSC’s entrustment of work, KINS conducts safety reviews and inspections, and NSSC handles permission and license issuances. Therefore, in this study, suggested policy implications for governance reforms are mainly applicable to KINS in enforcing practical safety regulations.
The NRC has authority and responsibility for the safety regulation of nuclear power plants and radioactive materials [44]. The NRC is responsible for protecting people and the environment from unnecessary exposure to radiation as a result of civilian uses of nuclear materials. The thirty-nine states in the US have agreements with the NRC to share responsibility for public health, safety, and environmental protection of radioactive materials [5]. Therefore, regulations on radiation safety are operated in a variety of forms, such as being directly implemented by the regulatory agency, NRC, or in collaboration with the regulatory agency, NRC, and state and local governments.
The Korean regulatory system for radioactive materials differs from the system of the United States. Furthermore, in the case of the UK, the central government carries out comprehensive regulatory works, and the local governments regulate RI registration and license radioactive materials [45]. In France, the regulatory agency is in charge of all regulatory work, with some powers entrusted to local governments [46]. Conversely, in Canada, the central government has regulatory authority, and site safety is managed through the central government’s on-site regulatory offices [47]. As shown in these cases, the regulatory activities for radioactive materials are rarely carried out solely by regulatory bodies but more commonly by collaboration between regulatory bodies and local governments.

4. Method and Data

This study employs spatial data analysis for identifying the geographic distribution patterns of the Radioactive Material License (both in number and in permitted use amount) among the regions in Korea. For the analyses, two main variables are used to test the two main hypotheses: (1) the number of Radioactive Material Licenses is randomly distributed among the regions in Korea, and (2) the permitted use amount of radioactive materials is randomly distributed among the regions in Korea. The first law of geography by Waldo Tobler [48], ‘everything is related to everything else, but near things are more related than distant things’, is the base for the spatial autocorrelation (a distinctive spatial distribution pattern) of a phenomenon. The use of radioactive materials in Korea is believed to be concentrated in regions where industrial clusters, R&D clusters, and population clusters are found. The concentrated use in cluster forms can be linked to a potential risk to the residents of the identified regions with the neighboring effects.

4.1. Sources and Characterization of the Variables

To analyze how radioactive material uses and the associated potential risk from radiation hazards are geographically distributed, spatial analysis is utilized with the analytical tool, GeoDa software (for more information about GeoDa, visit http://geodacenter.github.io/, accessed on 29 November 2021). The main variables include the location of local RI user facilities, number of licenses by regions, and permitted use amount of radioactive materials by regions in Korea. The main data source is ‘the radiation safety information system’ of KINS. The data were extracted as of 10 May 2021. The total number of radioactive material licenses used in the analysis was 11,656 licenses across Korea. It included 1221 mobile-use sites. The total permitted amount of radioactive material use in Korea is 307,115,022,619 MBq (Megabecquerel). The main use types of radioactive materials are classified into the following five categories: public use, educational and research use, military use, industrial use, and medical use.
There is a total of 250 local governments in Korea, which is the spatial unit of observation for the analysis. This includes Si (equivalent to a city in the US), Gun (equivalent to a county in the US but located outside city jurisdictions), and Gu (a district that is a part of metropolitan cities in Korea). Among the 250 regions, six island regions (Ongjin-gun, Sinan-gun, Jeju-si, Seogwipo-si, Wando-gun, and Ulleung-gun) were excluded from the analysis in this study. These island regions are isolated from the mainland of the Korean peninsula, and it is hard to build a plausible neighborhood structure with a weight matrix for spatial analysis due to the isolated location of island regions. Therefore, a set of spatial analyses is conducted based on radiation information in the 244 regions in Korea. Again, the main data for analysis include the number of licenses and the permitted amount of radioactive materials use in Korea. Depending on the use types, the number of licenses and the permitted amount of radioactive materials use are summarized as shown in Table 2. The total number of licenses among the 244 regions is 11,533, while the total amount of permitted use is 306,273 TBq as of May 2021. The amount of permitted use is the best available indicator for the potential risk from radiation hazards. Accordingly, the main analysis of this study focuses on the permitted use amount among the 244 regions of Korea, and the key policy implications will be drawn from the spatial analysis on the permitted use amount variable.

4.2. Exploratory Spatial Data Analysis

This study utilizes exploratory spatial data analysis (ESDA) to analyze the geographic distribution of radioactive material use in Korea. Through ESDA, spatial distribution patterns can be formally tested and explained, for the presence of spatial autocorrelation at a global level (across Korea) and for the presence of spatial regions such as spatial clusters (High–High or Low–Low) and spatial outliers (High–Low or Low–High) at the local level (at each local region of Korea). It is explained that the ‘Global spatial autocorrelation is determined by testing a null hypothesis of spatial randomness [8]’. Rejection of the null hypothesis indicates a systematic spatial distribution pattern, indicating the presence of spatial autocorrelation. Global spatial autocorrelation can be determined by testing the null hypothesis of spatial randomness with Moran’s I test statistic. The rejection of the null hypothesis means that the alternative hypothesis of spatial autocorrelation is true and should be accepted. When spatial autocorrelation is formally detected, the variable in interest exhibits distinctive spatial distribution patterns in space. Positive spatial autocorrelation (with a positive and significant Moran’s I statistic) at the global level shows a relative dominance of spatial clusters, whereas negative spatial autocorrelation (with a negative and significant Moran’s I statistic) at the global level reveals a relative dominance of spatial outliers [8].
A global spatial autocorrelation test with Moran’s I does not identify where the distinctive spatial regions (either clusters or outliers) exist. Therefore, it is necessary to check the location and significance of clusters and outliers at the local level. A method called LISA (Local Indicators of Spatial Association) is developed to detect the locations of each type of spatial pattern among the study regions. A LISA map shows the locations with clusters (H–H or L–L) and outliers (H–L or L–H). LISA tests the presence of spatial clusters and spatial outliers by comparing location similarity between two regions, i and j (defined by a spatial weight matrix, Wij), and value similarity between an observed value in location i and that in location j (defined by Cij = Zi × Zj). This study employs a distance-based spatial weight matrix, four-nearest neighbors, which classifies the four nearest regions of a subject region as neighbors and the rest as non-neighbors.

5. Results

In this section, the empirical estimation results from spatial analyses are explained. Additionally, the policy implications drawn from the identified spatial patterns of potential risk from the local use of radioactive materials are shared. The first part explains the findings and their implications with the number of licenses variable, while the second part explains the findings and their implications with the permitted amount of use variable.

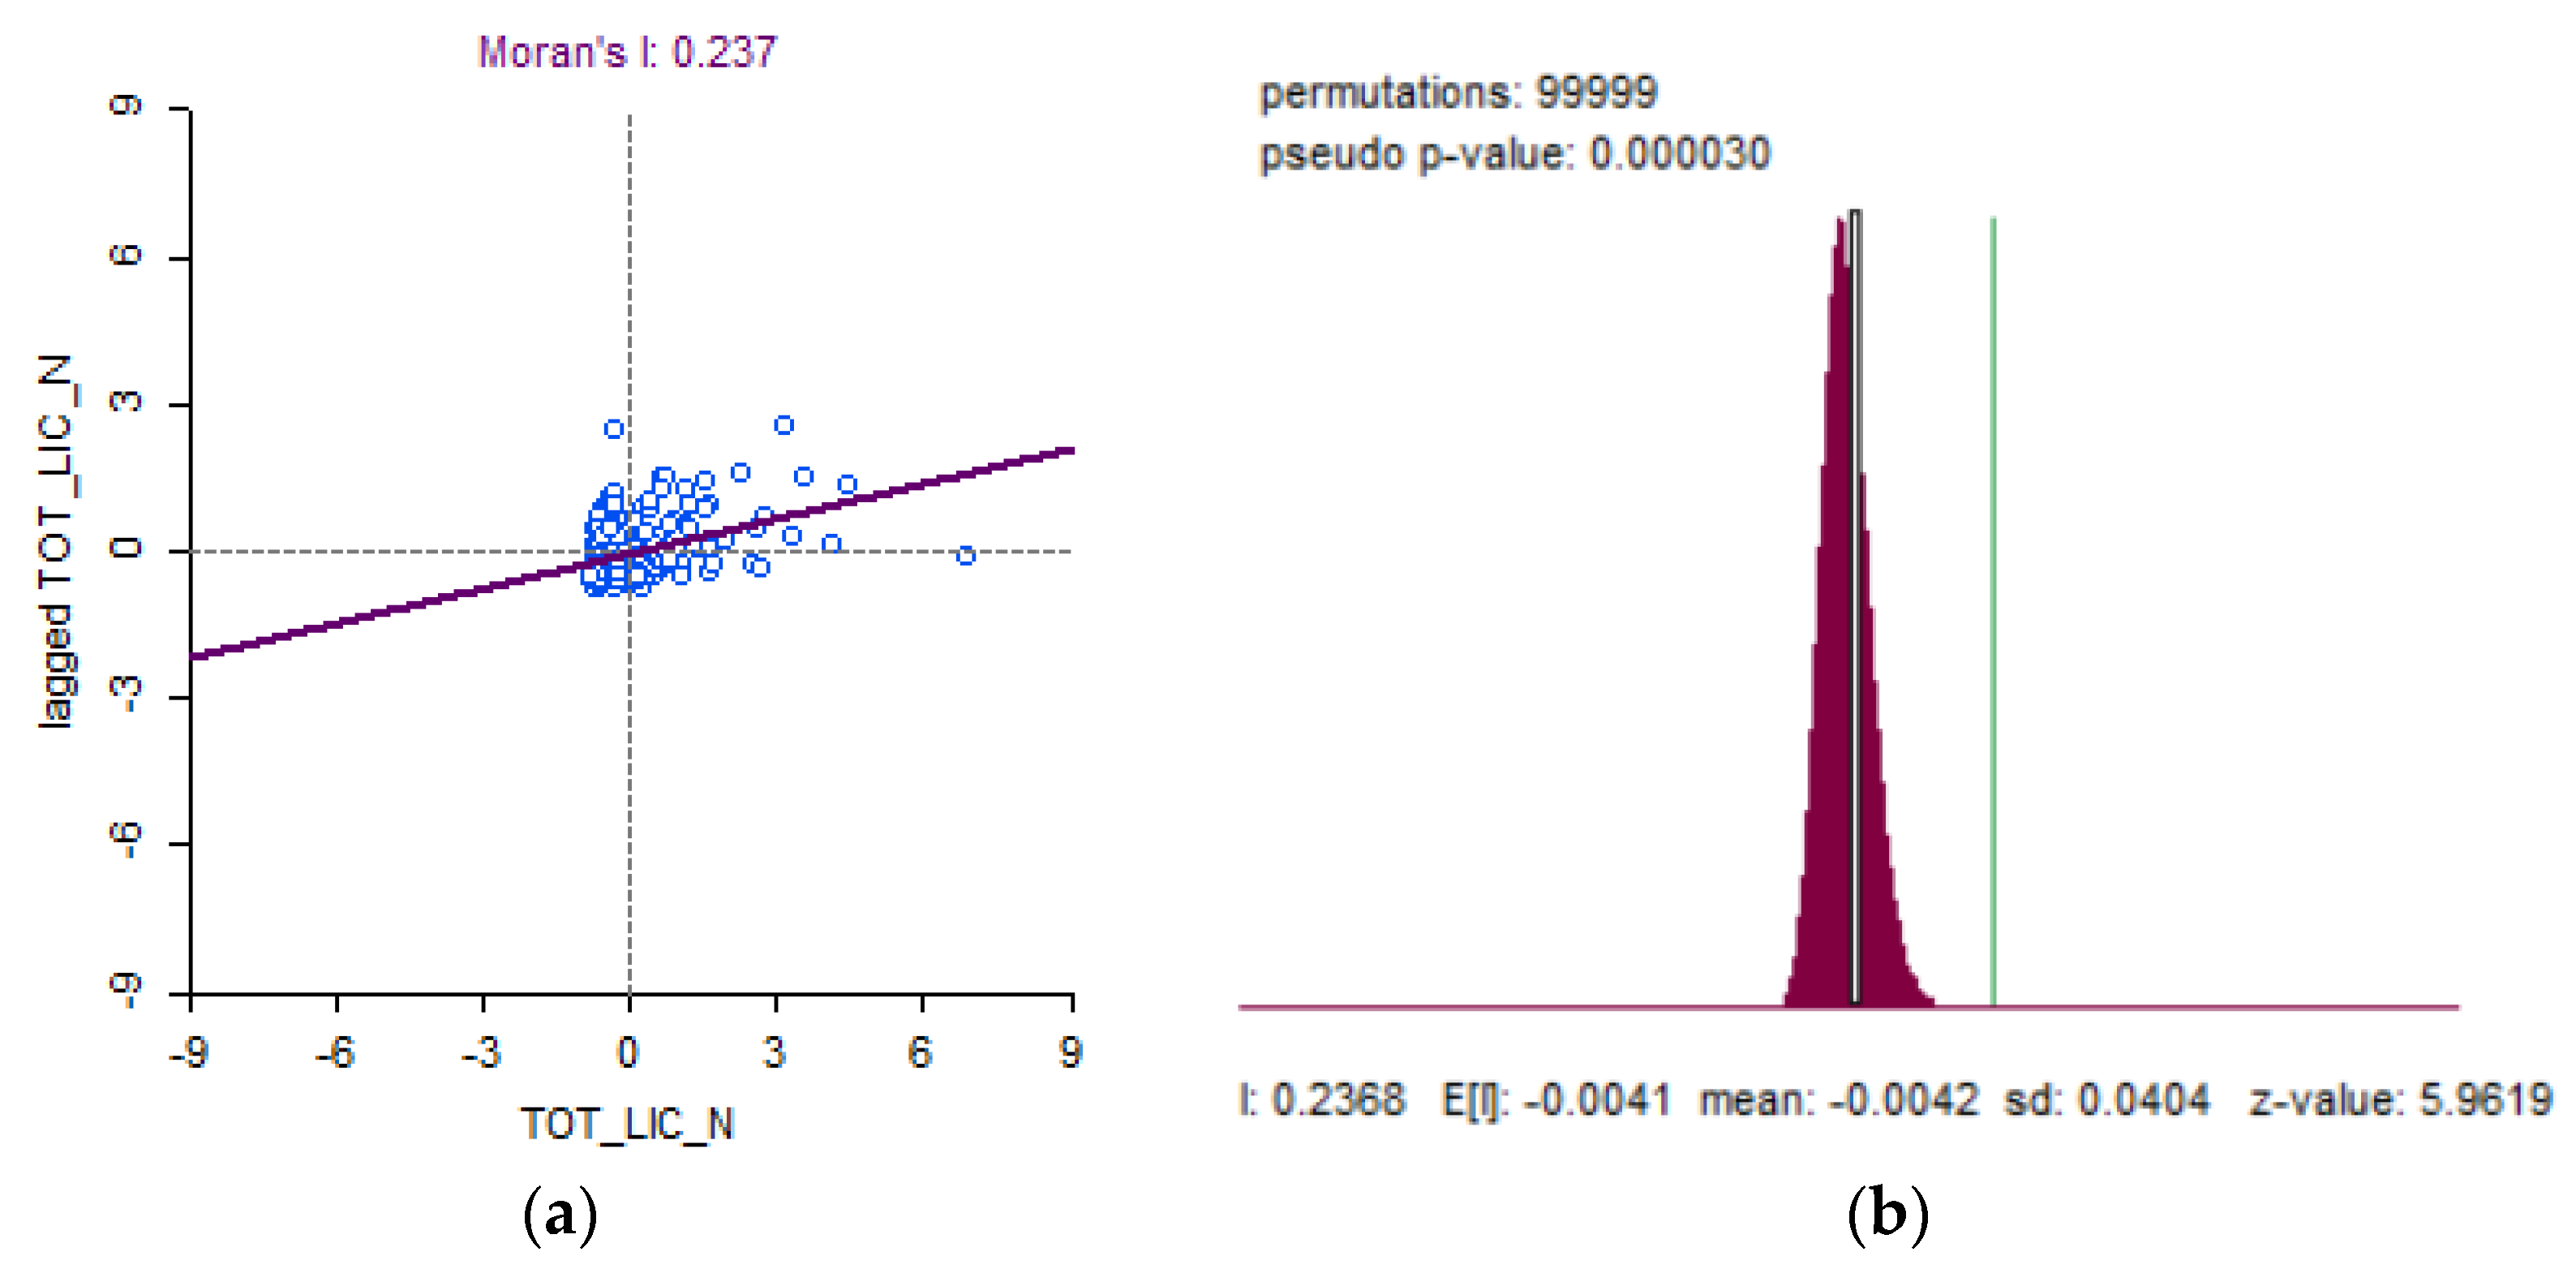
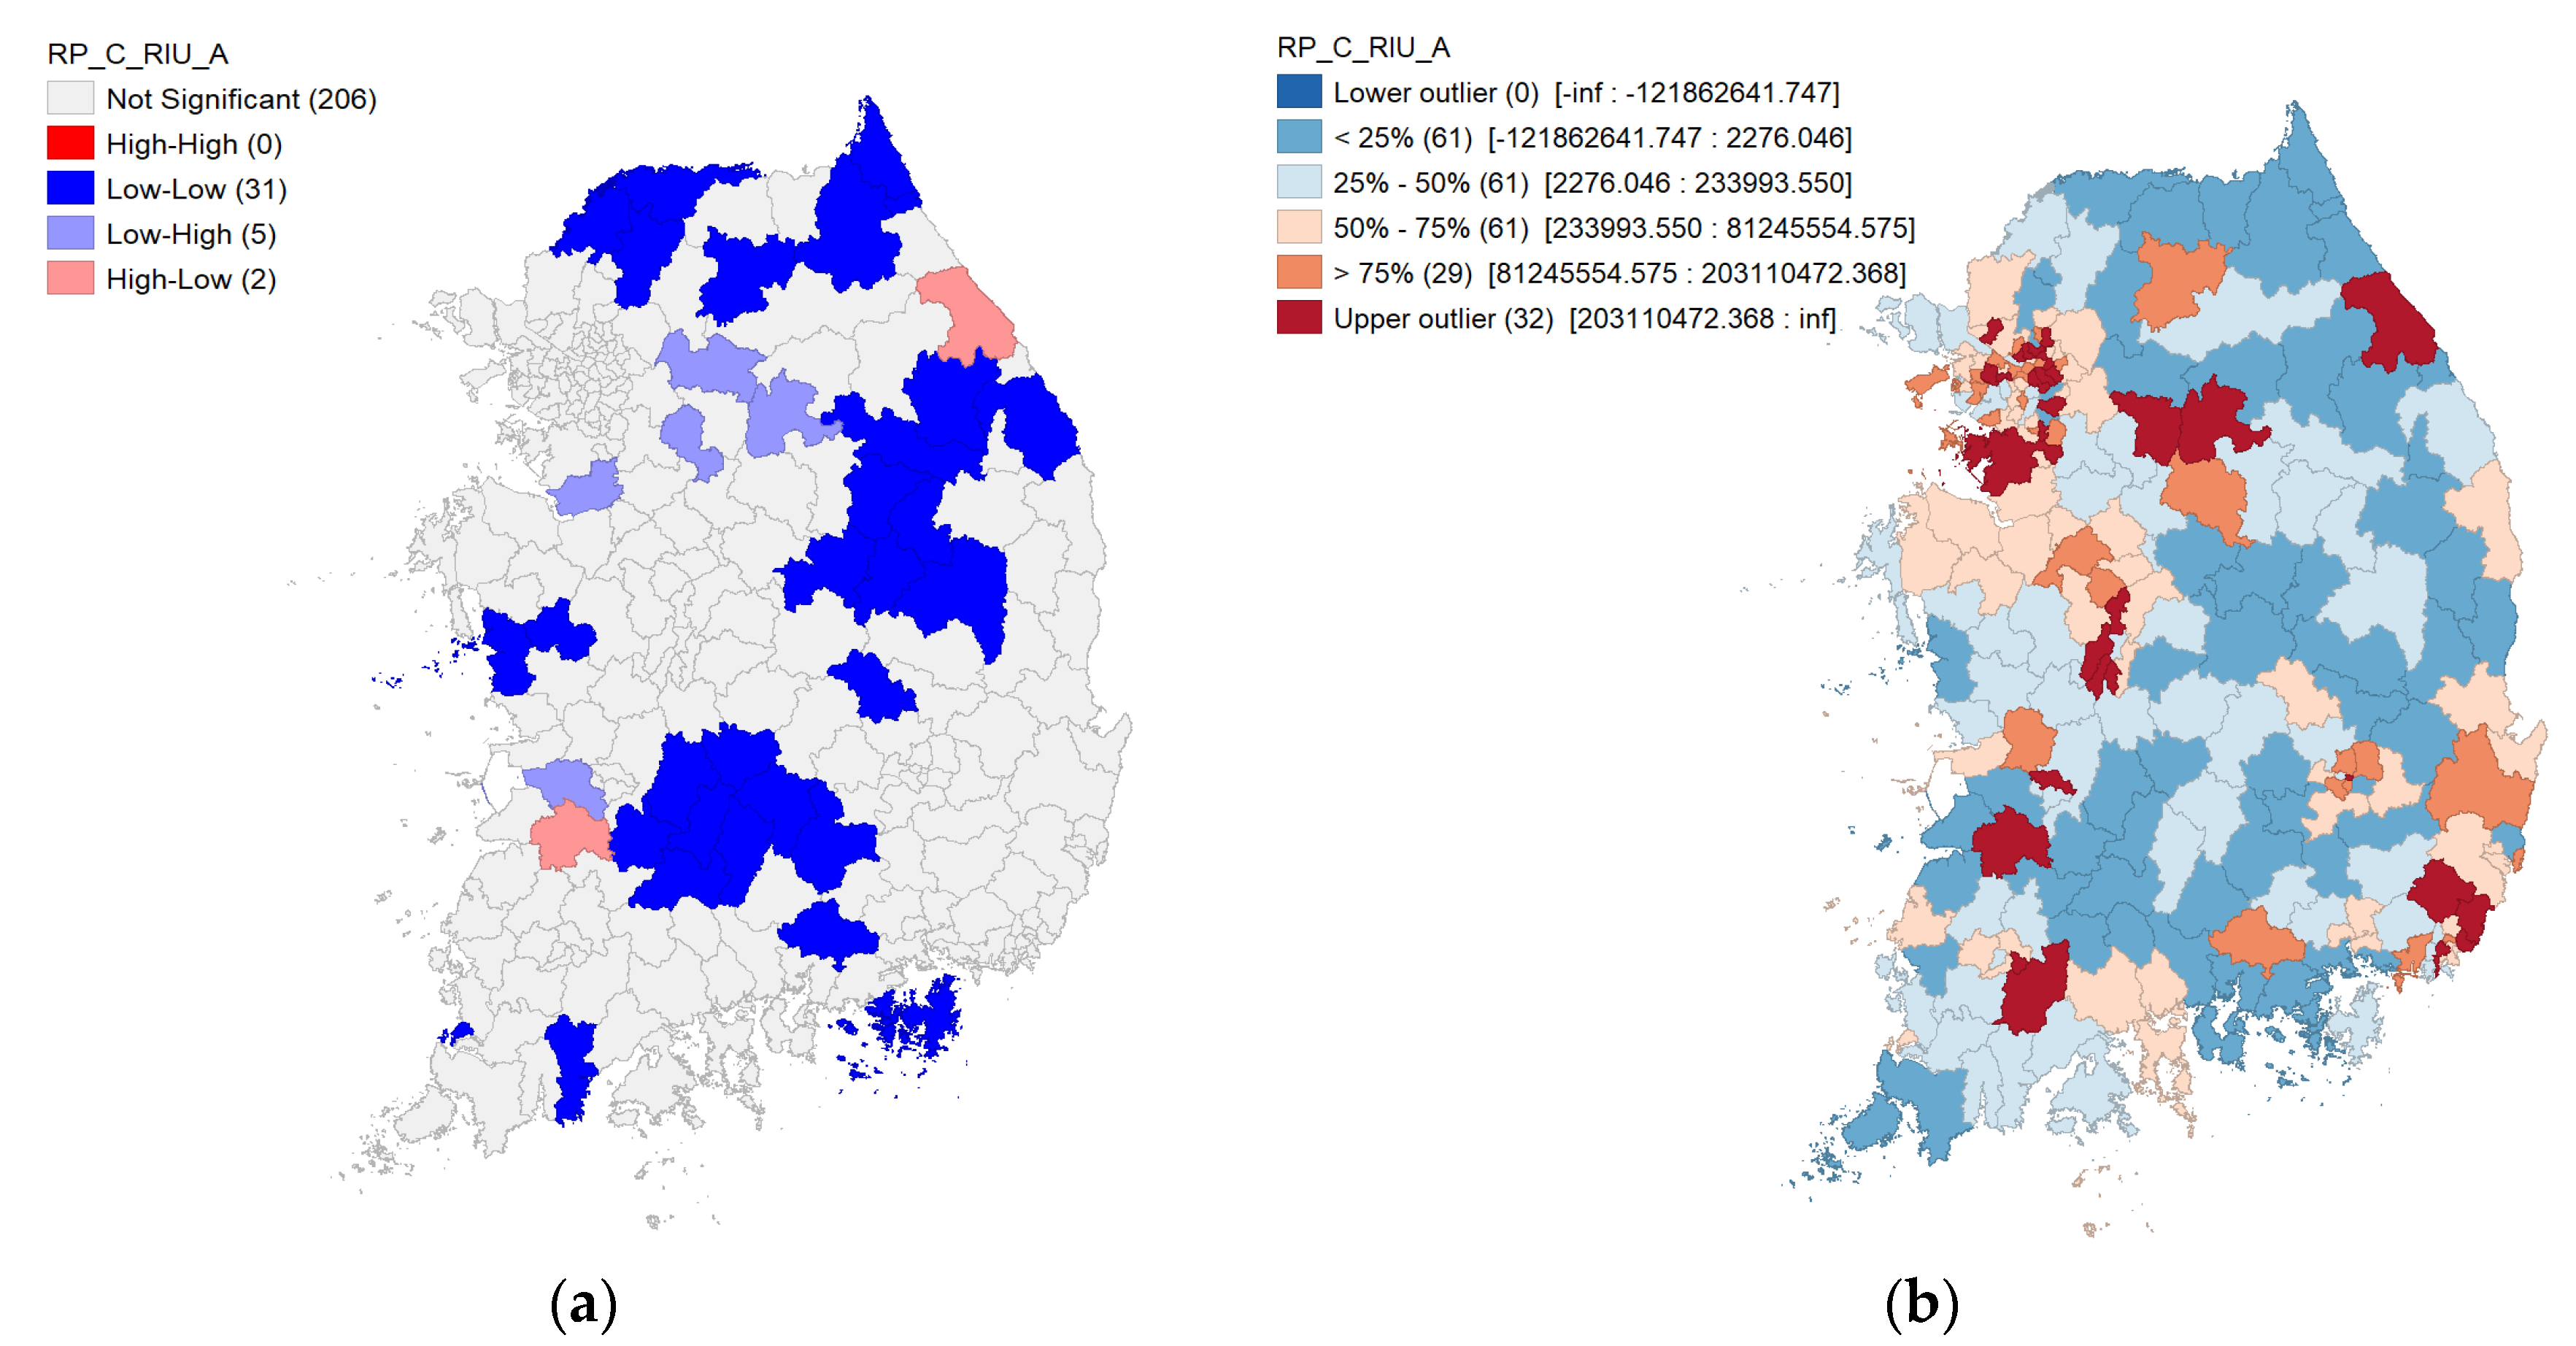
5.1. The Number of Radioactive Materials Licenses

To understand the risk of geographically varying radioactive materials, this study first analyzed the spatial distribution of radioactive material licenses in Korea. The null hypothesis is ‘The number of Radioactive Material Licenses is randomly distributed among the 244 regions in Korea’. Moran’s I for the number of radioactive materials licenses is 0.237 and statistically significant at 5% with the pseudo p-value of 0.000030. Consequently, the null hypothesis is rejected, and the alternative hypothesis of spatial autocorrelation is accepted. Positive and significant Moran’s I statistic value indicates the relative dominance of spatial clusters. So, the number of Radioactive Material Licenses shows distinctive spatial distribution patterns among the 244 regions in Korea. The observations in the first quadrant of the Moran scatter plot shown in Figure 2 are the candidates for the High–High clusters (H–H clusters), but not all of them are found to be statistically significant, and this will be tested in LISA statistics. In H–H clusters, the value of a subject region is higher than the overall average coupled with the average of its neighbors’ values that is higher than the overall average value. For example, if the number of licenses in a local region is higher than the average of all 244 regions, and the average in the number of licenses for its neighboring regions is also higher than the average of all regions. In order to identify the locations of spatial regimes (H–H or L–L clusters and H–L or L–H outliers), LISA statistics are needed.
South Korea is composed of nine administrative provinces (‘do’ in Korea, equivalent to a state in the US) and eight metropolitan areas, including Seoul. The SMA (Seoul Metropolitan Area) is composed of two metropolitan areas (Seoul and Incheon) and one province (Gyeonggi-do). In total, there are 17 administrative regions, which are further decomposed into 250 smaller administrative regions. In this study, Korea is subdivided into five broader geographic divisions for policy development: the SMA, Chungcheong, Gyeongsang, Jeolla, and Gangwon, as shown in Figure 3.
Figure 4a shows the different spatial regime types and their locations. LISA can test the presence of either spatial clusters or spatial outliers for each local region. As a result of LISA analysis for the number of radioactive material licenses, H–H clusters were mainly found within the SMA (Seoul Metropolitan Area; Pyeongtaek-si, Danwon-gu, Anseong-si, Yeonsu-gu, Namdong-gu), industrial cities close to the SMA (Cheonan-si, Asan-si, and Dangjin-si). Other H–H clusters were found in Southeast Korea (Uichang-gu Changwon-si, Seongsan-gu Changwon-si, and Gimhae-si). These regions are located either in the industrial cluster or in the adjacent regions of Korean industrial clusters with high population density. On the other hand, the L–L clusters were mainly distributed among the regions in Gangwon-do, namely Taebaek-si, Sokcho-si, Pyeongchang-gun, Samcheok-si, Jeongseon-gun, Inje-gun, Goseong-gun, and Yangyang-gun in the mountainous part of Korea. Additionally, regions in Gyeongsangbuk-do (Andong-si, Yeongju-si, Mungyeong-si, Yecheon-gun, Bonghwa-gun, and Uljin-gun), Jeollabuk-do (Namwon-si, Jangsu-gun, and Imsil-gun), and Kyeongsangnam-do (Hamyang-gun, Geochang-gun, and Hapcheon-gun) were found in the L–L cluster, and these regions are rural areas with concentrated agricultural activities and the presence of a large elderly population. These are the regions with limited industrial activities due to their geographical characteristics. In other words, the higher concentration in the number of radioactive materials licenses is mainly found in regions with active industrial activities. Figure 4b also the regional distribution of radioactive materials licenses. As expected, the regions identified as the upper outliers (independent from values of their neighbors) are mainly the cities in the SMA (Siheung-si, Hwaseong-si, Danwon-gu of Ansan-si, etc.). Additionally, in the southeastern state of Korea (Gyeongsangnam-do), upper outliers have the highest numbers of radioactive materials licenses for the concentrated industrial activities for heavy industry, the chemical industry, and the shipbuilding industry in the industrial clusters. They are mainly coastal regions: Nam-gu of Pohang-si, Ulju-gun, Nam-gu of Ulsan, Gimhae-si, Seongsan-gu of Changwon-si, and Yeosu-si. Among the major inland cities, Gumi-si, Heungdeok-gu of Cheongju-si, and Yuseong-gu show a higher concentration of license numbers, and these regions are the main center of industrial and R&D activities in Korea.
However, it is difficult to determine whether a radioactive hazard is high or low solely based on the number of licenses, since a license for each facility has a varying amount of permitted use for radioactive materials. Therefore, it is important to look at the permitted amount of radioactive materials. However, KINS only discloses the number of RI users and does not disclose the amount of permitted use to the public on its website. For local residents and local governments, the number of permitted use permits for facilities (that can be aggregated for regions) rather than the number of licenses serves as a better indicator for potential risk from radioactive hazards in case of emergencies. Accordingly, the current information-disclosure system should be revised to release the permitted use amount data to the public through easily accessible sources, improved to report more relevant types of information to the public. Additionally, the KINS dataset reveals some mismatch problems between the addresses of facilities with the industrial licenses and the addresses of the actual workplace where radioactive materials are used for industrial activities. The application and approval of the license are required for each business establishment. However, in the case of a mobile use workplace, the license is received at the address of the head office due to the characteristic of temporary use. Due to the inaccuracy of the KINS data, it is unavoidable to exclude license data for industrial use from the spatial analysis for the number of licenses or for the permitted use amount of radioactive materials. So, this study analyzed the spatial distribution of the number of licenses for radioactive materials, excluding licenses for industrial use. The Moran’s I is 0.155 with a pseudo p-value of 0.000300, indicating the positive spatial autocorrelation for the number of licenses for radioactive materials, excluding licenses for industrial use (see Figure 5). Compared to the Moran’s I statistics of 0.237 (z-value of 5.9619) for the total number of licenses, the number of licenses for radioactive materials excluding licenses for industrial use shows a weaker positive spatial autocorrelation with a lower Moran’s I of 0.155 (z-value of 4.0654). This reveals that the spatial cluster pattern becomes weaker by excluding the number of licenses for industrial use, entailing the intrinsic data inaccuracy issues due to the identified spatial mismatch problems.
A LISA map (shown in Figure 6) of the number of licenses for radioactive materials excluding industrial licenses shows the similar geographic distribution of L–L clusters to for the total number of licenses. On the other hand, more H–H clusters were found for the number of licenses excluding industrial use than those for total licenses. In the LISA map excluding industrial use, there were 16 H–H clusters, mainly found in the metropolitan areas such as Daejeon Metro, Sejong-si, and Cheongju-si (R&D centers). However, the spatial distribution of the L–L clusters shows similar patterns between the two cases. Additionally, five regions (Chuncheon-si, Jinju-si, Gyeongju-si, Yuseong-gu, and Heungdeok-gu) appeared as upper outliers in terms of the number of permits excluding industrial use. Chuncheon-si and Jinju-si had the highest number of licenses when the industrial-use licenses were excluded, and these two regions are home to National University Hospitals.
This study investigated the issues of KINS raw data with industrial licenses, which may mislead the analytical results. Another main source of data inaccuracy is the mismatch between the address of the RI mobile-use permit and the address of the actual site for mobile use. There are 1118 industrial mobile-use sites among the 244 regions in the analysis. Mobile-use sites give permission to handle radioactive material with storage capacity. However, the radiation risk could not be accurately analyzed with the storage capacity. However, NSSC [4] showed that the exposure accidents of workers at industrial mobile-use sites are higher than that at the other type of facilities for a ten-year period (2011–2020). Therefore, a spatial analysis for the number of industrial mobile-use sites was conducted. The statistically significant and positive Moran’s I statistics of 0.165 (pseudo p-value at 0.001910), as shown in Figure 7a,b, confirms the presence of spatial autocorrelation for the number of industrial mobile-use sites. As a result of LISA analysis (shown in Figure 7c,d) for industrial mobile-use site numbers, H–H clusters are mainly found in coastal port regions where shipbuilding, heavy industry, and chemical industries are concentrated.
The results of spatial analysis on the number of licenses for radioactive materials reveal the following implications. First, it is necessary to reform the current regulatory system by reflecting the empirical findings of the spatial analyses. Clusters with a higher concentration of licenses for radioactive materials are mainly found in the SMA and other metropolitan areas with high population density. These regions are also home to industrial clusters, centers for R&D activities, and large-scale medical facilities. Therefore, it is needed to establish regional offices in the identified clusters. KINS is located in Daejeon Metropolitan Area, and its centralized top–down regulatory approaches can be inefficient to quickly respond to emergency situations across Korea. In addition, it is suggested that the local governments’ needs for enhanced safety management are accommodated.
The specific policy reforms and actionable items include (see Table 3):
  • Establishment of regional offices of the regulatory agency, KINS, in the identified clusters;
  • Stepwise transfer of management authority/responsibility to local governments where the H–H clusters are detected;
  • Transfer of management authority/responsibility to local governments for industrial mobile-use sites.
Second, a better information-disclosure system with more relevant and accurate data on radioactive materials should be developed. It is difficult to directly estimate the potential risk of the radioactive hazard solely by the number of licenses. Therefore, it is critical to properly manage and disclose the permitted use amount data for radioactive materials in a transparent manner. More importantly, in the case of industrial use, data accuracy was extremely low despite the highest share of the total use. Consequently, developing an accurately classified (for permit and use addresses) database management system is a necessary condition for accurate analyses for current issues, and this will serve as a base to improve the nuclear safety regulatory governance systems.
Table 3. Top 10 regions with the highest license numbers and mobile-use site numbers in Korea.
RankingTotal Number of LicensesNumber of Industry LicensesNumber of Mobile-Use Sites
Local GovernmentNumberLocal GovernmentNumberLocal GovernmentNumber
1Hwaseong-si457Hwaseong-si439Yeosu-si121
2Danwon-gu, Ansan-si311Danwon-gu, Ansan-si296Ulju-gun88
3Gangseo-gu294Gangseo-gu278Nam-gu (Ulsan)77
4Gimhae-si260Gimhae-si249Gangseo-gu54
5Siheung-si243Siheung-si236Seosan-si41
6Pyeongtaek-si235Pyeongtaek-si218Seongsan-gu, Changwon-si39
7Ulju-gun211Ulju-gun197Gimhae-si32
8Yeosu-si206Yeosu-si195Bucheon-si32
9Nam-gu (Ulsan)202Nam-gu (Ulsan)182Pyeongtaek-si32
10Yuseong-gu198Seobuk-gu, Cheonan-si169Geoje-si30

5.2. The Amount of Permitted Use of Radioactive Materials

Since the potential radiation risk is directly affected by the amount of permitted use rather than the number of licenses, the spatial distribution of RI use (both local and mobile) amounts can be better indicators for the radiation risk levels in a local region. The null hypothesis of spatial randomness cannot be rejected with the pseudo p-value of 0.354460 (>0.05) and the Moran’s I value of −0.021. Accordingly, the amount of permitted use for radioactive materials does not show a distinctive spatial distribution pattern. Even without spatial autocorrelation at a global level, local spatial patterns may exist, and LISA analysis can detect them. There are two regions classified as H–L clusters: Jeongeup-si, which has one large-scale radiation research institute, and Gangneung-si, where there is one general hospital with a large-scale radiation permit (see Figure 8).
As mentioned earlier, for the number of licenses, the analysis for the total amount of permitted use may mislead the results due to the spatial mismatch problems of industrial use data from KINS. Accordingly, the revised permitted use amount data by excluding the industrial use are employed for spatial analysis. However, with the Moran’s I of −0.015 and pseudo p-value of 0.368490 (>0.05), the spatial randomness cannot be rejected for the amount of permitted use excluding industrial use (see Figure 9). The LISA map for the total amount of radiation permits in Figure 8c still shows the presence of significant local clusters (mainly L–L) and some local outliers (L–H and H–L). Global level spatial autocorrelation was not detected; however, a region at a local level can still be detected as a core region for one of the four spatial regions (H–H, H–L, L–H, or L–L). At a global level, the Moran’s I statistic can be found to be insignificant since the different groups of spatial regimes at a local level, such as clusters and outliers, balance and wash out the dominant effect of one over the other. In a box plot map (Figure 9d), the upper outliers mainly appear in the regions with the presence of university hospitals, public institutions, and radiation research institutions. However, these upper outlier regions are not parts of clusters; rather, they are geographically scattered around the metropolitan areas of Korea. In particular, these metropolitan areas are located in the five broadly defined geographic divisions of Korea: the SMA Division, Gyeongsang Division, Jeolla Division, Gangwon Division, and Chungcheong Division.
While the number of licenses shows a spatial autocorrelation, the amount of permitted use shows spatial randomness. Looking at the outliers (not spatial, just outliers based on the variance of the variable), some facilities have a huge amount of permitted use, and others have no permitted amount. Therefore, this study further investigated the upper outlier facilities with a huge amount of permitted use in raw data (see Table 4). For this, criteria for excluding upper outliers were needed. Currently, the ‘Nuclear Safety Act’ in Korea sets the periodic inspection standards for radioactive use licenses considering the types of licenses, the number of permits, and the subjects of use. Based on this standard, facilities using more than 111 TBq of RI are classified as highly dangerous facilities with a high risk to human health. As a result, this study performed another spatial analysis after excluding the high-risk facilities.
The spatial distribution was carried out for the permitted use of radioactive materials excluding both industrial use facilities and high-risk facilities over 111 TBq. The estimated Moran’s I is 0.105 with a pseudo p-value of 0.008350 (<0.05), as shown in Figure 10. With a positive and significant Moran’s I value, the null hypothesis of spatial randomness can be rejected. Alternatively, spatial clusters (both H–H and L–L) are found to be the dominant types of spatial regions for the identified spatial autocorrelation.
LISA determines the location and significance level of clusters and outliers not found in a global spatial autocorrelation test using Moran’s I statistic. LISA tests were used for the presence of spatial clusters and spatial outliers for each region between the amount of permitted RI use in a region and the amount of the region’s adjacent neighbors. The H–H clusters in the LISA map (Figure 11a) are found in the SMA (with the highest population density among the metropolitan areas in Korea) and in Yuseong-gu of the Deajeon metropolitan area with the presence of strong R&D activities. The outliers (not spatial outliers, but based on the variance of the variable) shown in Figure 11b are all scattered around all major metropolitan areas (population centers) in Korea, and these metropolitan areas have a high amount of permitted use for medical facilities. The spatial distribution for the permitted use for medical facilities can also be found in Figure 11c, and the outliers in this map show a similar pattern to the distribution of outliers for all but industrial use. The L–H spatial outliers are mainly located in the SMA, more specifically within the capital city, Seoul, and in the Daejeon metropolitan area. In the identified L–L clusters, local industrial activities are limited, and population densities are very low with the concentration of the elderly population. Consequently, the local demand for radioactive use is quite low in the L–L cluster regions.
The implications of spatial analysis of permitted use amount for radioactive materials are as follows. It is recommended to revisit the current regulatory system in consideration of the radiation use permit amounts of the facilities and their geographic distribution among the 244 regions in Korea. Except for the 53 high-risk facilities with a huge amount of use permits, non-industrial radiation use permit shows a distinctive spatial autocorrelation (see Table 5). It is necessary to keep the current regulatory governance system for the high-risk facilities that have permitted use licenses above a certain standard (111 MBq). However, it would enhance the efficiency of the current safety regulation system if KINS establishes regional centers (regional offices) in the five geographic Divisions: the SMA Division, Chungcheong Division, Gyeongsang Division, Jeolla Division, and Gangwon Division based on the findings in this study.
The detailed types of radioactive material licenses can be divided into production, sale, use, and mobile use of radioactive isotopes (NSSC, 2021). Among them, permission for use has a relatively high degree of risk depending on the specific amount of permission and the characteristics of continuous use. Reflecting on this, we analyzed the permitted amount for use. In particular, mobile usage data that contributed to industry data inaccuracies are automatically excluded here. Therefore, the results of this analysis are meaningful. Moran’s I for the permitted amount of the license for use is −0.012. The null hypothesis of spatial randomness cannot be rejected with the pseudo p-value of 0.361910 (>0.05). Accordingly, the amount of permitted use for radioactive materials does not show a distinctive spatial distribution pattern.
Even without the spatial autocorrelation at the global level, local spatial patterns may exist, and LISA analysis can detect them, as found in the case of the H–L cluster of the LISA map, Jeongeup-si, which has a radiation research institution, and Gangneung-si, where a hospital with a large-scale radiation use permit is located. The spatial distribution of permitted uses of licensed facilities can also be found in Figure 12a. The outliers in this map have characteristics similar to the distribution of Figure 11b,c.
  • Facilities with a huge permitted use amount should be intensively and directly managed by KINS (a centralized regulatory agency), as is the case with the current regulatory system.
  • The transfer of regulatory technology and authority and responsibility to local governments are the first steps to develop a more efficient regulatory system for regions with a high concentration of non-industrial (mainly medical use) permits. At this stage, KINS regional offices in the recommended five geographic divisions can perform the technology transfer and training for local governments.
  • In the long term, the inspection of radioactive materials and their uses should be fully transferred to the local governments, and KINS should focus on advancing safety technology, preparing safety standards, and safety review.
Figure 12. LISA and Box Plot maps for the permitted amount of the license for use.: (a) LISA maps for the permitted amount of the license for use; (b) Box Plot maps for the permitted amount of the license for use. (Note: RI_C_RIU_A = permitted use amount of RI use report and permit combined in a region).
Sustainability 14 00966 g012

5.3. Basis for Changes in the Regulatory System and Implementation Methods

As found in the empirical analyses, radioactive materials are distributed throughout Korea. However, the safety management and emergency response in the current system are not efficient. It is not ideal for KINS to perform all on-site inspections across the country. As we have seen in other countries, an inspection of radioactive material only by central-government-level regulatory agencies (e.g., NRC in the United States and NSSC in Korea) is not always optimal. With the lack of information on local radioactive material facilities, local governments have limited capacity for emergency responses. Additionally, in certain cases, it takes too long (up to several hours) for KINS experts to arrive at the site with an emergency situation and control it. Therefore, the current system only controlled by KINS poses serious limitations for the efficient initial response to radiation exposure of workers or local residents.
In order to transfer the authority and responsibility for on-site safety management to local governments, technology transfer is an essential first step. If new regional offices of KINS can be established across Korea, they will be the KINS’ local bases for technology transfer to the partnering local governments.
Under the current regulatory system by the monopolistic regulatory agency, KINS, in Korea, the disadvantages of inefficiency surpass, by far, the advantages of specialization. For this reason, it is recommended to transfer on-site inspections to local governments. In order to transfer the safety inspection authority/responsibility to the local governments, the KINS should share its accumulated safety management technologies and specialized experience with the local governments. Consequently, the first step for the regulatory policy reform process would be to establish regional offices that serve as regional centers for regulatory technology transfer and effective on-site safety management.
To find the best available locations for the proposed KINS regional offices, various factors should be considered, including accessibility, population distribution, and the spatial distribution patterns of hazardous, radioactive materials found in this study. The regions with the extremely high permit amount (identified as upper outliers in box plot map in Figure 11b) are selected and suggested as the candidate locations for regional centers, and these regions are listed in Table 6.
For each of the five geographic divisions of Korea, a location for KINS’ regional center is determined, taking into account the permitted use amount, accessibility to remote regions from the proposed centers, and population distribution of each division. From the proposed regional office locations, the response time of KINS local emergency teams can be greatly shortened, and more efficient management of the emergency situation is expected. As shown in Table 6, KINS’ regional offices will be established in the SMA Division, Chungcheong Division, Gyeongsang Division, Jeolla Division, and Gangwon Division. A specific location for each geographic division is mainly determined based on the spatial distribution of the permitted use amount. Additionally, other factors, such as accessibility and population distribution of each division, are used. The SMA Division, where over 25 million (over half of the total Korean population) live, needs to be subdivided into two regional offices, North and South, in consideration of areal size and population density. Additionally, a regional office in Chungcheong Division can be co-located within the KINS main office.

6. Conclusions

The first goal of nuclear safety regulatory bodies around the world is to protect public health from radiation risks from the use of nuclear power and radioactive materials. The elected officials of a local government should be concerned about the health and safety of the local residents (constituents of the local region). A central nuclear safety regulatory agency in Korea, KINS, takes one-size-fits-all approaches for managing the safety of radioactive materials in accordance with uniform standards regardless of their locations. However, this is inefficient to manage all the facilities subject to regulations that are continuously increasing as the industry develops. For the 244 regions in Korea, the spatial analysis in this study identified the spatial distribution patterns for the number of RI licenses and the permitted amount of RI use in Korea. A large geographic variation in the permitted amount of RI use was found. However, the centralized regulatory agency, KINS, has been in charge of safety management in a top–down approach failing to meet the local needs. Considering many other countries’ cases and local governments’ vested interest in safety management, it is recommended to initiate new governance for safety management.
The number of licenses for radioactive materials shows spatial autocorrelation. The H–H cluster was formed around the metropolitan areas and other densely populated regions with industrial clusters in Korea. Regions with low population density and a higher share of the elderly population in mountainous or agricultural areas showed the concentration of L–L clusters. In the case of industrial licenses, which account for 78.7% of the number of licenses, there were spatial mismatch problems between the license location (usually headquarter addresses) and the actual location where radioactive materials were in use, so licenses for industrial use had to be dropped from this study for spatial analysis.
Additionally, above all else, the number of licenses could not be used to determine the magnitude of the potential radioactive hazard. However, regulators say that the number of RI-licensed establishments has been increasing annually in recent years, requiring additional technical support. Findings in this study clearly demonstrate that the number of licensed facilities alone cannot be used as an indicator for the level of potential risk from the licensed facilities. Therefore, in this study, spatial analysis was extended for the permitted amount of RI (or radioactive materials) use. The number of total licenses shows a spatial autocorrelation, while the total amount of permitted use shows spatial randomness. As a result, this study performed another spatial analysis after excluding the high-risk facilities. For the spatial analysis excluding these facilities, a spatial autocorrelation was found in the permitted use amount. In LISA tests for the presence of spatial clusters, the H–H clusters were only found in the SMA with a high amount of medical use permits and Yuseong-gu of the Deajeon metropolitan area with a strong presence of public R&D activities.
Through the process of spatial analysis of RI permits, a reform in the regulatory system was suggested in consideration of the huge amount of permits for some licenses and the total amount of permits by regions. If the total amount in the region is less than 111 TBq, the regulatory technology is transferred to the region first, and the local government in the region conducts an on-site inspection. In areas over 111 TBq, safety management is implemented by creating a cooperative system between relevant local governments and the regulatory agency, KINS. During that time, KINS continues to enforce safety regulations with a permit amount of 111 TBq or more. However, KINS maintains the authority to regulate safety if necessary for safety among licensed facilities with a permit amount of 111 TBq or more. The authority and responsibility to regulate mobile workplaces will also be transferred to local governments and implemented locally. As such, it was necessary to improve the radiation safety regulation governance. In the long term, the inspection of radioactive materials should be transferred to local governments, and KINS should focus on advancing safety technology, preparing safety standards, and conducting safety reviews.
This study selected the candidate locations for six regional offices of KINS for geographic divisions in Korea. The recommended candidate locations should be carefully reviewed in collaboration with the local governments. Through the new regional offices, KINS transfers the accumulated regulatory technology to local governments and establishes a strong collaboration system with regions that can respond more effectively to emergency situations. Additionally, regional offices provide safety technology consulting to local licensees.
Among the information managed by KINS, the permit location and the actual place of use are often different. Additionally, as in the case of a relatively very high permit amount in a specific hospital, it is necessary to review the approval standard for the permit amount again.
In addition, it is absolutely critical to classify the types of licenses and the amount of permitted use in information disclosure to the public via easily accessible platforms. In addition, through the improved information sharing system, radiation risks and safety management systems should be fully disclosed to the public in a form that local residents can easily grasp. The spatial analysis results in this study can effectively visualize the distribution patterns of potential sources of radioactive hazards through mapping, and this will play an important role in more effective two-way communication between regulatory agencies and local residents [8].
Like many other empirical studies, this study is also far from perfection. The analysis in this study is not comprehensive due to the data-inaccuracy problems embedded in the raw data from KINS, especially with the permit for industrial use. Additionally, this study aims to suggest viable paths for the policy reform in radioactive safety regulations rather than a set of specific technological standards/specifications for management. That is why extended discussion with scientists, technicians, and other experts with practical experience should follow, and this will develop the technical standards/specifications about how the newly suggested policy reforms can be effectively implemented on site.
Spatial Analysis on Radiation Hazards in South Korea has rarely been studied, and the data are largely limited in public use. Understanding the spatial distribution of potential sources of radioactive isotopes in Korea is the first step to analyzing the potential risk among the local governments in Korea. This study is meaningful in that it suggests the need for many countries around the world to properly disclose information on radioactive materials. Utilizing the spatial analysis results found in this study, the effectiveness of radiation risk management can be enhanced through collaborative policy development between central regulatory agencies and local stakeholders. The newly recommended governance model in this study can improve the safety management of radioactive materials that are around people’s daily lives through effective cooperation with local governments in practice. In the future, it is necessary to study the spatial analysis of radioactive materials by synthesizing accurate data on the number of licenses and permit amounts of industrial use. Using complete and accurate data will help to develop a better governance model for Korea’s radiation safety regulatory system. This research method can also be applied to other countries’ cases as well.

Author Contributions

Conceptualization, S.L., J.L. and C.-G.Y.; methodology, S.L. and J.L.; software, S.L. and J.L.; validation, S.L., J.L. and C.-G.Y.; formal analysis, S.L.; investigation, S.L.; resources, S.L.; data curation, S.L. and J.L.; writing—original draft preparation, S.L.; writing—review and editing, S.L., J.L. and C.-G.Y.; visualization, S.L.; funding acquisition, C.-G.Y. All authors have read and agreed to the published version of the manuscript.

Funding

This research was funded by the Ministry of Education of the ROK and the National Research Foundation of Korea (NRF-2019S1A5C2A02081304) and the Ministry of Science and ICT of the ROK & KIRD in 2021.

Institutional Review Board Statement

Not applicable.

Informed Consent Statement

Not applicable.

Data Availability Statement

Not applicable.

Acknowledgments

The authors want to acknowledge UNLV (Univ. of Nevada, Las Vegas), CNU (Chungnam National Univ., Korea), and KINS (Korea Institute of Nuclear Safety) for providing Sangwon Lee with the opportunity to perform this research as a visiting research scholar at UNLV from January 2021 to January 2022.

Conflicts of Interest

The authors declare no conflict of interest.

References

  1. Kim, I. Reinterpretation of the Fukushima Nuclear Accident, 1st ed.; East Asia: Seoul, Korea, 2020; pp. 157–186. (In Korean) [Google Scholar]
  2. International Atomic Energy Agency. Radiation Protection and Safety of Radiation Sources: International Basic Safety Standards. No. GSR Part 3. Available online: https://www-pub.iaea.org/MTCD/Publications/PDF/Pub1578_web-57265295.pdf (accessed on 14 August 2021).
  3. Centers for Disease Control and Prevention. Radiation Emergencies. Available online: https://www.cdc.gov/nceh/radiation/emergencies/contamination.htm (accessed on 3 September 2021).
  4. Nuclear Safety and Security Commission (NSSC). Nuclear Safety Yearbook 2020. Available online: https://www.kins.re.kr/publication (accessed on 25 July 2021). (In Korean)
  5. Nuclear Regulatory Commission. 2021–2022 Information Digest. NUREG-1350. Volume 33. Available online: https://www.nrc.gov/reading-rm/doc-collections/nuregs/staff/sr1350/index.html (accessed on 30 October 2021).
  6. Kim, Y.; Kim, J.; Kim, J. A Study on Reform Plan of Nuclear Governance for Responding to Changing Social Circumstances and Conflicts: Focusing on the Communication and Participation Committee of the Public People. Disput. Resolut. Stud. Rev. 2018, 16, 5–36. Available online: https://www.dbpia.co.kr/Journal/articleDetail?nodeId=NODE08837279&language=ko_KR (accessed on 7 June 2021). (In Korean).
  7. Kim, C.; Lee, K.; Heu, C. The Dilemma of Local Governments in Building Nuclear Safety Systems: Focusing on the Case of Busan Metropolitan City. Korean J. Local Gov. Stud. 2014, 18, 29–55. Available online: https://www.dbpia.co.kr/Journal/articleDetail?nodeId=NODE06532232 (accessed on 7 June 2021). (In Korean). [CrossRef]
  8. Anselin, L.; Sridharan, S.; Gholston, S. Using exploratory spatial data analysis to leverage social indicator databases: The discovery of interesting patterns. Soc. Indic. Res. 2007, 82, 287–309. [Google Scholar] [CrossRef]
  9. Choi, S.; Jun, E.; Hwang, I.; Starz, A.; Mazour, T.; Chang, S.; Burkart, A.R. Fourteen lessons learned from the successful nuclear power program of the Republic of Korea. Energy Policy 2009, 37, 5494–5508. [Google Scholar] [CrossRef]
  10. Gilardi, F.; Maggetti, M. The independence of regulatory authorities. Handb. Politics Regul. 2011, 201. Available online: https://www.fabriziogilardi.org/resources/papers/gilardi_maggetti_handbook.pdf (accessed on 3 July 2021).
  11. Ram Mohan, M.P.; Gopakumar, K.V.; Smith, T. Nuclear Energy Safety, Regulatory Independence, and Judicial Deference: The Case of the Atomic Energy Regulatory Board of India. Adm. Soc. 2020, 52, 1009–1037. [Google Scholar] [CrossRef]
  12. Kurokawa, K. Fukushima nuclear accident independent investigation commission by the National Diet of Japan. Nippon. Genshiryoku Gakkai-Shi 2013, 55, 146–151. Available online: https://www.nirs.org/wp-content/uploads/fukushima/naiic_report.pdf (accessed on 15 July 2021). [CrossRef] [Green Version]
  13. Wang, Q.; Chen, X. Regulatory failures for nuclear safety–the bad example of Japan–implication for the rest of world. Renew. Sustain. Energy Rev. 2012, 16, 2610–2617. [Google Scholar] [CrossRef]
  14. Dal Bó, E. Regulatory capture: A review. Oxf. Rev. Econ. Policy 2006, 22, 203–225. [Google Scholar] [CrossRef]
  15. Kim, M. A Study on Efficiency of the Legal System according to the Launch of Nuclear New Administration System. Law Rev. 2012, 53, 53–77. Available online: https://www.dbpia.co.kr/journal/articleDetail?nodeId=NODE01879066 (accessed on 12 May 2021). (In Korean).
  16. Cha, S. A Comparative Study on a Regulatory agency for Nuclear Safety. Korean Comp. Gov. Rev. 2014, 18, 219–237. Available online: https://www.dbpia.co.kr/journal/articleDetail?nodeId=NODE08797695 (accessed on 13 May 2021). (In Korean).
  17. Kim, G. A study on the Independence of Nuclear Safe Regulation System. Korean J. Local Gov. Adm. Stud. 2015, 29, 157–176. Available online: https://www.dbpia.co.kr/journal/articleDetail?nodeId=NODE08822014 (accessed on 4 May 2021). (In Korean).
  18. Choi, B. Nuclear Safety Regulatory Administration System. Korea J. Policy Stud. 1995, 33, 1–18. Available online: https://s-space.snu.ac.kr/bitstream/10371/71568/1/kjpa_33_1_1-18.pdf (accessed on 2 May 2021). (In Korean).
  19. Kim, Y.; Yi, C. Agenda-setting Process in Enacting the Korea‘s Nuclear Safety Act in 2011 adopting Multi Streams Approach. Korean J. Public Adm. 2018, 27, 233–276. Available online: https://www.koreascience.or.kr/article/CFKO201710852359394.pdf (accessed on 4 May 2021). (In Korean).
  20. Kim, J. Study on Improvement Plans for Nuclear Safety Regulatory System. Final. Rep. Policy Res. Proj. Natl. Assem. Budg. Off. 2012, 1–88. Available online: https://www.nabo.go.kr/index.jsp (accessed on 6 June 2021). (In Korean).
  21. Sugawara, S.E.; Shiroyama, H. A Comparative analysis between France and Japan on local governments’ involvement in nuclear safety governance. J. Jpn. Soc. Civ. Eng. 2011, 67, 441–454. [Google Scholar] [CrossRef]
  22. Jeong, H.; Chung, E. The Study for the Moderating Effect of Credibility about Nuclear Power Safety Regulation/Regulation Organization on the Relations between Influential Factors and Nuclear Acceptance. J. Commun. Sci. 2018, 18, 79–127. Available online: https://kiss.kstudy.com/thesis/thesis-view.asp?key=3582118 (accessed on 10 June 2021). (In Korean). [CrossRef]
  23. Lee, Y.; Cho, K. Sustainable Nuclear Safety Management. J. Sustain. Res. 2012, 3, 43–54. Available online: https://www.dbpia.co.kr/journal/articleDetail?nodeId=NODE02303568 (accessed on 2 June 2021). (In Korean).
  24. Ahearne, J.F. Telling the public about risks. Bull. At. Sci. 1990, 46, 37–39. [Google Scholar] [CrossRef]
  25. Barbour, J.B.; Gill, R. Designing communication for the day-to-day safety oversight of nuclear power plants. J. Appl. Commun. Res. 2014, 42, 168–189. [Google Scholar] [CrossRef]
  26. Cooper, M.D. Towards a model of safety culture. Saf. Sci. 2000, 36, 111–136. [Google Scholar] [CrossRef]
  27. International Atomic Energy Agency. Safety Culture. Safety Series 1991. No.75-INSAG-4. Available online: https://www-pub.iaea.org/MTCD/Publications/PDF/Pub882_web.pdf (accessed on 12 June 2021).
  28. Kastenberg, W.E. Ethics, risk, and safety culture: Reflections on Fukushima and beyond. J. Risk Res. 2015, 18, 304–316. [Google Scholar] [CrossRef]
  29. Weber, M. Moving forward with safety culture. Health Phys. 2012, 102, 463–467. [Google Scholar] [CrossRef] [PubMed]
  30. Limbacher, M.; Douglas, P.S.; Germano, G. Radiation safety in the practice of cardiology. J. Am. Coll. Cardiol. 1998, 31, 892–915. [Google Scholar]
  31. Boice Jr, J.D.; Cohen, S.S.; Mumma, M.T.; Ellis, E.D. The Million Person Study, whence it came and why. Int. J. Radiat. Biol. 2019, 1–14. [Google Scholar] [CrossRef]
  32. Jones, C.G. The US Nuclear Regulatory Commission radiation protection policy and opportunities for the future. J. Radiol. Prot. 2019, 39, R51. [Google Scholar] [CrossRef]
  33. Bevelacqua, J.J. Practical and effective ALARA. Health Phys. 2010, 98, S39–S47. [Google Scholar] [CrossRef] [PubMed]
  34. Anzenberg, V.; Lewis, D.E.; Dickson, E.D.; Bush-Goddard, S.P. The US nuclear regulatory commission radiation exposure information reporting system (REIRS). Radiat. Res. 2010, 173, 254–255. [Google Scholar] [CrossRef]
  35. Nuclear Regulatory Commission. Occupational Radiation Exposure at Commercial Nuclear Power Reactors and Other Facilities 2018. NUREG-0713. Volume 40. Available online: https://www.nrc.gov/reading-rm/doc-collections/nuregs/staff/sr0713/v40/index.html (accessed on 8 July 2021).
  36. Adhikari, K.P.; Boersma, H.F.; Coates, R.; Coulor, W.; Gallego, E.; Omrane, L.B.; Tsegmed, U. Radiation protection infrastructure—challenges in developing countries. J. Radiol. Prot. 2021, 41, S171. [Google Scholar] [CrossRef] [PubMed]
  37. Anselin, L. Interactive Techniques and Exploratory Spatial Data Analysis. 1996. Available online: https://researchrepository.wvu.edu/cgi/viewcontent.cgi?article=1198&context=rri_pubs (accessed on 12 July 2021).
  38. Manesh, S.N.; Choi, J.O.; Shrestha, B.K.; Lim, J.; Shrestha, P.P. Spatial analysis of the gender wage gap in architecture, civil engineering, and construction occupations in the United States. J. Manag. Eng. 2020, 36, 04020023. [Google Scholar] [CrossRef]
  39. Arif, M.; Sengupta, S. Nexus between population density and novel coronavirus (COVID-19) pandemic in the south Indian states: A geo-statistical approach. Env. Dev. Sustain. 2021, 23, 10246–10274. [Google Scholar] [CrossRef] [PubMed]
  40. International Atomic Energy Agency. IAEA Safety Glossary. Available online: https://kos.iaea.org/iaea-safety-glossary/443 (accessed on 12 September 2021).
  41. Nuclear Regulatory Commission. Medical, Industrial, & Academic Uses of Nuclear Materials. Available online: https://www.nrc.gov/materials/medical.html (accessed on 4 September 2021).
  42. Nuclear Safety and Security Commission. 8th National Report for the Convention on Nuclear Safety. Available online: https://www.iaea.org/sites/default/files/21/07/national_report_of_the_republic_of_korea_for_the_8th_review_meeting.pdf (accessed on 1 September 2021).
  43. Korea Institute of Nuclear Safety. Regulatory system. Available online: https://www.kins.re.kr/en/radisoce (accessed on 2 September 2021).
  44. Nuclear Regulatory Commission. The United States of America Eighth National Report for the Convention on Nuclear Safety. Nureg-1650 Revision 7. Available online: https://www.nrc.gov/reading-rm/doc-collections/nuregs/staff/sr1650/r7/index.html (accessed on 1 September 2021).
  45. Government of the United Kingdom. Regulatory Controls for Radiation Protection in the UK. Available online: https://www.gov.uk/guidance/regulatory-controls-for-radiation-protection-in-the-uk (accessed on 23 September 2021).
  46. Nuclear Safety Authority. ASN Report on the State of Nuclear Safety and Radiation Protection in FRANCE in 2020. Available online: https://www.french-nuclear-safety.fr/ (accessed on 28 September 2021).
  47. Canadian Nuclear Safety Commission. Protecting Canadians. Available online: https://nuclearsafety.gc.ca/eng/resources/radiation/introduction-to-radiation/protecting-canadians.cfm (accessed on 3 October 2021).
  48. Tobler, W. On the first law of geography: A reply. Ann. Assoc. Am. Geogr. 2004, 94, 304–310. [Google Scholar] [CrossRef]
Figure 1. Regulatory system in Korea (https://www.kins.re.kr/en/radisoce, accessed on 13 July 2021 [43]).
Sustainability 14 00966 g001
Figure 2. Moran’s I Test Statistics for the number of radioactive materials licenses. (a) Moran’s I scatter plot for the number of radioactive materials (Moran’s I = 0.237); (b) Reference distribution for Moran’s I (pseudo p-value = 0.000030). (Note: TOT_LIC_N = number of radioactive material licenses in a region; lagged TOT_LIC_N = the average number of radioactive material licenses in the neighboring regions of a region.).
Sustainability 14 00966 g002
Figure 3. Administrative boundary map of South Korea.
Sustainability 14 00966 g003
Figure 4. LISA and box plot map for the number of radioactive materials licenses. (a) LISA map for the number of radioactive materials licenses; (b) Box plot map for the number of radioactive materials licenses. (Note: TOT_LIC_N = number of radioactive material licenses in a region.).
Sustainability 14 00966 g004
Figure 5. Moran’s I Test statistics for the number of radioactive material licenses excluding industrial use. (a) Moran’s I scatter plot for the number of radioactive material licenses excluding industrial use (Moran’s I = 0.155); (b) Reference distribution for Moran’s I (pseudo p-value = 0.000300). (Note: TLN_EX_IN = number of radioactive material licenses excluding industrial use in a region; lagged TLN_EX_IN = the average number of radioactive material licenses excluding industrial use in the neighboring regions of a region.).
Sustainability 14 00966 g005
Figure 6. LISA and box plot map for the number of radioactive material licenses excluding industrial use. (a) LISA map for the number of radioactive material licenses excluding industrial use; (b) Box plot map for the number of licenses excluding industries. (Note: TLN_EX_IN = number of radioactive material licenses excluding industries in a region.).
Sustainability 14 00966 g006
Figure 7. Moran’s I Test Statistics, LISA, and box plot maps for the number of RI mobile-use sites. (a) Moran’s I scatter plot for the number of RI mobile-use sites (Moran’s I = 0.165); (b) Reference distribution for Moran’s I (pseudo p-value = 0.001910); (c) LISA map for the number of RI mobile-use sites; (d) Box plot map for the number of RI mobile-use sites. (Note: S_RIRG_MU_ = number of RI mobile-use sites in a region; lagged S_RIRG_MU_ = the average number of RI mobile-use sites in the neighboring regions of a region.).
Sustainability 14 00966 g007
Figure 8. Moran’s I Test Statistics, LISA and Box Plot maps for the permitted use amount of radioactive materials.: (a) Moran’s I Scatter Plot for the permitted use amount of radioactive materials (Moran’s I = −0.021); (b) Reference distribution for Moran’s I (pseudo p-value = 0.354460); (c) LISA map for the permitted use amount of radioactive materials; (d) Box Plot map for the for the permitted use amount of radioactive materials. (Note: TOT_L_AMT = permitted use amount of radioactive material licenses in a region; lagged TOT_L_AMT = the average permitted use amount of radioactive material licenses in the neighboring regions of a region).
Sustainability 14 00966 g008
Figure 9. Moran’s I Test Statistics, LISA and Box Plot maps for the permitted use amount of radioactive materials excluding industrial use.: (a) Moran’s I Scatter Plot for the permitted use amount of radioactive materials excluding industrial use (Moran’s I = −0.015); (b) Reference distribution for Moran’s I (pseudo p-value = 0.368490); (c) LISA map for the permitted use amount of radioactive materials excluding industrial use; (d) Box Plot map for the permitted use amount of radioactive materials excluding industrial use. (Note: TL_A_EX_IN = permitted use amount of radioactive materials excluding industrial use in a region; lagged TL_A_EX_IN = the average permitted use amount of radioactive materials excluding industrial use in the neighboring regions of a region).
Sustainability 14 00966 g009
Figure 10. Moran’s I test statistics for the permitted use amount of radioactive materials excluding both industrial use and high-risk facilities. (a) Moran’s I scatter plot for the permitted use amount of radioactive materials excluding both industrial use and high-risk facilities (Moran’s I = 0.105); (b) Reference distribution for Moran’s I (pseudo p-value = 0.008350). (Note: TAexIND_KI = permitted use amount of radioactive materials excluding both industrial use and high-risk facilities in a region; lagged TAexIND_KI = the average permitted use amount of radioactive materials excluding both industrial use and high-risk facilities in the neighboring regions of a region.).
Sustainability 14 00966 g010
Figure 11. LISA and Box Plot maps for the permitted use amount excluding both industrial use and high-risk facilities.: (a) LISA maps for the permitted use amount excluding both industrial use and high-risk facilities; (b) Box Plot maps for the permitted use amount excluding both industrial use and high-risk facilities; (c) Box Plot maps for the permitted use amount medical use. (Note: TAexIND_KI = permitted use amount of radioactive materials excluding both industrial use and high-risk facilities in a region; MED_L_AMT = permitted use amount of radioactive material for medical use in a region).
Sustainability 14 00966 g011
Table 1. Radiation accidents in the last 5 years (2016–2020) in Korea 1.
Accident TypeTheft/
Loss
Radiation ExposureRadioactive
Contamination
FireEquipment FailureRadiation
Release
ToxicGasTotal
Number of Accidents361532121
1 Nuclear Safety and Security Commission (2021).
Table 2. Number and amount of radioactive material license by use type in Korea (May 2021 1).
ClassificationPublicEducation and ResearchMilitaryIndustryMedicalTotal
Number of LicenseTotal996914121917345211,656
Excluded 6 regions44116348103
Sub Total952903115913944411,553
Amount of License (TBq)Total18,44464,8301727178,59843,516307,115
Excluded 6 regions0.006399.900.001441.9841.8
Sub Total18,44464,4301727178,59843,074306,273
1 The raw data are as of 10 May 2021. Source: ‘the radiation safety information system’ of KINS.
Table 4. Excluded facilities for industrial use and outliers with high risks in Korea (over 111 TBq).
ClassificationNumber of LicensesAmount of Licenses
NumberShare (%)Amount (TBq)Share (%)
Total Licenses11,553100306,273100
Excluded LicensesIndustrial913979.1178,59858.3
Outlier Facilities
(>111 TBq)
Public20.018,2836.0
Education and Research100.163,47820.7
Military10.015970.5
Medical400.337,29712.2
Non-industrial Total530.5120,65539.4
Subtotal919279.6299,25397.7
Total Licenses in Analysis236120.470202.3
Table 5. Top ten regions with the highest radioactive material use amount in Korea.
RankTotal Amount (TBq)Excluding Industry1 Facility Permit>111 TBq Facility Excluded
RegionAmt.RegionAmt.RegionAmt.RegionAmt.
1Yeoju-si74,370Yuseong-gu47,102Yeoju-si74,000Ilsandong-gu, Goyang-si268
2Yuseong-gu63,724Gangneung-si25,933Hwaseong-si29,230Bundang-gu, Seongnam-si256
3Hwaseong-si30,377Gyeongju-si18,225Gangneung-si25,921Seongbuk-gu248
4Gangneung-si25,933Jeongeup-si17,601Yuseong-gu22,641Seo-gu (Busan)229
5Gyeongju-si18,229Jongno-gu1619Gyeongju-si18,130Namdong-gu223
6Jeongeup-si17,849Nowon-gu1388Jeongeup-si17,587Dong-gu (Gwangju)187
7Gijang-gun15,175Gangnam-gu1093Gijang-gun14,800Jung-gu
(Daejeon)
177
8Jongno-gu13,498Songpa-gu1020Yuseong-gu14,467Gangdong-gu172
9Seocho-gu5794Seodaemun-gu659Jongno-gu11,470Bucheon-si150
10Gangnam-gu4523Bundang-gu, Seongnam-si548Yuseong-gu11,174Chuncheon-si148
Table 6. Six KINS regional office candidate locations with their permitted use amounts.
Geographic
Division
Candidate LocationsNote
RegionAmount (in TBq)
SMAIlsandong-gu, Goyang-si268SMA—North
Bundang-gu, Seongnam-si256SMA—South
ChungcheongJung-gu, Daejeon186KINS Main Office
GyeongsangSeo-gu, Busan229-
JeollaDong-gu, Gwangju187-
GangwonChuncheon-si150-
Publisher’s Note: MDPI stays neutral with regard to jurisdictional claims in published maps and institutional affiliations.

