Article

The Carbon Inventory of the Reuse Phase’s Life Cycle: The Example of the Reconstruction of a Zero-Carbon Campus on an Unused Military Camp

1
Department of Architecture, National Quemoy University, Kinmen County 892, Taiwan
2
Department of Computer Science and Information Engineering, National Quemoy University, Kinmen County 892, Taiwan
*
Author to whom correspondence should be addressed.
Sustainability 2022, 14(3), 1064; https://0-doi-org.brum.beds.ac.uk/10.3390/su14031064
Submission received: 27 November 2021 / Revised: 6 January 2022 / Accepted: 13 January 2022 / Published: 18 January 2022
(This article belongs to the Special Issue Carbon Footprint and Sustainability Assessment)

Abstract

:
Quemoy University has taken over Cemetery 2 region after it was released by the military. It became the school’s other campus, with plans to change the site from an unused military camp to a sustainable campus. The finished project will include a carbon inventory of the buildings and landscape of the original camp, and overall campus planning and design. Incorporating the concept of applying GIS, the planning and survey data mentioned above will be used as the basis for the future research design and implementation. Aerial maps will be combined with cadastral and topographic maps to establish a basic evaluation resource map: a site plan map, data point map, building carbon footprint map, and route carbon footprint map. The main carbon hotspot of each building’s life cycle total carbon footprint is 549,293.14 kgCO2e/30 yr. Through putting solar panel systems on the buildings’ rooftops and the 30 year landscape carbon inventory principle of no disturbance as the carbon offset, the unused military campus will become a zero-carbon campus. The maps above will act as carbon diagnostics for future campus operation carbon footprint analysis and provide the current situation of the campus’s environmental sustainability and future visual scenario simulations, helping decision makers to build a sustainable campus environment strategy.

1. Introduction

1.1. Origin

The problem of carbon in the earth’s atmosphere has received much attention in recent years. To achieve low carbon emissions, we must understand energy sources and their carbon emissions. The majority of carbon emissions come from burning fossil fuels for energy. Schools are an important component of society. They have the special duty of promoting environmental education and life-long learning, yet are also an occupancy system that consumes resources and energy. Thus, it is necessary to research approaches to designing a school campus environment based on sustainability and provide scientific guidelines for the sustainability of society. On a global scale, universities possess both large populations and a great potential for sustainability [1]. Therefore, encouraging universities to take part in low carbon emissions programs to accomplish the goal of campus sustainability and reduce carbon emissions will be beneficial for global sustainability.

1.2. Objective

The purpose of this research was to improve the sustainability of Kinmen County in Taiwan, which consists of the major island of Kinmen and its associated islets, and to generate ideas for reducing waste and energy use. We intend to use the unique resources of the island—its extensive unused military facilities—to achieve the sustainable goal of combining environmental protection and education [2]. There are various approaches to reactivating and reusing old military facilities to develop Kinmen into a low-carbon demonstration island. Quemoy University has taken over the Cemetery 2 camp released by the military, making it into the Zhongshan Forest campus. With the increasing resource and energy consumption of university campuses, and the resulting pollution, campus sustainability is becoming an increasingly important issue. Using an innovative idea that integrates Kinmen island’s development, low-carbon development, and old military facilities, we propose a low-carbon campus. In addition, because universities are “micro cities”, the environmental assessment process of university campuses is similar to that of cities [3], and the need for an environmental assessment process similar to that of cities has become a topic of concern for many universities.

2. Literature Review

2.1. Cases of Reactivating and Reusing Military Facilities in Both Local and Foreign Countries

Germany makes a useful comparison, since it, like Kinmen, has plenty of unused military bases left over from the Cold War. The campus of Trier University in Germany served as a backup hospital for the US army until 1992. In 1993, the state government decided to reconstruct it as an environmental campus in Birkenfeld for the university, with zero emissions as its core value. It has now been successfully turned into a CO2-neutral campus (Figure 1). Furthermore, combining environmental sustainability, economic effects, and social justice, it has become one of the top 10 most environmentally friendly universities in the world.
A successful case of military facility reuse within Taiwan is that of Chenggong base, located at the bottom of Bagua Mountain in Changhua County in central Taiwan. It used to be an army force base of about 14 acres, a training camp for artillery and infantry. In 1993, after the troops left, the military base was taken back by the county government. The county government actively re-planned and reused the base. In 2002, it was officially categorized as a Green Environment Learning Base (Figure 2). In 2003, its Geomorphic Transformation, Urban and Rural Style Demonstration Project was selected as number two in Taiwan by the Ministry of the Interior and was funded by the Central Government [4]. Though its environmental development is similar to the proposals in this research, the cultural connotation was not emphasized.

2.2. Cases of Low-Carbon School Campus Development

In 1972, the Stockholm Declaration stressed the sustainability of higher education. The declaration confirms the relationship between the environment and humans. It also advocates the importance of environmentally sustainable development for universities. In 1990, the managers of around 300 higher education institutes (HEIs) from 39 different countries/areas of five continents signed the Talloires Declaration. This is a ten-point plan that calls for sustainability and environmental education to be integrated into research, education, campus management, and social advocacy. In 1993, the Swansea Declaration called for universities to measure their own sustainability and their off-campus contribution to sustainability [5,6]. This effort should include: (a) reducing the negative influences the campus has on the environment, working with both private and public facilities and organizing community cooperation in order to deploy and implement sustainability [7]; (b) producing knowledge and innovative technology to help search for solutions for global environmental issues [8]; and (c) equipping the leaders, companies, facility managers, and entrepreneurs of the future with the competitive strengths to create a more sustainable community [9]. The American College and University Presidents’ Climate Commitment (ACUPCC) was established in 2006. It is being built upon a university network, sharing information about climate change and greenhouse gas emissions. It provides a framework for universities to formulate climate-neutral plans and practice. ACUPCC can help universities adopt measures to counteract climate change (ACUPCC). In Canada, Ontario State University has been actively adopting measures to counteract climate change by integrating knowledge about sustainability and climate change into university operations and in off-campus activities. Queen’s University has set a goal of reaching carbon neutrality by 2040. It has also established a low-carbon solution program. With 2008 as its base year, the university should reduce its carbon footprint by 35% by 2020 and 70% by 2030 [10]. The Association for the Advancement of Sustainability in Higher Education (AASHE) is a non-government organization that takes part in education activities. Providing information and activities related to sustainability, it also supports facilities and individuals in sharing this information, and provides follow ups, assessments, and rating systems for sustainability (STARS) [11]. The U.S. Green Building Council (USGBC) has come up with The Green Building Certification Program, known as Leadership in Energy and Environmental Design (LEED). It is the world’s most-used green building evaluation system. LEED fits almost every type of building, providing a framework for healthy, high-efficiency, and reduced cost green buildings (USGBC). The International Sustainable Campus Network (ISCN), a forum of universities around the world, promotes network building and cooperation between universities and assists in the development of sustainable campuses (ISCN).
Habib et al. (2016) discussed how universities and other higher education facilities should consider sustainability, arguing that the universities of Saudi Arabia have been insufficiently focused on sustainability relative to universities elsewhere [12]. Lauri et al. (2015) explored comprehensive sustainability plans for higher education facilities such as universities. They found that many universities have plans that emphasize the environment instead of society, the economy, and campus life [13]. According to Dalal-Clayton and Bass, there are three main methods for sustainability assessment [14]: (1) indicator-based assessments; (2) narrative assessments; and (3) accounts of sustainability status. Lukman et al. noted that because indicator-based assessments are more objective and transparent, they are easier to measure and have a higher performance [15]. In addition, Habib et al. also proposed integrating GIS into the campus sustainability assessment and integrating the sustainability assessment indicators of the campus into its spatial domain [16,17,18].
The research above emphasizes the importance of having a sustainable campus. Because universities are similar to “micro cities”, the environmental assessment process of university campuses is similar to that of cities [16]. Hence, this study applied GIS and spatial dimension concepts to sustainability assessment of the campus life cycle carbon inventory.

3. Methodology

Beginning in 1992, the military gradually released a large number of unused military bases in Kinmen. Quemoy University took Cemetery 2 as its second campus (Figure 3). It is about 3.1 hectares in area and contains numerous abandoned camps and forts. The university is reactivating and reusing its unused military bases in accordance with its low carbon strategy and rebuilding the Zhongshan Forest campus to achieve a zero-carbon campus goal. The expected accomplishments include the carbon inventory of many old buildings in the base and original landscape of the base, a low-carbon rebuild of the buildings in the base, and overall campus design and planning. Combining the GIS method to link the geographical location of land on the base with its use and related data will provide a basis for actual implementation [19]. The plan also calls for using a cadastral map and topographic maps to build up a basic picture of information, including a site plan map, data point map, a building carbon footprint map, and a route footprint map. The building carbon footprint map includes energy consumption, water resource consumption, and waste management [20]. The listed maps will be helpful in analyzing the future campus’ carbon footprint hotspots (carbon diagnostic) and in providing a simulation of the current and future campus’ sustainability. They will also help decision makers construct a strategy for the campus’ sustainable development.

3.1. Sustainable Campus Reconstruction Evaluation and Scheme

Assessing the effects of university operations and establishing the goal of reducing universities’ CO2 emissions is a way to measure the sustainability of a campus, reduce the campus’s carbon emissions, and reduce its effects on global sustainability [16]. Further, school faculty, teachers, and students should implement low-carbon education, a critical factor in improving the campus’ environment.

3.1.1. Current Situation of Base and Assessment Concept

Because of its unique geographical location and historical background, Kinmen has many military facilities. However, after the troop reductions in 1997, overall troop numbers have fallen. Thus, in recent years, the military has returned a great number of facilities. Quemoy University has taken over camps released by the military; there are many abandoned camps and forts (Figure 3). The university plans to use a low-carbon method to turn the unused base into a sustainable campus, and develop maker courses that contain local characteristics. In 2025 three departments will move in, with the campus able to accommodate 100 students and 30 staff members. Students can research, develop, and experiment with low-carbon reconstruction of the base’s buildings. This will also provoke students’ interest in hands-on creation and revitalization and reuse of unused bases.

3.1.2. Concept of Sustainable Campus Evaluation

This research formulated the base environment related to the overall energy strategy of the campus for sustainable campus assessment and created evaluation indicators and matching drawings. Table 1 lists the departments that might move into the Zhongshan Forest Campus and the land use. The data shown are suitable for evaluation standards, including information on basic campus land use, building materials usage, energy consumption, and waste management. The information and data are presented as dots in Figure 4. The university campus covers an area of about 3.1 hectares, and currently the land area of the old campsite station is less than one fifth. Figure 5 shows the planning of the usage of the area through a configuration diagram of academic units. The area data for each department includes the attribution type of the building. The area covers the specific buildings designated by the school and their functions, and their floor area and attributes, such as laboratory or research offices, are important sources of data for the outdoor carbon inventory analysis.

3.2. Carbon Inventory of Architecture and Landscape Life Cycle

The Building Carbon Footprint evaluation method (BCF) uses the LCBA to calculate the Total Carbon Footprint (TCF) of the life cycle of a building. The BCF is established using the theory of Life Cycle Assessment (LCA). The evaluation covers a five-step life cycle: (1) the carbon emissions of new construction materials (CFm); (2) the carbon emissions of the construction (CFc); (3) the carbon emissions of the usage of the building (CFeu); (4) the carbon emissions of repair and renewal (CFrm); and (5) the carbon emissions of dismantling (CFdw). The BCF is a method using a series of Taiwan building materials, the usage of buildings, energy statistical data, and a carbon exclusion theory estimation formula to simulate the carbon footprint. In addition, all of its materials, engineering sub-items, energy calculation, climate conditions, simulations of building usage, and categorization of the building space are based on rigorous investigation by local industries and academic research results [21].

4. Results

4.1. Carbon Emission Analysis of the Different Stages of a Building Reuse

For the carbon emissions calculation of each stage of the building life cycle, this research used LCBA-Neuma, a database of building materials’ carbon emissions [22]. The database refers to the database of Taiwan local building materials established on the principle of PAS2050. It includes the carbon emissions data of building materials, the building’s finishing materials, and the building’s structural system. The standards for the building’s life cycle (Life Cycle, LC) refers to the Carbon Footprint Product Category Rules-Buildings published by the Environmental Protection Administration (EPA) of the Executive Yuan in 2015.
An example of the procedure is the calculation for the newly built RC structure, which has a life cycle of 60 years. Old buildings undergo numerous deterioration diagnostics after 15 years of life [23]. This will be used on the existing buildings at the base. A second deterioration diagnostic, with a total of 30 years, is defined as the life cycle limit. Thus, the building life cycle’s total carbon footprint (Total Carbon Footprint, TCF) in this research’s case is 30 years (Table 2) [21,24]. The building’s CFeu is the majority of the life cycle’s total carbon emissions, as shown below.
In this study, a total of six buildings were proposed to be reused as school building; four of the old camp buildings were proposed to be used as school buildings. All calculations were calculated separately for each building, and then the total carbon emissions of the five stages of the building life cycle for the whole district were calculated. The area, main structures, and the number of floors of each building are shown in Table 3.
(a) 
Total carbon footprint of new building materials CFm = CFs + CFns + CFe + CFin = 285,226.87 kgCO2e/30 yr
The total carbon emissions includes the materials needed to construct the building and the energy consumption from retrieving raw materials, transportation to the factory, production in the factory, and transportation to construction site: the carbon footprint of building structure materials (CFs), the carbon footprint of equipment and installation materials (CFns), the carbon footprint of the equipment (CFe), and the carbon footprint of interior materials (CFin). The respective calculations are given below:
(1) 
Carbon footprint of building structure (CFs) = 1.19 × [(Cs × W + Cb) × Bc + Cw] × Lcr = 167,526.09 kgCO2e/30 yr
CFs are the carbon footprint of the main structural engineering materials, including the carbon footprint of the structural engineering materials such as columns, beams, and floors. Cs is the upper structure, Cb is the lower structure, and Cw is the outer wall structure. Cs and Cb were calculated based on floor area, number of floors, and seismic force coefficient, while the CFs corrected calculation was based on its structural coefficient W and life cycle carbon reduction coefficient LCr.
We then calculated the Cs, Cb, and Cw of each building based on the floor area, number of floors, and structure of each building as shown in Table 1, without using blast furnace cement (Bc = 1). The exterior wall building is proposed to use a masonry structure in the building body (W = 1.5). The design seismic force coefficient Z was 0.0881, based on the area where the building is to be located in Kinmen County. The life cycle carbon reduction factor LCr (1.0 if there is to be no longer-life design) could be increased or decreased based on environmental effects (air pollution, salt damage, vibration), durable design, and high-quality construction. In this case, the LCr value was 1. After calculating the CFs of each building individually, they summed to 167,526.09 kgCO2e/30 yr.
(2) 
Carbon emissions of non-structural materials (CFns) = CFow + CFw + CFiw + CFf + CFr = 37,973.91 kgCO2e/30 yr
CFns includes carbon emissions from the exterior wall and exterior engineering materials (CFow, 8529.40 kgCO2e/30 yr), carbon emissions from exterior window engineering materials (CFw, 3716.90 kgCO2e/30 yr), carbon emissions from the interior partition wall engineering materials (CFiw, 4614.47 kgCO2e/30 yr), carbon emissions of materials for interior floor decorations (CFf, 11,889.32 kgCO2e/30 yr), and carbon emissions of materials for exterior roof decorations (CFr, 9223.82 kgCO2e/30 yr).
(3) 
Equipment engineering materials carbon emissions (CFe) = CFac + CFe1 + CFe2 + CFe3 + CFt = 79,296.95 kgCO2e/30 yr
Equipment engineering materials include the carbon emissions of air conditioning engineering materials (CFac, 1404.71 kgCO2e/30 yr), electrical equipment engineering materials (CFe1, 70,203.23 kgCO2e/30 yr), water supply and drainage equipment engineering materials (CFe2, 7689.01 kgCO2e/30 yr), and fire-fighting equipment. In total there would be five types of engineering materials (CFe3, 0 kgCO2e/30 yr), along with the carbon emissions of the transportation equipment engineering materials (CFt, 0 kgCO2e/30 yr). Among these, CFac and CFe1~3 were estimated by multiplying the floor area by the carbon emissions coefficient of each pipeline [21]. The air-conditioning equipment in this case was estimated based on window-type air-conditioning, while CFe3 was not calculated because the one-story building would not need to be equipped with fire lines. CFt was estimated based on elevator materials, dimensions, materials, and the number of motors [21,25], but since there is to be no elevator or escalator, the value of CFt was 0 kgCO2e/30yr.
(4) 
Carbon emissions of the interior decoration materials (CFin) = 1.0 × AFIi = 429.92 kgCO2e/30 yr
The calculation of the carbon emissions (CFin) of the rough decoration project included only a simple indoor painting project when the building is to be handed over, and its unit carbon footprint would be about 1.0 kgCO2e/m2 [21]. It was calculated separately based on the floor area AFIi of each building. CFin = 429.92 kgCO2e/30 yr.
(b) 
Total carbon footprint of building construction CFc = (0.286 + 0.589 × S + 1.327 × Sb) × AF × (1 + CFrm/CFm) × LCr = 466.51 kgCO2e/30 yr
CFc includes new construction and renovation, estimated by the number of building floors, floor area, and building carbon emissions density. Since it includes two phases of construction and renovation, it was assumed that the two are directly proportional. We multiplied (1 + CFrm/CFm) to obtain it [21,26].
(c) 
Total carbon footprint of energy use during post-construction operation CFeu = CFa + CFl + CFel + CFv + CFwt + CFtr + CFg = 357,328.07 kgCO2e/30 yr
CFeu includes the carbon emissions of the air-conditioning energy consumption (CFa), lighting energy consumption (CFl), electrical appliances energy consumption (CFel), ventilation energy consumption (CFv), sewage energy consumption (CFwt), and transportation. These calculations included simulated carbon emissions of the six types of equipment and their energy consumption (CFtr) and heating (CFg). The carbon emissions factor β of the electricity in this item was calculated based on the unit carbon emission factor of 0.509 kgCO2e/kWh announced by the Bureau of Energy of the Ministry of Economic Affairs (2020) in 2019 [27]. Among these, CFtr and CFg were both 0 kgCO2e/30 yr because there is no elevator and heating equipment is not used.
The energy consumption of CFa, CFl, and CFe were calculated with reference to the Green Building Evaluation Manual-Basic Dynamic EUI Index Method [28]. The EUI index in this case is divided into the 10HR school classroom space-high school classroom above, the 10HR administrative office space and the 24 h non-air-conditioning space/24 h mechanical ventilation space. We then multiplied these by the corresponding area, promised energy saving potential, electricity carbon emissions, and other coefficients to calculate the 30 year carbon emissions during the use stage. CFa, CFl, and CFel were 101,856.64 kgCO2e/30 yr, 151,732.34 kgCO2e/30 yr, and 64,884.83 kgCO2e/30 yr, respectively. Ventilation energy consumption (CFv) represents the carbon footprint of the energy consumption of the ventilation equipment in the indoor parking lot and bathroom space. This case would have a public bathroom space of 32.42 square meters and no indoor parking lot. The CFv would be 22,608.81 kgCO2e, calculated based on the ventilation volume benchmark of 30 years.
Carbon emissions for sewage energy consumption (CFwt) = Wt × β × LC = 16,245.45 kgCO2e/30 yr, of which the annual sewage power consumption Wt were calculated based on the following parameters: (1) the area of each building AFIi, personnel density pdi, and operations. The annual water consumption per person in the space (Qwi) was used to estimate its total annual water consumption, as shown in Table 4; (2) assuming the full use of water-saving toilets and water-saving hydrants, water saving efficiency Rw = 0.65; (3) lifting water density (EWp) as calculated as 0.06 based on the floor height; and (4) a rainwater recovery system is not to be adopted (qrw = 0). Wt = [Qw × Ewp + (Qw − 365 × qrw) × Ewt] × Rw = 1063.88 kWh/yr.
(d) 
Total carbon footprint of renovation and repair (Table 2) CFrm = Cfns + CFe = 67,834.41 kgCO2e/30 yr
The total carbon emissions of the repair and renewal stage (CFrm) were calculated by the total carbon emissions of the new construction materials (CFm) for each sub-item of non-structural materials (CFns) and equipment engineering materials (CFe), multiplied by each sub-project in the life cycle. The number of updates (RT) was calculated, following Lin Xiande (2018). The six buildings were calculated based on their non-structural materials and equipment engineering materials. The CFrm would be 32,181.73 kgCO2e/30 yr for the building of Department of Sports and Leisure and 16,836.27 kgCO2e/30 yr for the building of Department of Food Science. The building of Department of Architecture-a would produce 5003.90 kgCO2e/30 yr, the building of Department of Architecture-b would produce 4286.85 kgCO2e/30 yr, the electromechanical room would produce 4383.49 kgCO2e/30 yr, and the toilet would produce 5142.17 kgCO2e/30 yr.
(e) 
Total carbon footprint of demolition and waste disposal (CFd + CFwa) × (1.0 + CFrm/CFm) × LCr = 9724.89 kgCO2e/30 yr
We included carbon emissions simulation calculations for the energy consumption of the demolition project (CFd) and demolition and waste disposal (CFwa). The CFdw would be: transportation system 4791.01 kgCO2e/30 yr, food system 3091.68 kgCO2e/30 yr, building system-a 488.23 kgCO2e/30 yr, building system-b 426.17 kgCO2e/30 yr, electromechanical room 473.44 kgCO2e/30 yr, and toilet 454.36 kgCO2e/30 yr.
(f) 
Self-evidence of carbon reduction CFo = 171,287.61 kgCO2e/30 yr
Zhongshan Forest Campus will recycle the old camp building as the school building, and retain the original main structure and partition walls of the original building. Only the food department and the transportation department will add partition walls to the school building. Therefore, we calculated the old building with reference to CFs and Cfiw. The carbon reduction Cfo of this reuse would be 171,287.61 kgCO2e/30 yr.
(g) 
Life cycle total carbon emissions TCF = CFm + CFc + CFeu+ CFrm + CFdw-CFo = 549,293.14 kgCO2e/30 yr
Based on the above method, the total carbon footprint (TCF) of the 30-year building life cycle in this case was estimated to be 549,293.14 kgCO2e/30 yr.
The reason for this carbon inventory was to diagnose the carbon hotspot of each stage of each building in advance. When designing energy saving buildings and revising equipment in the future, we can focus on each stage’s carbon emissions and implement carbon offset measures to reach carbon neutrality.

4.2. Environmental Landscape Carbon Inventory

The carbon inventory of the outdoor environmental landscape of the Zhongshan Forest Campus in this project was based on the Landscape Construction Carbon Footprint Evaluation System (LCF) developed by the Low Carbon Building Alliance (LCBA) and the Carbon Footprint Evaluation System announced by the Environmental Protection Agency of Taiwan in 2017. The Footprint Product Category Rule (CFP-PCR)-Landscape Project was calculated and estimated with reference to the LCBA-Neuma carbon emissions database. Based on the above method, the survey boundary of the landscape engineering carbon footprint of this study was evaluated across the following nine landscape facilities: driveway parking lot, trail square, plank road and platform bridge, earthwork drainage, soil retained, water bodies, structural landscape, lighting and irrigation, and planting greenery.
The landscape carbon footprint assessment was based on the five phases of the landscape engineering life cycle, including the raw material acquisition phase of the new construction, the construction phase, the use phase, the repair and renewal phase, and the demolition and waste and resource treatment phase. The life cycle standard referred to the standard of high-loss landscapes (public park landscapes) and set the life cycle of the outdoor space in the Zhongshan Forest Campus as 30 years. The assessment results are presented as a 30-year total carbon footprint (kgCO2e) and carbon footprint indicators (kgCO2e/m2yr). The carbon inventory uses existing and future new rut roads and parking lots as the calculation objects. In addition, trees and shrubs are to be planted in a composite manner. Further, because of the addition of the construction department in 2025, more night lighting will be installed. The base area of the whole district will be 30,957 m2. Most of the existing plantings in the base will be preserved, all of which will be multi-layered plantings of trees and shrubs. The green area will be 27,276 m2. The pavement on the campus will simulate the rut form of the previous Cold War period (Figure 6), meaning that the cement usage will also be reduced. The long grass in the middle could also affect the microclimate of the area. The new artificial paving area for driveways, parking lots, and squares will be 2595 m2, and night lighting facilities will be added. Based on this calculation, the landscape construction and renovation project materials will include three major materials—artificial paving, lighting and watering facilities—while daily energy consumption will include lighting, watering, planting and fertilizing. The calculation of multi-layered planting in the whole area was per square meter, based on a fixed carbon equivalent of meters of 2.00 kgCO2e/m2yr [29]. The total emissions of environmental landscape carbon inventory for newly-built rut roads, parking lots, compound tree planting and night lighting in the campus would thus be −760,940.01 kgCO2e/30 yr (Table 5).

4.3. Sustainability Assessment of Campus Operations

In this section, the largest carbon emissions stage of the building’s life cycle, the usage stage, is analyzed.

4.3.1. Energy Consumption (CFa, CFl, CFel)

An academic campus consumes large amounts of energy, leading to CO2 emissions. Monitoring and categorizing energy consumption is thus critical. It helps ensure the identification of the main areas with the most energy consumption, and supports the use of carbon offset measures.
Figure 7 shows the plans for the hotspot for each academic buildings’ CO2 emissions in the Zhongshan campus. The currently confirmed departments are the Food Science and Sports and Leisure departments, each with differing levels of carbon emissions. The hotspots in the figure are located based on the interviews done with the two departments to understand their future plans for space usage, equipment, and function, covering their laboratories, administrative spaces, and classrooms. Two buildings were assigned to the Sports and Leisure department and Food Science department in 2021, while two other buildings will be assigned to the Architecture department in 2026. The floor area will increase from 343.3 m2 to 384.55 m2. However, since the overall carbon inventory was calculated based on the 30-year life cycle of the buildings, the total carbon emissions, calculated through EUI, of the main electricity consumption of CFa, CFl, and CFel would be 318,473.81 kgCO2e/30 yr (Table 2 and Table 3). Therefore, the combination and analysis of the spatial scale and energy consumption of the area helps identify and continuously monitor the potential areas of high energy consumption and low energy consumption. This will reduce energy consumption by using carbon offset methods such as energy-saving equipment, reducing costs.

4.3.2. Carbon Footprint of Water Treatment (CFwt)

Because of the small size of the Kinmen area and the lack of high mountains to conserve water, the reservoirs mainly collect and store rainwater in the catchment area during the rainy season and use it as raw water for the tap water purification plants. In addition, since the water quality in existing lakes and reservoirs is poor, the local area has long relied on groundwater. In recent years, there have been signs of groundwater depletion. Kinmen has been actively developing the tourism industry in recent years, worsening the problem of water supply and demand.
The average per capita water use in the Kinmen area is only 129 L a day, which is less than half the national average. Residential buildings have a reasonable baseline of 250 L of water per person per day. Most other types of buildings are calculated based on the effective floor area of the unit. For the CFwt, there were two academic buildings in 2020, although another two buildings will be added after 2025. The overall carbon inventory was still calculated based on the 30-year life cycle of the buildings, giving CFwt = 16,245.45 kgCO2e/30 yr (Table 2 and Table 4).

4.3.3. Waste Management (CFwm)

As far as university campuses are concerned, waste mainly comes from buildings such as classrooms and laboratories. The nature of the waste generated varies greatly from daily use to academic use. Continuously reviewing the generation of various wastes from different regional uses can provide insights into waste reduction. For example, when combined with location confirmation, the quantitative value can clearly show the amount of waste generated per capita and help determine the ideal strategy to reduce the amount of waste generated on the campus. This helps reduce pollution caused by solid waste transportation and incineration, improving environmental sustainability. In Kinmen County, the average daily general waste generation per person is 0.588 kg (EPAEY). This standard is used to calculate the amount of solid waste generated by the campus. As initially planned in 2020, the campus can accommodate about 100 students and 30 faculty members. The total amount of waste generated per day would thus be about 76.44 kg. According to the emissions parameters of waste production in Table 6 of 0.79–1.16 kgCO2e/kg [30], the annual emissions of the overall campus were 22,041.47 kgCO2e/yr in 2020. After 30 years, it will increase to CFwm = 661,244.10 kgCO2e/30 yr. These data are convenient for understanding the number of garbage truck trips. They can also be used to simulate reductions in both waste and garbage truck trips.

4.3.4. Carbon Footprint of Transportation System (CFts)

Different types of transportation make different emissions contributions to the campus environment. The Zhongshan campus only allows ambulances and large trucks to come in. During usual hours, there is a parking lot and charging stations for cars and scooters next to the entrance. Intra-campus transportation will primarily be on foot or electrically powered bicycles. Because the distance between the main campus and Zhongshan campus is approximately 3 km, the school provides two medium-sized electrically powered buses to commute between the two campuses every hour from 7:30 a.m. to 17:30 p.m., or 18 bus rides. Their electricity consumption per kilometer is 1.39 kWh/km [31]. Using this emission standard, the total annual emissions of the transportation system is CFts = 13,945.02 kgCO2e/yr, which will increase to 418,350.69 kgCO2e/30 yr after 30 years.

5. Discussion

In this research, energy consumption, water consumption, waste management, and transportation were combined to determine the overall emissions benchmark on the campus, and the above data was integrated with the space, location, and data of campus land and building use. All data was converted into identical carbon emission units as the basis for the reference comparison. The building life cycle carbon footprint energy consumption, transportation service emission, waste generation, and water consumption were all converted into greenhouse gas emission factors [32], enabling visualization of the GIS mode in the configuration diagram of the campus in 2026 (Figure 8). This permitted a display of the development of the overall campus sustainability assessment and the emission hotspots of the campus for the 30 years to come. Table 6 shows the indicator data related to the campus operation and management. Integrating this data into the campus sustainability assessment is critical. Therefore, the carbon inventories of the old buildings in the base and the landscape of the original camp are important.
Table 7 shows the calculations of the energy consumption and operation of the planned land and buildings in 2020. As this chapter has described, these items represent a vital evaluation index of campus operation sustainability. Table 7 presents the scale of campus CO2 emissions, which must be reduced to promote the sustainability of the campus environment.
In addition, for low-carbon campuses, carbon offset measures are carried out for the total carbon emissions generated by the remodeling of the campus and the reuse of various buildings described in this research. The average annual carbon footprint of the overall campus is to be TCF + CFwm + CFts = 1,628,887.93 kgCO2e/30 yr. For the existing campus food department and transportation department building roof area, a 62kWep solar photovoltaic system can be built, deducting 112,935.68 kgCO2e/30 yr monocrystalline photovoltaic system production and construction and 20 years of updated carbon emissions, according to the carbon emission coefficient 0.509 kgCO2e/kWh [27]. The calculated carbon reduction in 30 years was 923,744.62 kgCO2e/30 yr, which can compensate for more than 56.71% of the carbon footprint of the entire campus. In addition to the roof carbon offset measures in the low-carbon renovation of the campus in the next 5 years, vertical greening and permeable paving can be used on the walls of the building and floors of the outside respectively, to enable earlier completion of the campus as a whole. This can move the campus towards a carbon-neutral, even zero-carbon campus.

6. Conclusions

Based on the carbon footprint generated by the traditional campus model operation, a data structure that can collect, store, analyze, and display university campus geographic and non-geographic data from multiple sources was established based on the carbon inventory, which could then be merged and integrated. This could organize and manage the database used for application and input into the campus emissions evaluation for development of a carbon neutral strategy. Furthermore, it could be used to develop a database of environmental sustainability indicators and incorporate GIS data to make special maps to visualize the sustainability status of the campus.
The database and evaluation indicators provide comprehensive information related to the campus environment and operations (for example, energy and water use, transportation, and waste management), which can be updated regularly to evaluate the campus’ sustainability. The database helps to continuously monitor the sustainability of the campus, while reducing the cost of the campus sustainability assessment process. In the previous section, the existing environmental sustainability status was mapped and its visualization characteristics were established, enabling prediction of future states. After implementing the low-carbon strategy, we can compare the situation with the evaluation indicators. This shows another advantage of the valuation indicators. The visualization function of each map provides university administrators with a clear picture of the progress or decline of the environmental sustainability of the campus, and highlights potential hotspots in the campus, thus performing a carbon diagnosis.
The assessment can be improved. In visualizing the environmental sustainability of the campus, it will become necessary to provide opportunities to inspect various projects. This visualization will help in selecting carbon offset strategies that can produce the best results in reducing emissions from campus operations. Finally, achieving overall environmental sustainability on this campus may help decision makers design strategies to improve the environmental sustainability of university campuses.

Author Contributions

Data curation, H.-C.L.; Writing–original draft, H.-Y.L. All authors have read and agreed to the published version of the manuscript.

Funding

This work was supported by the Environmental Education and Low Carbon Island Research Center at National Quemoy University, grant number: RP-546-4838-0903.

Institutional Review Board Statement

Not applicable.

Informed Consent Statement

Not applicable.

Data Availability Statement

The data are available at the office of the Environmental Education and Low Carbon Island Research Center at National Quemoy University.

Conflicts of Interest

The authors declare that they have no conflict of interest.

References

  1. Rappaport, A. Campus Greening: Behind the Headlines. Environ. Sci. Policy Sustain. Develop. 2008, 50, 6–17. [Google Scholar] [CrossRef]
  2. Tyedmers, E.; Malik, A.; Fry, J.; Geschke, A.; Yousefzadeh, M.; Lenzen, M. Sustainable development opportunities in small island nations: A case study of the Cook Islands. J. Clean. Prod. 2020, 277, 123045. [Google Scholar] [CrossRef]
  3. Alshuwaikhat, H.M.; Abubakar, I.R.; Aina, Y.A.; Adenle, Y.A.; Umair, M. The Development of a GIS-Based Model for Campus Environmental Sustainability Assessment. Sustainability 2017, 9, 439. [Google Scholar] [CrossRef] [Green Version]
  4. Hsu, C.L. In Reuse of Space to Military Facilities—A Case Study of Dapeng Bay Military Camp. Master’s Thesis, University of Kaohsiung, Tainan, Taiwan, 2007. (In Chinese). [Google Scholar]
  5. Lozano, R.; Lozano, F.J.; Mulder, K.; Huisingh, D.; Waas, T. Advancing higher education for sustainable development: International insights and critical reflections. J. Clean. Prod. 2013, 48, 3–9. [Google Scholar] [CrossRef]
  6. Ferrer-Balas, D.; Buckland, H.; de Mingo, M. Explorations on the University’s role in society for sustainable development through a systems transition approach, Case-study of the Technical University of Catalonia (UPC). J. Clean. Prod. 2009, 17, 1075–1085. [Google Scholar] [CrossRef]
  7. Disterheft, A.; da Silva Caeiro, S.S.F.; Ramos, M.R.; de Miranda Azeiteiro, U.M. Environmental Management Systems (EMS) implementation processes and practices in European higher education institution—Top-down versus participatory approaches. J. Clean. Prod. 2012, 31, 80–90. [Google Scholar] [CrossRef]
  8. Townsend, J.; Barrett, J. Exploring the applications of carbon footprinting towards sustainability at a UK university: Reporting and decision making. J. Clean. Prod. 2015, 107, 164–176. [Google Scholar] [CrossRef]
  9. Abubakar, I.R.; Al-Shihri, F.; Ahmed, S. Students’ Assessment of Campus Sustainability at the University of Dammam, Saudi Arabia. Sustainability 2016, 8, 59. [Google Scholar] [CrossRef] [Green Version]
  10. The Road to Low-Carbon University Campuses (RLCUC). Council of Ontario Universities. 2017. Available online: http://www.cou.on.ca (accessed on 5 March 2020).
  11. Association for the Advancement of Sustainability in Higher Education (AASHE). Annual Report. 2014. Available online: http://www.aashe.org/files/aashe_annual_report_2014.pdf (accessed on 5 March 2020).
  12. Habib, M.A.; Adenle, Y.A.; Bilal, S. Sustainability Assessment of Higher Education Institutions in Saudi Arabia. Sustainability 2016, 8, 750. [Google Scholar] [CrossRef] [Green Version]
  13. Lauri, L.; Tarah, W.; Kate, S. Canadian STATS-Rated Campus Sustainability Plans: Priorities, Plans Creation and Design. Sustainability 2015, 7, 725–746. [Google Scholar]
  14. Dalal-Clayton, B.; Bass, S. Sustainable Development Strategies: A Resource Book; Earthscan Publications Ltd.: London, UK, 2002. [Google Scholar]
  15. Lukman, R.; Krajnc, D.; Glavic, P. University ranking using research, educational and environmental indicators. J. Clean. Prod. 2010, 18, 619–628. [Google Scholar] [CrossRef]
  16. Stylianidis, E.; Karanikolas, N.; Kaimaris, D. A GIS for urban Sustainability indicators in spatial planning. Int. J. Sustain. Dev. Plan 2012, 7, 1–13. [Google Scholar] [CrossRef]
  17. Abubakar, I.R. The role of GIS in the planning, implementation and management of university environmental management system—Case of KFUPM, Saudi Arabia. In Proceedings of the 2nd National GIS Symposium in Saudi Arabia, Dammam, Saudi Arabia, 23–25 April 2007. [Google Scholar]
  18. Ramya, S.; Devadas, V. Integration of GIS, AHP and TOPSIS in evaluating suitable locations for industrial development: A case of Tehri Garhwal district, Uttarakhand, India. J. Clean. Prod. 2019, 238, 117872. [Google Scholar] [CrossRef]
  19. Ghose, A.; Pizzol, M.; McLaren, S.J.; Vignes, M.; Dowdell, D. Refurbishment of office buildings in New Zealand: Identifying priorities for reducing environmental impacts. Int. J. Life Cycle Assess. 2019, 24, 1480–1495. [Google Scholar] [CrossRef]
  20. Lin, H.T. Construction Industry Carbon Footprint; Chan’s Arch-Publishing Co. Ltd.: Taipei, Taiwan, 2018. (In Chinese) [Google Scholar]
  21. LCBA-Neuma, Low Carbon Building Alliance (LCBA). 2013. Available online: http://www.lcba.org.tw/ (accessed on 1 March 2020).
  22. Architecture and Building Research Institute (ABRI). Green Building Evaluation-Building Renovation, Architecture and Building Research Institute; Ministry of the Interior: Taipei, Taiwan, 2019.
  23. Jafary Nasab, T.; Monavari, S.M.; Jozi, S.A.; Majedi, H. Assessment of carbon footprint in the construction phase of high-rise constructions in Tehran. Int. J. Environ. Sci. Technol. 2020, 17, 3153–3164. [Google Scholar] [CrossRef]
  24. Lin, Y.W. A Study on the Carbon Footprint Assessment of Building Transportation Equipment. Master’s Thesis, Cheng Kung University, Tainan, Taiwan, 2014. (In Chinese). [Google Scholar]
  25. Chang, Y.S. Life Cycle Assessment on the Reduction of Carbon Dioxide Emission of Buildings. Ph.D. Thesis, Department of Architecture, Cheng Kung University, Tainan, Taiwan, 2002; pp. 67–136. [Google Scholar]
  26. Bureau of Energy, Ministry of Economic Affairs 2019, Taiwan. Available online: https://www.moeaboe.gov.tw/ECW/english/home/English.aspx (accessed on 18 July 2020).
  27. Lin, H.T.; Lin, T.P.; Tsay, Y.S. Green Building Evaluation Manual—Basic Version. Architecture and Building Research Institute; Ministry of the Interior: Taipei, Taiwan, 2015; (In Chinese).
  28. Ministry of the Interior. Technical Specification for Greening Design of Building Base; Ministry of the Interior: Taipei City, Taiwan, 2019.
  29. Wang, Z.; Geng, L. Carbon emission calculation from municipal solid waste and the influencing factors analysis in China. J. Clean. Prod. 2015, 104, 177–184. [Google Scholar] [CrossRef]
  30. Huang, X.X.; Zhan, Q.W. Cost-Benefit Analysis of Electric Buses, Petrol-Electric Buses and Diesel Buses; Taipei City, Institute of Transportation: Taipei, Taiwan, 2014.
  31. Environmental Protection Administration. Executive Yuan (EPAEY), R.O.C. (Taiwan). Available online: https://erdb.epa.gov.tw/DataRepository/Statistics/TrashClearExecutiveProduce.aspx?topic1=%E6%B1%A1%E6%9F%93%E9%98%B2%E6%B2%BB&topic2=%E5%9C%B0&subject=%E5%BB%A2%E6%A3%84%E7%89%A9 (accessed on 18 July 2020).
  32. Walmsley, T.G.; Varbanov, P.S.; Su, R.; Ong, B.; Lal, N. Frontiers in process development, integration and intensification for circular life cycles and reduced emissions. J. Clean. Prod. 2018, 201, 178–191. [Google Scholar] [CrossRef]
Figure 1. Before and after reconstruction of Trier University campus in Birkenfeld. Photo credit: https://www.hochschule-trier.de/hochschule/hochschulportraet/geschichte. https://www.hochschule-trier.de/hochschule/hochschulportraet/drei-campus (accessed on 17 January 2022).
Sustainability 14 01064 g001
Figure 2. Exterior photo of the Chenggong Base site today (Photo credit: authors).
Sustainability 14 01064 g002
Figure 3. The location of the main campus of the university and the Zhongshan Forest campus (the second Cemetery camp) (a) and several unused military facilities (b,c) (Photo credit: authors).
Sustainability 14 01064 g003
Figure 4. Map of major emission points ( Sustainability 14 01064 i001
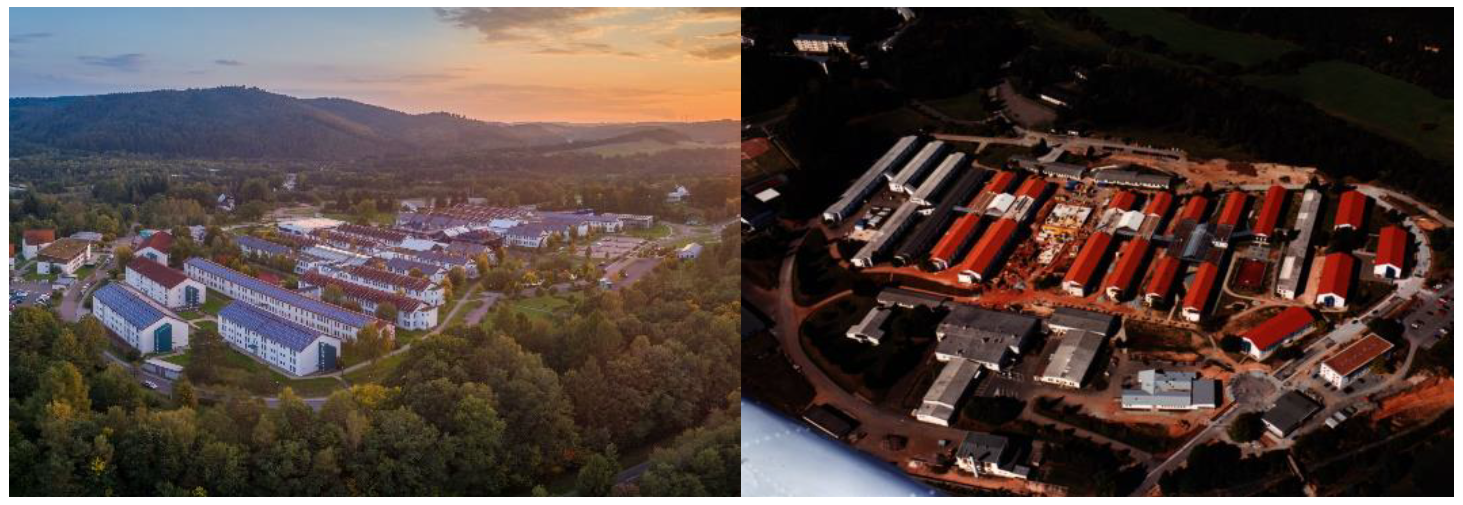
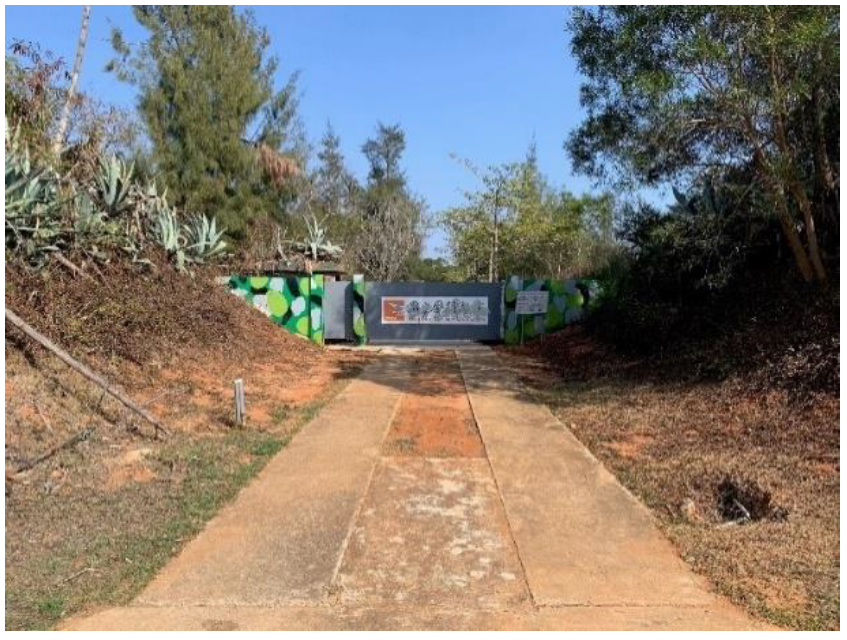
) on campus in 2021 (Photo credit: authors).
Sustainability 14 01064 g004
Figure 5. Land distribution (Photo credit: authors).
Sustainability 14 01064 g005
Figure 6. Current status of the university’s driveway. (Photo credit: authors).
Sustainability 14 01064 g006
Figure 7. Emission points ( Sustainability 14 01064 i002
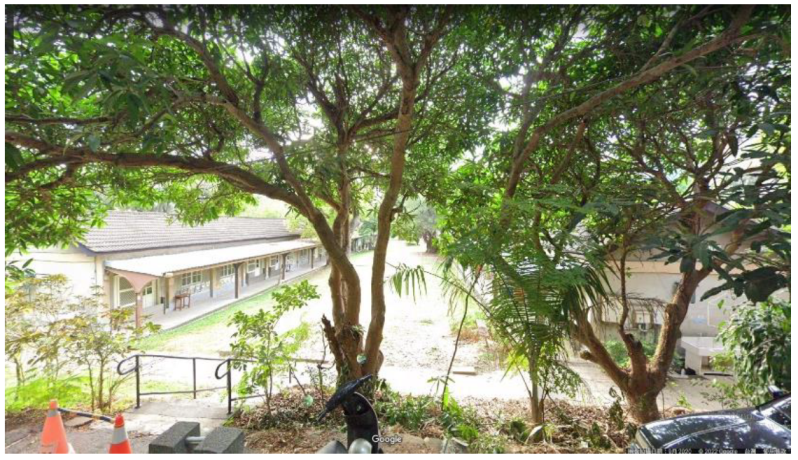
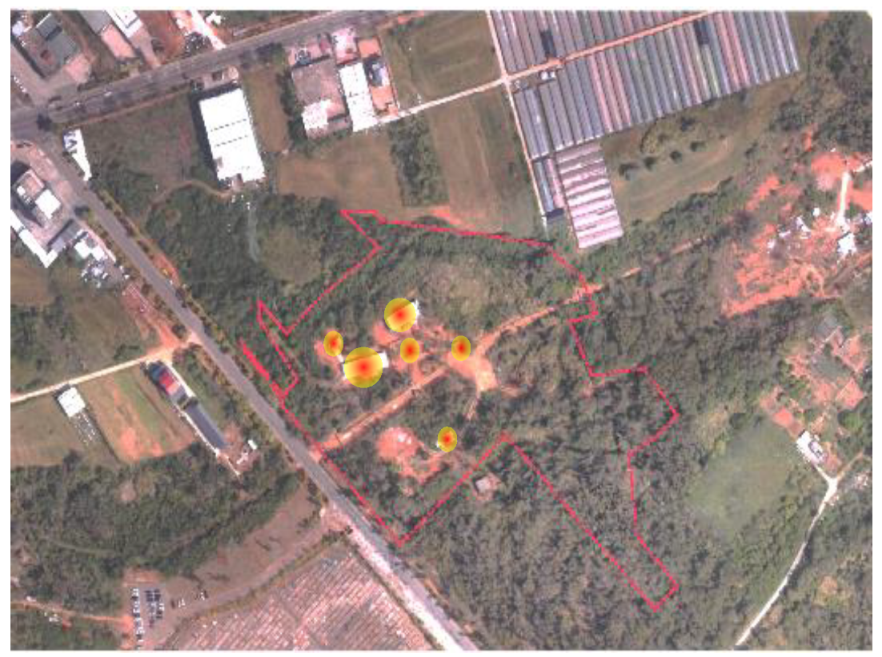
) of each building in 2021 (Photo credit: authors).
Sustainability 14 01064 g007
Figure 8. Picture of the planned main constructions emission spots ( Sustainability 14 01064 i003
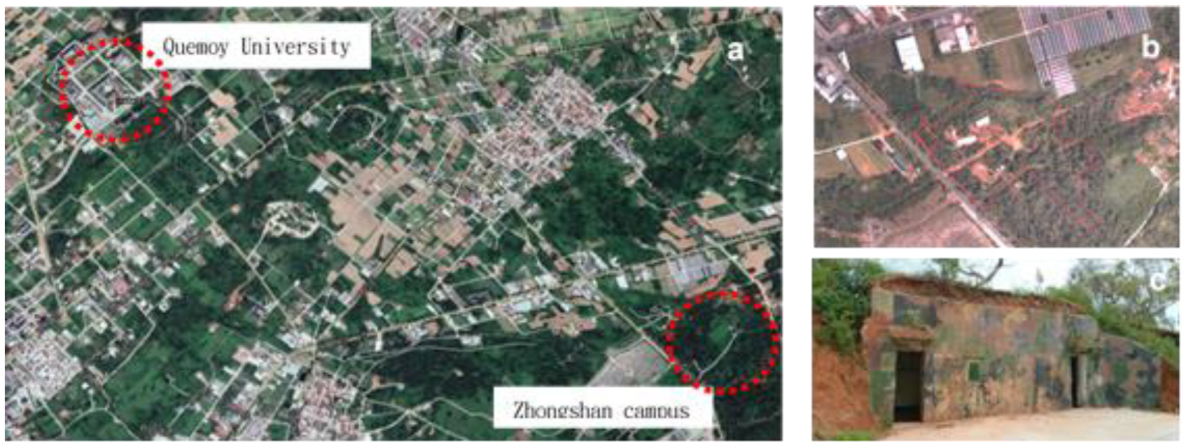
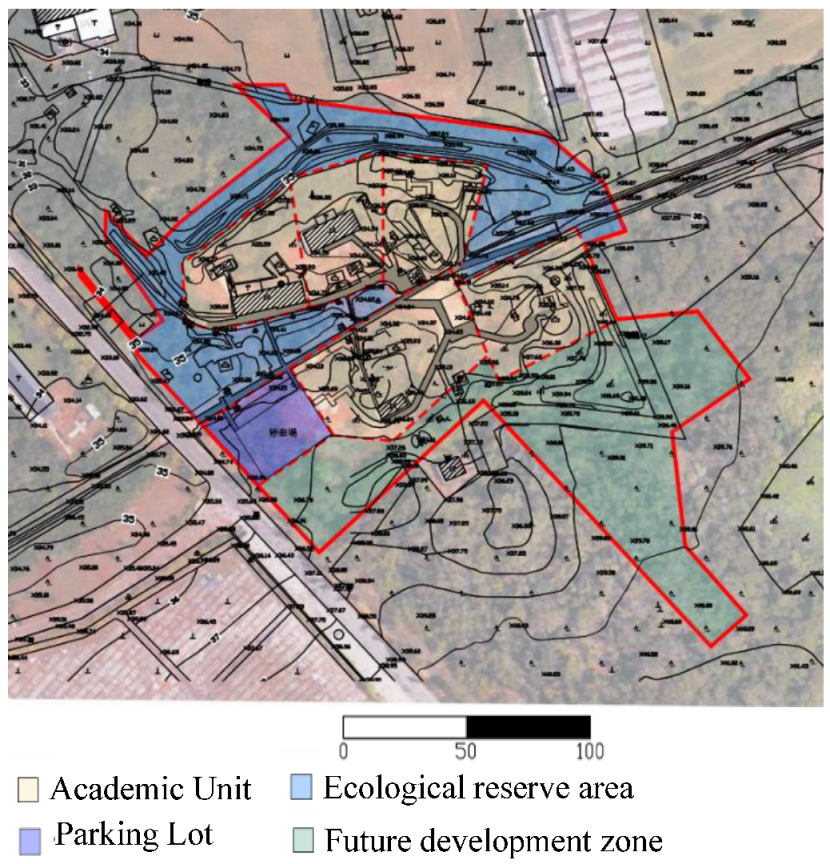
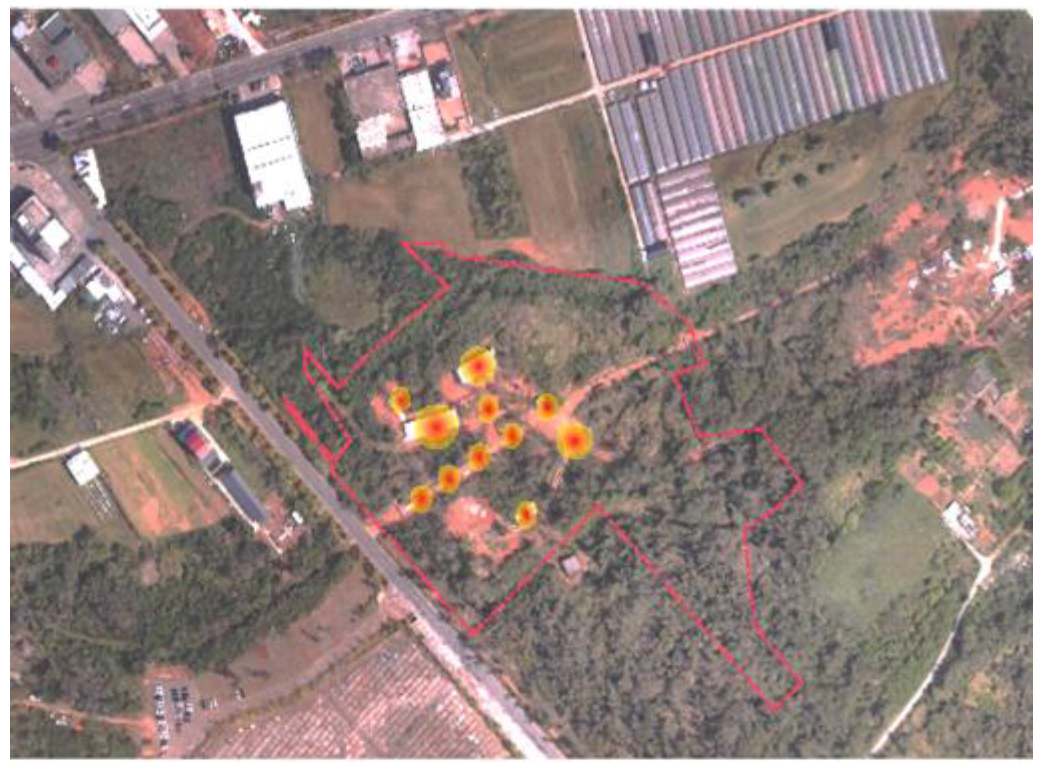
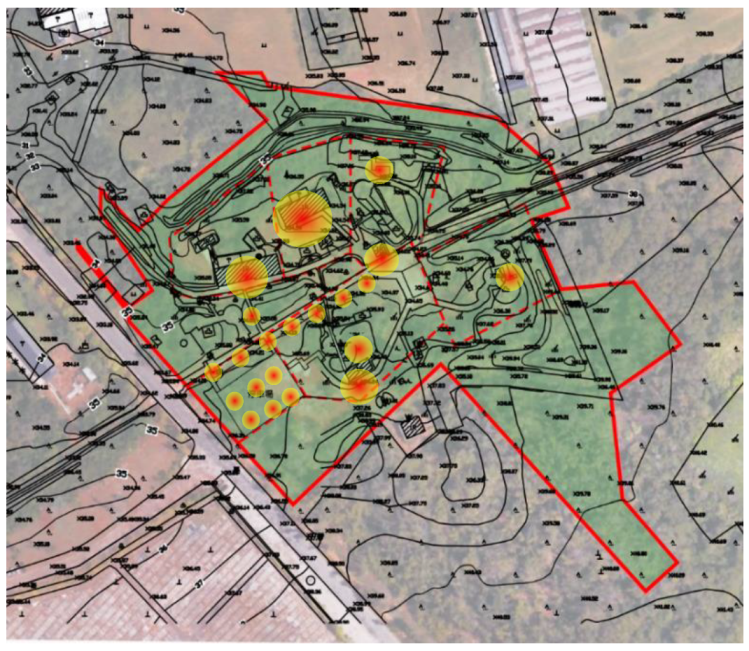
) intra campus after 2026 (Map draw: authors).
Sustainability 14 01064 g008
Table 1. Zhongshan Forest area usage.
Partition UseArea (m2)%
Academic unit12,34539.9
Ecological reserve area801525.9
Parking lot15254.9
Future development zone907229.3
Total area30,957100.0
Table 2. Detailed calculation of the carbon footprint of the building life cycle for each different stage of a reused building (unit: kgCO2e/30 yr).
StageCarbon Emissions
CFm = CFs + CFns + CFe + CFin = 285,226.87 kgCO2e/30 yrCF of the main building structure materials (CFs)167,526.09
CF of the main building non-structural materials (CFns)37,973.91
CF of equipment and installation materials (CFe)79,296.95
CF of interior materials (CFin)429.92
CFc466.51
CFeu = CFa + CFl + CFel + CFwt + CFtr + CFg = 357,328.07 kgCO2e/30 yrCF of air conditioning (CFa)101,856.64
CF of lighting (CFl)151,732.34
CF of electrical appliances (CFel)64,884.83
CF of ventilation (CFv)22,608.81
CF of transportation (CFtr)0
CF of water supply and wastewater treatment (CFwt)16,245.45
CF of heating electronics (CFg)0
CFrm67,834.41
CFdw9724.89
CFo171,287.61
Total Carbon Footprint (TCF) = CFm + CFc + CFeu + CFrm + CFdw-CFo549,293.14
CFm—carbon footprint of new building materials; CFc—total carbon footprint during building construction; CFeu—daily energy consumption; CFrm—total carbon footprint of renovation and repair materials; CFdw—total carbon footprint of demolition and waste disposal; CFo—carbon footprint of user’s own self-certified carbon reduction. The calculation was based on the approach described in a previous study [21].
Table 3. Floor area, structure, number of floors and energy density standards for each building.
Department ofFloor Area (m2)Floor LevelArchitect-Ural StructureName of Function SpaceEnergy Density Standard
(EUI, kWh/m2yr)
Air Conditioning EUIaiLighting
EUIli
Electronic EUIei
Sports and Leisure202.051Masonry structure[L1] 10HR school classroom Space-school classroom above High school23229
Food Science141.251Masonry structure54
Architecture -a21.941Masonry structure[K1] 10HR administrative office space-office administrative space493525
Architecture -b19.311Masonry structure109
Electromechanical Room21.631Masonry structure[F1] 24 h space without air conditioning -24 h mechanical ventilation space0223
Restroom21.111Masonry structure25
Table 4. Standard water consumption and number of users of classified space.
Functional AreaArea AFIi(m2)People
Density pdi
People Usage pdi × AFIi = npiWater Usage QwiCategory Water Consumption npi × Qwi
[Department of Sports and Leisure] [L1] 10HR school classroom space-school classroom above high school202.050.4080.8210.1816.28
[Department of Food Science] [L1] 10HR School classroom space-school classroom above high school141.250.4056.5010.1570.65
[Department of Architecture -a] [K1] 10HR administrative office space-office administrative space21.940.153.2925.483.59
[Department of Architecture -b] [K1] 10HR administrative office space-office administrative space19.310.152.9025.473.57
Σ384.55 143.51 1544.09
Table 5. Total carbon emission of the landscape’s five-stage life cycle.
StageCarbon Emissions
CFmc—New construction and materials180,526.33
CFrm—Renewal of materials and construction96,229.54
CFeu—Daily use419,747.03
CFdw—Demolition and waste disposal179,117.09
CFa—Planting carbon equivalent−1,636,560.00
CFo—Self-evidence to reduce carbon0.00
Total TCF = CFmc + CFrm + CFeu + CFdw-CFa-CFo−760,940.01
(unit: kgCO2e/30 yr).
Table 6. Standardizing index of evaluation and transfer.
Valuation ItemConsumption UnitStandard UsageEmission Parameter
Energy consumptionkWh188 kWh/m2yr (Table 3)0.509 kgCO2e/kWh [27]
Transportation routekWh1.39 kWh/km [31]0.71 kgCO2e/km [31]
Production of wastekg/p·day0.588 kg [31]0.79–1.16 kgCO2e/kg [30]
Water consumptionL/p·day10.1 L/p/day (Table 4)0.509 kgCO2e/kWh [27]
Ref. [27] Bureau of Energy, Ministry of Economic Affairs 2019, Ref. [31] Huang & Zhan 2014, Ref. [31] EPAEY, Ref. [30] Wang & Geng 2015.
Table 7. Index of calculation unit.
Evaluation ItemsUsage UnitData Unit
Energy consumptionAcademic building188 kWh/m2yr
Transportation routeMain campus to Zhongshan campus1.39 kWh/km
Production of wasteWhole campus0.588 kg/p/day
Water consumptionWhole campus10.1 L/p/day
Publisher’s Note: MDPI stays neutral with regard to jurisdictional claims in published maps and institutional affiliations.

