
Selection of a Wheat Harvester according to Qualitative and Quantitative Criteria

Department of Industrial Engineering, Semnan Branch, Islamic Azad University, Semnan 3513693688, Iran
*
Author to whom correspondence should be addressed.
Sustainability 2022, 14(3), 1313; https://0-doi-org.brum.beds.ac.uk/10.3390/su14031313
Submission received: 18 December 2021
/
Revised: 13 January 2022
/
Accepted: 17 January 2022
/
Published: 24 January 2022
(This article belongs to the Special Issue Sustainable and Agile Manufacturing in the Era of Industry 4.0: Application of Simulation, Optimization, Lean, and Emerging Digital Technologies)
Abstract
:With the development of technology and the expansion of agricultural machinery diversity, the need for an appropriate group decision-making system has arisen. The increasing number of criteria and alternatives complicates the decision-making process. Moreover, the uncertainty in the data leads to more complexity in the decision. To select a wheat combine, multiple quantitative criteria were considered, such as the grain tank, rated horsepower, speed draining, and cleaning, along with qualitative criteria, including the level of harvest or harvest losses, fuel consumption, comfort and safety, the ability to harvest wet and lying, and price. To rank seven alternatives through the MULTIMOORA (multi-objective optimization on the basis of ratio analysis) method, a group decision making model applied for qualitative criteria and the Simos method was used for weighting as a subsidiary of mental groups. The performance of the hybrid model was confirmed by experts in agricultural machinery. The consensus model, when used in the process of group decision making, reduces the conflict level of decision-makers regarding criteria, alternatives and the decision matrix. The results of this research will be beneficial for industrial agriculture, especially wheat combine buyers. The proposed explainable consensus model can be used to construct decision support systems and can be applied to various decision-making problems owing to operability and easiness.
1. Introduction
In recent years, the rapid growth of the population and the increasing demand for wheat have led to the supply of a significant portion of the country’s wheat crop from abroad. Like other agricultural products, there are many losses and significant crop waste in the stages of wheat production and consumption. Nowadays, manual harvesting is almost impossible due to the high associated costs and limited harvest time. Combines are one of the most complex and expensive harvesting tools. Furthermore, the annual production cycle of agricultural products is largely determined by the quality of the harvesting process (especially cereals). This is done in the process of harvesting grain products using combine harvesters to transport the product to storage sites. The purchase and maintenance of combine harvesters are significantly costly, and the maximum use of each unit of equipment is very important for agricultural producers. The harvest time from full maturity to late harvest leads to an increase in biological losses of the crop. Moreover, incomplete loading of equipment results in unnecessary (sometimes excessive) costs for purchase, maintenance, salaries, and so on. To evaluate the process status of cereal product reapers, it is necessary to determine their performance and effectiveness indicators [1]. The technical parameters and performance of agricultural machinery directly affects the efficiency of operations and total crop production. The overestimation of the technical and dimensional parameters of harvesting equipment is occasionally done to increase operational efficiency. However, this approach may negatively affect productivity owing to the unbalanced system design, ultimately leading to financial losses. Therefore, a balanced initial estimation of the technical parameters of the equipment should be performed before determining the amount of investment, especially in large machinery units with high capital, such as harvesting systems [2]. With the increasing industrialization of agriculture, the need for a group decision support system is increasingly felt. Group decision-making (GDM) is carried out by groups of experts and aims to incorporate collective intelligence to make decisions [3]. Pressures for early consensus during group decision processes often lead to poor choices. Consensus in GDM means achieving a mutual opinion by negotiation and opinion evolution. However, consensus as an outcome of group decision processes is often desirable for optimum choice. The purpose of a consensus-reaching process is to make as many DMs as possible satisfied with the decision result and achieve a high consensus level. A typical consensus-reaching process in GDM is guided by a moderator, who collects individuals’ preferences, evaluates the consensus degree, and decides whether to continue or stop the decision-making process [4]. In the present study, an approach is presented for the screening of alternatives and criteria based on GDM problems under conflict levels in opinions of DMs; then, each wheat combine option is ranked based on 15 criteria. To increase the accuracy of the ranking results, the Simos technique [5] was used to determine the importance of criteria. Moreover, the MULTIMOORA method, which is a combination of several multi-criteria decision-making methods, was also used to rank the combines.
2. Literature Review
2.1. A Brief Review of the MULTIMOORA Method
Numerous studies have attempted to address multi-criteria decision-making in crisp or fuzzy environments [6,7,8,9,10,11,12,13]. The MULTIMOORA method is composed of MOORA and the full multiplicative form of multiple objectives [14]. The MOORA and its extension, the MULTIMOORA method, are popularly utilized in practice due to its simple application procedure, pertinence to various conditions, and advances through empirical observation. In recent years, there has been an increasing amount of literature on applications of the MULTIMOORA method. Majumder et al. used the MULTIMOORA method for process parameter selection [15]. Liu [16] extended a new FMEA model using fuzzy set theory and the MULTIMOORA method to determine the risk priority of failure modes. Baležentis and Baležentis [17] carried out a survey on the two major areas of application of MOORA and MULTIMOORA, namely engineering decision support for technological development and economic research. Stanujkic et al. [18] suggested a new extension of the MULTIMOORA method to deal with bipolar fuzzy sets. Liu [19] extended the MULTIMOORA method for probabilistic linguistic multi-criteria group decision-making based on prospect theory. Stankevičienė et al. [20] employed MULTIMOORA as the instrument to evaluate the technology transfer process in higher education institutions. Souzangarzadeh et al. [21] applied MULTIMOORA in the multi-objective optimization of cylindrical segmented tubes as energy absorbers under oblique crushes. Together, these studies indicate that MULTIMOORA methods received rapid attention in both theory and different applications.
2.2. MCDM in the Agriculture Sector
Recently, research has been conducted on the applications of decision-making science in agriculture [22]. Petrini et al. prioritized public policies for farming families in Brazil using a hierarchical analysis method [23]. Although the hierarchical analysis process can be used in many decision-making issues, by increasing the number of options and criteria, the number of pairwise comparisons and thus the likelihood of inconsistency in the comparisons will also increase. Therefore, it is necessary to use the appropriate decision-making method to select agricultural machinery based on various qualitative and quantitative criteria. Isik and Adali selected a set of tractors using the technique for order preference by similarity to ideal solution (TOPSIS) method and examined the problem using two other methods of decision making: complex proportional assessment and evaluation of mixed data. They finally used the BORDA and COPELAND methods to rank the three studied methods [24]. García-Alcaraz et al. [22] selected various criteria, including initial cost, annual maintenance, fuel consumption per hour, operator safety, and after-sales service, to evaluate a set of tractors. They also examined the options based on a combination of hierarchical analysis and TOPSIS methods. Kohili et al. [25] used the TOPSIS method to select a mechanical cotton harvester. The selected performance indicators were picking efficiency, field capacity, total loss, gin or lint turnout, trash content and selected options of cotton harvesting mechanisms, including finger type, brush type, spindle type, and other mechanisms. Hafezalkotob et al. [26] used the multi-criteria decision-making method to evaluate the olive harvesting machine. They evaluated 6 candidate machines with 9 important criteria and selected the best harvesting machine using the 2 proposed methods, MULTIMOORA and the weighted aggregated sum product assessment (WASPAS) method. Table 1 shows summary of recent trends in applications of MCDM in agriculture.
2.3. Research Gap
Despite the wide range of articles on the selection of agricultural machinery, no report has been published on the ranking of wheat harvesters that includes the necessary criteria for the selection of wheat harvesters. In addition, due to the nature of inaccurate data on wheat combine ranking, the use of new MCDM methods is essential. In this study, modified MULTIMOORA and SIMOS methods were selected to select the best wheat combine.
3. Materials and Methods
The algorithm proposed for selecting a wheat combine consists of two phases. The first phase includes the formation of a decision matrix, and the second phase is comprised of conflict analysis, weighting, and ranking.
3.1. Formation of the Decision Matrix
Step 1. Selecting a group leader: A person is selected as the group leader who is fully acquainted with the planting and harvesting of wheat, agricultural machinery, and multi-criteria decision-making. The group leader also determines the weight of the experts.
Step 2. Forming a committee of experts on the subject:
A committee is formed consisting of at least three specialists with expert qualifications. Three indicators are introduced as expert characteristics, including the level of education, level of useful experience in agricultural machinery, level of knowledge, and relevant expertise in the field of wheat harvesting. These characteristics are introduced and weighted by the group leader.
Step 3. Preparing an initial list of quantitative and qualitative criteria and options:
At this stage, the initial list of criteria and options is stated by experts through interviews.
Step 4. Screening the initial list using the leveling of potential conflicts of quality criteria:
At this stage, decision-makers were asked to express their opinion on selecting or rejecting the initial criteria using linguistic variables. If the level of conflict between decision-makers for the criterion is less than 4, the criterion is selected. For conflict levels between 4 and 8, the decision-makers are asked to re-express their opinion about the criterion with linguistic variables. For conflict levels higher than 8, the third party expresses his/her opinion to remove the desired criterion. This method is also used to level the conflict of decision-makers’ opinions to evaluate each option under each criterion, which is described in detail in step 6.
Step 5. Evaluation of the options according to the screened criteria:
At this stage, options under each criterion are weighted as linguistic variables by the selected experts, and criteria with data obtained through libraries and slightly definite are directly entered into the final decision matrix. Quantitative criteria information will be obtained from field observations and research literature.
Step 6. Leveling the level of expert opinions’ conflict:
The method of calculating the conflict is as follows. The numerical symbol of linguistic variables for conflict of criteria is: Vl = 1, L = 2, ML = 3, M = 4, MH = 5, H = 6, VH = 7. Subsequently, the difference is obtained. In the following, the leveling of conflict, the analysis of its levels, and the presentation of separate solutions for the three levels of conflict are discussed. Based on the exchange of ideas with the group leader, the levels of conflict are determined as follows: for disagreements between the decision-makers with a value of 4 or less, the conflict is at a low level. For disagreements between the decision-makers with a value between 4 and 8, the conflict is at the medium level. Otherwise, the conflict is considered to be at a high level. Table 2 represents the identified conflict levels along with the conflict management strategies for resolving them [36]. No conflict is expected for quantitative data; however, there is a conflict for qualitative data.
3.2. Weighting and Ranking of Alternatives
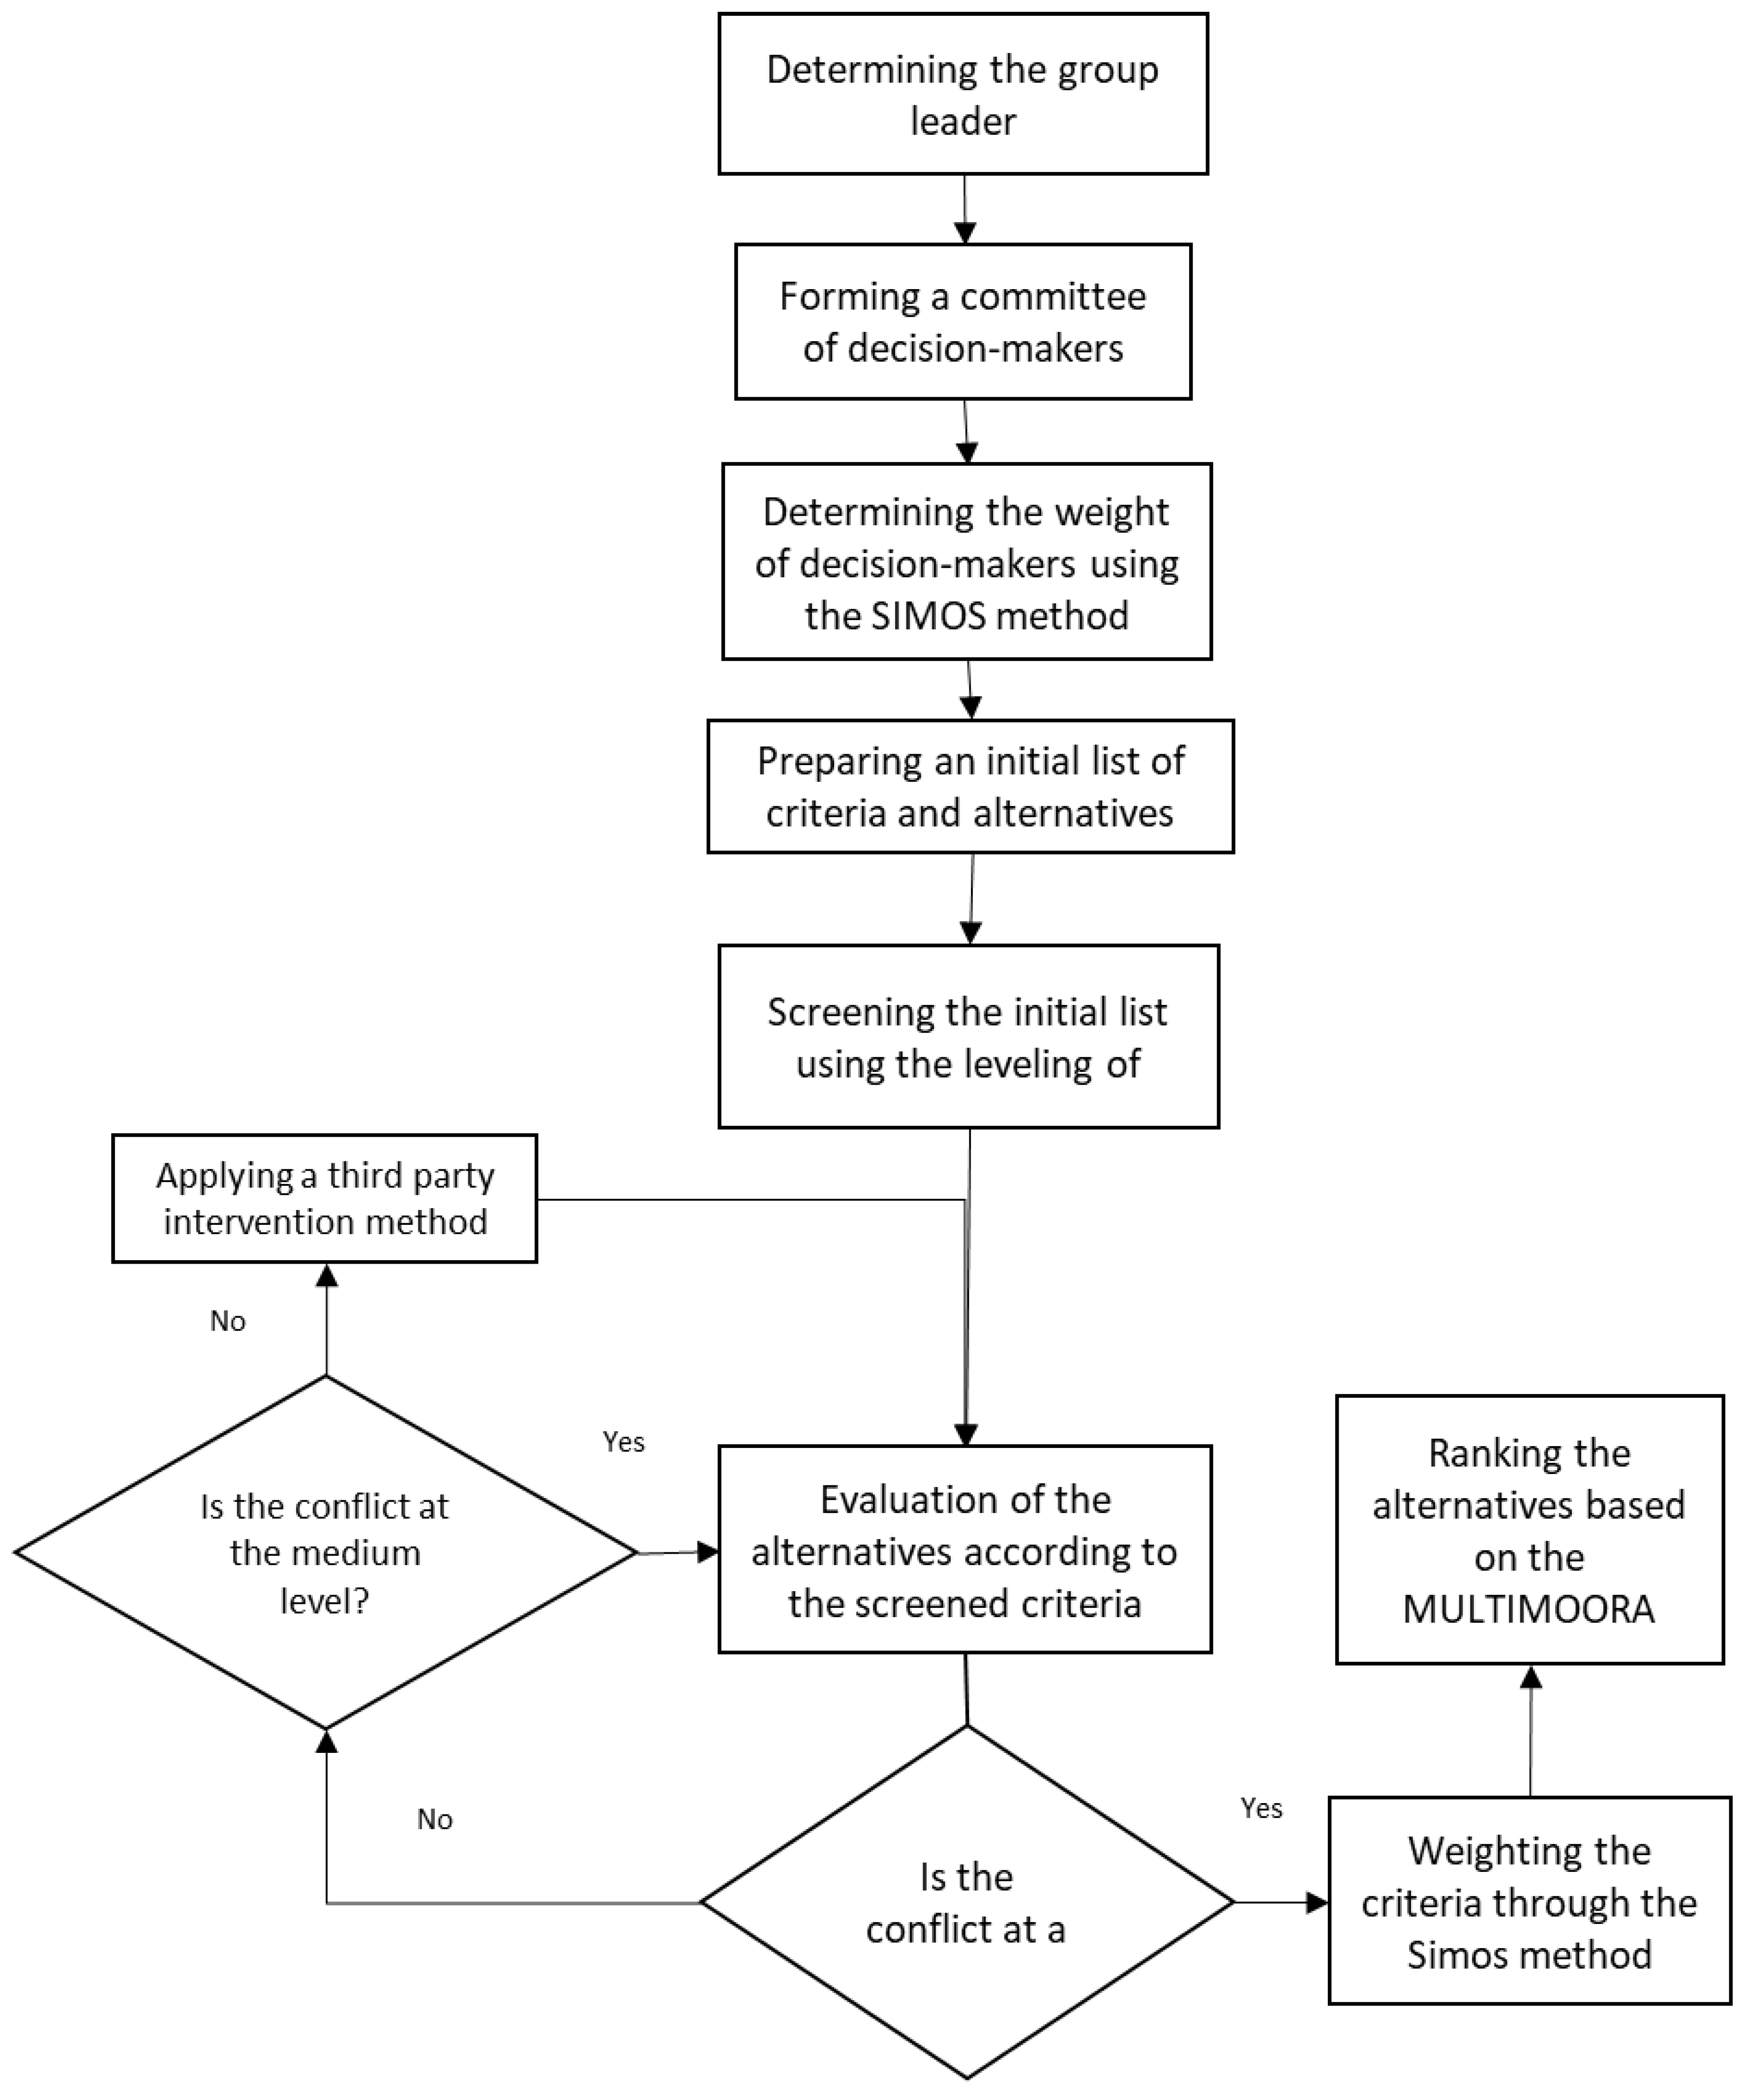
In this step, the criteria were weighted through the Simos method. Then, the final decision matrix was formed. In the next step, the options were ranked based on the MUMOORA method. Figure 1 shows the flowchart of the algorithm for selecting a wheat combine.
3.2.1. Simos Method
The Simos method is a weighting method for criteria developed based on card games. This method is simple and very practical; however, it sometimes leads to similar weights for the criteria. The name of each criterion should be written on the card, and the decision-maker sorts the cards in order, from least important to most important. Some criteria may be equally important, which can be represented at one level. The distance of each blank card placed by the decision-maker between two consecutive subgroups means that one more unit of scale is the difference between their corresponding weights [5]. The number of subgroups can be from 1 to n.
After arranging the criteria (cards), Sr is calculated using Equation (1).
where is the number of blank cards between the rth and the r + 1th subgroup. Additionally, the value of s′ will be obtained according to Equation (2).
To perform the calculations, the decision-maker must determine the ratio of the most important criterion to the least important with z (z ≥ 1).
Given the values of s and z, the value of each subgroup unit will be obtained according to Equation (3).
Finally, the abnormalized weight rth subgroup P(r) will be obtained based on Equation (4).
To calculate the normalized weight () of each criterion, the weight value was abnormalized. The subgroup will be divided by P′, which is the weighted sum of all criteria (Equations (5) and (6)).
3.2.2. MULTIMOORA Method
The MOORA method was proposed by Brauers and Zavadskas. It consists of two parts of the ratio system and the reference point method. Brauers and Zavadskas developed this concept using the full multiplicative form. An updated method, called MULTIMOORA, consists of MOORA pieces and a full multiplicative form [14]. The MULTIMOORA method begins with the formation of a decision matrix. In Equation (7), i and j, respectively, represent the option and the index.
To obtain comparable and dimensionless criteria, the decision matrix is normalized using Equation (8), where represents the normalized value of xij, which is in the range of [0,1]. The divisor used in the weight coefficient system is the square root of the sum of the option values of each criterion [37].
I. Ratio system:
To obtain the assessment value of the ratio system, the sum of the normalized index values with a positive aspect (in case of maximization) is subtracted from the sum of the normalized index values with a negative aspect (in case of minimization) and then ranked [37]. Equation (9) shows this difference.
where g represents the number of positive indicators and (n-g) shows the number of indicators with a non-positive aspect. represents the assessment value of the ith option for the ratio system and forms the first ranking. The multiplication of Equation (7) with the weight obtained for the indices gives the weighted form of the ratio system [37]. Equation (10) shows the weighted ratio system.
The optimal option of the ratio system can be determined by evaluating the assessment values in descending order using Equation (11) [38].
Equation (12) shows the optimal option of the weighted form of the ratio system:
II. Reference point approach:
This approach begins with specifying a maximal attribute reference point. Coordinate j of the maximal objective reference point (MORP) vector is obtained as follows [37].
The deviation of a rank from the reference point rj is calculated as . The maximum deviation for each option is determined by considering all the indicators as Equation (14):
The weighted form of the assessment value of the reference point approach can be obtained using Equation (15) [37].
The optimal option of the reference point approach and its weighted form can be calculated by finding the minimum of the related assessment values according to Equations (16) and (17) [38].
III. The full multiplicative form
The third subordinate part of the MULTIMOORA method is the full multiplicative form. Its value is assessed using Equation (18).
where g represents the number of positive indices and (ng) denotes the number of indices with non-positive aspects. The numerator of Equation (18) represents the product of the responses of the ith option to positive indices, while the denominator of Equation (18) shows the product of the responses of the ith option to indices with non-positive aspects. The equivalent form of can be computed using the arrays of a normalized decision matrix, as seen in Equation (19).
Brauers and Zavadskas showed that the weights should be considered exponents for the full multiplicative form rather than coefficients. Equation (20) shows the shape of the full multiplicative form considering the weights of the indices.
Similar to the ratio system, the optimal option has the maximum assessment value obtained using Equation (21):
The optimal option is obtained from the weighted full multiplicative form using Equation (22):
According to the principles of cardinal and ordinal numbers, it is not possible to apply algebraic operations of cardinal numbers in the space of ordinal numbers, and these numbers can only be converted to ordinal numbers of another type. One of the advantages of dominance theory is to perform all the steps of problem-solving in the space of ordinal numbers. Finally, according to the dominance theory, the rankings of sections I, II, and III can lead to an integrated final ranking, known as the MULTIMOORA rank.
4. Case Study and Data Analysis: Selection of Wheat Combine
4.1. Determining the Group Leader
Here, first, a person is selected as the group leader and a third party who is fully acquainted with the planting and harvesting of wheat, agricultural machinery, multi-criteria decision-makers, and its new methods to help us in weighing the decision-makers and in the case of high conflict in data quality.
4.2. Forming a Committee of Decision-Makers and Determining Their Weight
In the first stage, according to the “level of education” criterion, decision-makers are arranged according to their degree of importance, and the steps of the Simos method are performed. Finally, the weight of each decision-maker is obtained according to the “level of education” criterion.
This is done in the same way for the other two criteria. Finally, three different weights are obtained for each decision-maker, with each weight belonging to each criterion.
In the last step, the arithmetic average weight of each DM obtained for different criteria is calculated. Additionally, the decision-makers are sorted in ascending order based on each criterion. Then, the weight of each decision-maker is determined such that their sum is equal to 1.
Calculating the weight of decision-makers according to the education level criteria (Table 3, Table 4 and Table 5).
At the discretion of the group leader, Z = 10.
Similarly, the weight of decision-makers is calculated according to the criteria of useful experience in agricultural machinery, knowledge, and expertise in the field of wheat harvesting. Table 6 shows the final weight of decision-makers.
4.3. Identifying the Criteria and Alternatives and Forming a Decision Matrix
4.4. Screening the Criteria
To screen the indicators, the conflict between the qualitative indicators is leveled, and all the quantitative indicators are selected because of their great importance. According to Table 9, the conflict level of criteria is obtained.
According to the high level of conflict between indicators C7, C8, C11, C12, and C15, to resolve this issue, the third party in a meeting with the decision-making group discussed and expressed opinions on the mentioned criteria. After the meeting and exchanging the views between the members and the third party, it was decided that the 6 mentioned criteria were screened and removed from the initial list of criteria. Regarding the C13 criterion, the decision-making group was asked to reconsider their views and re-evaluate the criterion. The result of the re-evaluation of the C13 criterion is given in Table 10. This criterion is added to the list of final criteria after re-evaluating.
4.5. Evaluating the Options under Quantitative and Qualitative Criteria and Leveling the Conflict
4.6. Examining the Conflict Level of the Experts’ Opinion for Each Option under Each Criterion
In this step, the level of conflicts between the opinions of four decision-makers is examined (Table 14). The conflict level is low for all options under all criteria, so we enter Phase 2 directly.
Where wk is the weight of decision-makers and a115 is a triangular fuzzy number of the first option expressed by the first decision-maker for criterion C5. Table 15 shows the weighted fuzzy decision matrix. For example, the first triangular fuzzy number for the first option, and the C5 criterion are as follows.
In some cases, due to the unavailability of definite numbers, fuzzy numbers can be used to compare the options according to Table 16.
Therefore, fuzzy numbers need to be converted to another type to identify a more promising option. In this research, the defuzzification for the median method is used based on Equation (23) for defuzzification (Table 17).
In this equation, a, b, c is in the lower, specific and high values of the fuzzy number, respectively [39].
4.7. Formation of Decision Matrix and Weighting
The weight of criteria is obtained using the Simos method (Table 18, Table 19 and Table 20 show the details for z = 10).
To form the final decision matrix, the diffused values of the qualitative criteria were used, and for quantitative criteria, the related values were used. Given that there is no alternative preferable to another (for all criteria), no alternative is deleted at this stage. Table 21 is the final decision matrix.
4.8. Ranking of Alternatives by the MULTIMOORA Method
In this step, the options are prioritized using three methods: the ratio system, reference point method, and full multiplicative form. Finally, the final ranking is done using the dominance method (Table 22, Table 23 and Table 24).
By ranking the alternatives in three different ways (Table 25), we see that the Axial-Flow 9240, Claas LEXION 780, and New Holland CR9.90 alternatives have the same result in all three methods. The two alternatives, the new Netherlands CX8090 and John Deere S690, differ only in the ratio system method, indicating the high efficiency of the proposed algorithm (Figure 1) for selecting a wheat harvester.
In today’s world, managing organizational affairs cannot be based solely on the ingenuity and personal judgment of individuals. In this regard, the inherent complexity of many decision environments necessitates a comprehensive approach to fuzzy multiphase decision-making methods. In multi-criteria decision making and group decision making, using the opinions of several decision-makers instead of one decision-maker will cause great complexity in analyzing a decision. This research sought to examine the level of divergence in views of ways to proceed in situations where there is conflict between members of the decision-making committee in order to better resolve the issue and identify bad decision options. In fact, the leveling of conflicts will cause a reputable third party to intervene in high-level conflicts, and, by convening a meeting with the decision-making committee, will manage the existing conflict, increase the possibility of creating new solutions, and ultimately move the issue towards the organization’s goals. In addition, the approach presented gives the decision-making team a dynamic state, and the team can intervene in adding or removing options, changing judgments, and so on. Another key point that can be mentioned from the results of this research is that, in the approach presented in the AHP method by Professor Saaty, the degree of incompatibility is determined for the conditions in which pairwise comparisons between criteria or other possible pairwise comparisons are performed. However, the approach presented in this research in terms of determining the incompatibility of opinions is somewhat similar to the AHP method, with the difference that disagreements are decided for each criterion and each option between the decision-making group. Traditional consensus means a full and unanimous agreement in a group. However, the consensus-reaching process is particularly challenging due to the complexity and uncertainty caused by groups of participants because of non-cooperative behaviors, minority views, and the heterogeneous preference formats used in preference vectors and pairwise comparison matrixes. In the MULTIMOORA method, the ratio system and the full multiplicative facilitate complete aggregation, whereas the reference point approach relies on partial aggregation. The dominance theory enables the aggregation of the ranks entailed by the latter three parts of MULTIMOORA. The Simos method exhibits a considerably easy system for data collection and implementation; therefore, it has been extensively used in the scientific literature. Together the proposed hybrid method can effectively deal with group multi-attribute decision-making problems.
5. Conclusions
Two types of criteria are needed to select a wheat combine. The criteria that can be evaluated with quantitative numbers include grain storage, horsepower rating, discharge speed, and harvesting level. Qualitative criteria include harvest losses, fuel consumption, safety, comfort, ability to harvest wet and dormant product, and combine price. Quantitative criteria data can be collected through previous research, by requesting from the combine manufacturer, or using the direct method. Qualitative data can be collected through group interviews with decision-makers and the use of fuzzy numbers. In previous studies focused on selecting a wheat combine, most of the proposed options were common in the country and came with their own disadvantages and advantages. Among the disadvantages were the tendency to become stuck in the mental framework and lack of attention to other combines. The results of ranking the combines studied by the MULTIMOORA method are as follows. The New Holland Combine (CX8090) was ranked first, followed by the Class Combines (LEXION 780), John Deere S690, Chassis (Axial-Flow 9240), and New Holland CR9.90, respectively. In the current study, the decision matrix was limited by crisp sets and fuzzy sets, while in future research, the use of interval numbers can enrich the decision process, either for current criteria (for example price, and fuel consumption) or by adding new criteria, such as after-sales service, vibration, and reliability. The results of this application showed that the proposed consensus model can integrate opinions representing conflict and efficiently reach an agreement. One of the limitations of this research is to determine a person as supervisor of the group with the desired educational background, knowledge, and experience both in harvest and agricultural machinery as well as in decision habits.
Author Contributions
Conceptualization, A.J.; methodology, A.J.; supervision, A.J.; writing, review and editing, A.J.; formal analysis, H.L.; writing original draft preparation, H.L. All authors have read and agreed to the published version of the manuscript.
Funding
This research received no external funding.
Institutional Review Board Statement
Not applicable.
Informed Consent Statement
Not applicable.
Data Availability Statement
Not applicable.
Conflicts of Interest
The authors declare no conflict of interest.
References
- Kataev, V.; Markvo, I.; Khubiian, K.; Dimitrov, V. Performance analysis of the process of combine harvesting of grain crops. In E3S Web of Conferences; EDP Sciences: Les Ulis, France, 2020. [Google Scholar]
- Yezekyan, T.; Marinello, F.; Armentano, G.; Trestini, S.; Sartori, L. Modelling of harvesting machines’ technical parameters and prices. Agriculture 2020, 10, 194. [Google Scholar] [CrossRef]
- Chao, X.; Kou, G.; Peng, Y.; Viedma, E.H. Large-scale group decision-making with non-cooperative behaviors and heterogeneous preferences: An application in financial inclusion. Eur. J. Oper. Res. 2021, 288, 271–293. [Google Scholar] [CrossRef]
- Herrera-Viedma, E.; Herrera, F.; Chiclana, F. A consensus model for multiperson decision making with different preference structures. IEEE Trans. Syst. Man Cybern.-Part A Syst. Hum. 2002, 32, 394–402. [Google Scholar] [CrossRef]
- Siskos, E.; Tsotsolas, N. Elicitation of criteria importance weights through the Simos method: A robustness concern. Eur. J. Oper. Res. 2015, 246, 543–553. [Google Scholar] [CrossRef]
- Khezrian, M.; Jahan, A.; Wan Kadir, W.M.N.; Ibrahim, S. An approach for web service selection based on confidence level of decision maker. PLoS ONE 2014, 9, e97831. [Google Scholar] [CrossRef]
- Jahan, A.; Zavadskas, E.K. ELECTRE-IDAT for design decision-making problems with interval data and target-based criteria. Soft Comput. 2019, 23, 129–143. [Google Scholar] [CrossRef]
- Akram, M.; Ali, G.; Alcantud, J.C.R. Parameter reduction analysis under interval-valued m-polar fuzzy soft information. Artif. Intell. Rev. 2021, 54, 5541–5582. [Google Scholar] [CrossRef]
- Ali, G.; Ansari, M.N. Multiattribute decision-making under Fermatean fuzzy bipolar soft framework. Granul. Comput. 2021, 1–16. [Google Scholar] [CrossRef]
- Akram, M.; Ali, G.; Butt, M.A.; Alcantud, J.C.R. Novel MCGDM analysis under m-polar fuzzy soft expert sets. Neural Comput. Appl. 2021, 33, 12051–12071. [Google Scholar] [CrossRef]
- Jahan, A. Developing WASPAS-RTB method for range target-based criteria: Toward selection for robust design. Technol. Econ. Dev. Econ. 2018, 24, 1362–1387. [Google Scholar] [CrossRef]
- Ali, G.; Afzal, M.; Asif, M.; Shazad, A. Attribute reduction approaches under interval-valued q-rung orthopair fuzzy soft framework. Appl. Intell. 2021. [Google Scholar] [CrossRef]
- Yazdani, M.; Pamucar, D.; Chatterjee, P.; Torkayesh, A.E. A multi-tier sustainable food supplier selection model under uncertainty. Oper. Manag. Res. 2021. [Google Scholar] [CrossRef]
- Brauers, W.K.M.; Zavadskas, E.K. Project management by MULTIMOORA as an instrument for transition economies. Technol. Econ. Dev. Econ. 2010, 16, 5–24. [Google Scholar] [CrossRef]
- Majumder, H.; Mishra, S.K.; Sahu, A.R.; Bavche, A.L.; Valekar, M.; Padaseti, B.K. Application of MOORA to optimize WEDM process parameters: A multi-criteria decision making approach. In International Conference on Reliability, Risk Maintenance and Engineering Management; Springer: Berlin/Heidelberg, Germany, 2019. [Google Scholar]
- Liu, H.-C.; Fan, X.-J.; Li, P.; Chen, Y.-Z. Evaluating the risk of failure modes with extended MULTIMOORA method under fuzzy environment. Eng. Appl. Artif. Intell. 2014, 34, 168–177. [Google Scholar] [CrossRef]
- Baležentis, T.; Baležentis, A. A survey on development and applications of the multi-criteria decision making method MULTIMOORA. J. Multi-Criteria Decis. Anal. 2014, 21, 209–222. [Google Scholar] [CrossRef]
- Stanujkic, D.; Karabasevic, D.; Zavadskas, E.K.; Smarandache, F.; Brauers, W.K.M. A Bipolar Fuzzy Extension of the MULTIMOORA Method. Informatica 2019, 30, 135–152. [Google Scholar] [CrossRef] [Green Version]
- Liu, P.; Li, Y. An extended MULTIMOORA method for probabilistic linguistic multi-criteria group decision-making based on prospect theory. Comput. Ind. Eng. 2019, 136, 528–545. [Google Scholar] [CrossRef]
- Stankevičienė, J.; Maditinos, D.I.; Kraujalienė, L. MULTIMOORA as the instrument to evaluate the technology transfer process in higher education institutions. Econ. Sociol. 2019, 12, 345–360. [Google Scholar] [CrossRef]
- Souzangarzadeh, H.; Jahan, A.; Rezvani, M.J.; Milani, A.S. Multi-objective optimization of cylindrical segmented tubes as energy absorbers under oblique crushes: D-optimal design and integration of MULTIMOORA with combinative weighting. Struct. Multidiscip. Optim. 2020, 62, 249–268. [Google Scholar] [CrossRef]
- García-Alcaraz, J.L.; Maldonado-Macías, A.A.; Hernández-Arellano, J.L.; Blanco-Fernández, J.; Jiménez-Macías, E.; Saenz-Diez Muro, J.C. Agricultural tractor selection: A hybrid and multi-attribute approach. Sustainability 2016, 8, 157. [Google Scholar] [CrossRef] [Green Version]
- Petrini, M.A.; Rocha, J.V.; Brown, J.C.; Bispo, R.C. Using an analytic hierarchy process approach to prioritize public policies addressing family farming in Brazil. Land Use Policy 2016, 51, 85–94. [Google Scholar] [CrossRef]
- Işık, A.; Adalı, E. A comparative study for the agricultural tractor selection problem. Decis. Sci. Lett. 2016, 5, 569–580. [Google Scholar] [CrossRef]
- Kohli, S.; Singh, M.; Sharma, K.; Kansal, G. Multiple attribute decision making for selection of mechanical cotton harvester. Sci. Res. Essays 2013, 8, 2318–2331. [Google Scholar]
- Hafezalkotob, A.; Hami-Dindar, A.; Rabie, N.; Hafezalkotob, A. A decision support system for agricultural machines and equipment selection: A case study on olive harvester machines. Comput. Electron. Agric. 2018, 148, 207–216. [Google Scholar] [CrossRef]
- Lin, Z.-C.; Yang, C.-B. Evaluation of machine selection by the AHP method. J. Mater. Process. Technol. 1996, 57, 253–258. [Google Scholar] [CrossRef]
- Yurdakul, M. AHP as a strategic decision-making tool to justify machine tool selection. J. Mater. Process. Technol. 2004, 146, 365–376. [Google Scholar] [CrossRef]
- Vatansever, K. Integrated usage of fuzzy multi criteria decision making techniques for machine selection problems and an application. Int. J. Bus. Soc. Sci. 2014, 5, 12–24. [Google Scholar]
- Chen, W.; Han, W. Research of the Assessment for Agricultural Machinery Driving Safety Based on AHP-FUZZY Method. In Proceedings of the 2012 International Conference on Automobile and Traffic Science, Materials and Metallurgy Engineering, Wuhan, China, 22–23 November 2012; Atlantis Press: Amsterdam, The Netherland, 2012. [Google Scholar]
- Osman, N.O.A. A Model for Farm Machinery Selection; University of Khartoum: Al Khurtum, Sudan, 2011. [Google Scholar]
- Wu, Y.; Yan, Y.; Wang, S.; Liu, F.; Xu, C.; Zhang, T. Study on location decision framework of agroforestry biomass cogeneration project: A case of China. Biomass Bioenergy 2019, 127, 105289. [Google Scholar] [CrossRef]
- Ciric, P.Z.; Stojic, D.; Sedlak, O.; Marcikic Horvat, A.; Kleut, Z. Innovation Model of Agricultural Technologies Based on Intuitionistic Fuzzy Sets. Sustainability 2019, 11, 5457. [Google Scholar] [CrossRef] [Green Version]
- Lukić, R.; Kljenak, D.V.; Anđelić, S.; Gavrlilović, M. Application of WASPAS method in the evaluation of efficiency of agricultural enterprises in Serbia. Економика Пољопривреде 2021, 68, 375–388. [Google Scholar] [CrossRef]
- Zhou, X.-Y.; Wang, X.-K.; Wang, J.-Q.; Li, J.-B.; Li, L. Decision support framework for the risk ranking of agroforestry biomass power generation projects with picture fuzzy information. J. Intell. Fuzzy Syst. 2020, 39, 4631–4650. [Google Scholar] [CrossRef]
- Saati Mohtadi, S.; Hatamimarbini, A.; Makui, A. Group decision making using fuzzy TOPSIS. Res. Oper. Its Appl. Appl. Math. 2007, 4, 21–34. [Google Scholar]
- Brauers, W.K.; Zavadskas, E.K. The MOORA method and its application to privatization in a transition economy. Control. Cybern. 2006, 35, 445–469. [Google Scholar]
- Datta, S.; Sahu, N.; Mahapatra, S. Robot selection based on grey-MULTIMOORA approach. Grey Syst. Theory Appl. 2013, 3, 201–232. [Google Scholar] [CrossRef]
- Zavadskas, E.K.; Antucheviciene, J. Multiple criteria evaluation of rural building’s regeneration alternatives. Build. Environ. 2007, 42, 436–451. [Google Scholar] [CrossRef]
Figure 1.
The flowchart of the proposed algorithm for selecting a wheat combine.


Table 1.
Brief overview of MCDM in agriculture.
| Author | Year of Publication | Title | Method Used | Research Features |
|---|---|---|---|---|
| Lin and Yang [27] | 1996 | Evaluation of machine selection by the AHP method | AHP | Three methods, TOPSIS, EVAMIX and COPRAS, were used to select the tractor. Finally, using the BORDA and Copeland method, the authors finalized the options. |
| YURDAKUL [28] | 2004 | AHP as a strategic decision-making tool to justify machine tool selection | AHP | Criteria weighting by reviewing published articles in the field of cotton harvesters |
| Isik and Adali [24] | 2016 | A comparative study for the agricultural tractor selection problem | TOPSIS | Combining two multi-criteria decision-making methods for car selection |
| Kohli et al. [25] | 2013 | Multiple attribute decision-making for selection of mechanical cotton harvester | TOPSIS | This article considered the basic criteria for choosing a tractor. |
| Kemal Vatansever and Yiğit Kazançoğlu [29] | 2014 | Integrated usage of fuzzy multi-criteria decision-making techniques for machine selection problems and an application | Fuzzy AHP and fuzzy MOORA | Safety risk assessment |
| George Garcia et al. [22] | 2016 | Agricultural tractor selection: a hybrid and multi-attribute approach | AHP-TOPSIS | Study of agricultural machinery standards and the use of precise mathematical methods |
| Chen and Han [30] | 2012 | Research of the assessment for agricultural machinery driving safety based on AHP-FUZZY method | Fuzzy AHP | Three methods, TOPSIS, EVAMIX and COPRAS, were used to select the tractor. Finally, using the BORDA and COPELAND method, the authors finalized the options. |
| Ali Osman [31] | 2011 | Selection of fro farm machinery selection | Linear programming | Criteria weighting by reviewing published articles in the field of cotton harvesters |
| Hafezalkotob [26] | 2018 | Selection of olive harvesting machine | MULTIMOORA and WASPAS | Combining two multi-criteria decision-making methods for car selection |
| Wu [32] | 2019 | Study on location decision framework of agroforestry biomass cogeneration project: a case of China | Best-worst method and entropy method | Location decision of agroforestry biomass cogeneration |
| Ciric [33] | 2019 | Innovation model of agricultural technologies based on intuitionistic fuzzy sets | Intuitionistic fuzzy sets | To define an algorithm that determines whether or not the land is arable |
| Lukić [34] | 2021 | Application of WASPAS method in the evaluation of efficiency of agricultural enterprises in Serbia | WASPAS | Measuring efficiency of agricultural enterprises |
| Zhou et al. [35] | 2021 | Decision support framework for the risk ranking of agroforestry biomass power generation projects with picture fuzzy information | VIKOR, TODIM | Risk ranking of agroforestry biomass power generation |
Table 2.
Conflict leveling.
| Level of Conflict | Low-Level Conflict | Medium-Level Conflict | High-Level Conflict |
|---|---|---|---|
| Determined interval of conflict | Less than or equal to 4 | Between 4 and 8 | Greater than 8 |
| Management solutions | The criteria and alternatives are approved by the decision-making group, and the conditions are met for entering phase 2. | The decision-making team is asked to re-evaluate the criteria and alternatives with this level of conflict. Then, the leveling of the conflict takes place again. | The third party discusses the above conflicting criteria and alternatives with the committee. He/she expresses their views on eliminating those criteria and alternatives or reconsidering the preferences and, most importantly, providing better criteria or decision alternatives. |
Table 3.
The diagram of the Simos method for weighting decision-makers.
| D4 | D3 | D1 |
|---|---|---|
| D2 |
Table 4.
Weight calculation process in the Simos method for weighting decision-makers.
| R | 1 | 2 | 3 | |
| 0 | 1 | |||
| 1 | 2 | 3 | ||
| 1 | 4 = (0 + 1)3 + 1 | 10 = (2 + 1 + 0)3 + 1 |
Table 5.
The normalization of weight in the Simos method based on education.
| Criteria | D4 | D3 | D1 | D2 | |
| J | 1 | 2 | 3 | 4 | |
| 1 | 4 | 10 | 10 | 25 | |
| 4 | 16 | 40 | 40 | 100 | |
| Weight | 3 | 2 | 1 | 1 |
Table 6.
The final weight of decision-makers using the simple average method.
| Level of Education | Useful Experience in Agricultural Machinery | Relevant Knowledge and Expertise in the Field of Wheat Harvesting | Total | The Final Weight of Decision-Makers | |
|---|---|---|---|---|---|
| 0.4 | 0.0543 | 0.4545 | 0.9088 | 0.302 | |
| 0.4 | 0.0543 | 0.0454 | 0.4999 | 0.166 | |
| 0.16 | 0.3478 | 0.4545 | 0.9623 | 0.32 | |
| 0.04 | 0.5434 | 0.0454 | 0.6288 | 0.209 | |
| Total weight | 1 | 1 | 1 | 2.9996 | 1 |
Table 7.
Basic criteria for selecting a wheat combine model.
| Raw | Basic Criteria | Symbol |
|---|---|---|
| 1 | Grain tank | |
| 2 | Rated horse power | |
| 3 | Unloading speed | |
| 4 | Cleaning area | |
| 5 | Price | |
| 6 | The rate of harvest losses | |
| 7 | After sales services | |
| 8 | Vibration | |
| 9 | Fuel consumption | |
| 10 | Safety and comfort | |
| 11 | Equipment and facilities | |
| 12 | Reliability | |
| 13 | Ability to harvest wet product | |
| 14 | Ability to harvest the dormant product | |
| 15 | Terms of sale |
Table 8.
Alternatives for wheat combine model.
| Raw | Alternatives | Symbol |
|---|---|---|
| 1 | John Deere S690 | |
| 2 | John Deere T670 | |
| 3 | New Holland CR9.90 | |
| 4 | CX8090 New Holland | |
| 5 | New Holland CR970 | |
| 6 | LEXION 780 Claas | |
| 7 | Case Axial-Flow 9240 |
Table 9.
Conflict leveling of wheat combine selection criteria.
| C5 | C6 | C7 | C8 | C9 | C10 | C11 | C12 | C13 | C14 | C15 | |
|---|---|---|---|---|---|---|---|---|---|---|---|
| VH | M | VH | M | M | H | H | L | ML | L | L | |
| VH | M | ML | L | M | VH | VL | MH | ML | ML | L | |
| VH | M | L | H | MH | VH | ML | VH | H | ML | VH | |
| VH | M | H | MH | ML | H | ML | M | M | ML | M | |
| The amount of difference | 0 | 0 | 18 | 13 | 4 | 1 | 10 | 16 | 6 | 1 | 10 |
| Conflict level | low | low | high | high | low | low | high | high | medium | low | high |
Table 10.
Result of re-evaluating the criterion C13.
| DM | C13 | Linguistic Variable Numerical Symbol |
|---|---|---|
| M | 4 | |
| M | 4 | |
| MH | 5 | |
| M | 4 | |
| The degree of conflict | 1 |
Table 11.
Values of quantitative criteria.
| Raw | |||||
|---|---|---|---|---|---|
| 1 | John Deere S690 | 400 | 551 | 3.8 | 10,075 |
| 2 | New Holland CR9.90 | 410 | 530 | 4 | 10,075 |
| 3 | New Holland CR8090 | 330 | 400 | 3.2 | 10,075 |
| 4 | Claas LEXION 780 | 360 | 598 | 3.7 | 9610 |
| 5 | Case Axial-Flow 9240 | 410 | 550 | 4.5 | 10,671 |
Table 12.
Results of evaluation of alternatives under the criteria by four decision-makers.
| Weight of Decision-Makers | Alternatives | |||||||
|---|---|---|---|---|---|---|---|---|
| 0.302 | MH | M | M | M | MH | MH | ||
| VH | M | H | H | M | MH | |||
| ML | M | VH | M | M | H | |||
| M | M | MH | MH | H | H | |||
| H | H | VH | VH | H | MH | |||
| 0.166 | MH | MH | M | MH | MH | M | ||
| VH | M | M | H | M | H | |||
| . | L | H | VH | VH | H | H | ||
| M | M | H | M | VH | H | |||
| VH | MH | MH | MH | H | MH | |||
| 0.32 | M | H | MH | M | H | VH | ||
| VH | M | M | H | H | H | |||
| L | MH | H | MH | M | VH | |||
| M | M | H | M | VH | MH | |||
| H | MH | H | VH | H | VH | |||
| 0.209 | MH | M | MH | MH | H | MH | ||
| H | H | M | H | H | MH | |||
| ML | H | VH | MH | M | VH | |||
| M | M | M | MH | VH | MH | |||
| H | H | H | VH | H | H |
Table 13.
Summary of linguistic variables expressed by four experts.
| MH + MH + M + MH | M + MH + H + M | M + M + MH + MH | M + MH + M + MH | MH + MH + H + H | H + MH + MH + H | |
| VH + VH + VH + H | M + M + M + H | H + M + M + H | H + H + H + H | M + M + H + H | MH + M + H + MH | |
| ML + L + L + ML | M + H + MH + H | VH + VH + H + VH | MH + H + M + H | M + H + M + M | H + H + VH + VH | |
| M + M + M + M | M + M + M + M | MH + H + H + M | MH + M + M + MH | H + VH + VH + VH | H + H + MH + MH | |
| H + VH + H + H | H + MH + MH + H | VH + MH + H + H | VH + MH + VH + VH | H + H + H + H | MH + MH + VH + H | |
| Weight of criteria | 0.195 | 0.017 | 0.044 | 0.019 | 0.044 | 0.044 |
Table 14.
The degree of conflict of the opinion of decision-makers.
| 1 | 4 | 1 | 1 | 1 | 1 | |
| 1 | 2 | 2 | 0 | 2 | 4 | |
| 1 | 4 | 1 | 4 | 2 | 1 | |
| 0 | 0 | 4 | 1 | 1 | 1 | |
| 1 | 1 | 4 | 2 | 0 | 4 | |
| Weight of criteria | 1 | 4 | 1 | 1 | 1 | 1 |
Table 15.
Fuzzy decision matrix taking into account the weight of experts.
| MIN | MIN | MIN | MAX | MAX | MAX | |
|---|---|---|---|---|---|---|
Table 16.
Qualitative evaluation of linguistic variables.
| Linguistic Term | Fuzzy Number |
|---|---|
| Very low (VL) | (0.16, 0, 0) |
| Low (L) | (0.34, 0.16, 0) |
| Medium low (ML) | (0.5, 0.34, 0.16) |
| Moderate (M) | (0.66, 0.5, 0.34) |
| Medium high (MH) | (0.84, 0.66, 0.5) |
| High (H) | 1, 0.84, 0.66)) |
| Very high (VH) | (1, 1, 0.84) |
| Ideal (UORP) | (1, 1, 1) |
Table 17.
Defuzzification of decision matrix.
| MIN | MIN | MIN | MAX | MAX | MAX | |
|---|---|---|---|---|---|---|
| 0.609 | 0.632 | 0.841 | 0.559 | 0.75 | 0.661 | |
| 0.93 | 0.568 | 0.669 | 0.826 | 0.669 | 0.689 | |
| 0.25 | 0.676 | 0.916 | 0.661 | 0.553 | 0.898 | |
| 0.498 | 0.498 | 0.71 | 0.582 | 0.916 | 0.742 | |
| 0.853 | 0.75 | 0.559 | 0.907 | 0.826 | 0.792 | |
| Weight of criteria | 0.195 | 0.017 | 0.044 | 0.019 | 0.044 | 0.044 |
Table 18.
Diagram of Simos method for weighting the criteria of the wheat combine model.
Table 19.
Calculation process for weighting the selection criteria of the wheat combine model.
| R | 1 | 2 | 3 | 4 | 5 | |
| 0 | 2 | 1 | 0 | |||
| 1 | 3 | 2 | 1 | 7 | ||
| 1 | (1 + 0)1.28 + 1 | (3 + 1 + 0)1.28 + 1 | (2 + 3 + 1 + 0)1.28 + 1 | (1 + 2 + 3 + 1 + 0)1.28 + 1 |
Table 20.
Final weighting criteria for selecting a wheat combine model.
| Criteria | |||||||||||
| J | 1 | 2 | 3 | 4 | 5 | 6 | 7 | 8 | 9 | 10 | |
| 1 | 2.28 | 2.28 | 2.28 | 6.12 | 6.12 | 6.12 | 6.12 | 8.68 | 9.96 | 25 | |
| 0.019 | 0.044 | 0.044 | 0.044 | 0.12 | 0.12 | 0.12 | 0.12 | 0.17 | 0.195 | 100 | |
| Weight | 5 | 4 | 4 | 4 | 3 | 3 | 3 | 3 | 2 | 1 |
Table 21.
The final decision matrix for selecting the wheat combine model.
| Raw | Criteria/Alternatives | ||||||||||
|---|---|---|---|---|---|---|---|---|---|---|---|
| 1 | John Deere S690 | 400 | 551 | 3.8 | 10,075 | 0.609 | 0.632 | 0.841 | 0.559 | 0.75 | 0.661 |
| 2 | New Holland CR9.90 | 410 | 530 | 4 | 10,075 | 0.930 | 0.568 | 0.669 | 0.826 | 0.669 | 0.689 |
| 3 | CX8090 New Holland | 330 | 400 | 3.2 | 10,075 | 0.25 | 0.676 | 0.916 | 0.661 | 0.553 | 0.898 |
| 4 | Claas LEXION 780 | 360 | 598 | 3.7 | 9610 | 0.498 | 0.498 | 0.71 | 0.582 | 0.916 | 0.742 |
| 5 | Case Axial-Flow 9240 | 410 | 550 | 4.5 | 10,671 | 0.853 | 0.75 | 0.559 | 0.907 | 0.826 | 0.792 |
Table 22.
Data normalization and ranking the ratio system.
| Raw | Criteria/Alternatives | MAX | MAX | MAX | MAX | MIN | MIN | MIN | MAX | MAX | MAX | The Ratio System | |
|---|---|---|---|---|---|---|---|---|---|---|---|---|---|
| 1 | John Deere S690 | 0.466 | 0.464 | 0.439 | 0.445 | 0.404 | 0.448 | 0.501 | 0.347 | 0.446 | 0.388 | 0.2127 | 1 |
| 2 | New Holland CR9.90 | 0.478 | 0.447 | 0.463 | 0.445 | 0.616 | 0.402 | 0.399 | 0.513 | 0.398 | 0.405 | 0.1203 | 5 |
| 3 | CX8090 New Holland | 0.384 | 0.337 | 0.37 | 0.445 | 0.165 | 0.479 | 0.546 | 0.41 | 0.329 | 0.528 | 0.1655 | 3 |
| 4 | Claas LEXION 780 | 0.419 | 0.504 | 0.428 | 0.425 | 0.33 | 0.353 | 0.423 | 0.361 | 0.545 | 0.436 | 0.1742 | 2 |
| 5 | Case Axial-Flow 9240 | 0.478 | 0.464 | 0.52 | 0.472 | 0.566 | 0.531 | 0.333 | 0.563 | 0.491 | 0.465 | 0.1508 | 4 |
Table 23.
Ranking using the reference point method.
| Raw | Criteria/Alternatives | MAX | MAX | MAX | MAX | MIN | MIN | MIN | MAX | MAX | MAX | The Reference Point Method | |
|---|---|---|---|---|---|---|---|---|---|---|---|---|---|
| 1 | John Deere S690 | 0.466 | 0.464 | 0.439 | 0.445 | 0.404 | 0.448 | 0.501 | 0.347 | 0.446 | 0.388 | 0.0466 | 3 |
| 0.0014 | 0.0048 | 0.0097 | 0.0032 | 0.0466 | 0.0016 | 0.0073 | 0.0041 | 0.0043 | 0.0061 | ||||
| 2 | New Holland CR9.90 | 0.478 | 0.447 | 0.463 | 0.445 | 0.616 | 0.402 | 0.399 | 0.513 | 0.398 | 0.405 | 0.0881 | 5 |
| 0 | 0.0068 | 0.0068 | 0.0032 | 0.0881 | 0.0008 | 0.0029 | 0.0009 | 0.0064 | 0.0054 | ||||
| 3 | CX8090 New Holland | 0.384 | 0.337 | 0.37 | 0.445 | 0.165 | 0.479 | 0.546 | 0.41 | 0.329 | 0.528 | 0.02 | 1 |
| 0.0112 | 0.02 | 0.018 | 0.0032 | 0 | 0.0021 | 0.0093 | 0.0029 | 0.0095 | 0 | ||||
| 4 | Claas LEXION 780 | 0.419 | 0.504 | 0.428 | 0.425 | 0.33 | 0.353 | 0.423 | 0.361 | 0.545 | 0.436 | 0.0321 | 2 |
| 0.007 | 0 | 0.011 | 0.0056 | 0.0321 | 0 | 0.0039 | 0.0038 | 0 | 0.004 | ||||
| 5 | Case Axial-Flow 9240 | 0.478 | 0.464 | 0.52 | 0.472 | 0.566 | 0.531 | 0.333 | 0.563 | 0.491 | 0.465 | 0.0781 | 4 |
| 0 | 0.0048 | 0 | 0 | 0.0781 | 0.003 | 0 | 0 | 0.0023 | 0.0027 | ||||
| 0.478 | 0.504 | 0.52 | 0.472 | 0.165 | 0.353 | 0.333 | 0.563 | 0.545 | 0.528 | ||||
| Weight of criteria | 0.12 | 0.12 | 0.12 | 0.12 | 0.195 | 0.017 | 0.044 | 0.019 | 0.044 | 0.044 | |||
Table 24.
Ranking using the full multiplicative form.
| Raw | Criteria/Alternatives | MAX | MAX | MAX | MAX | MIN | MIN | MIN | MAX | MAX | MAX | The Full Multiplicative Form | |
|---|---|---|---|---|---|---|---|---|---|---|---|---|---|
| 1 | John Deere S690 | 0.466 | 0.464 | 0.439 | 0.445 | 0.404 | 0.448 | 0.501 | 0.347 | 0.446 | 0.388 | 0.7754 | 3 |
| 2 | New Holland CR9.90 | 0.478 | 0.447 | 0.463 | 0.445 | 0.617 | 0.402 | 0.399 | 0.513 | 0.398 | 0.405 | 0.7278 | 5 |
| 3 | CX8090 New Holland | 0.384 | 0.337 | 0.370 | 0.445 | 0.165 | 0.479 | 0.546 | 0.41 | 0.329 | 0.528 | 0.8476 | 1 |
| 4 | Claas LEXION 780 | 0.419 | 0.504 | 0.428 | 0.445 | 0.33 | 0.353 | 0.423 | 0.361 | 0.545 | 0.436 | 0.8171 | 2 |
| 5 | Case Axial-Flow 9240 | 0.478 | 0.464 | 0.520 | 0.472 | 0.566 | 0.531 | 0.333 | 0.563 | 0.491 | 0.465 | 0.7748 | 4 |
| Weight of criteria | 0.12 | 0.12 | 0.12 | 0.12 | 0.195 | 0.017 | 0.044 | 0.019 | 0.044 | 0.044 | |||
Table 25.
Final ranking using the dominance method.
| Raw | Methods/Alternatives | The Ratio System | The Reference Point Method | The Full Multiplicative Form | Final Ranking |
|---|---|---|---|---|---|
| 1 | John Deere S690 | 1 | 3 | 3 | 3 |
| 2 | New Holland CR9.90 | 5 | 5 | 5 | 5 |
| 3 | CX8090 New Holland | 3 | 1 | 1 | 1 |
| 4 | Claas LEXION 780 | 2 | 2 | 2 | 2 |
| 5 | Case Axial-Flow 9240 | 4 | 4 | 4 | 4 |
Publisher’s Note: MDPI stays neutral with regard to jurisdictional claims in published maps and institutional affiliations. |
© 2022 by the authors. Licensee MDPI, Basel, Switzerland. This article is an open access article distributed under the terms and conditions of the Creative Commons Attribution (CC BY) license (https://creativecommons.org/licenses/by/4.0/).
Share and Cite
MDPI and ACS Style
Lalghorbani, H.; Jahan, A. Selection of a Wheat Harvester according to Qualitative and Quantitative Criteria. Sustainability 2022, 14, 1313. https://0-doi-org.brum.beds.ac.uk/10.3390/su14031313
AMA Style
Lalghorbani H, Jahan A. Selection of a Wheat Harvester according to Qualitative and Quantitative Criteria. Sustainability. 2022; 14(3):1313. https://0-doi-org.brum.beds.ac.uk/10.3390/su14031313
Chicago/Turabian StyleLalghorbani, Hadi, and Ali Jahan. 2022. "Selection of a Wheat Harvester according to Qualitative and Quantitative Criteria" Sustainability 14, no. 3: 1313. https://0-doi-org.brum.beds.ac.uk/10.3390/su14031313
Note that from the first issue of 2016, this journal uses article numbers instead of page numbers. See further details here.