Article

Optimizing the Location of Park-and-Ride Facilities in Suburban and Urban Areas Considering the Characteristics of Coverage Requirements

1
College of Transportation, Jilin University, Changchun 130022, China
2
Deppon Logistics Co., Ltd., Shanghai 201702, China
*
Author to whom correspondence should be addressed.
Sustainability 2022, 14(3), 1502; https://0-doi-org.brum.beds.ac.uk/10.3390/su14031502
Submission received: 23 November 2021 / Revised: 21 January 2022 / Accepted: 26 January 2022 / Published: 27 January 2022
(This article belongs to the Special Issue Sustainable Transport Planning and Decision-making)

Abstract

:
Within the scope of sustainability, the development of park-and-ride (P&R) facilities can reduce the exhaust emissions of motor vehicles and help build an environmentally friendly society. The location of P&R facilities is the primary consideration in planning, and it plays a decisive role in their transportation, environmental and economic benefits. Given the difficulty of obtaining full data information of traffic network attributes and travel demand characteristics, in this study the P&R facilities in the outer suburbs and cities as were taken as the research object, with a simplified transportation network, improving the principle of nearby selection and 0–1 demand coverage in existing research. By analyzing the P&R facility coverage and demand intensity characteristics, a P&R facility location model considering the coverage demand characteristics was constructed, and a solution algorithm is proposed. The validity of the established model was verified by comparing the existing location model and conducting sensitivity analysis.

1. Introduction

With the acceleration of the urbanization process in China, the size of cities and towns is continuously expanding, and residents’ travel is gradually transitioning from single-mode to multi-mode [1,2]. As an measure of traffic demand management, P&R is an important way to guide the conversion of individual travel modes to public transport modes, increase the urban public transport ratio, alleviate road traffic congestion, and reduce vehicle exhaust emissions [3,4,5].
The concept of park and ride was first proposed by Austin MacDonald [6]. The related research on P&R facility planning is mainly divided into the P&R facility location problem, P&R facility parking charge problem [7,8,9], and P&R facility evaluation problem [10]. Wiseman et al. [11] conducted a study on P&R facilities at the edge of the Adelaide Central Business District in Australia and studied the uncertainty of the impact of P&R on travel behavior. Duncan and Christensen [12] conducted a study on whether government departments need to build P&R facilities considering the new rail transit system. The results show that due to the development trend of public transportation, government departments will be more inclined to deploy P&R facilities. Domestic and foreign scholars mainly use the P median location model, coverage location model, and closure location model to optimize the location of P&R facilities.
Combined with the P median location model, using the P-hub location method, Aros-Vera et al. [13] established a hybrid linear programming model to maximize the users of P&R facilities. The model assumes that travelers can choose to travel by P&R or use a private vehicle to go to the destination, and the travel mode selection behavior follows the logit model. Cavadas et al. [14]. Considered the conventional bus travel mode on the basis of Aros-Vera et al., distinguished the driving area of urban and suburban sections, and optimized the location model of P&R facilities with the goal of minimizing the driving distance of private vehicles in the city. He et al. [15] applied the P median location model to the location scenario of P&R facilities in the outer suburbs and established a multi-objective location model by minimizing the total weighted distance between P&R facilities and demand points in the outer suburbs and maximizing the existing P&R facilities. Taking the generalized travel cost as the quantitative index, Fang et al. [16] constructed the P&R facility selection behavior model, aiming at the maximum P&R travel demand for travelers, and constructed the location model with P&R travel attraction rate and P&R facility capacity as constraints.
Combined with the coverage model, Bilal and Alan [17] proposed a multi-objective P&R facility location optimization model, with the goal of maximizing the potential demand for P&R facility coverage, minimizing the total distance between P&R facilities and main roads, and maximizing utilization of existing P&R facilities. Lu and Guo [18] based on the criteria of maximizing the coverage of P&R facilities and minimizing the number of P&R facilities added spatial fairness constraints to avoid spatial aggregation, establishing a dual-objective P&R facility location model under spatial fairness constraints. He [15], Chen [19], and Zhang [20] applied the set coverage model to the edge P&R facility location model and constructed the P&R facility location model from the point of view of saving investment costs with the goal of maximizing the utilization of existing P&R facilities. Lu et al. [21] assumed that there is a non-linear relationship between the potential P&R travel demand and the distance between the demand point and the P&R facility, used the distance attenuation function to modify the P&R travel demand, and constructed the P&R facility location model with the goal of maximizing the transfer passenger flow and minimizing the construction cost.
Combined with the closure location model, Horner and Groves [22] constructed a P&R facility location model from the perspective of the road network with the goal of maximizing the mileage of the P&R travelers removed from the network. Both He [15] and Chen [19] set up a network closure location model under uncertain scenarios based on highway network and introduced the concept of regret degree as the objective function of the model to optimize P&R facilities with the goal of minimizing the maximum absolute regret degree in all cases. Based on the location model of P&R facilities in rail transit network, Wang [23] aimed to minimize the total travel time between the newly added P&R facilities and major roads and set the weight coefficient according to different objectives based on the greedy algorithm to solve the problem. Based on the analysis of the influence of the attraction range of adjacent P&R facilities, Cheng [24] constructed a P&R facility location model aiming at the maximum vehicle mileage on the closure network, the minimum cost-effectiveness ratio of the network, and the maximum total surplus of P&R users in the network. Gong [25] believed that in the case of the same mileage of closure, the driving time of vehicles in congested sections is smaller than that of unobstructed sections, so the maximum time cost of intercepted vehicles was taken as the horizontal index of closure to build a location model. Considering the influence of groups on the attraction intensity of travelers near rail transit stations, Zhang [20] analyzed the interaction between groups according to the gravity model, calculated the potential demand for transfer in the service area covered by stations on rail transit lines and then constructed a P&R facility location model with the goal of maximizing the mileage and minimizing the total construction cost on the whole rail network. Yang et al. [26] and Yang [27] considered that when it takes longer for travelers to travel by private vehicle than by P&R, there are penalty fees for being late to work and road congestion fees. Therefore, a closure location model was constructed by comprehensively considering P&R travel cost, vehicle depreciation fee, exhaust emission cost, and penalty cost.
Based on the current situation and trend of urbanization, this study combined the characteristics of transit network, the characteristics of facility supply and the difference of travel demand with the existing location methods, and further research was carried out. The research results of domestic and foreign scholars on the location of P&R facilities provide a detailed theoretical basis for this study, but there are still some deficiencies.
There are few studies on the level of P&R facilities and information acquisition [15,19]. The regional development of urbanization and the characteristics of inter-regional travel demand make P&R facilities hierarchical. The hierarchical structure of P&R facilities should be focused on the outer suburbs and urban P&R facilities, and then targeted research should be carried out. P&R facilities in the outer suburbs serve the travel demand between satellite towns and central towns. Generally, they are located separately along intercity rail transit lines, connecting with intercity railways, intercity rail transit, commuter railways, etc., such as the American “bus community” that relies on the revival of rail transit stations. The P&R facilities in the urban area serve the travel demand of the urban area and are generally arranged in a ring on the outer ring of the urban area, connecting with the urban rail transit, mainly for the purpose of closuring the vehicles going to the center of the urban area. For example, Cambridge has set up surrounding P&R facilities at the five major entrances and exits in the urban center, supplemented by dedicated bus lines, so as to ensure a travel time of about 15 min between the P&R facilities and the urban center. In addition, in the process of urbanization, it is difficult to fully obtain the data information of traffic network attributes and travel demand characteristics. In this case, it is necessary to build a simplified network for modeling and analysis.
In terms of P&R facility coverage, most of the existing studies [19,24] involve the application of traditional facility locations such as factories, hospitals, stores, and warehouses, without taking into account the characteristics of P&R facility coverage requirements. In terms of P&R facility coverage demand, based on the set coverage location model, the maximum coverage location model, and the closure location model, it is assumed that the P&R coverage demand range is 0–1 coverage within a fixed distance and does not take into account the P&R facility coverage demand characteristics. Since passengers need to walk to the transit station to transfer after parking their vehicles at the P&R facility during the trip, the alternative points of the P&R facility are often located near the transit station. Therefore, the coverage demand of P&R facilities should be comprehensively considered according to the layout of transit stations, combined with the accessibility of P&R facilities and travel choice behavior. For example, when the demand point is near the transit station, compared with the transit station, within the acceptable walking range of the transit station, travelers often choose to walk directly to the transit station to transfer to transit. At the same time, with the increase in the distance between the demand point and the P&R facility, the demand for P&R coverage will decrease. Therefore, on the basis of determining the coverage demand range of P&R facilities, the demand intensity within the coverage demand range should be analyzed according to the distance between the demand point and P&R facilities.
In terms of travel choice behavior, existing studies [21,28] often assume that the service model of P&R facilities is a single facility serving a single demand, that is, assuming that the distance between P&R facilities should be greater than the radius of facility coverage or that the travel demand is the nearest choice and does not take into account the scenario of multiple P&R facilities for travelers to choose. However, when travelers are faced with multiple choices of P&R facilities, the nearest P&R facilities may be abandoned due to higher fees, poor surrounding traffic conditions, or low parking success ratio due to the small size of the parking lot. In addition, according to the geographical location and capacity limitation of P&R facilities, more P&R facilities are needed in the areas with high potential demand. Therefore, in a simplified traffic network with incomplete information of road section attributes and travel demand characteristics, the P&R facility location model should be optimized by comprehensively considering P&R facility coverage demand characteristics and travel choice behavior characteristics.
Based on the above analysis, the research contribution is as follows: Assuming that the data information of traffic network attributes and travel demand characteristics is incomplete, combined with the spatial layout of rail transit stations, the coverage of P&R facilities was analyzed, and the nearest selection principle and demand coverage principle in the existing research [15,18] were improved. Considering the influence of travel distance on P&R facility coverage demand, with the goal of truncating the maximum mileage of private vehicles and the maximum P&R facility coverage demand, this study constructed P&R facility location models in the outer suburbs based on travel choice behavior and in the urban area based on the progressive cooperative coverage model.

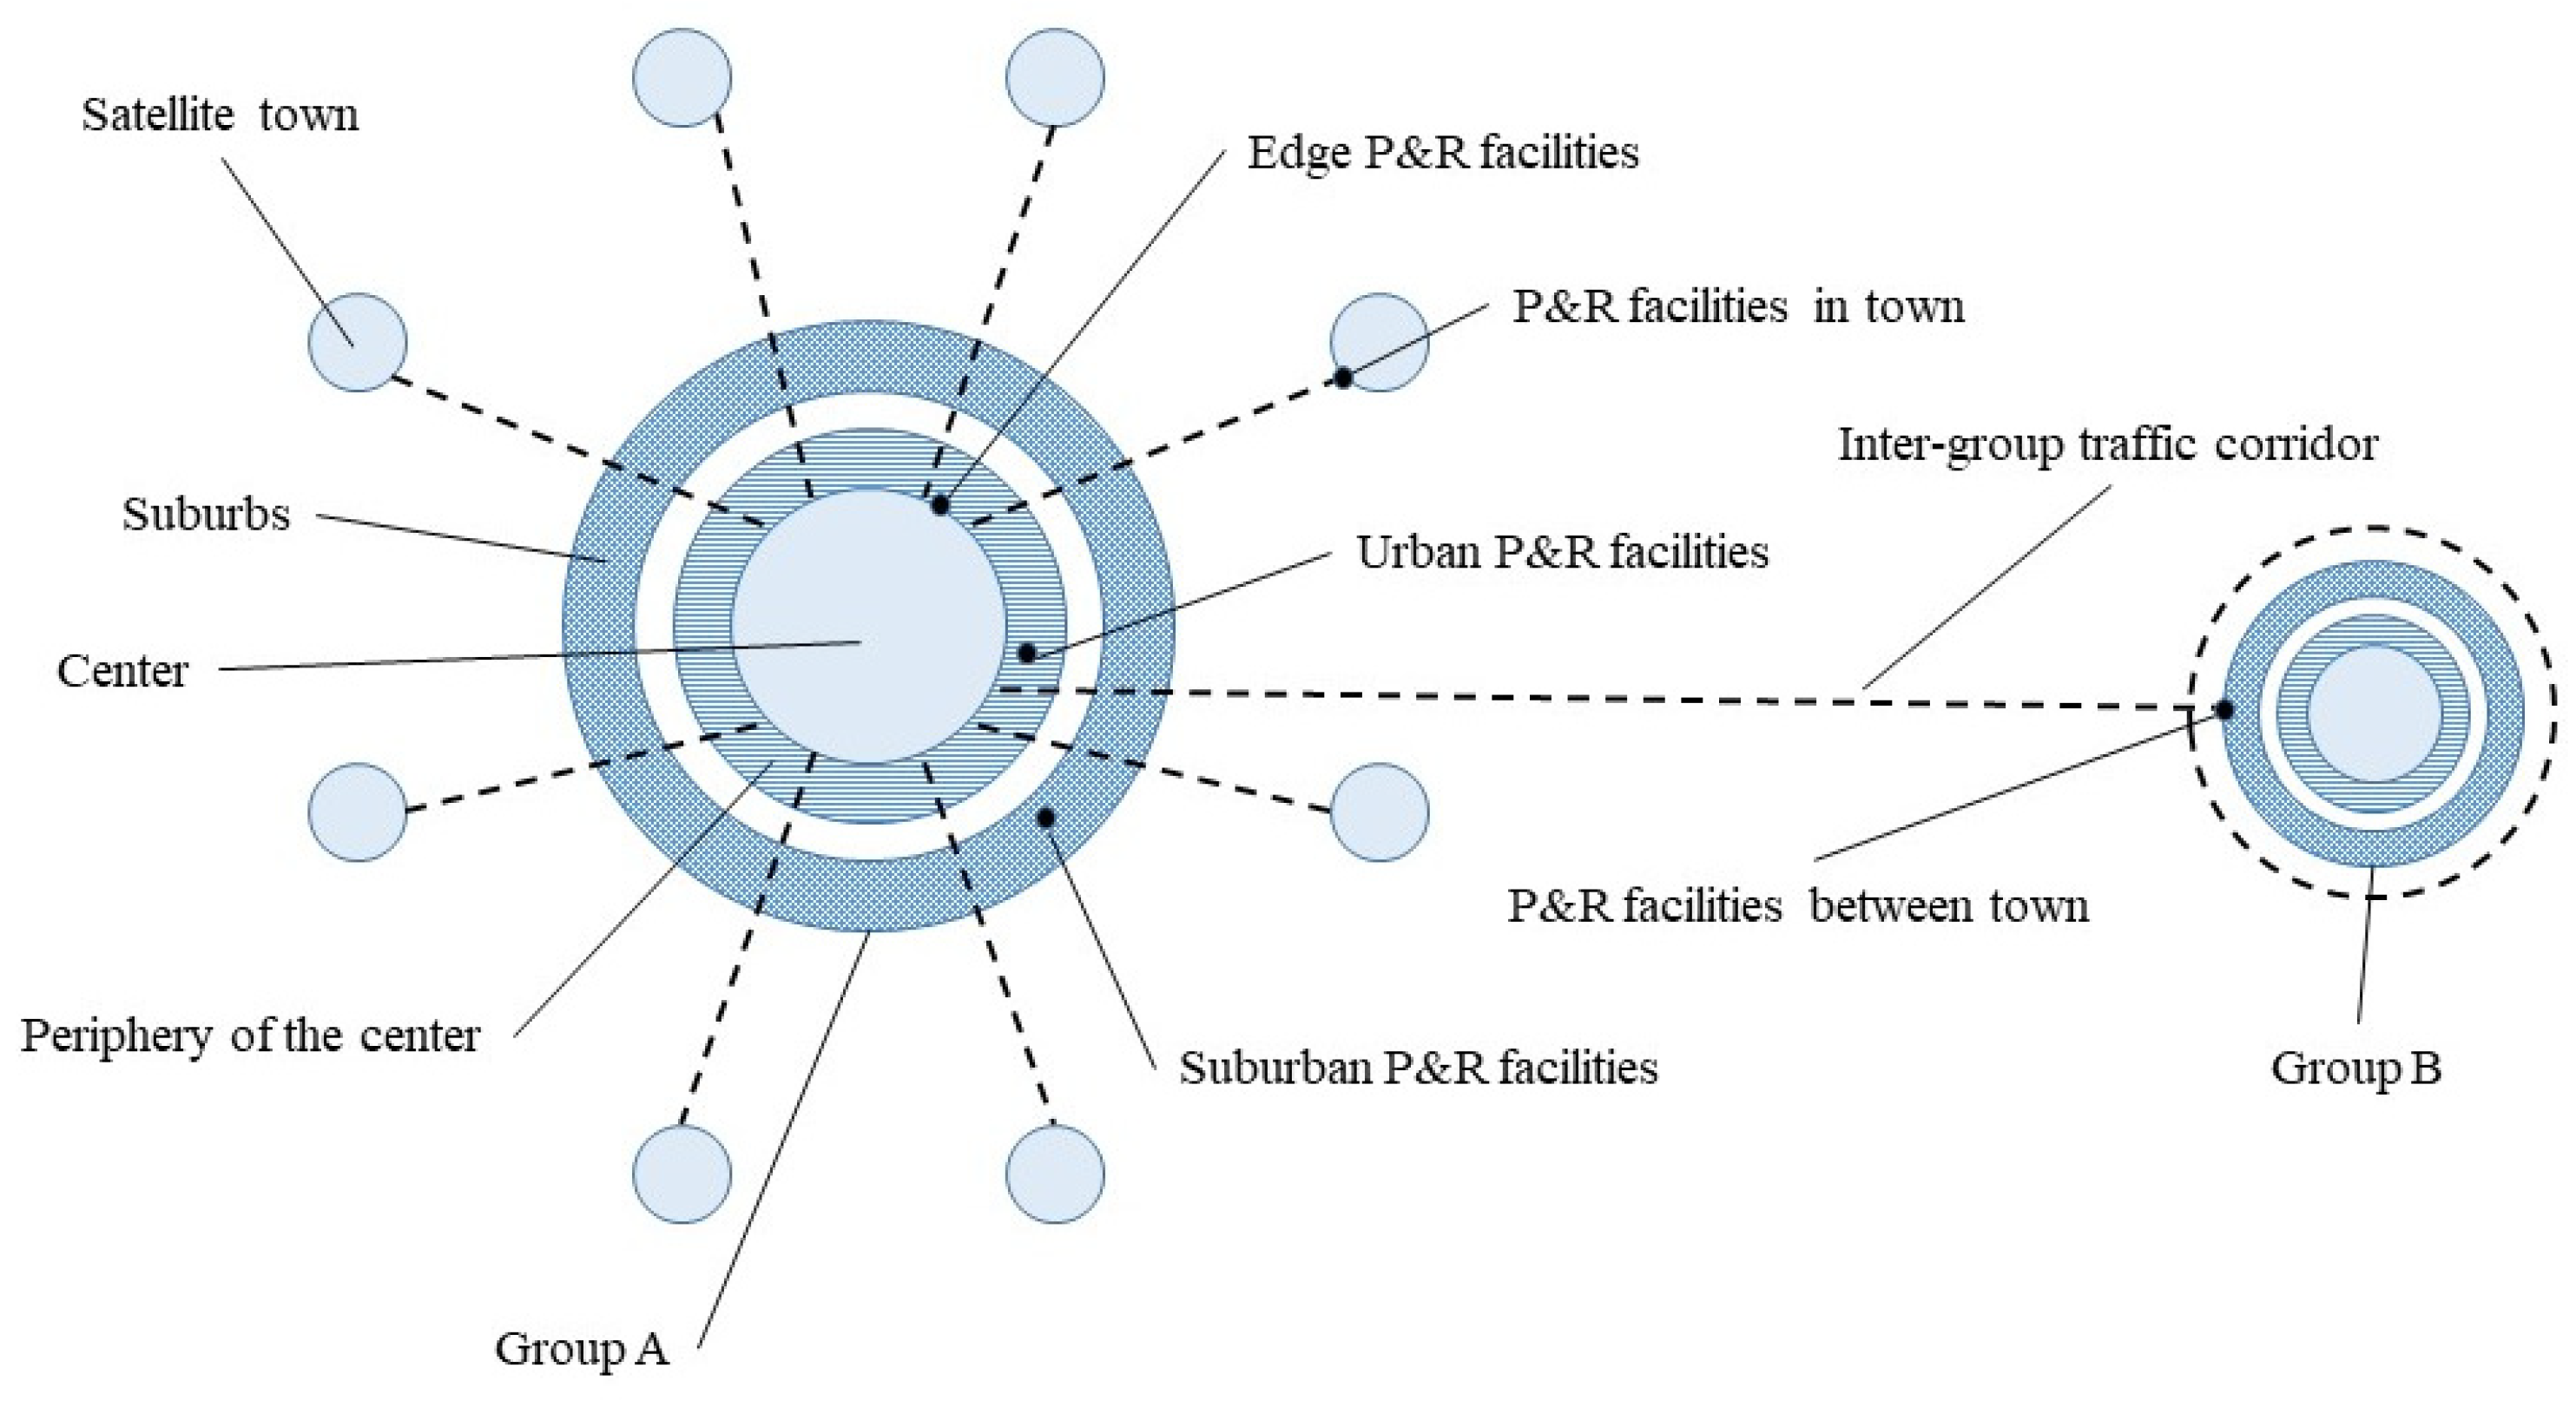
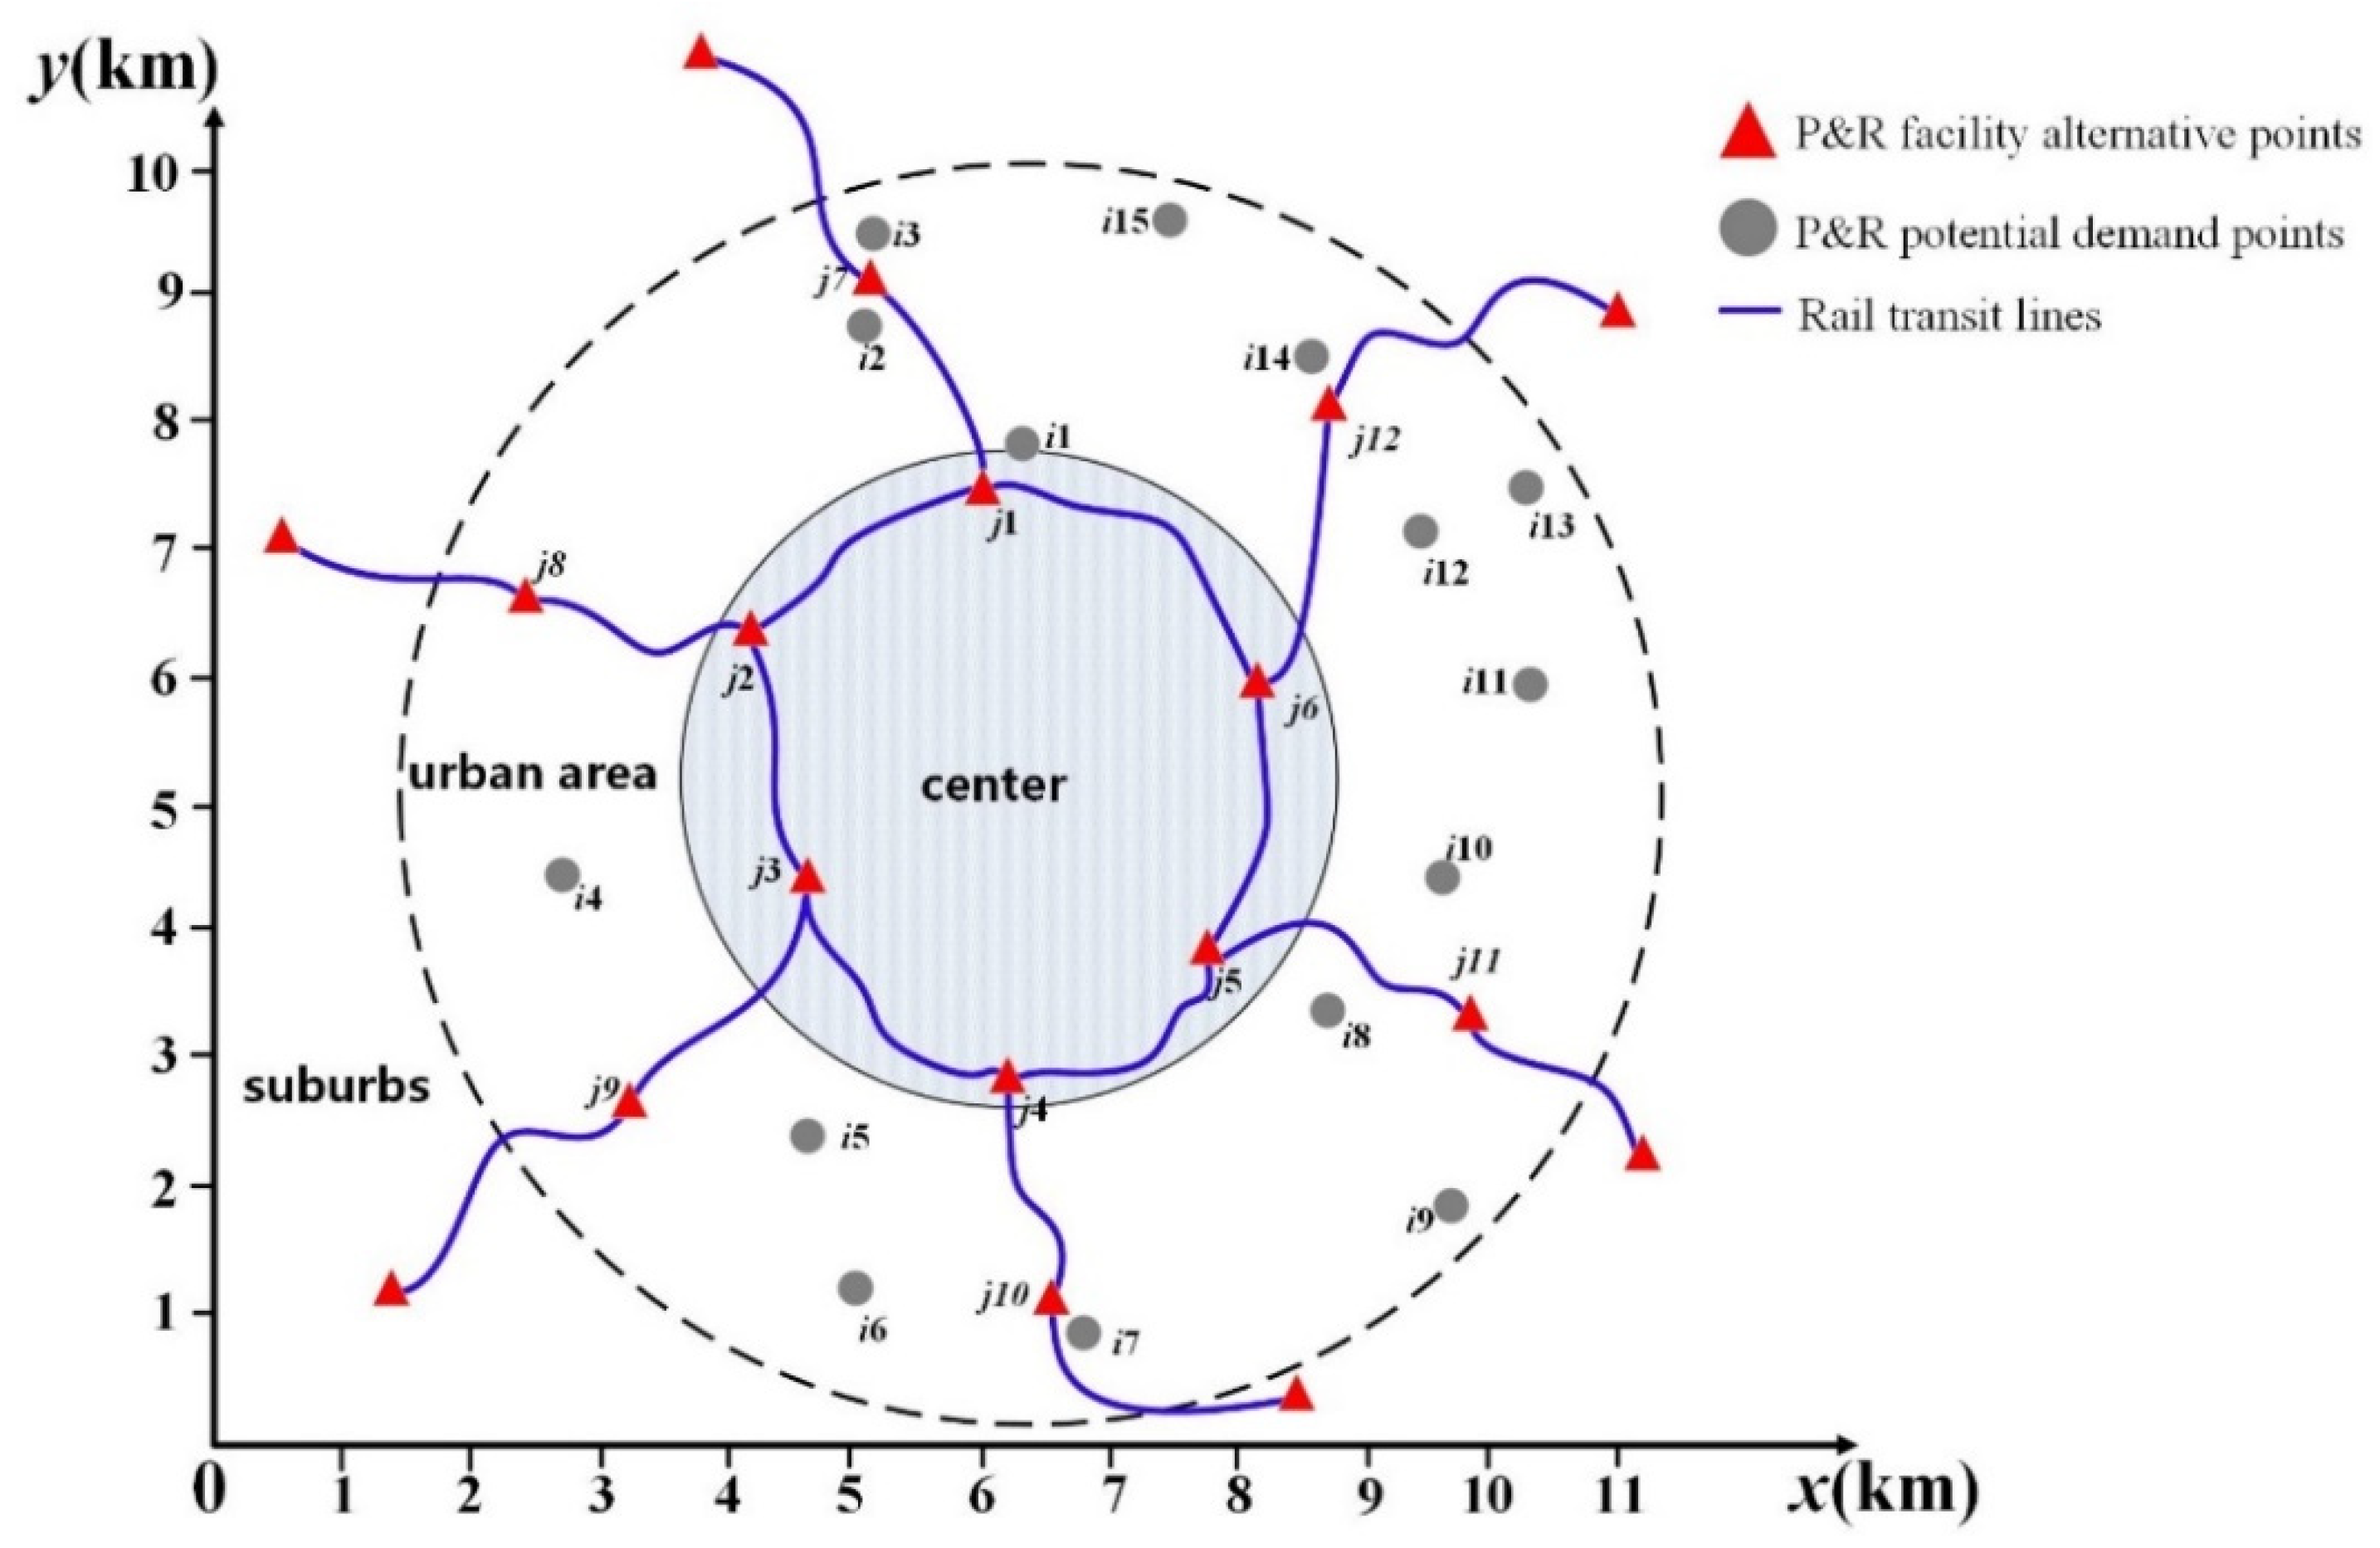
2. Problem Formulation

With the acceleration of urbanization, P&R facilities in the outer suburbs and urban areas play different roles, forming a multi-level P&R facility layout model.
Figure 1 illustrates P&R facility hierarchies. The P&R facilities in the outer suburbs are located in various clusters or satellite cities and mainly serve the travel needs of the outer suburbs to the urban center, enabling travelers to move from the whole journey by private vehicles to P&R. Maximizing the truncated mileage of private vehicles is the main goal of P&R facility location in the outer suburbs. The P&R facilities in the city are located outside the city center and mainly serve the travel needs within the urban area. How to meet the P&R travel demand to most effectively maximize the potential P&R demand for coverage is the main consideration for the location of P&R facilities in the city.
The existing research models are based on two basic assumptions, namely the principle of nearest selection and the principle of 0–1 demand coverage. In terms of the principle of nearby selection, existing studies have not fully considered the characteristics of travelers’ choice of P&R facilities. It is assumed that travelers choose the nearest P&R facility within the scope of P&R facility coverage requirements. In actual situations, travelers will face a variety of travel modes, such as private vehicle travel, combined walking and rail transit, and P&R travel. Travelers will choose P&R facilities or abandon P&R trips after comprehensively considering factors such as travel distance, parking fees, parking lot capacity restrictions, and road service levels. Therefore, the location of P&R facilities should be modeled with the characteristics of travel choice behavior.
In terms of the principle of demand 0–1 coverage, existing studies have not fully considered the characteristics of P&R facility coverage requirements. Assume that the P&R coverage area is a binary coverage mode (0–1 coverage) with only “completely covered” and “not covered at all” within a fixed-distance coverage radius. When the distance between the demand point and the P&R facility is within the acceptable distance range, the P&R potential demand point (the source of private vehicle travel) within the range is regarded as the actual P&R travel demand. However, P&R travel should comprehensively consider the accessibility of P&R facilities and the accessibility of rail transit lines; that is, when travelers are close to rail transit transfer stations, travelers often choose to walk directly to rail transit stations. When the demand point and the rail transit station are beyond the acceptable range of walking and are within the maximum coverage demand of the P&R facility, the potential P&R travel demand will not be fully covered, but it decreases as the distance between the demand point and the facility increases.
In addition, when there are multiple P&R facilities for travelers to choose from, existing studies often assume that a single P&R facility serves the potential demand or that the distance between P&R facilities should be greater than the coverage demand radius of a single facility. However, when the potential demand for P&R is large, a single P&R facility cannot meet the P&R travel demand in the area, and more P&R facilities are often needed to serve travel in areas with greater potential demand. Therefore, the P&R facility location model should comprehensively consider the P&R facility coverage demand characteristics and the scenario where multiple P&R facilities serve multiple demand points.
In summary, according to the functional characteristics of P&R facilities, travel choice behavior characteristics, and P&R facility coverage demand characteristics, this study explored the location of P&R facilities in remote suburbs and urban areas with simplified transportation networks.
Regarding the issue of facility location, it is necessary to consider two factors, the characteristics of facility coverage and travel behavior.
Facility coverage is the primary issue that needs to be resolved in the location of P&R facilities. In the existing studies, it is often assumed that the distance cost or time cost borne by travelers with P&R facilities is not acceptable, which leads to abandonment of the choice of P&R facilities or even P&R travel. Based on the analysis of P&R facility coverage using the P median location model, coverage location model and closure location model, this paper proposes a P&R facility coverage based on rail transit connection, as shown in Figure 2. P&R facilities are set up near rail transit stations, and there are two types of coverage areas and three types of demand points in the area. The first type of coverage area has the rail transit station as the center and the acceptable walking distance (the walked by the traveler from home to the rail transit station) as the radius. The demand points in the area are the blue demand points in Figure 2. Because of their proximity to rail transit stations, blue demand points are more likely to be used to walk to rail transit stations and transfer. The second type of coverage area is centered on the P&R facility and the acceptable range of driving to the P&R facility as the radius, excluding the pedestrian coverage area of the rail transit station. The demand points in the area are the green demand points in Figure 2, and the demand in this area is for P&R travel or private vehicle travel. The third type of coverage area is outside the first and second types of coverage area. The demand points in the area are the gray demand points in Figure 2. The demand in this area is for private vehicle travel.
In terms of travel behavior, on the basis of determining the coverage, this study improved the nearest selection principle in the existing research and analyzed the demand intensity in the coverage. In terms of the demand intensity of P&R facility coverage, an existing study has conducted a survey of P&R facility users in the metropolis of Seattle, USA [29], the results of which are shown in Figure 3.
As can be seen from Figure 3, the demand for P&R facility coverage is unevenly distributed and mostly concentrated around P&R facilities and in the opposite direction of the urban center. The main reason is that travelers are more likely to choose P&R facilities within an acceptable range, and the proportion of P&R trips decreases with the increase in the distance between P&R facilities. Therefore, it is not in line with the actual situation to define the P&R coverage as a binary coverage mode with only “completely covered” and “completely uncovered” within a fixed coverage radius. Based on this, this paper puts forward a method to measure the demand intensity of P&R facility coverage for outer suburb travel and urban travel. In the outer suburb travel scene, the travelers who use the P&R facilities in the outer suburbs often form the commuter flow from the group or the satellite city to the urban center. When the OD of outer suburb travel is relatively fixed and the complete travel OD is easily obtained, the logit model is used to determine the P&R travel ratio and potential travel demand. In the urban travel scene, the demand for P&R travel in the urban area is not limited to commuter traffic to the urban center but also includes other parts of the urban area through the transfer of rail transit through P&R facilities. In view of the complexity of the travel OD, in the case of not obtaining complete travel OD, the P&R facility coverage demand is determined according to the attenuation function of the travel demand with the distance.

3. Model Building

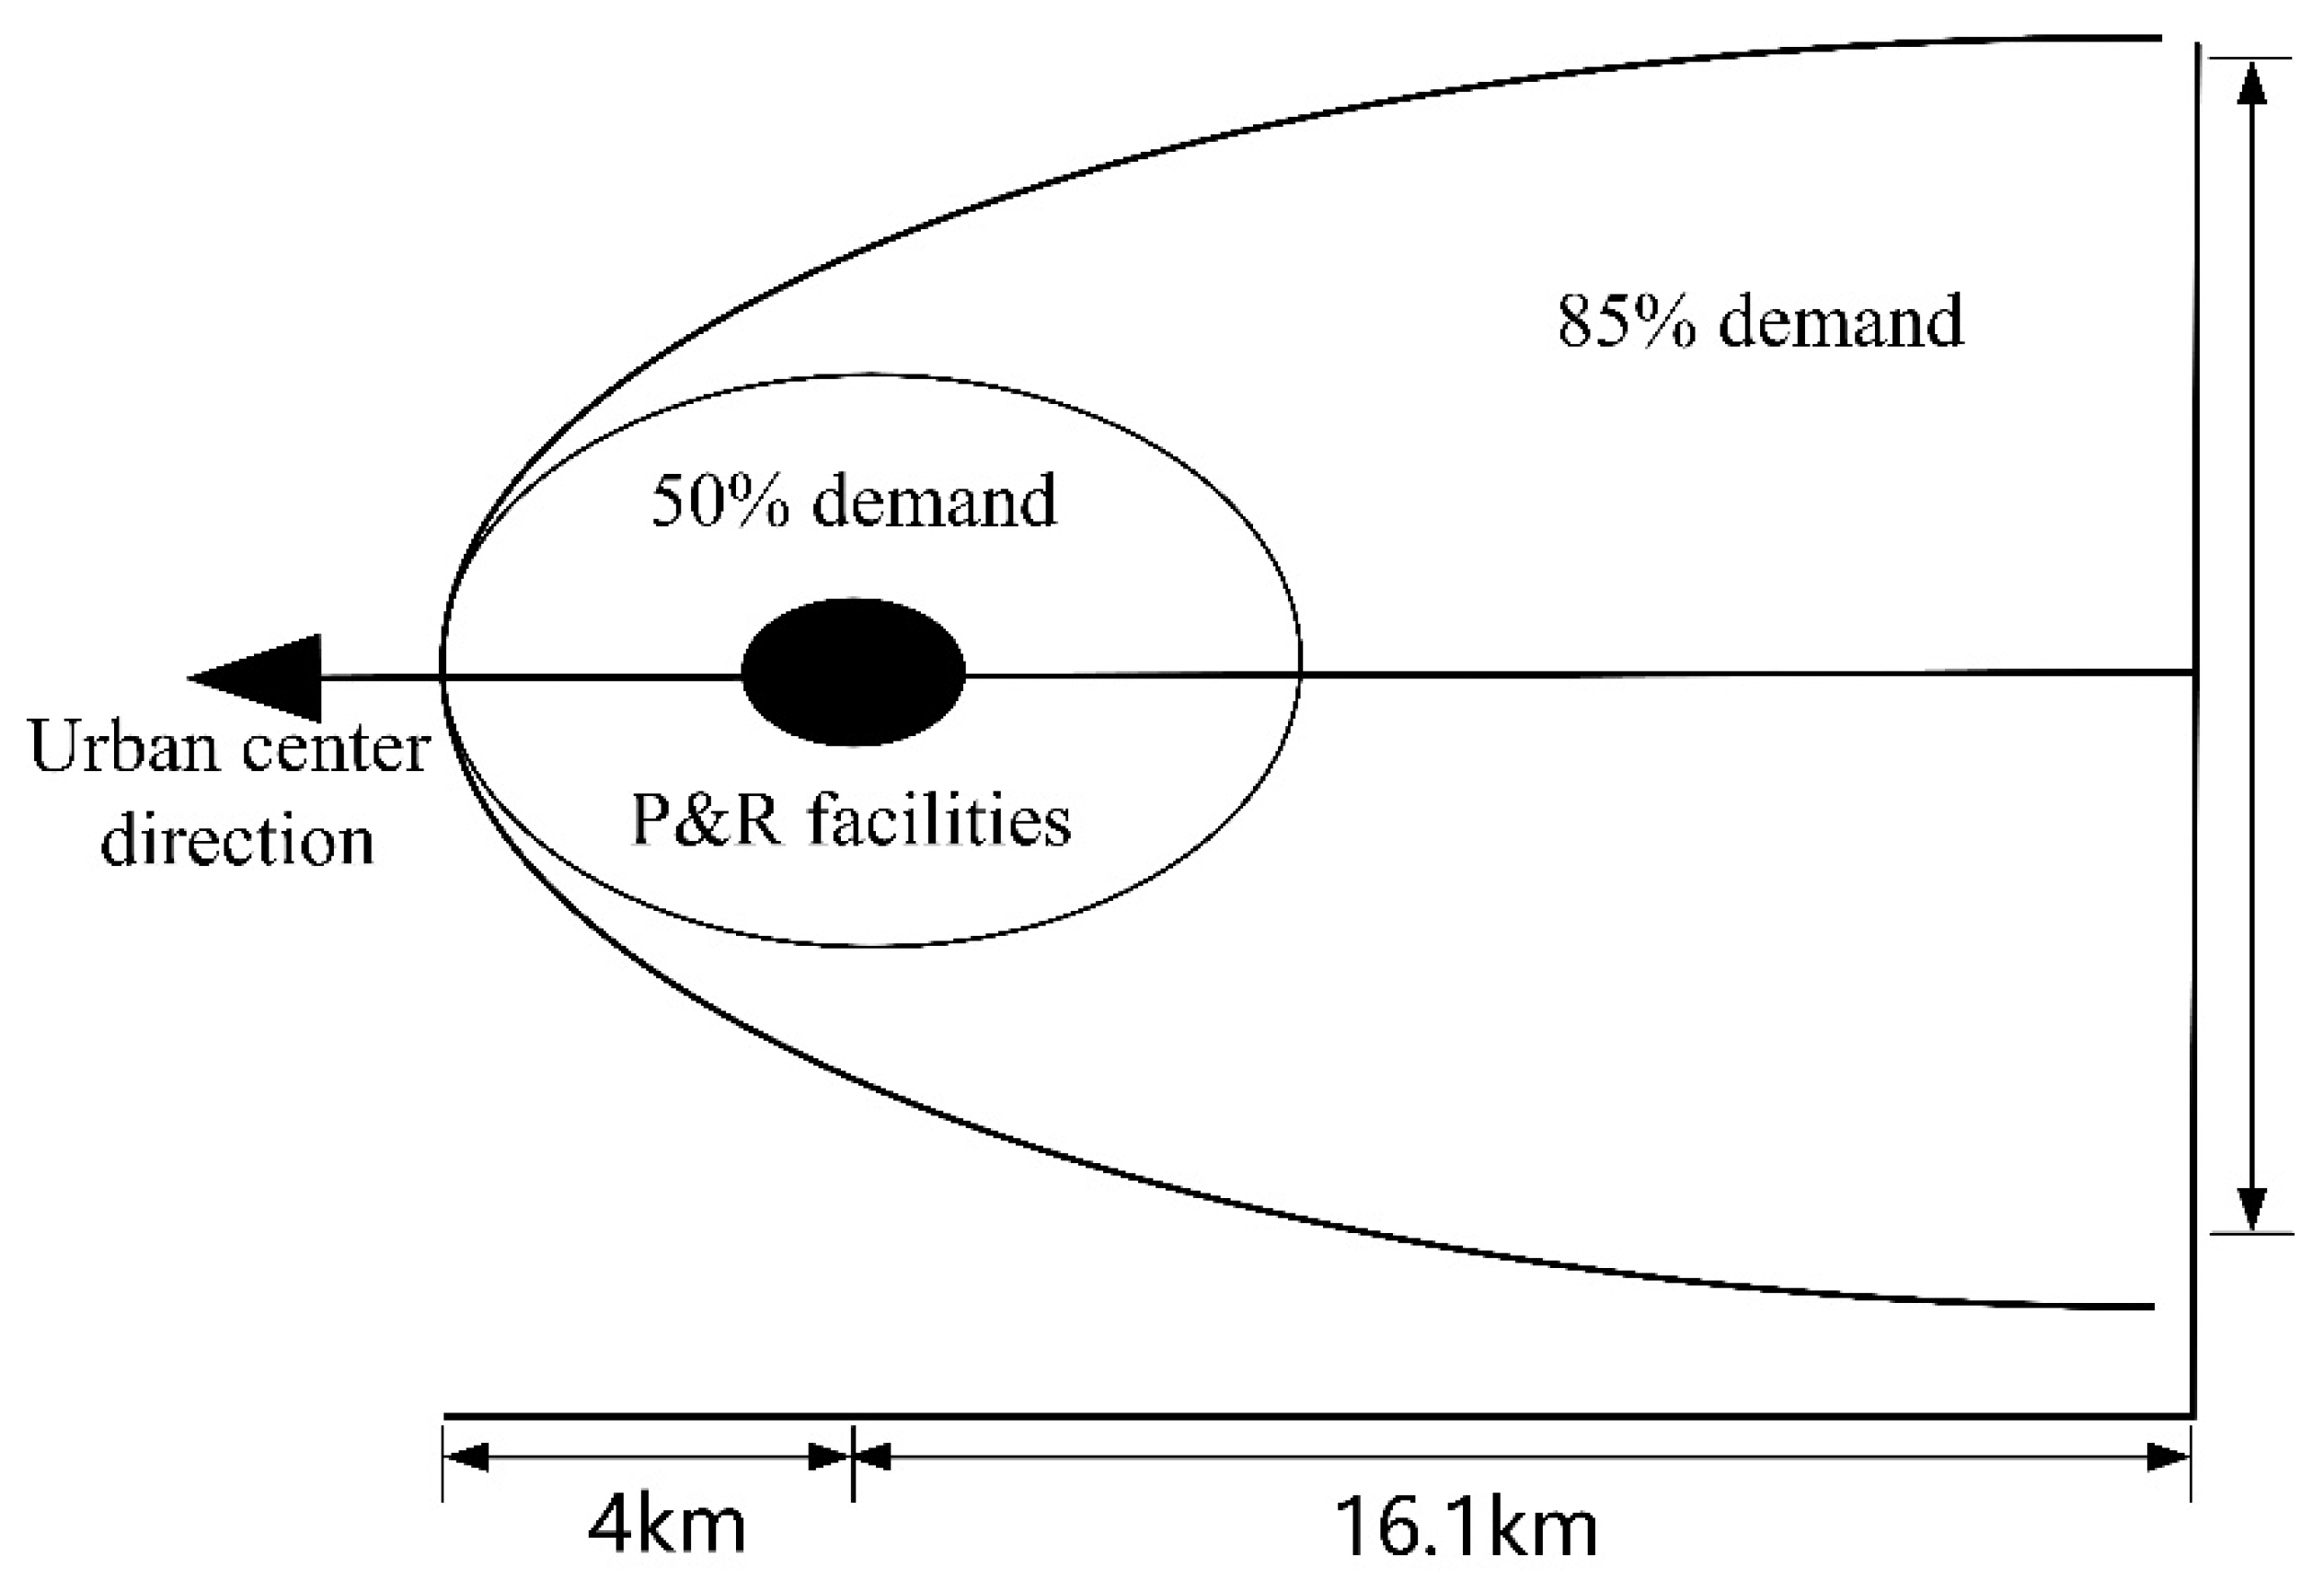
3.1. Location Model of P&R Facilities in Outer Suburbs Based on Travel Choice Behavior

Figure 4 illustrates coverage characteristics of P&R facilities in outer suburbs. In terms of location of P&R facilities in the outer suburbs, it is difficult to obtain a complete travel OD, so it is assumed that all travelers go from the suburban demand point i to the fixed destination z in the city center. I represents the set of potential P&R travel demand points i, iI. K represents the set of rail transit stations k, kK. diz, dij, dik, djz respectively represent the distance from demand point i to the city center z, the distance from demand point i to P&R facility j, the distance from the demand point i to the rail transit station k, and the distance from the P&R facility j to the city center z. P&R facilities j1 and j2 are set up near rail transit stations kn−1 and kn to facilitate transfer. Defining the acceptable walking distance radius for transfer to rail transit as Dw, the demand point collection is I k = { i | d i k D w , k K } , and travelers who gather at Ik choose to walk to the rail transit station to complete their trip. I w = { i | i I k , i I } is a demand point outside the coverage area of Dw of the rail transit station, the acceptable driving distance radius for a private vehicle traveling to a rail transit station is Dc, and the collection of demand points covered by P&R facilities is I p = { i | d i j D c , j J , i I w } . Travelers in the assembly can choose P&R travel or private vehicle travel. The remaining demand points are defined as I n = { i | i I j , i I w } , and all travelers in the assembly choose private vehicles to travel to the destination (city center z).
In terms of travel behavior, considering the impact of travel distance on travel choice behavior, the 0–1 coverage demand constraint is improved to a gradual coverage demand. The set of demand points in the set Ip and the set of P&R facilities that can be selected for i is J i = { j | d i j D c , i I p } . The travel time of travelers using the P&R method at demand point i is composed of the travel time of the private vehicle driving to the P&R facility, the travel time of walking to the rail transit station, the waiting time, and the time of taking the rail transit to the destination as defined in (Equation (1)):
t i j p = d i j v c + d j z v t r + 1 F t r + t p i I , j J
The waiting time of travelers can be calculated according to the departure frequency of the rail transit lines. The traveler’s choice of private vehicle travel time at demand point i can be expressed as follows (Equation (2)):
t i c = d i z v c i I , j J
The constraint of single P&R facilities covering single demand is improved to multiple P&R facilities for multiple demand point selection, and a P&R facility selection model based on logit selection behavior is constructed as follows (Equation (3)):
p i j = e θ t i j p j J i e θ t i j p + e θ t i c i I p , j J i
where t i j p is the travel time from the demand point i to the city center z from the P&R facility j (including private vehicle travel time, rail transit travel time, average rail transit waiting time, parking search time); vc is the average speed of the private vehicle; vtr is the average speed of rail transit; Ftr is the average departure frequency of the rail transit lines; tp is the parking search time in the P&R facility; t i c is the travel time for the demand point i to choose a private vehicle to travel to the city center z; pij is the probability that demand point i chooses P&R facility j; and θ is the user’s sensitivity to travel time.
According to the above analysis, the P&R facility location model based on travel choice behavior in the outer suburbs (model 1) is established as follows (Equation (4)):
max F 1 = i I j J q i p ^ i j ( d i z d i j )
Subject to (Equations (5)–(9)):
j J x j C
α i = { 0         k K , d i k D w 1                         else i I
β i j = { 1         d i j D c 0         d i j > D c         i I , j J
p ^ i j = α i β i j x j e θ t i j p j J β i j x j e θ t i j p + e θ t i c         i I , j J
x j { 0 , 1 } j J
where xj indicates whether to build P&R facilities in the 0–1 variable at candidate point j; qi is the travel demand of demand point i; C is the maximum number of P&R facilities to be constructed; dij is the distance from demand point i to P&R facility j; dik is the distance from demand point i to rail transit station k; and diz is the distance from demand point i to destination z in the city center.
Equation (4) maximizes the closure private vehicle mileage under the constraint of the number of P&R facilities, and diz-dij represents closure mileage of a unit vehicle. Equation (5) is the quantity constraint for the construction of P&R facilities and can also be expressed in the form of constraints such as construction cost constraints or land use constraints. Equation (6) indicates whether the demand point i is covered by rail transit station k, that is, whether the potential P&R travel demand is for travel by rail transit. If there is a rail transit station k covering demand point i, it is 0; otherwise, it is 1. Equation (7) indicates whether demand point i is within the coverage of P&R facility j. When demand point i is within the coverage of P&R facility j, that is dijDc, βij is 1; otherwise, βij is 0. That is, when there are many P&R facilities built in the network, not every P&R facility will be considered by travelers. If the traveler is not covered by the P&R facility j at the demand point i, they will choose other optional P&R facilities to travel or choose a private vehicle to travel. Equation (8) is the probability that demand point i chooses P&R facility j to travel, which is an improvement in Equation (3) based on the decision variables xj and parameters αi, βij. When P&R facilities are not set at candidate point j, xj = 0, the probability of demand point i selecting point j is also 0. When P&R facilities are set at the candidate point j, xj = 1, and the ratio of the demand point i to point j is allocated according to Equation (3). At the same time, the pumped P&R facility j for demand point i should be within the range of acceptable mileage Dw to Dc, that is, dijDc and dik > Dw. Equation (9) is the 0–1 constraint of decision variables.

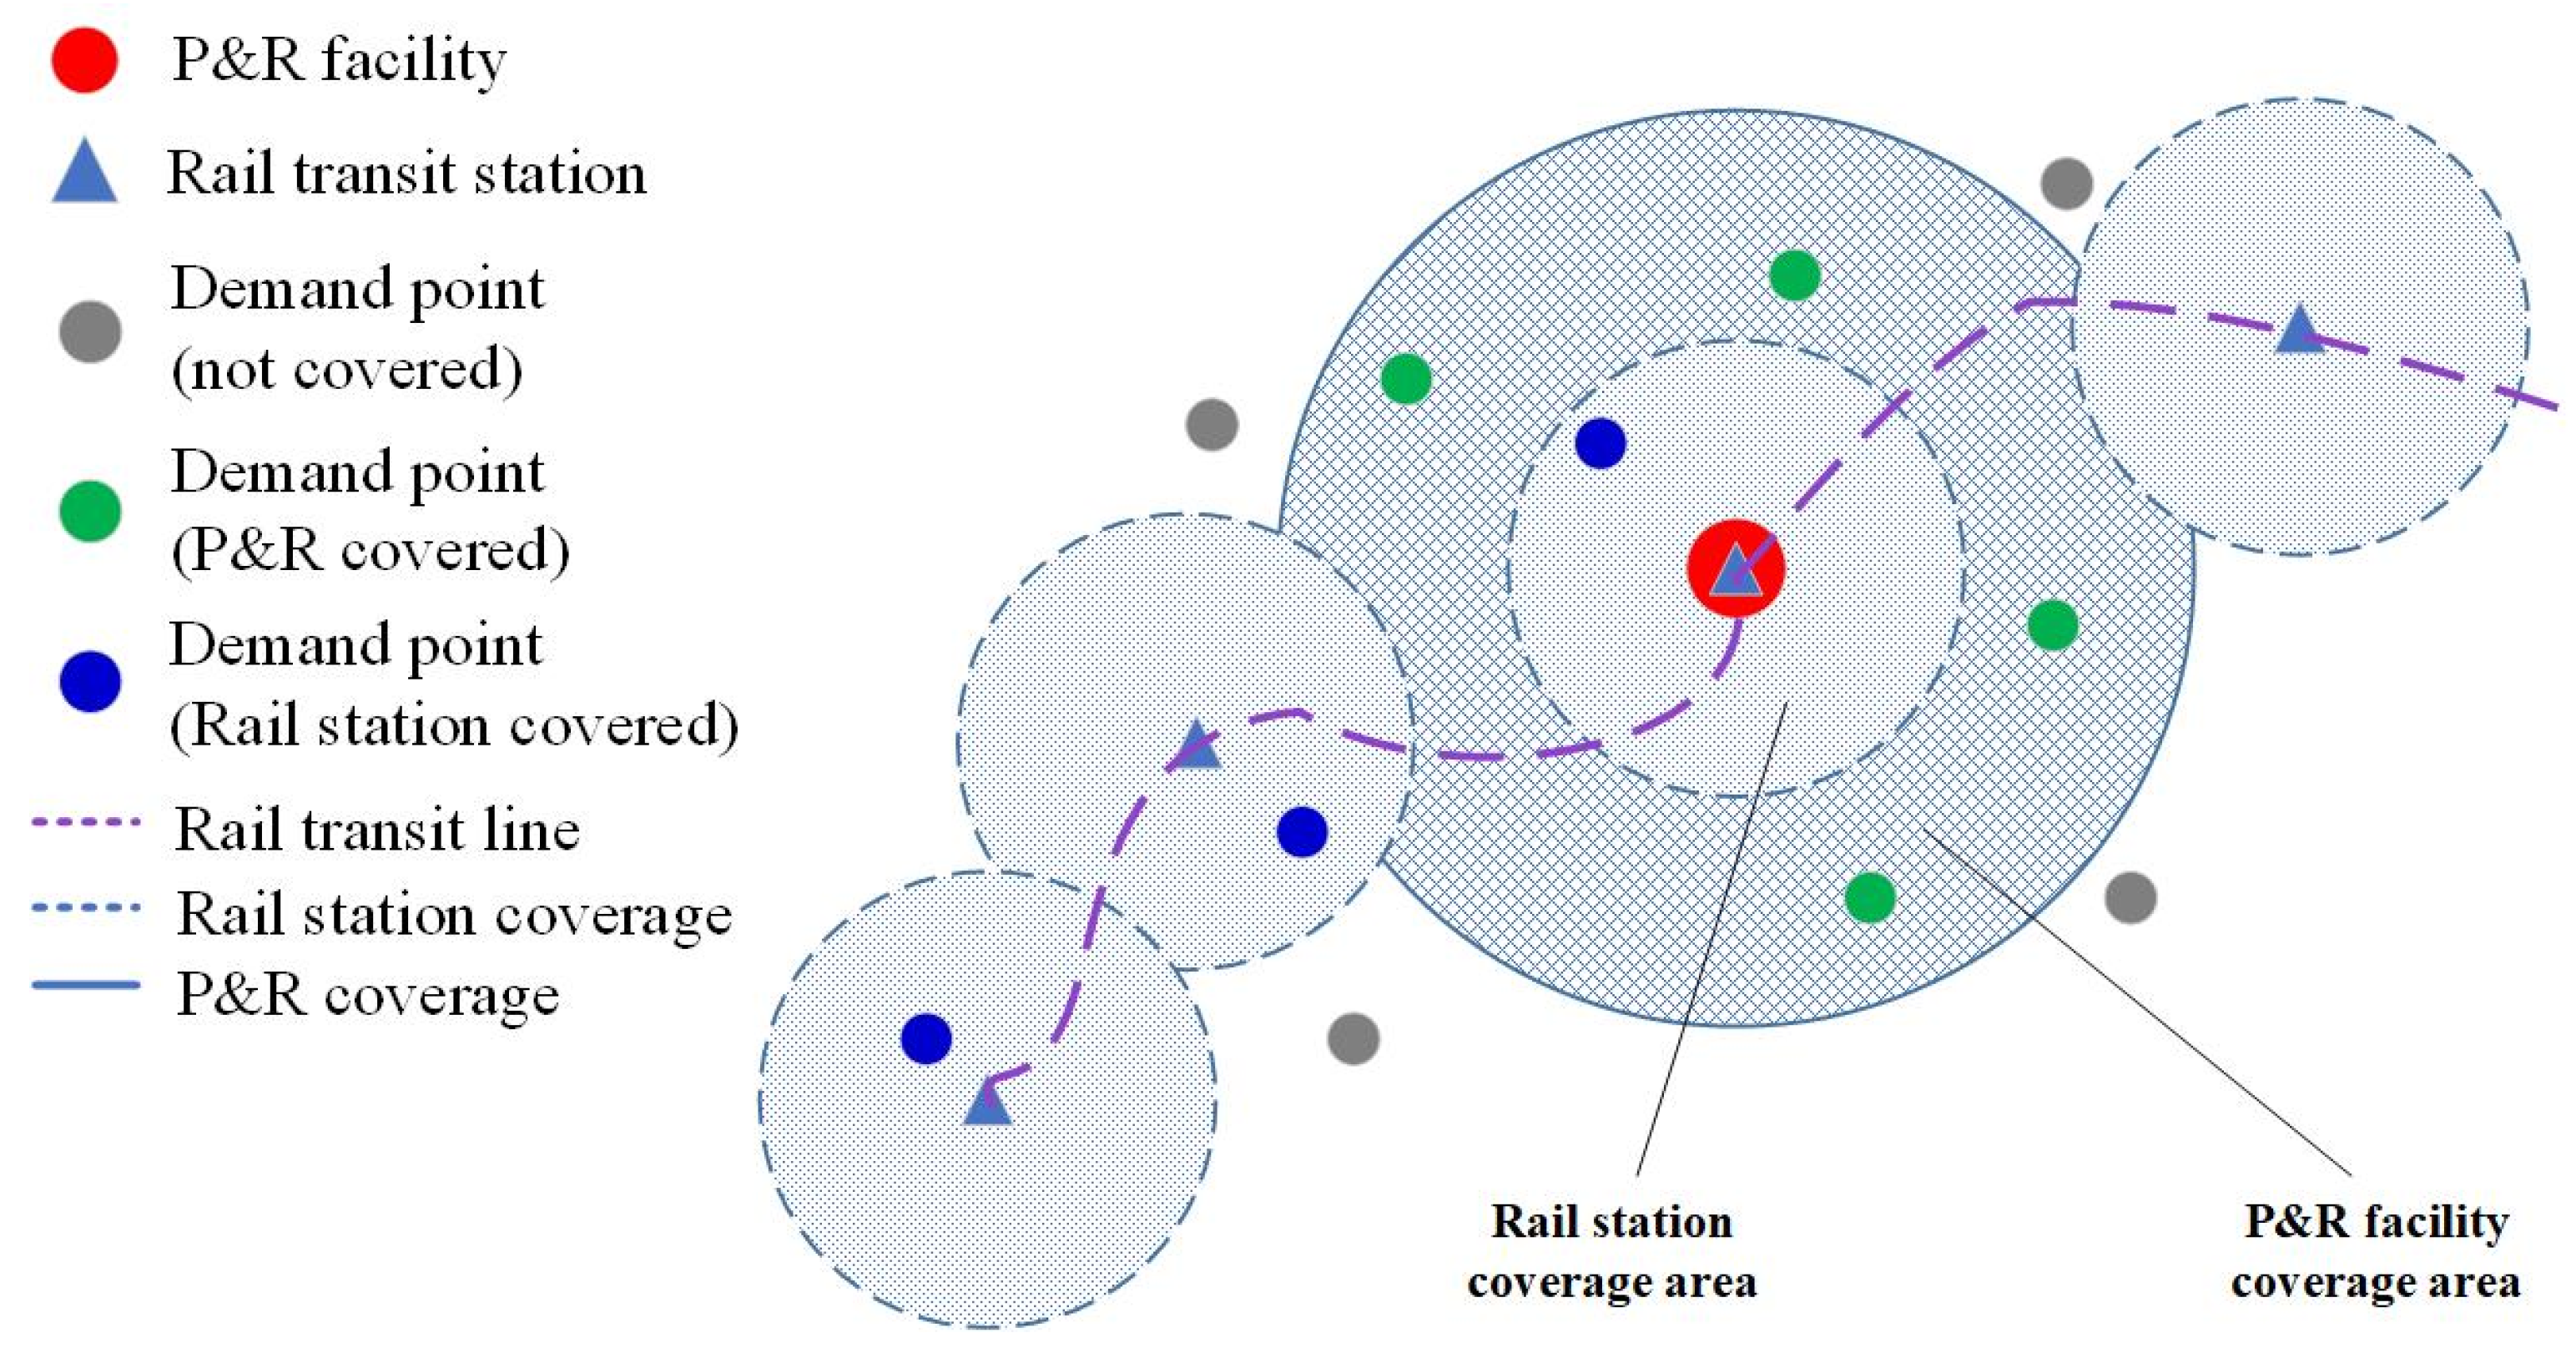
3.2. Location Model of Urban P&R Facilities Based on Progressive Cooperative Coverage

Figure 5 illustrates coverage characteristics of urban P&R facilities. In terms of the location of P&R facilities in the urban area, it is difficult to apply the travel choice behavior model to analyze P&R demand in the scenario where travel OD distribution is not easy to obtain. It can be seen from Figure 5 that there are four types of demand points in the P&R coverage area. Aiming at the green demand points in the Figure (type A and B demand points), this study improved the 0–1 coverage constraint into a progressive coverage function that varies with travel distance. The type B demand point is far away from the P&R facility, resulting in a lower level of coverage demand, such as demand point i1. The demand intensity of type A demand points is higher than that of type B demand points. One of the reasons is that the closer the demand point is to the P&R facility, the higher the possibility that travelers will choose the P&R method, such as demand point i2. In addition, when multiple P&R facilities cover a certain demand point at the same time, the possibility of choosing P&R travel for type A is greater than that for type B demand points, such as demand point i3.
According to the above analysis, the establishment of the urban P&R facility location model based on progressive cooperative coverage (model 2) is as follows (Equation (10)):
max F 2 = i I [ min { j J f ( d i j ) x j α i q i , q i } ]
Subject to (Equations (11)–(14)):
j J x j C
f ( d i j ) = { e β d i j         d i j D c 0                       d i j > D c         i I , j J
α i = { 0         k K , d i k D w 1                                   else i I
x j { 0 , 1 } j J
where f ( d i j ) is the coverage intensity of P&R facility j to demand point i with distance; qi is the travel demand of demand point i; β is the distance attenuation coefficient; and β is greater than 0. As the distance dij decreases, the greater the distance attenuation coefficient β, the faster the coverage demand attenuates.
Equation (10) maximizes the potential P&R demand under the constraint of the construction quantity of P&R facilities. When multiple P&R facilities cover demand point i and the coverage intensity of facility j to demand point i varying with distance is f(dij), then the parking and transfer supply capacity of facility j to demand point i is ∑f(dij)xjαiqi. If it is greater than the qi of demand point, it is considered that demand point i is completely covered and the potential demand covered is qi. Otherwise, it is considered that the demand point i is partially covered; that is, part of the potential P&R travel demand is transformed into the actual P&R travel demand, and the potential demand covered is ∑f(dij)xjαiqi. Equation (11) is a constraint on the number of P&R facilities. Equation (12) is a function of the demand intensity of P&R facilities in the coverage area, and the attenuation function of the coverage level of P&R facilities with distance is expressed in exponential form. Equation (13) determines whether the demand point i is covered by rail transit station k, that is, whether the potential P&R travel demand will directly choose to travel by rail transit. If there is a rail transit station k covering demand point i, it is 0; otherwise, it is 1. Equation (14) is 0–1 constraints on decision variables.

4. Model Solving

Since the P&R facility location plan is a nonlinear programming problem with 0–1 decision variables, in view of the fact that genetic algorithm is a common tool for solving nonlinear programming problems, a genetic algorithm was selected in this study to solve the P&R facility location plan. In terms of chromosome coding in genetic algorithms, chromosomes are composed of 0 and 1; that is, each gene is a binary variable. Each gene indicates whether the candidate P&R facility is selected: “1” means to build a new P&R facility at the candidate point, and “0” means not to build a new P&R facility at the candidate point. Therefore, the chromosome in the population with the P&R facility location scheme can be expressed as [ x 1 , x 2 , , x N ] , that is, the setting of number N P&R facility candidate points. The steps to solve the genetic algorithm are as follows:
  • Parameter initialization. The number of iterations, crossover probability, mutation probability, and population size are determined.
  • The potential P&R travel demand distribution is entered, simplifying the transportation network structure and related parameters.
  • An initial population is randomly generated. The chromosomes in the population contain the initial P&R facility location plan.
  • According to the coverage of rail transit stations and the coverage of P&R facilities, the demand point set Ik covered by the rail transit site, the P&R facility coverage demand set Ip, and the demand point i which can choose the P&R facility set Ji are determined.
  • In the P&R facility location model in the outer suburbs, the ratio of demand points to the selection of P&R facilities is calculated. In the urban P&R facility location model, the demand for incremental cooperation coverage is calculated where demand points are covered by P&R facilities.
  • The fitness of the chromosomes in the population is calculated. Since the models constructed in this study all aim at the maximum target value, the objective function value is set to 0 when the location plan does not meet the constraints, and the fitness of the chromosome is set to the objective function value.
  • The chromosomes in the population are selected, crossed, and mutated to generate a new population.
  • The elite retention strategy is adopted to replace a chromosome in the new population with the chromosome with the highest fitness in Step 7, thereby improving the search speed and accuracy of the algorithm.
  • The number of iterations is verified. If the maximum number of iterations is not reached, the process returns to Step 4; if the number of iterations is reached, the algorithm is terminated and the P&R facility location plan is output.

5. Model Verification

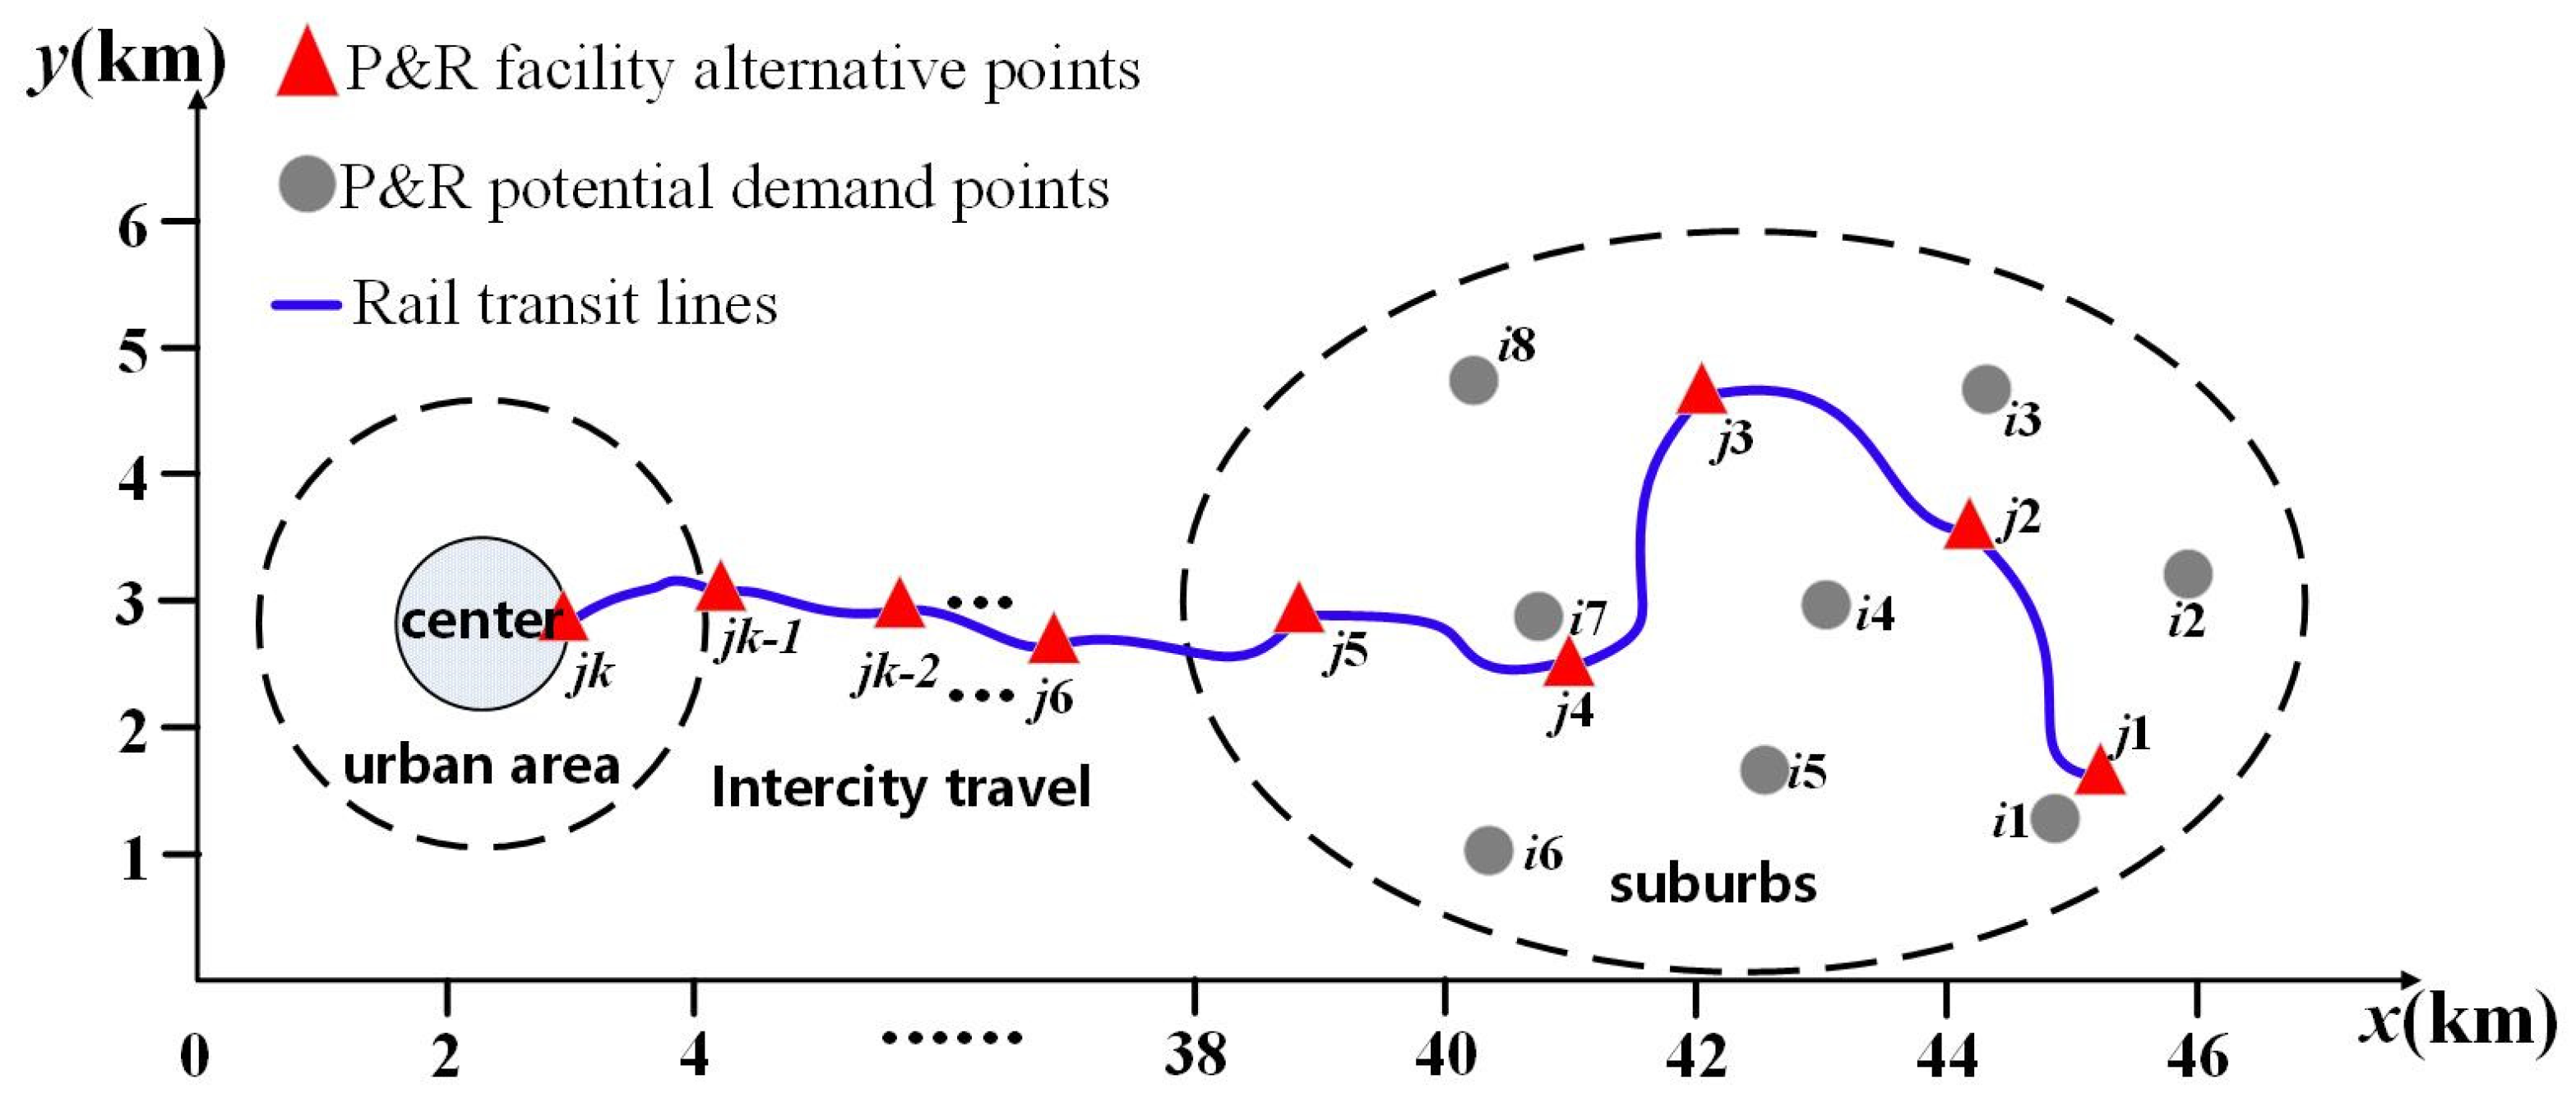
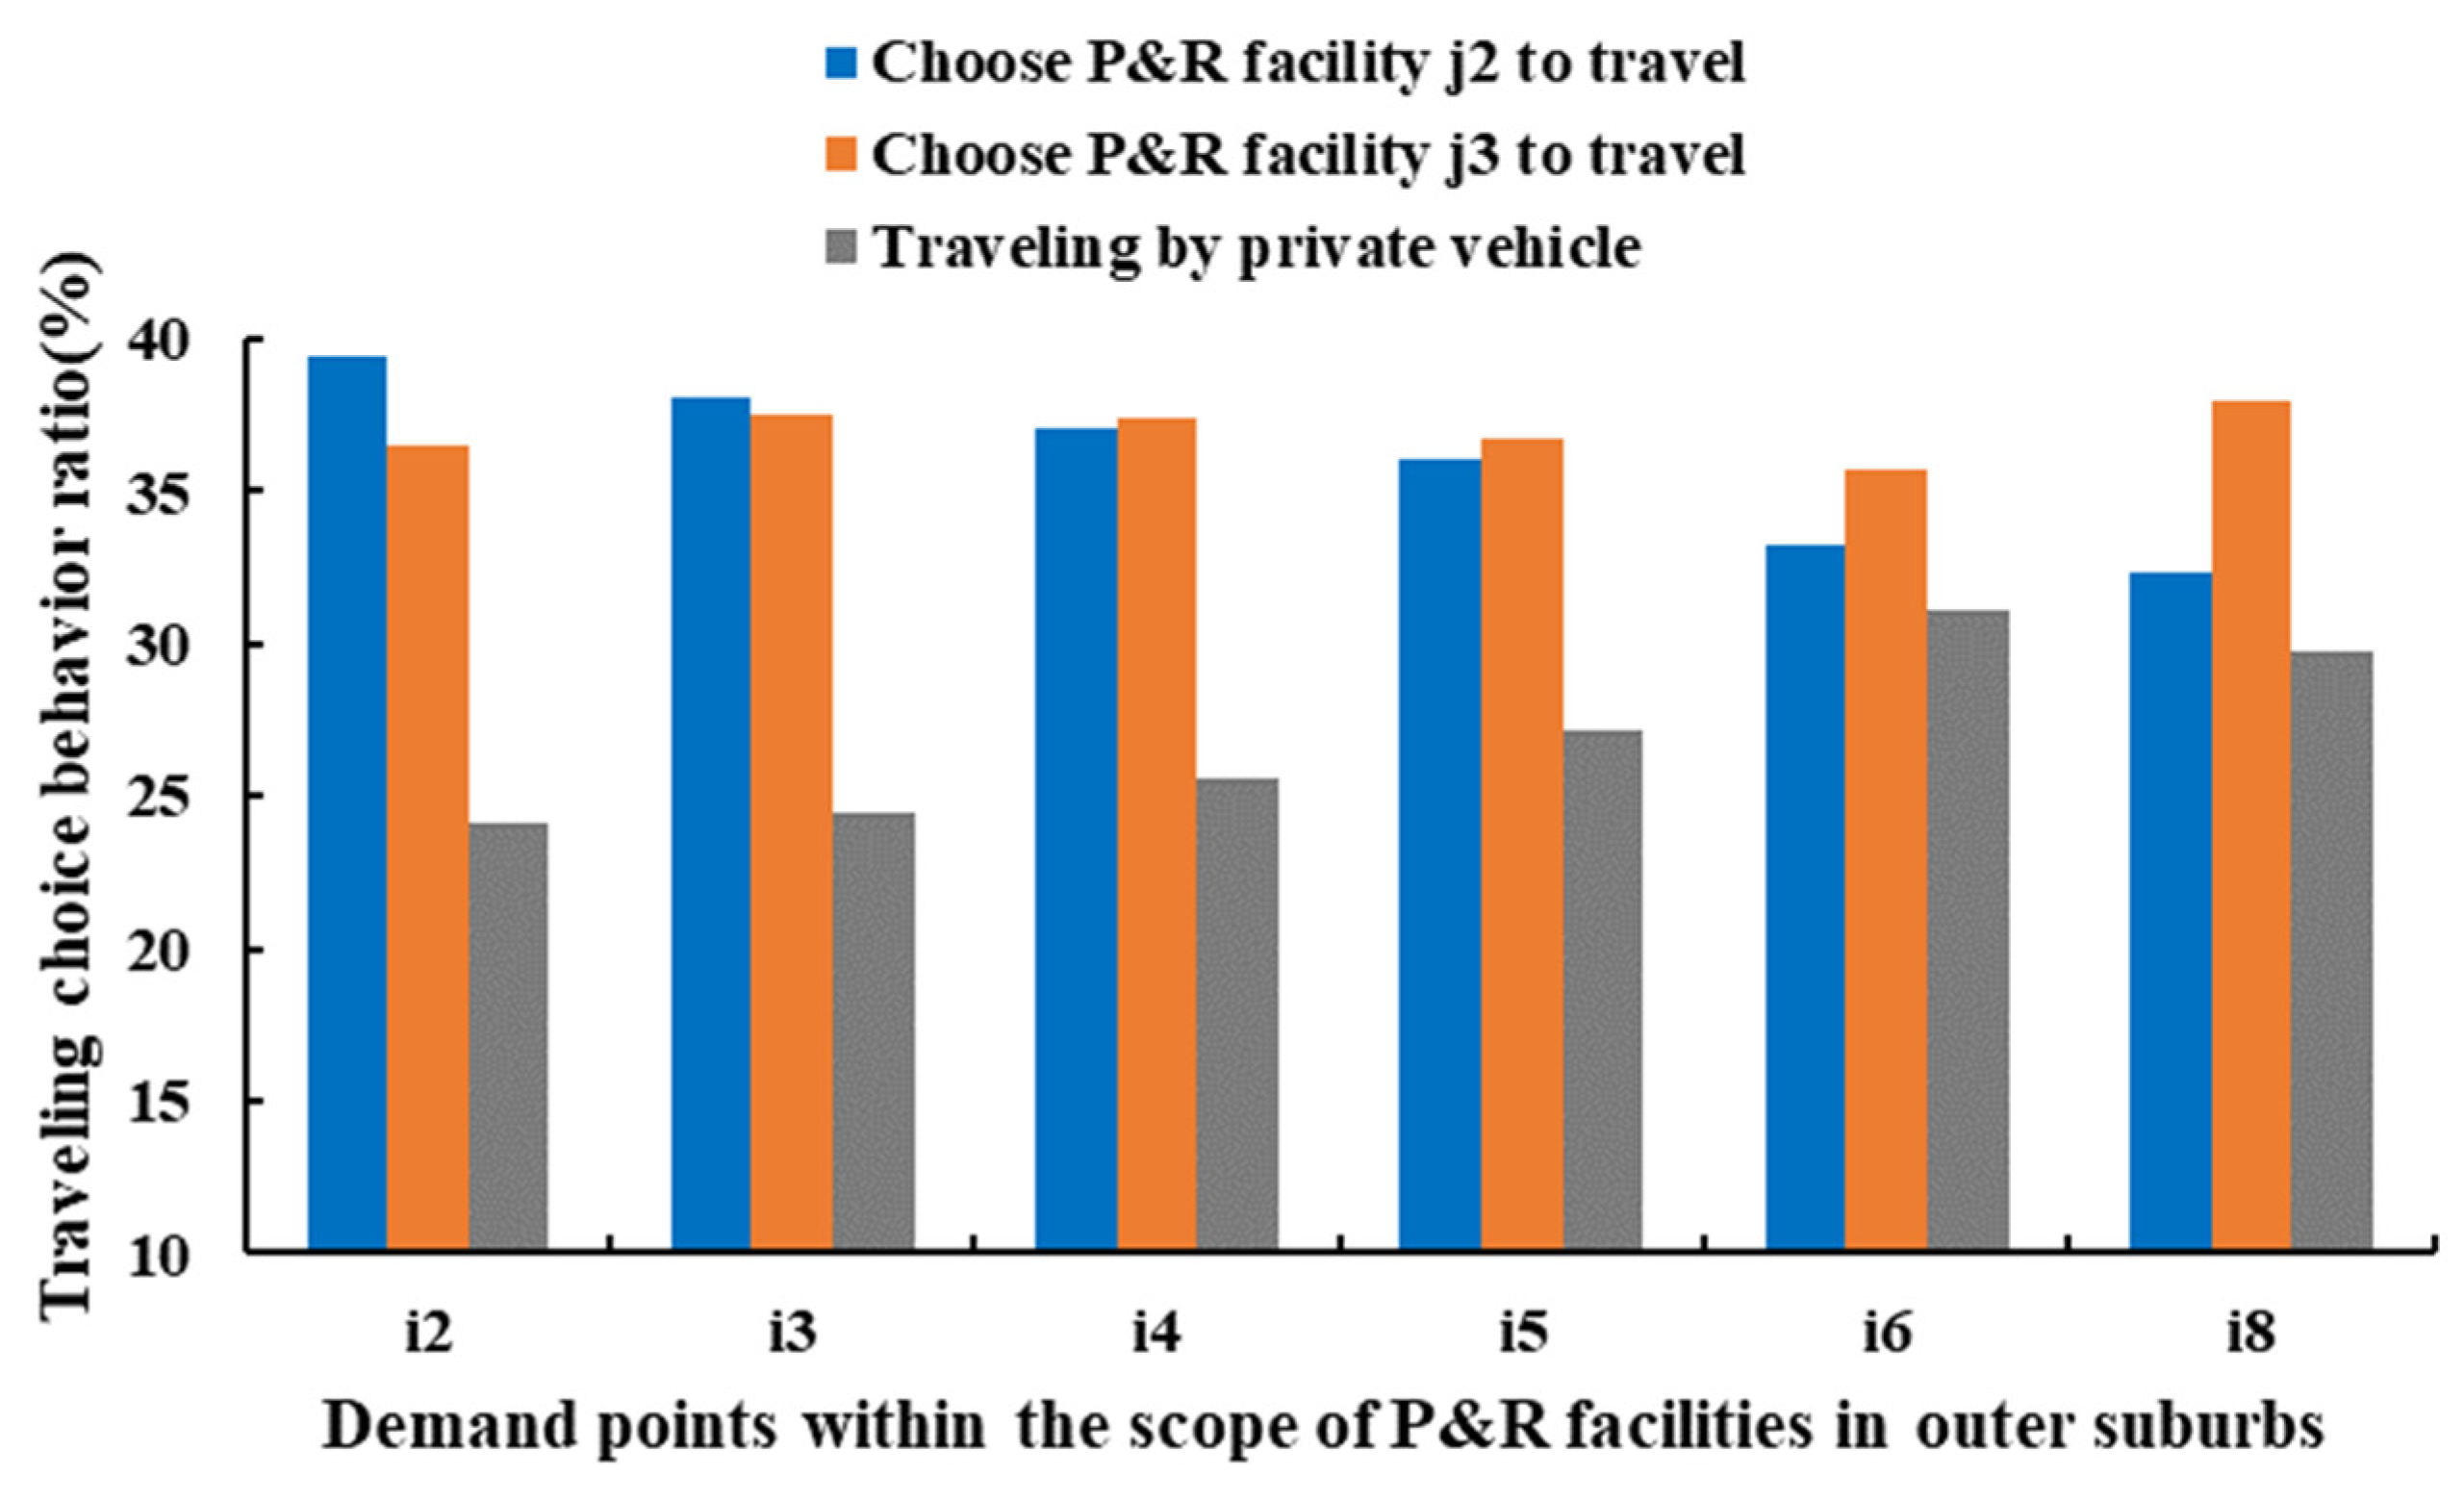
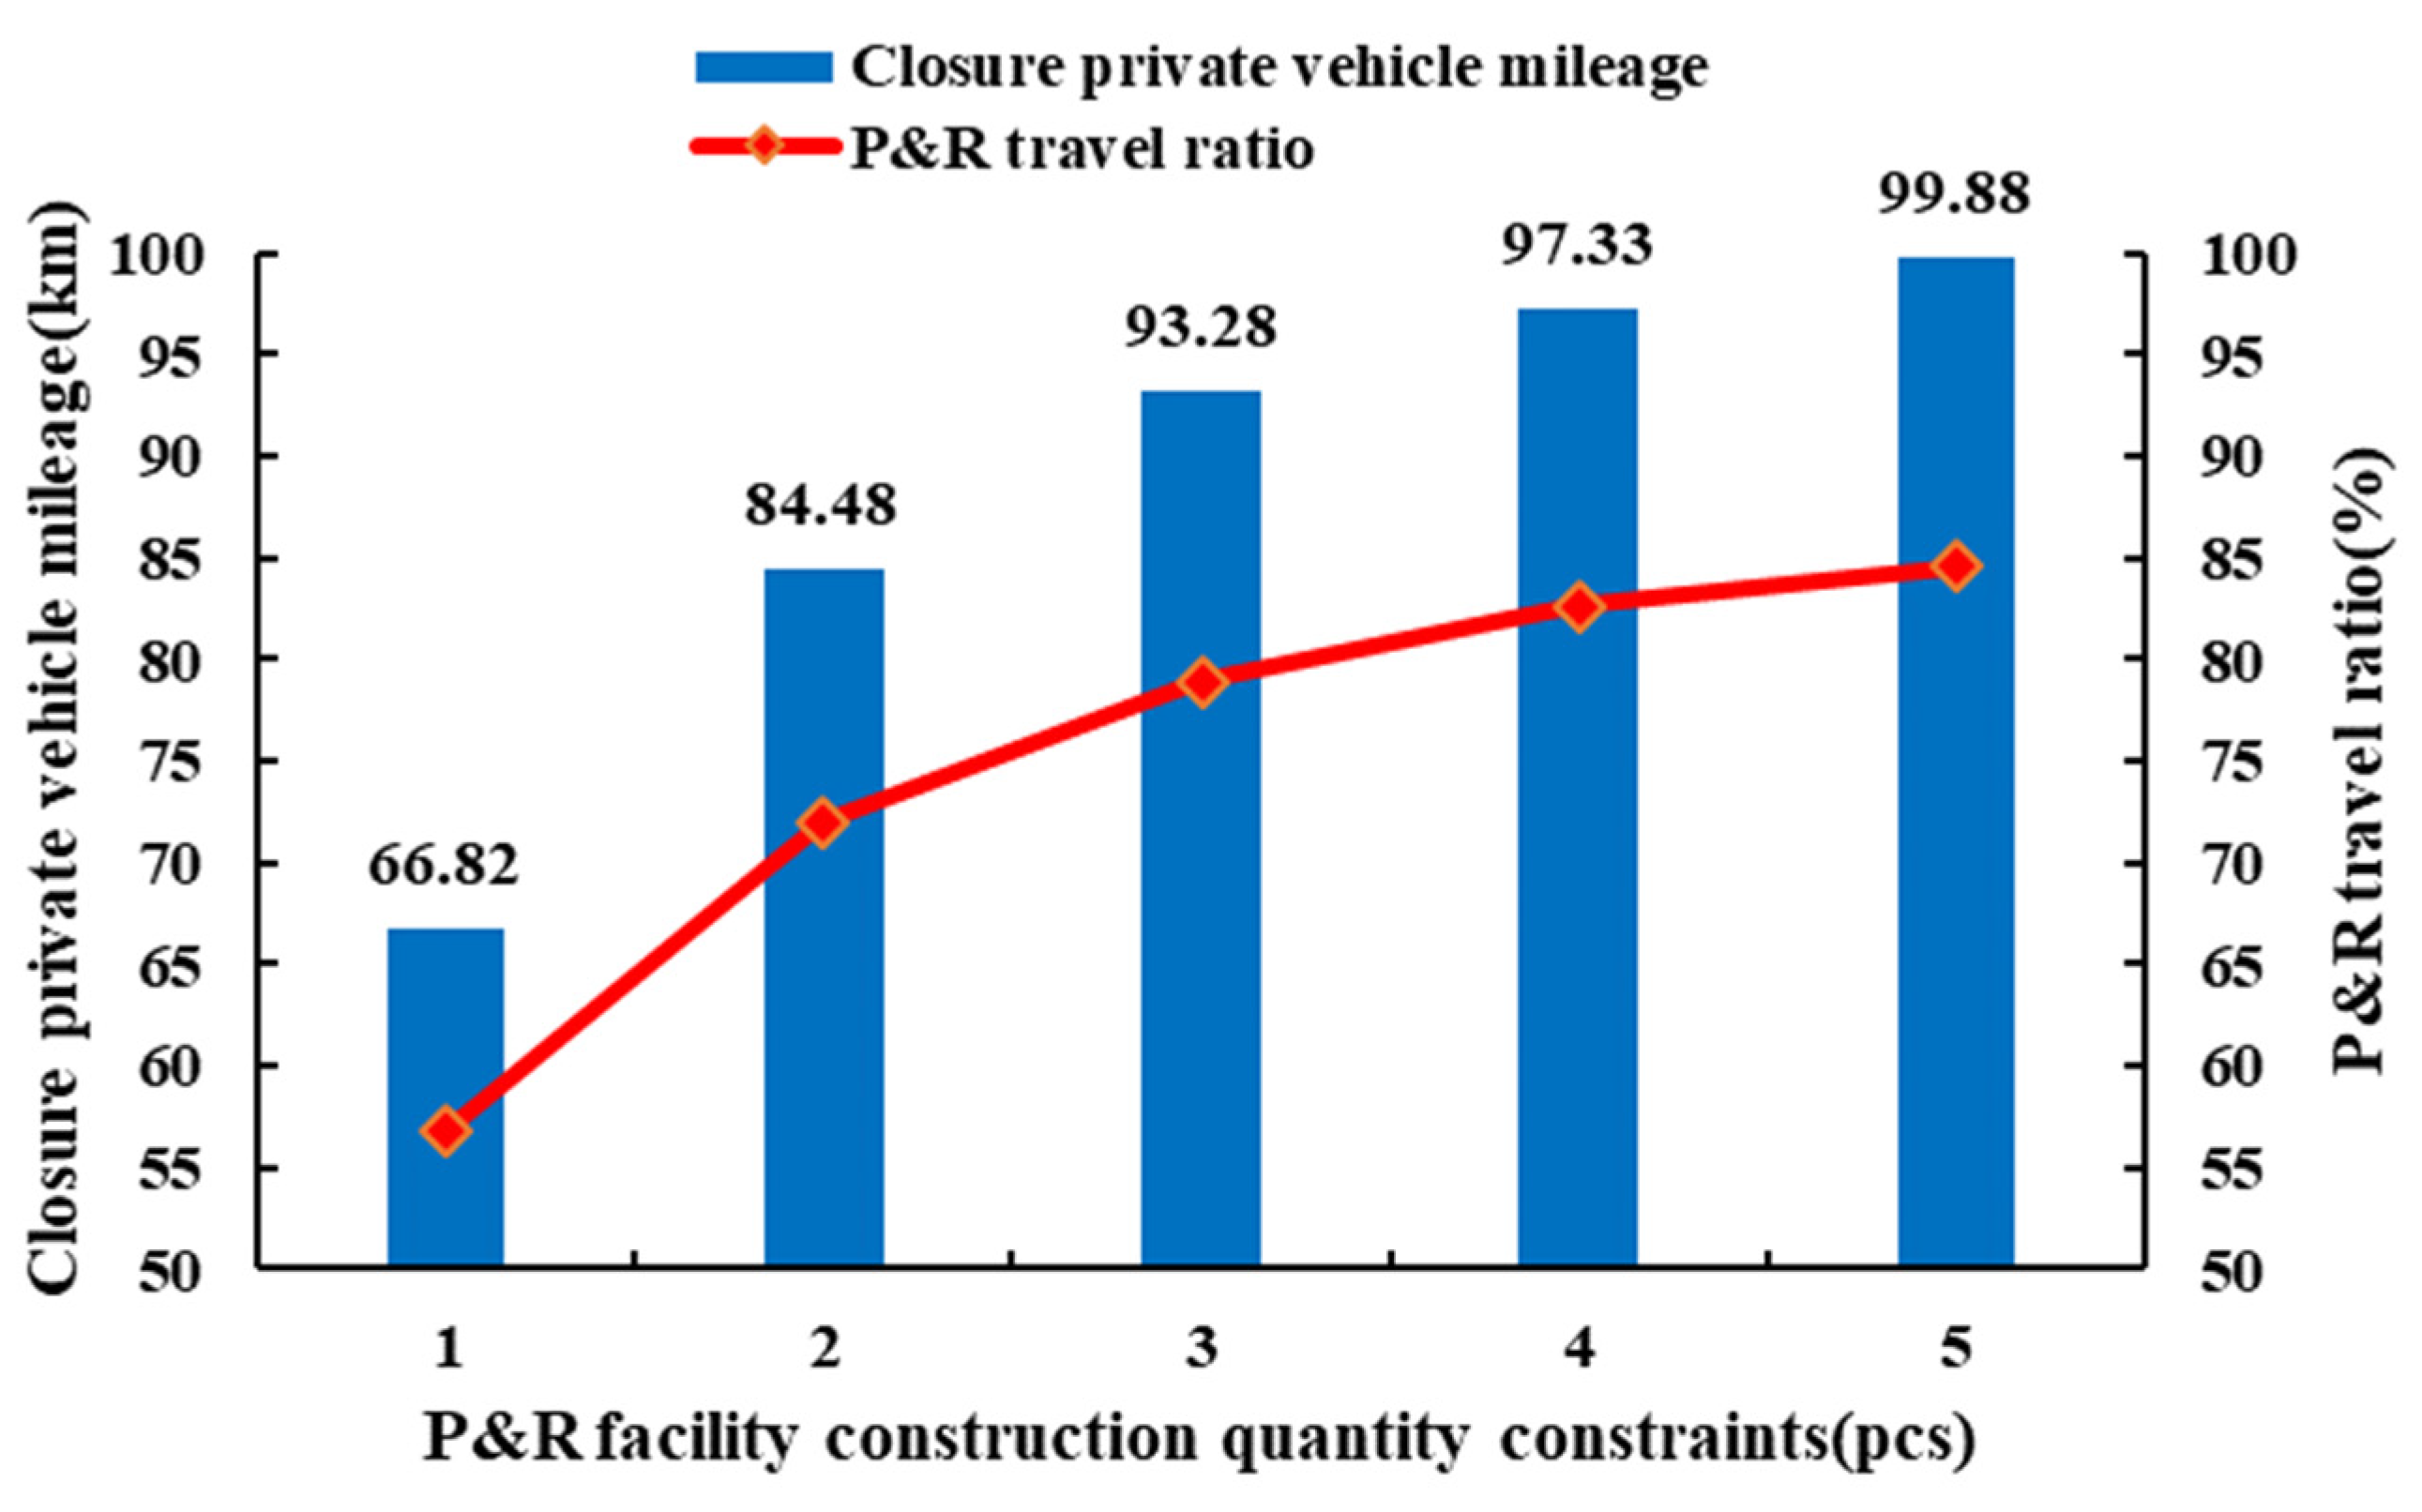
5.1. Location of P&R Facilities in Outer Suburbs

A two-dimensional coordinate system is used to represent the urban area and the suburban area. There is an intercity rail transit line between the urban area and the suburban area to connect the two areas. Travelers can drive a private vehicle to a rail transit station, park the private vehicle at the P&R facility in the outer suburbs, and then take the rail transit to the city center. Potential P&R travel demand points are randomly generated in the outer suburbs, and a simplified transportation network is constructed in the outskirts scenario, as shown in Figure 6.
There are eight demand points (i1 to i8) and five P&R facility alternative points (j1 to j5) distributed in the outer suburbs. The travel destination of the demand points is the initial city center. P&R facility options, potential P&R travel demand distribution, and demand are shown in Table 1. The Euclidean distance between the P&R facility alternative point and the demand point is taken as the travel distance by rail transit in the P&R travel mode. The rail transit frequency is set to five vehicles per hour; the average speed of rail transit trains and private vehicles are 150 and 60 km/h, respectively; the parking search time in P&R facilities is 3 min; and the travel choice behavior model parameter θ is 0.05. Taking into account the characteristics of outskirts travel, the acceptable distance Dw from walking to the rail transit station is 0.5 km, the acceptable distance radius for driving to P&R facilities is 5 km, and the upper limit of the number of P&R facilities in the outer suburbs is 2.
MATLAB R2016a was used to solve the P&R facility location plan in the suburban scenario. The maximum number of iterations in the genetic algorithm is 500, the crossover probability is 0.5, the mutation probability is 0.05, and the population size is 500. In order to prove the effectiveness of the model built in this study, on the basis of model 1, Equations (6) and (7) were removed, while αi and βij in Equation (8) took constant 1, other formulas remained unchanged, and a location model 3 was established without considering the coverage characteristics. Model 1 was compared with model 3. The optimization results of P&R facility location scheme and the results of conventional location scheme are shown in Table 2.
The influence of P&R facility coverage characteristics on the results: The calculation results of model 1 and model 3 both select j2, the location scheme of model 1 does not take j4 as the location scheme, the demand points i1 and i7 are not included in the coverage, and the driving mileage of the closure private vehicle is less than that of model 3. The main reason for this result is that model 3 regards the demand point within the 500 meter coverage radius of the rail transit station as the P&R facility coverage demand, while model 1 does not count it as the actual demand point, so this part of the demand is not included in the closure mileage. Although the domestic demand points i1 and i7 of the 500 m coverage radius of the rail transit station are the source demand points for private vehicles, it is more reasonable to walk to the rail transit station than to travel. At the same time, if the coverage characteristics are not taken into account, assuming that all the demand is covered, it will lead to an increase in the size of the planned parking lot (the number of private vehicles truncated by model 3 is 1420 more than that of model 2). Part of the demand (dikDw or dij > Dc) will not use private vehicles to travel to rail transit transfer points but rather walking or shared bicycles. Therefore, although the driving mileage of the closure private car of model 1 is less than that of model 3, it seems that the result of model 3 is better, but it may lead to excessive waste of space resources. Therefore, the P&R facility location scheme obtained by model 1 is more in line with the actual situation and more reasonable.
The impact of travel choice behavior on the results: In the case of j2 and j3, as the demand points i5, i6, and i8 are closer to the urban center and farther from P&R facilities, the proportion of private vehicles chosen by i5, i6, and i8 is higher than that of i2, i3, and i4. In line with the conclusion of the literature [29], a survey was conducted on the users of P&R facilities in the metropolis of Seattle, WA, USA. According to Figure 7, the probability of selecting j3 for demand points i5, i6, and i8 is greater than that of j2, mainly because the demand point near the urban center is closer to j3. Similarly, the probability of choosing j2 at demand points i2, i3, and i4 is greater than that of j3. In addition, there is no significant difference in the selection probability of the demand point for different P&R facilities. The main reason is that there are overlapping road sections in the process of long-distance intercity travel, which accounts for a large proportion of the total travel distance; that is, the radius of the area formed by the demand point is much smaller than that of the urban area, resulting in a small difference in travel time between the demand point i and the P&R facility j to the urban center z. As a result, the difference of selection probability is not statistically significant. In addition, the logit model assumes that the selection behaviors are independent and uncorrelated (independence of irrelevant alternatives, IIA), which leads to no significant difference in facility selection. The P&R behavior is analyzed in the literature [30,31,32,33]. The results show that although the logit is independent from irrelevant alternatives, it still has a certain applicability. When there are multiple rail transit lines leading to the urban center, the overlap of paths can be avoided, which is reflected in the layout of P&R facilities in Shanghai [34].
The influence of the quantity constraint of P&R facility construction on the result: The sensitivity analysis of model 1 and model 3 was carried out with different P&R facility construction quantity constraints, as shown in Figure 8. With the increase in the upper limit of the number of constructions, P&R facilities, closure private vehicle mileage, and P&R travel ratio gradually increase. In addition, with the further increase in the number of P&R facilities constructed, the growth ratio of closuring the mileage of private vehicles and the P&R travel ratio gradually decreases; that is, the construction of excessive P&R facilities will not achieve better profit effects.

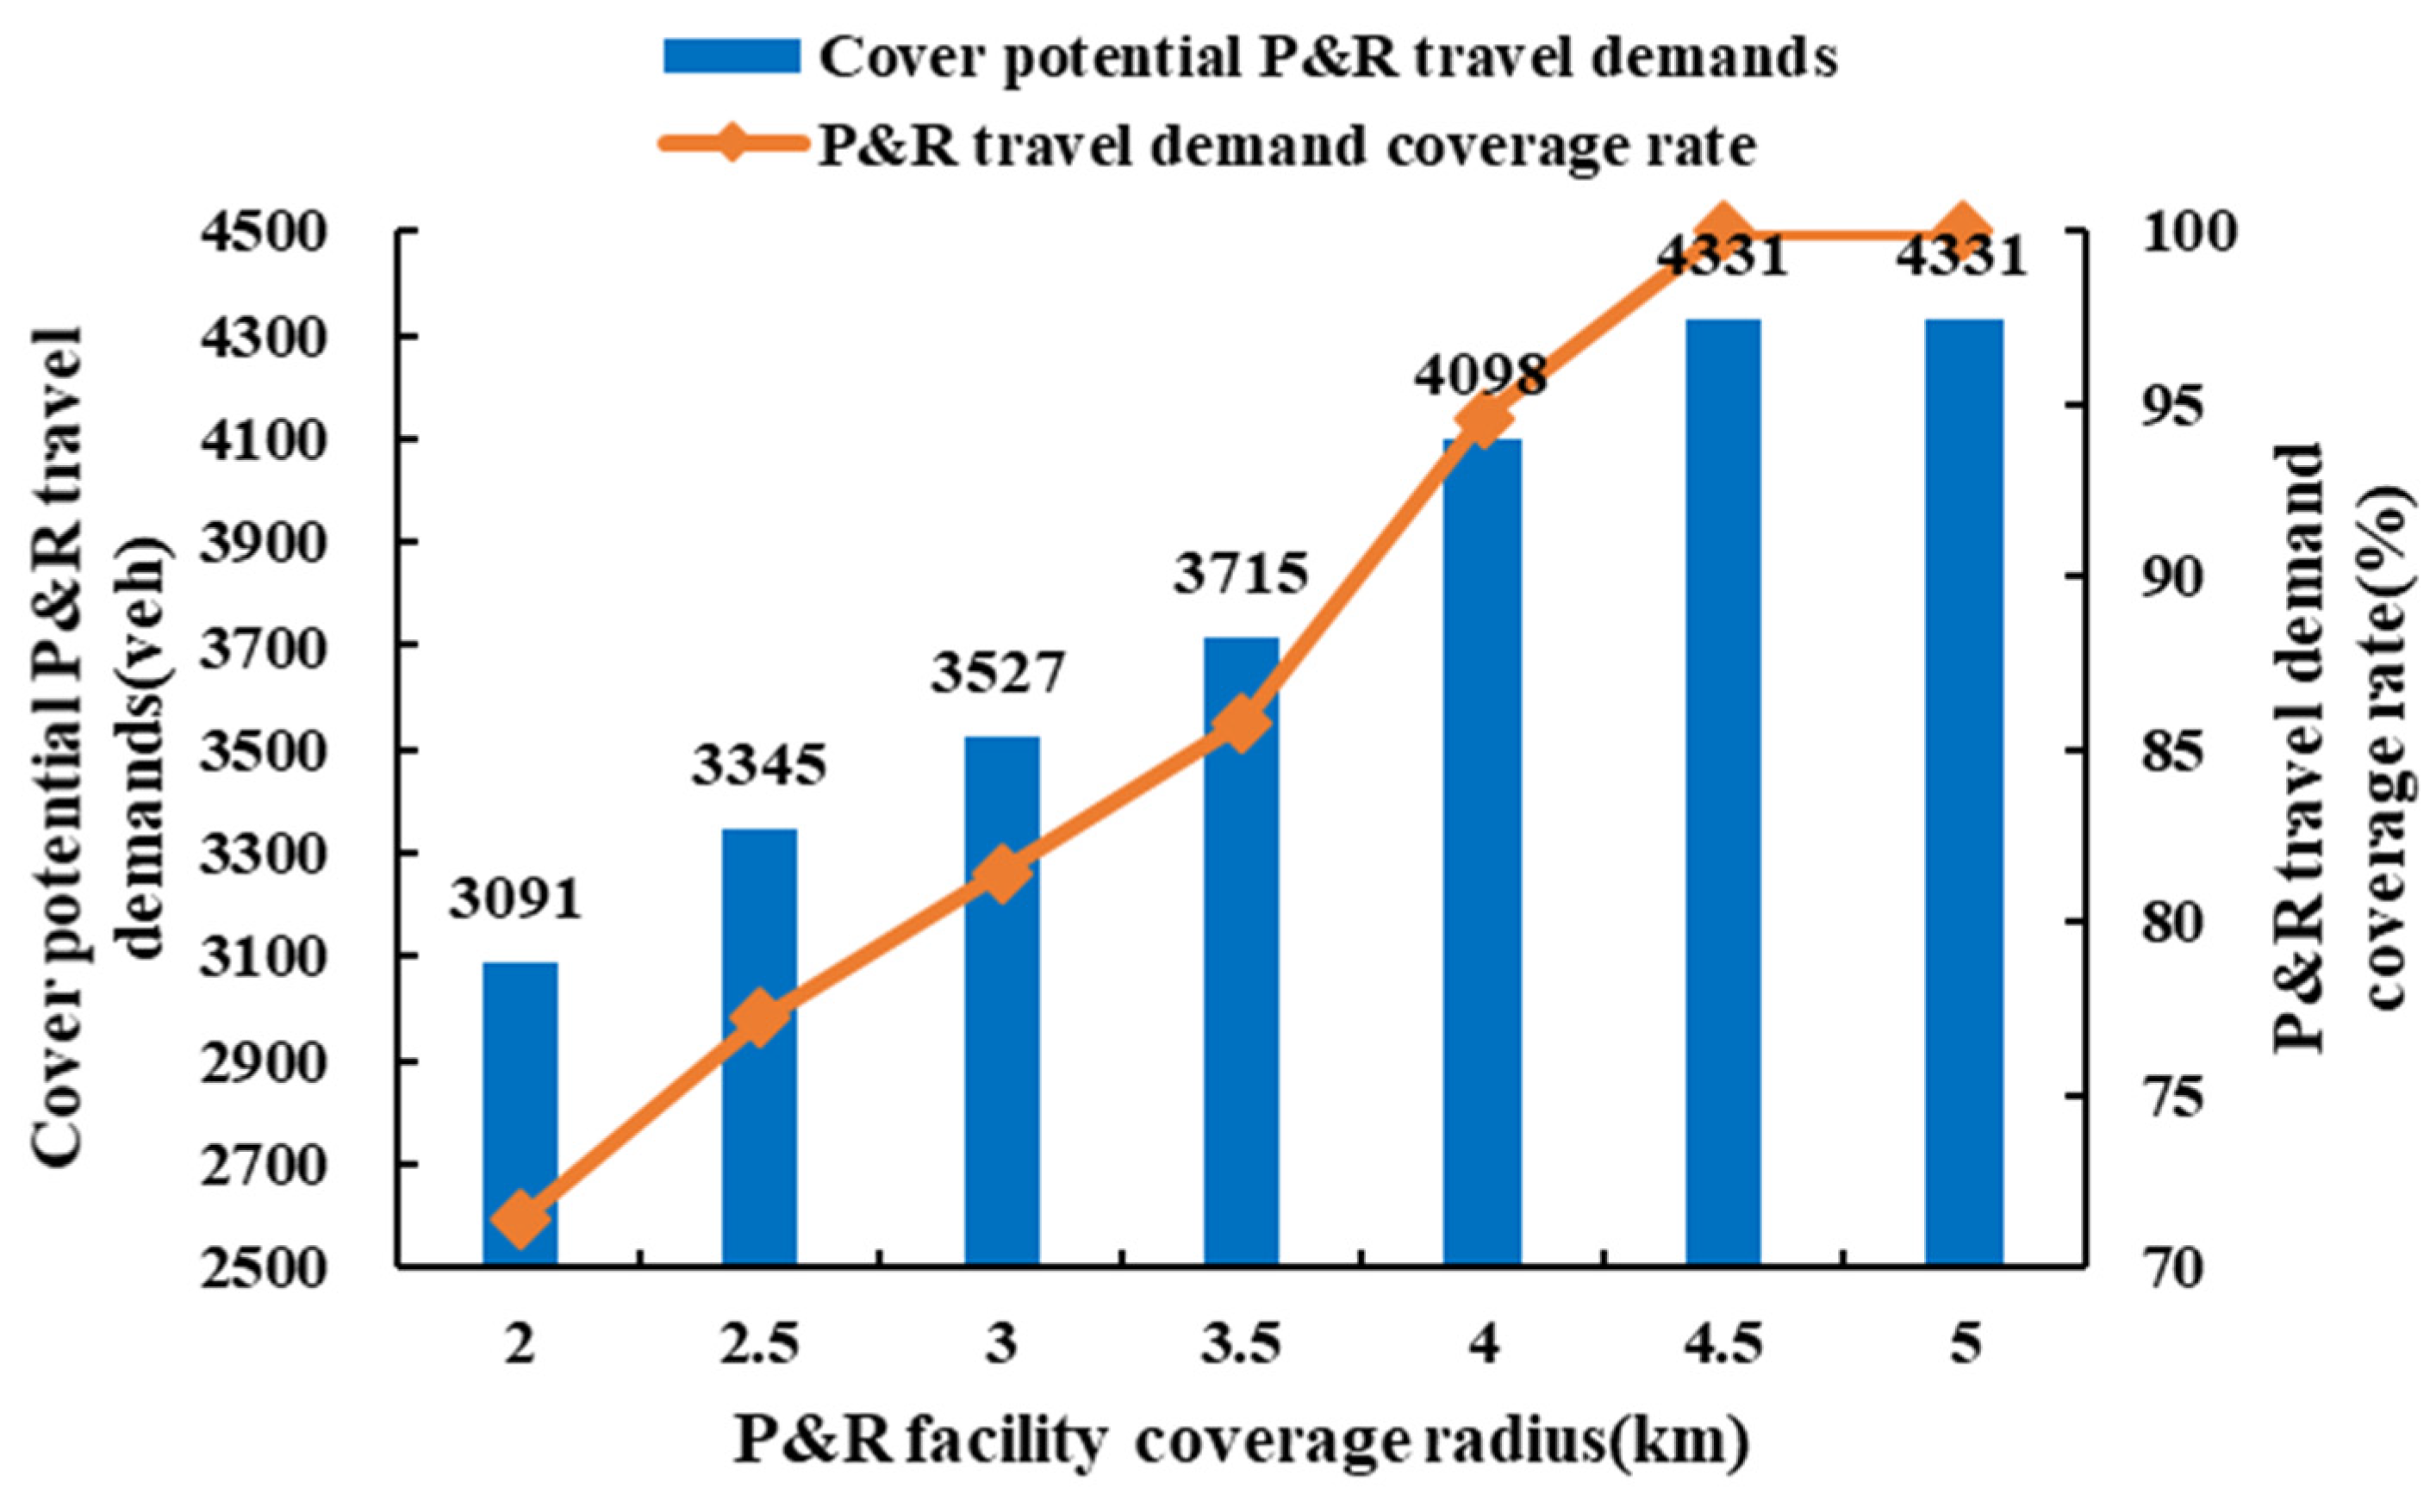
5.2. Location of Urban P&R Facilities

Potential P&R travel demand points were randomly generated within the urban area, and a simplified transportation network was constructed in the urban scenario, as shown in Figure 9.
Each station in the rail network serves as an initial candidate point for P&R facilities (j1 to j12). The number of P&R facilities is restricted to 4, and 15 demand points (i1 to i15) are distributed in the area. P&R facility options, potential P&R travel demand distribution, and demand are shown in Table 3. Euclidean distance is used as the travel distance between two points. Due to the short travel distance in the urban area, the acceptable distance to walk to the rail transit station is set to 0.5 km, and the acceptable distance radius Dc for driving to the P&R facility is 3 km. The parameter β of the asymptotic cover function model is 0.2. MATLAB R2016a was used to solve the P&R facility location plan under the urban scenario. The maximum number of iterations in the genetic algorithm is 500, the crossover probability is 0.5, the mutation probability is 0.05, and the population size is 500.
In order to prove the effectiveness of the model built in this study, on the basis of model 2, the constraint condition (12) was changed to f ( d i j ) = { 1 d i j D c 0 d i j > D c i I , j J , and a complete coverage location model 4 considering coverage characteristics was established. At the same time, on the basis of model 2, constraint conditions (12) and (13) were changed to f ( d i j ) = { e β d i j 0 i I , j J and αi = 1, respectively, and a progressive coverage location model 5 was established without considering the coverage characteristics. Model 2 was compared with model 4 and model 5. The optimization results of the P&R facility location scheme and the results of the conventional location scheme are shown in Table 4.
The influence of P&R facility coverage characteristics on the results: Due to the consideration of the progressive coverage principle, under the constraint of the number of facilities, both model 2 and model 5 can obtain the optimal solution, while model 4 has multiple solutions (other solutions in Table 4). The main reason is that when the Dc is 3 km, because the progressive coverage principle is not taken into account, different P&R facility location schemes can cover all the demand of the urban area. Because the coverage characteristics are taken into account, model 2 is the same as the uncovered demand points and potential requirements of model 4 and are much smaller than model 5. Compared with the three models, the actual coverage requirement of model 2 is the smallest. The main reason is that the domestic demand point in the 500 m coverage radius of the rail transit station is regarded as the coverage demand of P&R facilities. Although the domestic demand points i1, i2, i3, i7, and i14 are the source demand points of private vehicles in the 500 m coverage radius of rail transit stations, it is more reasonable to choose to walk to rail transit stations to transfer to rail transit. In addition, with the increase in the distance between the demand point and P&R facilities, the demand for the conversion of potential P&R travel demand into actual P&R travel demand will gradually decrease. If model 4 and model 5 are adopted, the calculated demand will be 804 and 2825 more than that of model 2 because the principle of gradual progress and the principle of demand range characteristics are not taken into account. These requirements may involve travel to the rail transit station by walking or bicycle. Using these requirements for the construction of P&R facilities will greatly improve the construction scale and capital investment, which may lead to waste. Therefore, the P&R facility location scheme of model 2 is more in line with the actual situation.
The influence of P&R facility coverage radius on the results: In order to analyze the influence of the coverage radius of P&R facilities on the location results, the sensitivity analysis of the built model was carried out in combination with the coverage radius of different P&R facilities, as shown in Figure 10. As the coverage radius of P&R facilities increases, the potential P&R travel demand and P&R travel demand coverage gradually increase, and P&R facilities have more opportunities to cover the travel demand within the urban area. At the same time, when the P&R facility coverage radius is greater than 4.5 km, it is able to cover all the travel needs within the urban area; that is, when the coverage radius of P&R facilities is large, planning a small number of P&R facilities can meet the demand of points. Therefore, in practical applications, the coverage radius of P&R facilities should be determined based on the actual travel situation in the urban area.
The influence of the quantity constraint of P&R facility construction on the result: In order to analyze the influence of P&R facility construction quantity constraints on the location results, sensitivity analysis was carried out in combination with different P&R facility construction quantity constraints. MATLAB R2016a was used to obtain the coverage potential P&R travel demand and P&R travel demand coverage rate under the constraints of different P&R facility construction quantities, as shown in Figure 11.
With the increase in the upper limit of the number of constructions, the potential P&R travel demand covered by P&R facilities and the coverage rate of P&R travel demand gradually increase. At the same time, when the number of P&R facilities is more than eight, the travel demand within the urban area is fully covered, indicating that excessive P&R facilities do not lead to further benefits. In addition, the construction capacity of P&R facilities should also be considered; when the potential P&R travel demand is greater than the number of parking spaces provided by the P&R facility, it is not possible to achieve full coverage of the travel demand within the urban area.

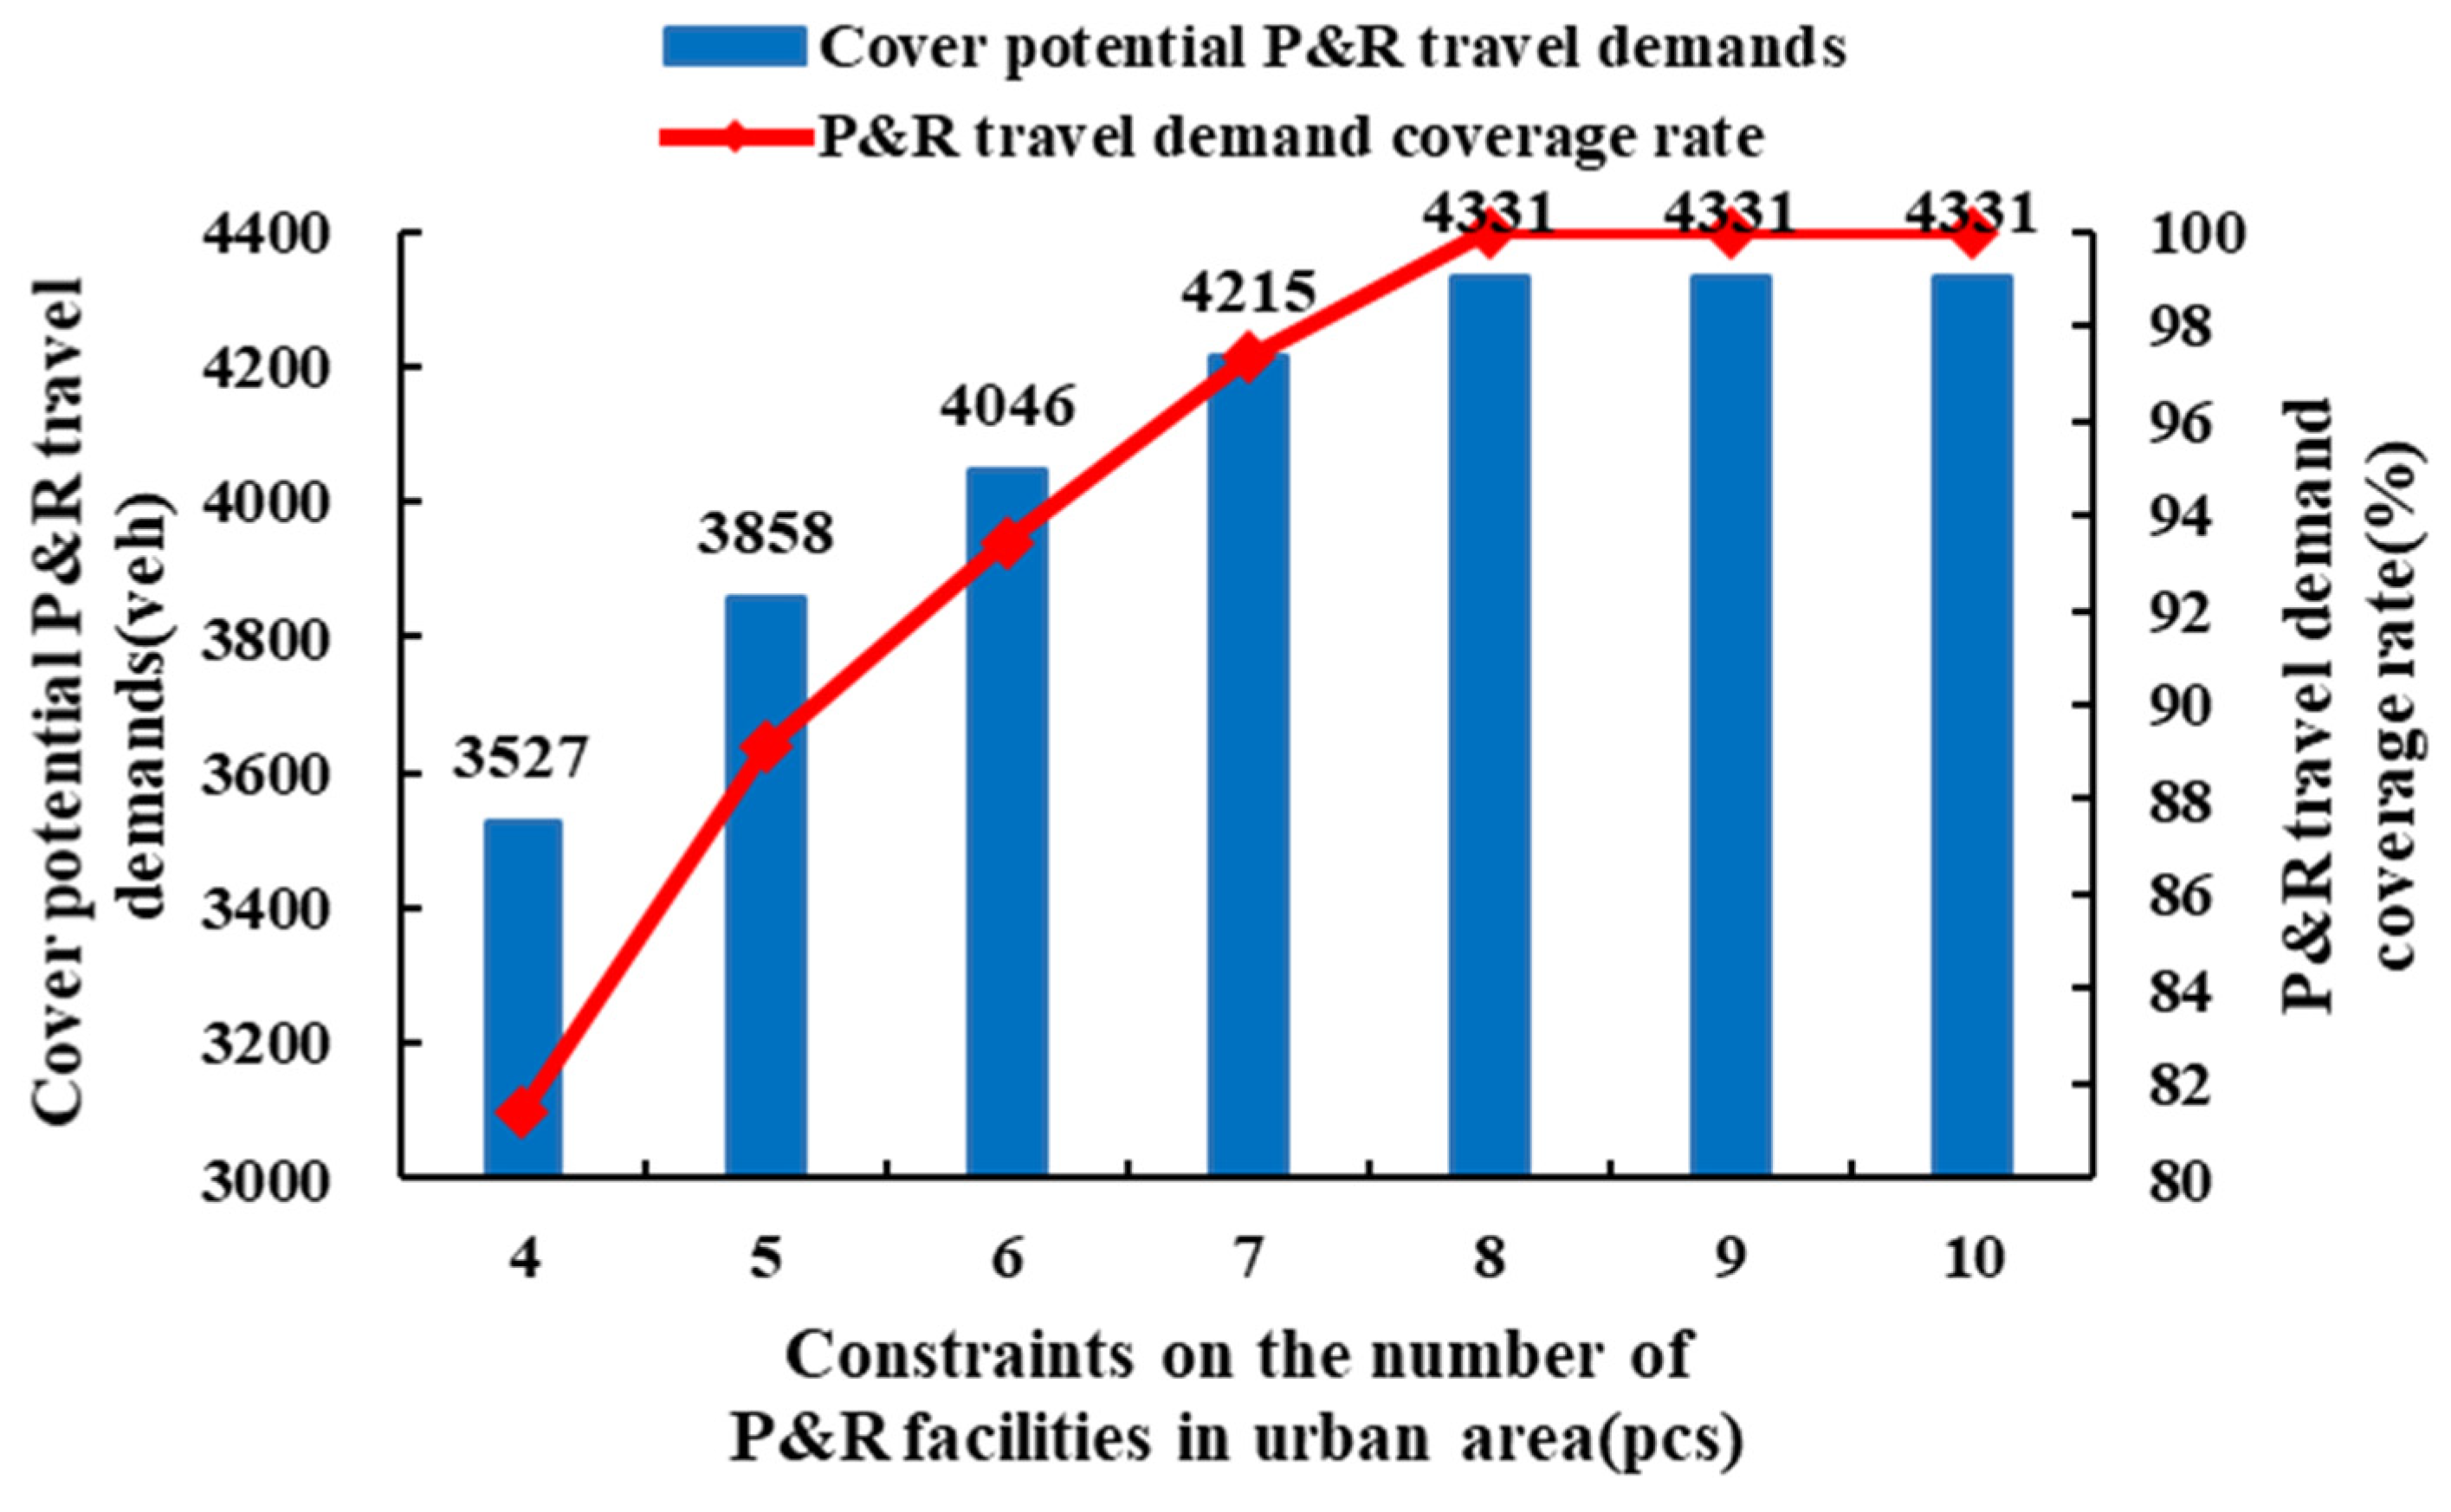
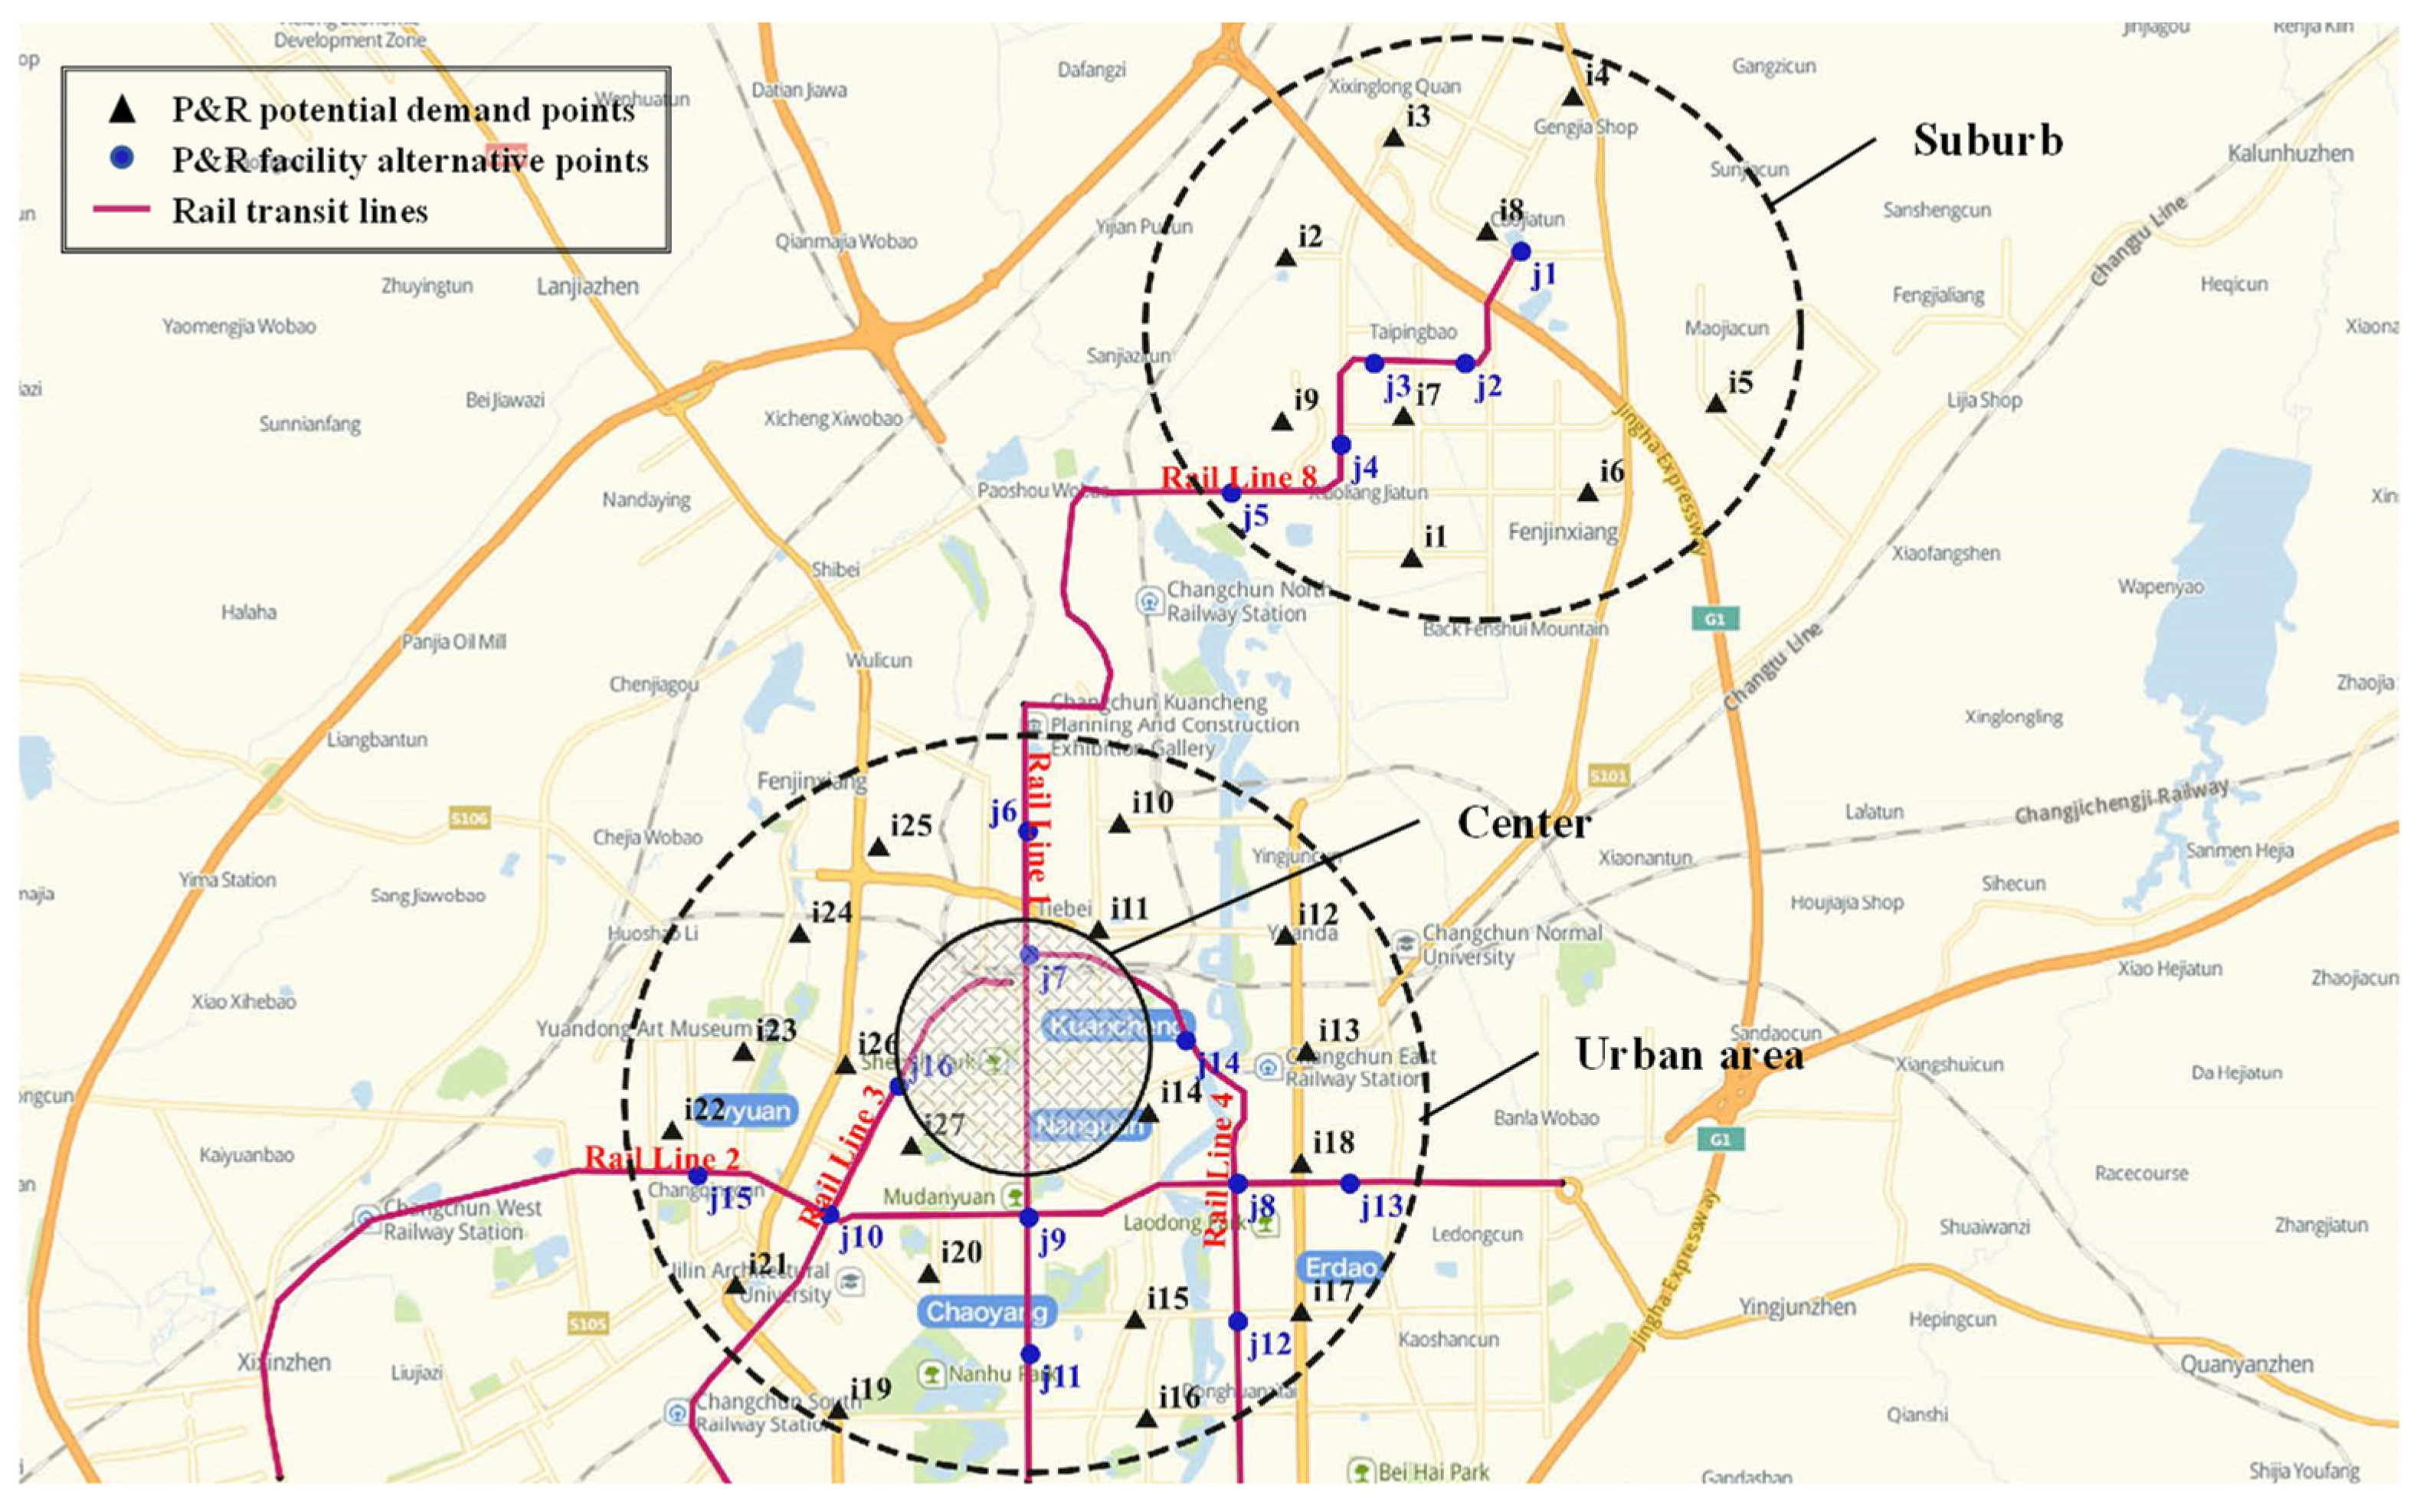
6. Empirical Analysis

In order to test the effectiveness of the model in practical application, this study used Changchun City, Jilin Province, as an example for empirical analysis. Rail transit line 8 was used as an example to select P&R facilities in the suburbs and rail transit lines 1, 2, 3, and 4 as examples to select P&R facilities in urban areas, as shown in Figure 12.
One hour of the morning peak on a certain day was selected as the data, and in the location of P&R facilities in the suburbs, there are nine demand points (i1 to i9) and five alternative points of P&R facilities (j1 to j5). The travel destination of the demand point is the initial destination of the urban center. In the location of P&R facilities in the urban area, there are 11 alternative points (j6 to j16), and 18 demand points (i10 to i27) are distributed in the region. The optional locations of P&R facilities, the distribution of potential P&R travel demand, and the demand are shown in Table 5 and Table 6.
In the location of the suburban P&R facility, the departure frequency of suburban rail transit line 8 is six vehicles per hour; the average speed of rail transit trains and private vehicles is 40 and 60 km/h, respectively; the parking search time in the facility is set to 3 min; the travel choice behavior model parameter θ is 0.05; and the acceptable distance radius of driving to the P&R facility is set to 5 km. In the location of urban P&R facilities, the acceptable distance from walking to the rail transit station is 0.5 km, the acceptable distance radius Dc is 3 km, and the parameter β of progressive coverage function model is set to 0.2 km. The genetic algorithm was used to solve the problem. The maximum number of iterations is 500, the crossover probability is 0.5, the mutation probability is 0.05, and the population size is 500. The final location results are shown in Table 7.
The P&R facility in the suburbs is located at j2, while the P&R facility in the urban area is located at j7, j8, j11, and j16. As a result, most of the demand points can be covered, and i7, i8, i9, i11, i17 i18, i21, i22, and i27, which are not covered by P&R facilities, have walking access to the rail transit station, which is more in line with the actual situation.

7. Conclusions

Given the difficulty of obtaining data information of traffic network attributes and travel demand characteristics, this study considered the impact of the spatial layout of rail transit stations on the coverage demand range of P&R facilities and improved the principle of nearest selection and demand coverage in the existing research. Based on the analysis of P&R facility coverage demand range and coverage demand intensity characteristics, this paper proposes a method for selecting the location of P&R facilities in the outer suburbs and in the urban area considering the coverage demand characteristics, with the goal of maximizing the mileage of truncated private vehicles and maximizing the demand for P&R facility coverage. A P&R facility location model based on the travel choice behavior model and the progressive cooperation coverage model was constructed. The genetic algorithm was used to solve the location model, and combined with the simplified transportation network, the model built in this study was compared with the existing P&R facility location model. The results show that when the demand coverage characteristics are not taken into account, the outer suburb P&R closured private vehicle mileage and urban P&R facility coverage demand is larger than that considering the demand coverage characteristics, so the parking scale of planning and construction is larger than the actual P&R demand, resulting in a waste of resources (in the example of this study, the number of private vehicles closured by the traditional model in the outer suburbs is 1420 higher than that of the optimization model, and the demand of the two traditional models in the urban area is 804 and 2825 higher than the optimization model, respectively, which will lead to a larger construction scale of P&R facilities and a waste of resources). In addition, whether in the outer suburbs or urban areas, the construction of excessive P&R facilities does not lead to further benefits; that is, the optimal number of P&R facilities can be obtained through the model. The location model established in this study can more accurately reflect the requirements of closured private vehicle mileage and P&R facility coverage, and the P&R facility location scheme obtained is more reasonable, which verifies the effectiveness of the model built in this study.
The method proposed in this paper addresses the difficulty of obtaining detailed data, has strong adaptability, and is a practical method for hierarchical location of P&R facilities in the outer suburbs and urban areas. However, due to the assumption that the data are not detailed, it is mostly used in the preliminary location stage of P&R facilities. Further research will be carried out in the future based on the nested logit and cross-nested logit model to develop a P&R NL–CNL combined travel behavior model suitable for suburban and urban areas and to develop a P&R location model considering multi-objectives, such as carbon emissions and construction costs.

Author Contributions

Conceptualization, methodology, writing—original draft preparation, formal analysis, H.L.; validation, H.L. and Y.L.; visualization, investigation, Y.L. and B.H.; software, H.L. and B.H.; writing—review and editing, Y.L. and J.L.; data curation, resources, J.L.; supervision, S.Z. All authors have read and agreed to the published version of the manuscript.

Funding

This research was funded by the National Natural Science Foundation of China, grant number 71871103.

Institutional Review Board Statement

Not applicable.

Informed Consent Statement

Not applicable.

Data Availability Statement

Not applicable.

Conflicts of Interest

The authors declare no conflict of interest.

References

  1. Li, M.; Guo, R.; Li, Y.; He, B.; Chen, Y.; Fan, Y. Distribution Characteristics of the Transportation Network in China at the County Level. IEEE Access 2019, 7, 49251–49261. [Google Scholar] [CrossRef]
  2. Li, T.; Chen, Y.; Wang, Z.; Liu, Z.; Ding, R.; Xue, S. Analysis of Jobs–Housing Relationship and Commuting Characteristics around Urban Rail Transit Stations. IEEE Access 2019, 7, 175083–175092. [Google Scholar] [CrossRef]
  3. Hamer, P. Analysing the effectiveness of park and ride as a generator of public transport mode shift. In Proceedings of the Australasian Transport Research Forum, Auckland, New Zealand, 29 September–1 October 2009. [Google Scholar]
  4. Rosli, N.S.; Adnan, S.S.; Ismail, F.D.; Hamsa, A.K. A Theoretical Review on Sustainable Transportation Strategies: The Role of Park and Ride Facility as a Generator of Public Transport Mode Shift. 2012. Available online: https://www.semanticscholar.org/paper/A-theoretical-review-on-sustainable-transportation-Rosli-Adnan/3d3d8b36a1183f8c6b8924750f346d4610e09a72#references (accessed on 8 November 2021).
  5. Chen, X.; Liu, Z.; Currie, G. Optimizing location and capacity of rail-based Park-and-Ride sites to increase public transport usage. Transp. Plan. Technol. 2016, 39, 507–526. [Google Scholar] [CrossRef]
  6. Meek, S.; Ison, S.; Enoch, M. Role of Bus—Based Park and Ride in the UK: A Temporal and Evaluative Review. Transp. Rev. 2008, 28, 781–803. [Google Scholar] [CrossRef] [Green Version]
  7. Wang, J.; Wang, H.; Zhang, X. A hybrid management scheme with parking pricing and parking permit for a many–to–one park and ride network. Transp. Res. Part C Emerg. Technol. 2020, 112, 153–179. [Google Scholar] [CrossRef]
  8. Kepaptsoglou, K.; Karlaftis, M.G.; Li, Z. Optimizing Pricing Policies in Park-and-Ride Facilities: A Model and Decision Support System with Application. J. Transp. Syst. Eng. Inf. Technol. 2010, 10, 53–65. [Google Scholar] [CrossRef]
  9. Zhang, R.; Wang, L.; Yan, Z. Park-and-Ride Demand Analysis and Parking Pricing: A case study of Shanghai in rail transit park–and–ride operation. Urban Transp. China 2009, 7, 13–18. [Google Scholar]
  10. Margail, F.; Auzannet, P. Evaluation of the Economic and Social Effectiveness of Park-and-Ride Facilities. In Proceedings of the Seminar F Held at the Ptrc European Transport Forum, London, UK, 2–6 September 1996. [Google Scholar]
  11. Wiseman, N.; Bonham, J.; Mackintosh, M.; Straschko, O.; Xu, H. Park and Ride: An Adelaide case study. Road Transp. Res. A J. Aust. N. Z. Res. Pract. 2012, 21, 39–52. [Google Scholar]
  12. Duncan, M.; Christensen, R.K. An analysis of park–and–ride provision at light rail stations across the US. Transp. Policy 2013, 25, 148–157. [Google Scholar] [CrossRef]
  13. Aros–Vera, F.; Marianov, V.; Mitchell, J.E. P–Hub approach for the optimal park-and-ride facility location problem. Eur. J. Oper. Res. 2013, 226, 277–285. [Google Scholar] [CrossRef]
  14. Cavadas, J.; Antunes, A.P. Optimization-based study of the location of park–and–ride facilities. Transp. Plan. Technol. 2019, 42, 201–226. [Google Scholar] [CrossRef]
  15. He, B. Study on Planning Methods of Park–and–Ride Facility. Ph.D. Thesis, Southeast University, Nanjing, China, 2006. [Google Scholar]
  16. Fang, D.; He, D.; Chen, X.; Yu, H.; Chen, K. Optimal Location of a Park-and-Ride System under Capture Rate and Capacity Constraints. J. Harbin Eng. Univ. 2017, 38, 207–214. [Google Scholar]
  17. Farhana, B.; Murray, A.T. Siting park-and-ride facilities using a multi–objective spatial optimization model. Comput. Oper. Res. 2008, 35, 445–456. [Google Scholar] [CrossRef]
  18. Lu, X.; Guo, R. A Bi–Objective Model for Siting Park-and-Ride Facilities with Spatial Equity Constraints. Promet–Traffic Transp. 2015, 27, 301–308. [Google Scholar] [CrossRef]
  19. Chen, J. The Research of Park and Ride Planning. Master’s Thesis, Chang’an University, Xi’an, China, 2011. [Google Scholar]
  20. Zhang, Q. Study on Park and Ride Facilities Location Method of Mountain—Group Cities. Master’s Thesis, Chongqing Jiaotong University, Chongqing, China, 2015. [Google Scholar]
  21. Lu, X.; Huang, H. Bi–Objective Programming Model for P&R Facility Location with Spatial Equity Constraints. Syst. Eng. Theory Pract. 2014, 34, 2379–2385. [Google Scholar]
  22. Horner, M.W.; Groves, S. Network flow–based strategies for identifying rail park–and–ride facility locations. Socio Econ. Plan. Sci. 2007, 41, 255–268. [Google Scholar] [CrossRef]
  23. Wang, X. The Research of Park and Ride Facilities in Urban Planning—A Case Study in Xi’an. Master’s Thesis, Chang’an University, Xi’an, China, 2009. [Google Scholar]
  24. Cheng, H. Method and Model of P&R Location Based on Urban Rail Transit Network. Master’s Thesis, Beijing Jiaotong University, Beijing, China, 2018. [Google Scholar]
  25. Gong, Y. Research on Site Selection of Park and Ride Facilities along with Subway—Based on the Case Study in Suzhou. Master’s Thesis, Southeast University, Nanjing, China, 2015. [Google Scholar]
  26. Yang, M.; Yang, Z.; Liu, Z. Urban Park-and-Ride Facility Location Model. J. Chang. Univ. Sci. Technol. 2015, 12, 11–16. [Google Scholar]
  27. Yang, Z. The Research on Urban Park-and-Ride Facility Location. Master’s Thesis, Changsha University of Science and Technology, Changsha, China, 2016. [Google Scholar]
  28. Yu, J. P&R Behavior Analysis and Modeling of Commuting Travel on Beijing Suburb. Master’s Thesis, Beijing Jiaotong University, Beijing, China, 2020. [Google Scholar]
  29. Spillar, R.J. Park-and-Ride Planning and Design Guidelines. Fringe Parking 1997, 26, 299–300. [Google Scholar]
  30. Yuan, Z. Analysis of Influencing Factors and Study of Charging Scheme of Park and Ride Based on cross Nested Logit Model. Master’s Thesis, Southeast University, Nanjing, China, 2020. [Google Scholar]
  31. Shi, F.; Zhu, Z.; Chen, J.; Qiu, S. Analysis on the Research Progress of Park and Ride in Urban Rail Transit Stations. Logist. Eng. Manag. 2021, 43, 88–92. [Google Scholar]
  32. Qian, Q.; Gan, H. Investigation of Park-and-Ride Choice Behavior under the Influence of Multi–model Traveler Information. Logist. Eng. Manag. 2021, 43, 108–111. [Google Scholar]
  33. Zhao, F.; Si, B.; Wang, Q.; Wen, X. A Model and Algorithm for Park–and–Ride Location in Urban Considering Multiple Objectives. China J. Highw. Transp. 2021. Available online: https://kns.cnki.net/kcms/detail/61.1313.U.20211103.1820.004.html (accessed on 15 November 2021).
  34. Liu, T.; Pan, H. Park and Ride Practice in Shanghai. Urban Transp. China 2020, 18, 45–49, 74. [Google Scholar]
Figure 1. P&R facility hierarchies.
Sustainability 14 01502 g001
Figure 2. P&R facility coverage based on rail transit connection.
Sustainability 14 01502 g002
Figure 3. Schematic diagram of P&R coverage area and demand.
Sustainability 14 01502 g003
Figure 4. Coverage characteristics of P&R facilities in outer suburbs.
Sustainability 14 01502 g004
Figure 5. Coverage characteristics of urban P&R facilities.
Sustainability 14 01502 g005
Figure 6. Simplified transportation network topology in the remote suburban scenario.
Sustainability 14 01502 g006
Figure 7. Analysis of the selection behavior of P&R facilities by demand points.
Sustainability 14 01502 g007
Figure 8. Analysis of location results under the constraints of the construction quantity of different P&R facilities.
Sustainability 14 01502 g008
Figure 9. Simplified traffic network topology map in the urban scenario.
Sustainability 14 01502 g009
Figure 10. Analysis of location results with different coverage radius of P&R facilities.
Sustainability 14 01502 g010
Figure 11. Analysis of location results under the constraints of the construction quantity of different P&R facilities.
Sustainability 14 01502 g011
Figure 12. Schematic diagram of location of P&R facilities in the suburbs and urban area of Changchun.
Sustainability 14 01502 g012
Table 1. P&R facility alternative points and demand point distribution.
Rail
Station
x Axis (m)y Axis (m)Demand
Points
x Axis (m)y Axis (m)Demand
(veh)
j145,5171654i145,1471318762
j244,4493654i246,2323308581
j342,2674755i344,5884813367
j441,1822538i443,2803058287
j538,9832972i542,7801712814
jk29833221i640,5311058432
i740,9342962673
i840,4084885768
Table 2. Analysis of the results of P&R facility location in the outer suburbs.
IndexModel 1Model 3
P&R facility location plan2, 32, 4
Demand points
within coverage
2, 3, 4, 5, 6, 81–8
Closure number of private vehicles (veh)23393759
Closure private vehicle mileage (km)8.4 × 10312.3 × 103
Table 3. P&R facility alternative points and demand point distribution.
P&R Facility Alternativesx Axis (m)y Axis (m)Demand
Points
x Axis (m)y Axis (m)Demand
(veh)
j159677398i162747777942
j241656306i250498692658
j346074384i351179409741
j461602831i427044428871
j577123828i546072402278
j680985901i649801219517
j750949030i76749872781
j824206560i886453376347
j932242638i996021860456
j1065001108i1095374410343
j1197523318i1110,2175907182
j1286538056i1293677097477
i1310,1847437329
i1485178457687
i1574179517531
Table 4. Comparison of results of urban P&R facility location.
Index
Considering
Coverage Characteristics1/2 pt Not Considering
Coverage Characteristics
Model 2Model 4Model 5
P&R facility
location plan
3, 9, 11, 122, 5, 9, 12
(or other solutions)
7, 10, 11, 12
Demand that is not covered by P&R facilities1, 2, 3, 7, 141, 2, 3, 7, 144
Potential coverage of P&R travel demand (veh)433143317269
Actual coverage of P&R demand (veh)352743316379
Table 5. Distribution of alternative points and demand points of P&R facilities in the suburbs of Changchun.
P&R Facility
Alternative Points
LongitudeLatitudeDemand PointsLongitudeLatitudeDemand
(veh)
j1125.447843.9949i1125.419043.9570154
j2125.434443.9813i2125.404943.999267
j3125.417843.9832i3125.428144.012779
j4125.409543.9733i4125.461844.014355
j5125.388043.9693i5125.478943.970947
i6125.453043.9619177
i7125.421643.9759134
i8125.442243.998488
i9125.399443.977796
Table 6. Distribution of alternative points and demand points of P&R facilities in the urban area of Changchun.
P&R Facility
Alternative Points
LongitudeLatitudeDemand PointsLongitudeLatitudeDemand
(veh)
j6125.341143.9291i10125.358043.9283287
j7125.337843.9128i11125.351143.9147193
j8125.369143.8783i12125.385043.9100511
j9125.330043.8782i13125.385543.8944332
j10125.293843.8828i14125.354943.8896307
j11125.326343.8602i15125.346443.8627289
j12125.365143.8601i16125.345743.8495143
j13125.389543.8759i17125.376843.8602197
j14125.363843.8982i18125.381243.8797226
j15125.271043.8907i19125.289743.8570251
j16125.310243.8982i20125.310243.8731334
i21125.274743.8756421
i22125.267643.8973262
i23125.282943.9062187
i24125.296543.9205179
i25125.313443.9303225
i26125.301143.9023358
i27125.310743.8902270
Table 7. Results of location of P&R facilities in the suburbs and urban area of Changchun.
IndexLocation of P&R Facilities in the SuburbsLocation of P&R Facilities in the Urban Area
P&R facility location scheme27, 8, 11, 16
Covered demand points1, 2, 3, 4, 5, 610, 12, 13, 14, 15, 16, 19, 20, 23, 24, 25
Uncovered demand points7, 8, 911, 17, 18, 21, 22, 26, 27
Publisher’s Note: MDPI stays neutral with regard to jurisdictional claims in published maps and institutional affiliations.

