1. Introduction
Recurrent severe droughts seriously threaten food security, socio-economic condition, and ecosystems in the Lower Mekong Region (LMR) [
1,
2,
3]. The 2019/20 drought in many locations of Thailand [
4] and Vietnam’s Mekong delta [
5,
6] are the recent example, where fragmented institutional mandates and varying technical capabilities to monitor these extreme events led to a significantly to delayed response [
7,
8]. Meanwhile, climate change has magnified drought in both frequency and severity [
9,
10]. It aggravates the insecurity of water resources that causes a serious disparity between water supply and demand in the region [
2,
11,
12]. The effects of the water imbalances have created inequalities in the distribution, allocation across competing users, and extensive use of groundwater, which could be a cause of institutional arrangement and political targeting for many countries [
13]. These cascading socioeconomic and ecosystem impacts have disrupted efforts to achieve the target sets in at least 4 different Sustainable Development Goals (SDGs), particularly relating to SDG 6 Clean water and sanitation, SDG 11 Sustainable cities and communities, SDG 13 Climate actions, and SDG 14 Life on land.
This increased risk of both drought and water security was profoundly notified by six riparian countries (China, Cambodia, Lao PDR, Myanmar, Thailand, and Vietnam) under the Joint Working Group (JWG) on Water Resources of the Lancang Mekong Cooperation (LMC) during the 2019 Second Special Meeting in Nong Khai, Thailand [
14]. They initially agreed to undertake joint research on the 2019 drought to gain a more thorough understanding of the physical processes leading to the drought and their impacts. Decision-makers and water managers are aware of frequent extreme weather events, specifically increasing worse droughts and their intensifying impacts [
14,
15]. They, however, find it difficult to measure drought onsets and endings, even in water-rich countries because droughts are not weather or climatic anomalies [
16].
Recent advances in data innovation and digital technologies are making their way into a wide range of applications for water resources management, for instance, [
17,
18,
19,
20,
21,
22,
23,
24,
25,
26,
27,
28]. Specifically, satellite data at varying spatial scales are likely being used as an alternative or complementary source of information to in situ monitoring networks in data-poor regions [
29,
30]. In many parts of the Lower Mekong Basin (LMB), satellite data is seemingly the only feasible source [
31,
32] that can provide critical information in support of managing water resources and monitoring the evolution of droughts, other hazards, and their impacts [
30,
33,
34]. In response to the growing attention and need from decision-makers in the LMR, several satellite-based operational near-real-time systems for drought and water monitoring have been developed to provide static maps at a weekly drought condition with single meteorological or a few agricultural drought indicators at the national and regional scales. A few examples of such systems are The Thai Geo-Informatics and Space Technology Development Agency (
https://drought.gistda.or.th/ accessed on 4 October 2021), SERVIR-Mekong (
https://mdcw-servir.adpc.net/;
https://rdcyis-servir.adpc.net/map accessed on 4 October 2021), and Mekong River Commission (
http://droughtforecast.mrcmekong.org/maps accessed on 4 October 2021). At the global scale, the Center for Spatial Information Science and Systems/George Mason University (
http://gis.csiss.gmu.edu/GADMFS/ accessed on 4 October 2021), the University of California, Irvine (
http://drought.eng.uci.edu/ accessed on 4 October 2021), and the Food and Agriculture Organization of the United Nations (
https://www.fao.org/giews/earthobservation/asis/index_1.jsp?lang=en#uvhi accessed on 4 October 2021) have a near real-time drought assessment products at the larger spatial scales (500 m to 11 km).
Those existing drought monitoring systems are too coarse and have a limited operation period of satellite sensors to capture detailed spatial coverage conditions, due to complex topography and heterogeneity [
35,
36,
37,
38]. They are unfortunately unable to provide essential information in decision-making at the sub-national or basin scales [
29,
36]. As drought can be localized and increasingly take place on smaller scales [
39,
40]. This highlights the important need for a local understanding of the behavior of water movement, the vulnerability of crops under drought, and other climate and water problems, rather than global or regional levels. A high-resolution near real-time drought monitoring tool with more accurate measures of specific drought indices is, thus, required for decision-making and adaptation at the local scale. Nevertheless, tackling the challenges of drought needs an integrated approach to support water resource management and sustainable development [
41]. In addition, developing any system usually requires considerable time, effort, and resources [
28,
42]. While observational data are individually collected and managed through very sparse agro-hydrometeorological monitoring networks by several agencies, a few are publicly available online at Thailand’s Hydro-Informatics Institute (
https://www.thaiwater.net/v3/ accessed on 7 November 2021), Mekong River Commission (
https://portal.mrcmekong.org/monitoring/river-monitoring-telemetry accessed on 7 November 2021), for instance, this identifies a strong need for better coordinated multi-source observational data across departments within a country [
7]. Thus, we believe that an affordable development of an integrated system for drought monitoring can provide situational information to gain an improved understanding of the behavior of water movement, the vulnerability of crops under drought, and other climate and water problems at the local scale.
The study, therefore, develops a web-based open-source system that will be of great help in reducing task duplication and to further enhance the ability of water managers and policymakers to achieve better water resource management, support concrete actions in timely responses, and catalyzing progress in achieving the listed SDGs and SDG 4 Digital innovation. Other users can also benefit from the WMS. Here, we announce the availability of the high-resolution Water Monitoring System (WMS) and demonstrate its value for water and drought monitoring using the multi-source data and Google Earth Engine (GEE). We, therefore, describe and discuss the details of the workflow, web-based service, key processes of the proposed system, and testbed for Thailand’s river basin case study implementation. We anticipate that this freely available web-based monitoring tool will provide evidence of the state and changes in surface and groundwater over time and inform water management decision-making and the enforcement of extreme event preparedness, mitigation, and emergency measures at the local level.
2. Materials and Methods
The Water Monitoring System (WMS) was developed by the Stockholm Environment Institute (SEI) cross-center researchers (Asia and Latin America) between 2020 and 2021. The WMS entered a digital universe, where day-to-day decisions need to be based on empirical data and analytics, rather than past practice. By embracing new tools and technologies to better understand their complex operations, today’s stakeholders and decision-makers can save time and money, reduce water related risks, and become more efficient. To succeed with the data-driven approach, we need to start with accurate information that requires powerful monitoring tools backed by robust analytic capacities. That is where the WMS comes in. We are taking physical monitoring to new levels with our advanced data innovation, which provides unparalleled real-time visibility into local drought and water resource management.
Using a combination of sophisticated multi-spectral sensors, which provides high resolution satellite imageries, data science analytics, and cloud computing, the WMS delivers unprecedented insights into how lower water resources and vegetation are observed. This is achieved by web-scraped multi-source data to accurately estimate water deficits or inundation and support timely decisions for managing climate-change-related water resource management, with a potential reduction of damages and investment costs and benefits for irrigation development, adaptation measures, and mitigation. Our proposed system is easily scalable and can be used to develop a monitoring system of individual surface and groundwater resources or entire local drought areas. The edge computing technology allows us to deploy them in situations where observational data are unavailable and unreliable. It all adds up to better control over local water resources and a deeper understanding of how to manage it, and that means healthier water systems, better management, and efficient operation.
2.1. Water Monitoring System (WMS)
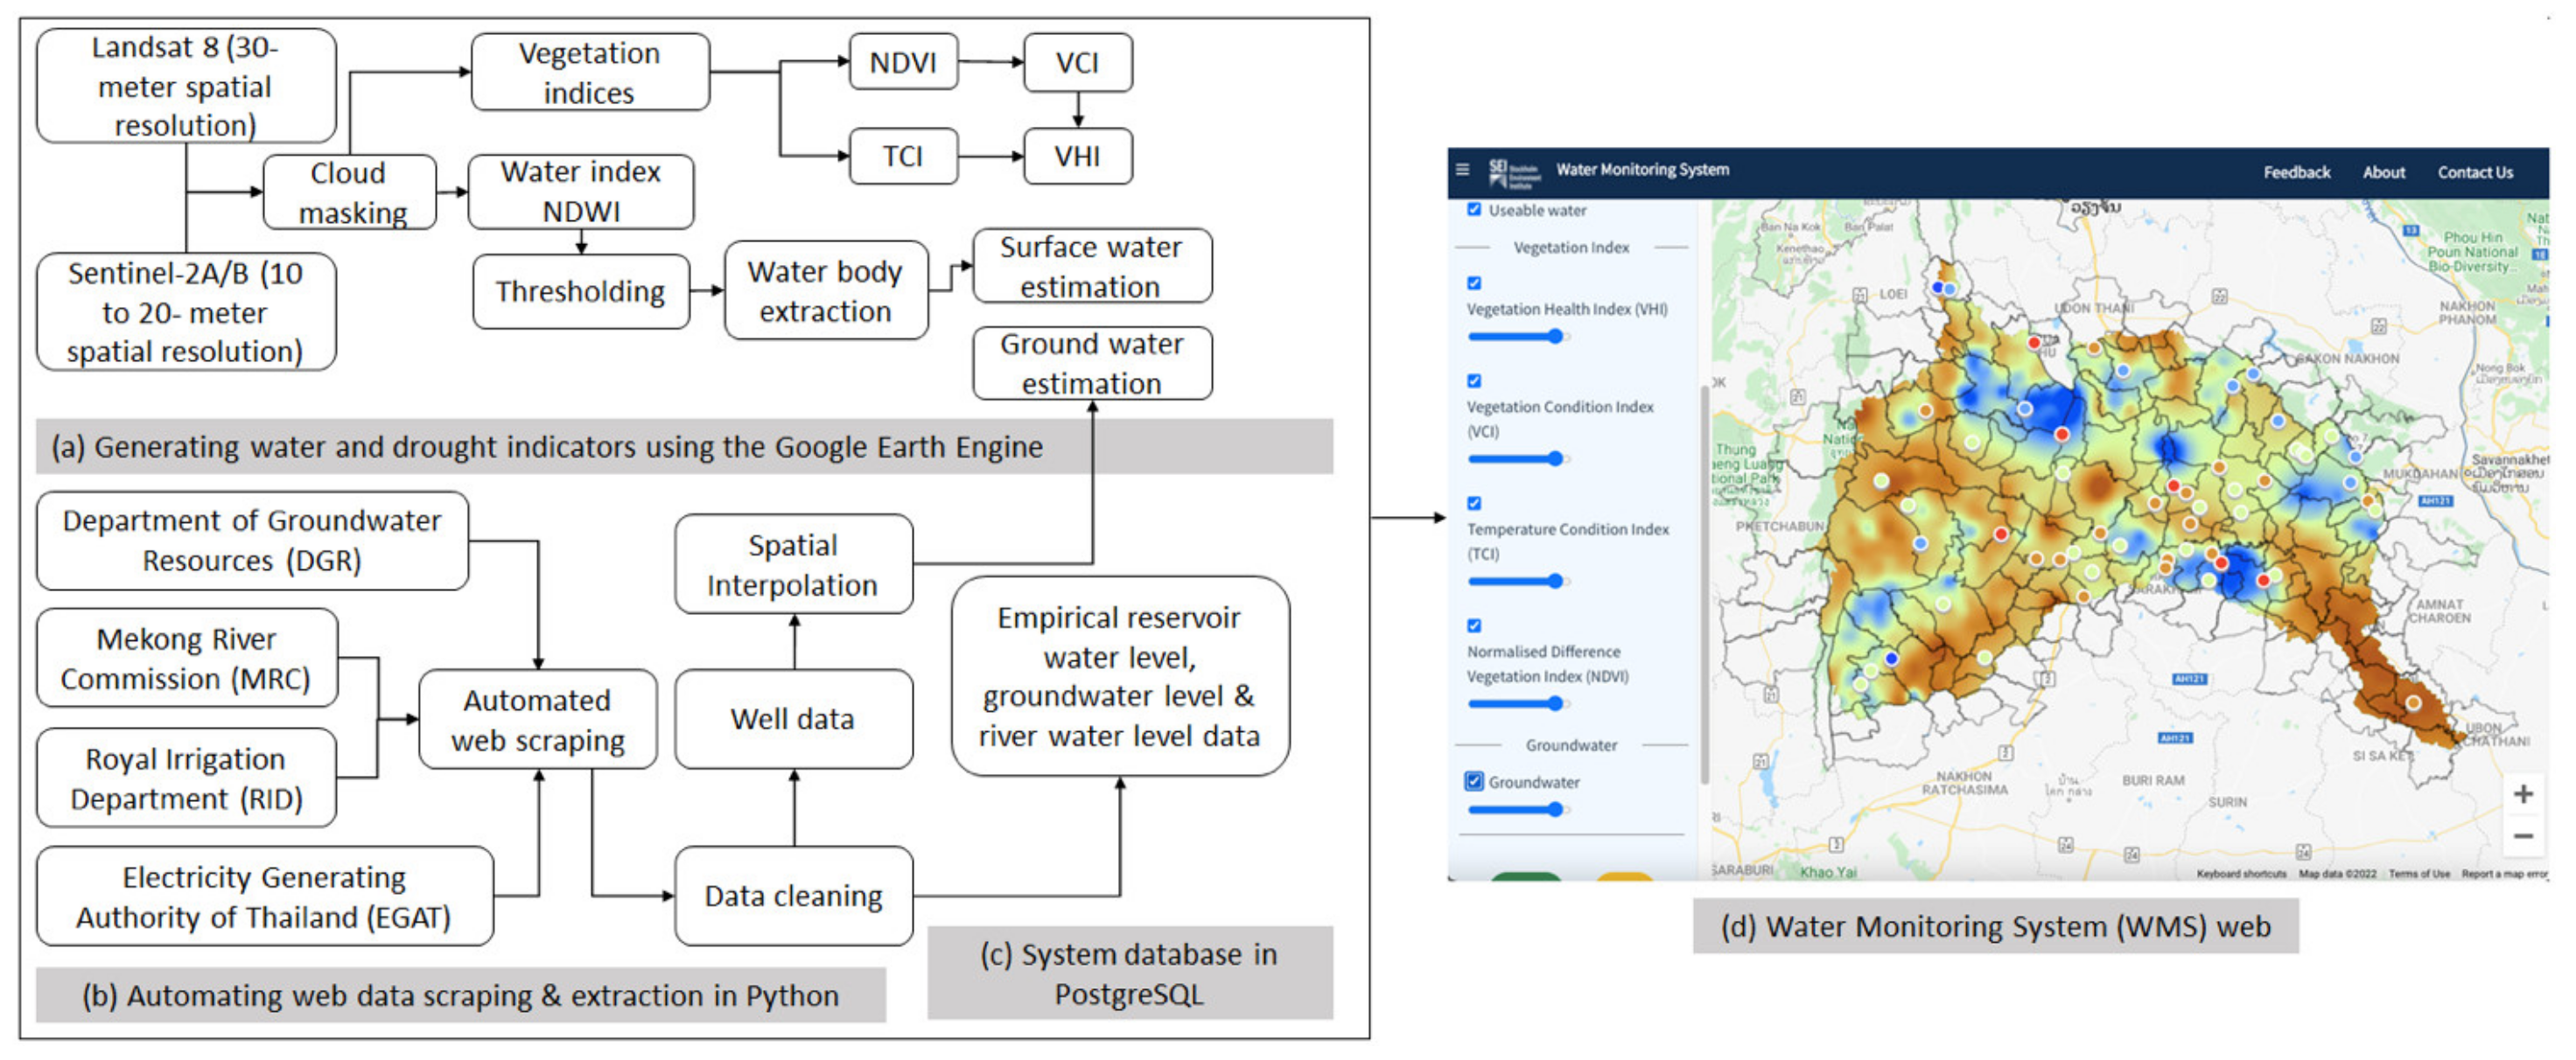
The schematic of the WMS is demonstrated in
Figure 1. It comprises: (1a) a near real-time simulation framework using the Google Earth Engine (GEE) to monitor the evolution of drought and water conditions; (1b) an automated web data scraping and extraction in Python that is an archive of the publicly available surface and groundwater observation data from government websites; (1c) PostgreSQL, a relational database management system to store and process the input data of surface and groundwater as a foundation of the WMS database; and (1d) a web-based service that connects all modules and hosts the resultant archive of the GEE, a system database and a high-resolution spatial maps of drought indices. The WMS allows technical users who are highly trained in the fields of physical environment, geosciences, and water sciences to interact, communicate, and share our results in a non-scientific language with different interest groups, thus reaching a much wider audience. It also aims to provide evidence-based scientific support to the policymaking process for sub-national and local drought assessments, as well as changes of water conditions. Major modules are described in the subsections.
2.1.1. Near Real-Time Simulation in Google Earth Engine (GEE)
The WMS is built on top of the GEE cloud-based platform for sub-national scale geospatial analysis. The freely available Landsat 8 (L8), with a 16-day revisit time [
43], provided by the United States Geological Survey (
https://www.usgs.gov/core-science-systems/nli/landsat/landsat-8?qt-science_support_page_related_con=0# accessed on 28 October 2021) and the Sentinel 2A/B (S2) from the European Space Agency (
https://sentinel.esa.int/web/sentinel/missions/sentinel-2 accessed on 28 October 2021) images with a 5-day repeat period [
44] are utilized and have been routinely downloaded since its inception in January 2021. Although the two images are atmospherically corrected and geo-referenced, based on the global position system (GPS) tier points [
45], cloud contaminations and topographic effects produced by the presence of shadow noises remain the issues in the result of earth’s surface mapping and change analysis [
46,
47]. We implemented the cloud masking algorithm within GEE, which enables us to resolve the effects by removing pixels having cloud presence to meet crucial data use and can yield a higher composite of the satellite imagery.
Estimates of drought and other environmental events have received enhanced attention over the last 30 years [
48]. The visible (VIS) and near-infrared (NIR) wavebands calculating Vegetation Health Index (VHI) [
48,
49,
50], Vegetation Condition Index (VCI) [
51,
52], Temperature Condition Index (TCI) [
48], Normalised Difference Vegetation Index (NDVI) [
53], and Normalised Difference Water Index (NDWI) [
54,
55] have been used in designing local drought monitoring techniques in the WMS.
Vegetation Health Index (
VHI)
Vegetation Condition Index (
VCI)
Temperature Condition Index (
TCI)
Normalized Difference Vegetation Index (
NDVI)
where,
LST is the land surface temperature,
Red is the red band (0.64–0.67 µm), and
NIR is the near infrared band (0.85–0.88 µm) of Landsat 8. These have been selected as the four indices for maintaining local drought monitoring [
56]. An additional surface water analysis, the normalized difference water index (
NDWI), is used to delineate the spatial distribution of open water areas. Rivers and rice fields were excluded from the layer using thresholding over multi-temporal and seasonally aggregated images. The data we processed include reservoirs, lakes, and other water bodies and its temporal changes from surface water data that are stored in the system database of the WMS.
where, Green is the green band (0.543–0.578 µm) and
NIR is the
NIR band (0.855–0.875 µm) of Sentinel 2. For the current development, S2-based surface water area extraction was estimated. Cloud-masking was carried out based on the quality assessment (QA) band and cloud-pixel percentage. Metadata images that had less than 20 percent pixels with the presence of clouds were selected by filtering out clouds using the QA bands. Following the
NDWI calculation, thresholding was applied to extract pixels with water presence. Rivers and inundated agricultural fields were removed using an assigned custom mask.
The results of the GEE-based processing are a collection of the VHI, VCI, TCI, NDVI, and NDWI anomalies, which are stored in the Google cloud and presented in the form of maps at 10 to 30 spatial resolutions and graphical images. It provides near real-time monitoring of open water area dynamics and agriculture ecosystems, which is very useful to study of the irrigation, early warning, natural environmental health, agriculture, and river ecosystems and to understand the impact of the spatial distribution of the water stress on vegetation and its temporal evolution over longer time periods.
2.1.2. Automated Web Data Scraping and Extraction in Python
Data scraped from multiple websites cannot be directly used by an analysis tool without human intervention. We therefore developed a custom web scraper program based on Python that is installed on the back-end system of the WMS to automatically read the code of a web page and decode it to extract the required data. Since there was a large amount of continuous observational data, we decided to use Python [
57] in the development of the web scraper program. Our decision, therefore, was specifically made for the following reasons: it is a free, open-source programming language with a wide active developer base with several supporting packages and an application programming interface (API) to support the handling of large data, support system development, and connect with the preferred database PostgreSQL for data processing pipelines and to connect with GEE platform.
We added the custom-developed scraper program to log in to daily updated public access environmental data, including open water level data and groundwater level data, that are disseminated from databases of national and international official sources. The web scraping program was oriented to collect observational data from the agro-hydrometeorological stations for point locations within the national agencies, focusing mainly on rivers, reservoirs, and groundwater well data from the LMR, and thereafter the collected data are stored in the WMS database in accordance with the design schema attributes and formats.
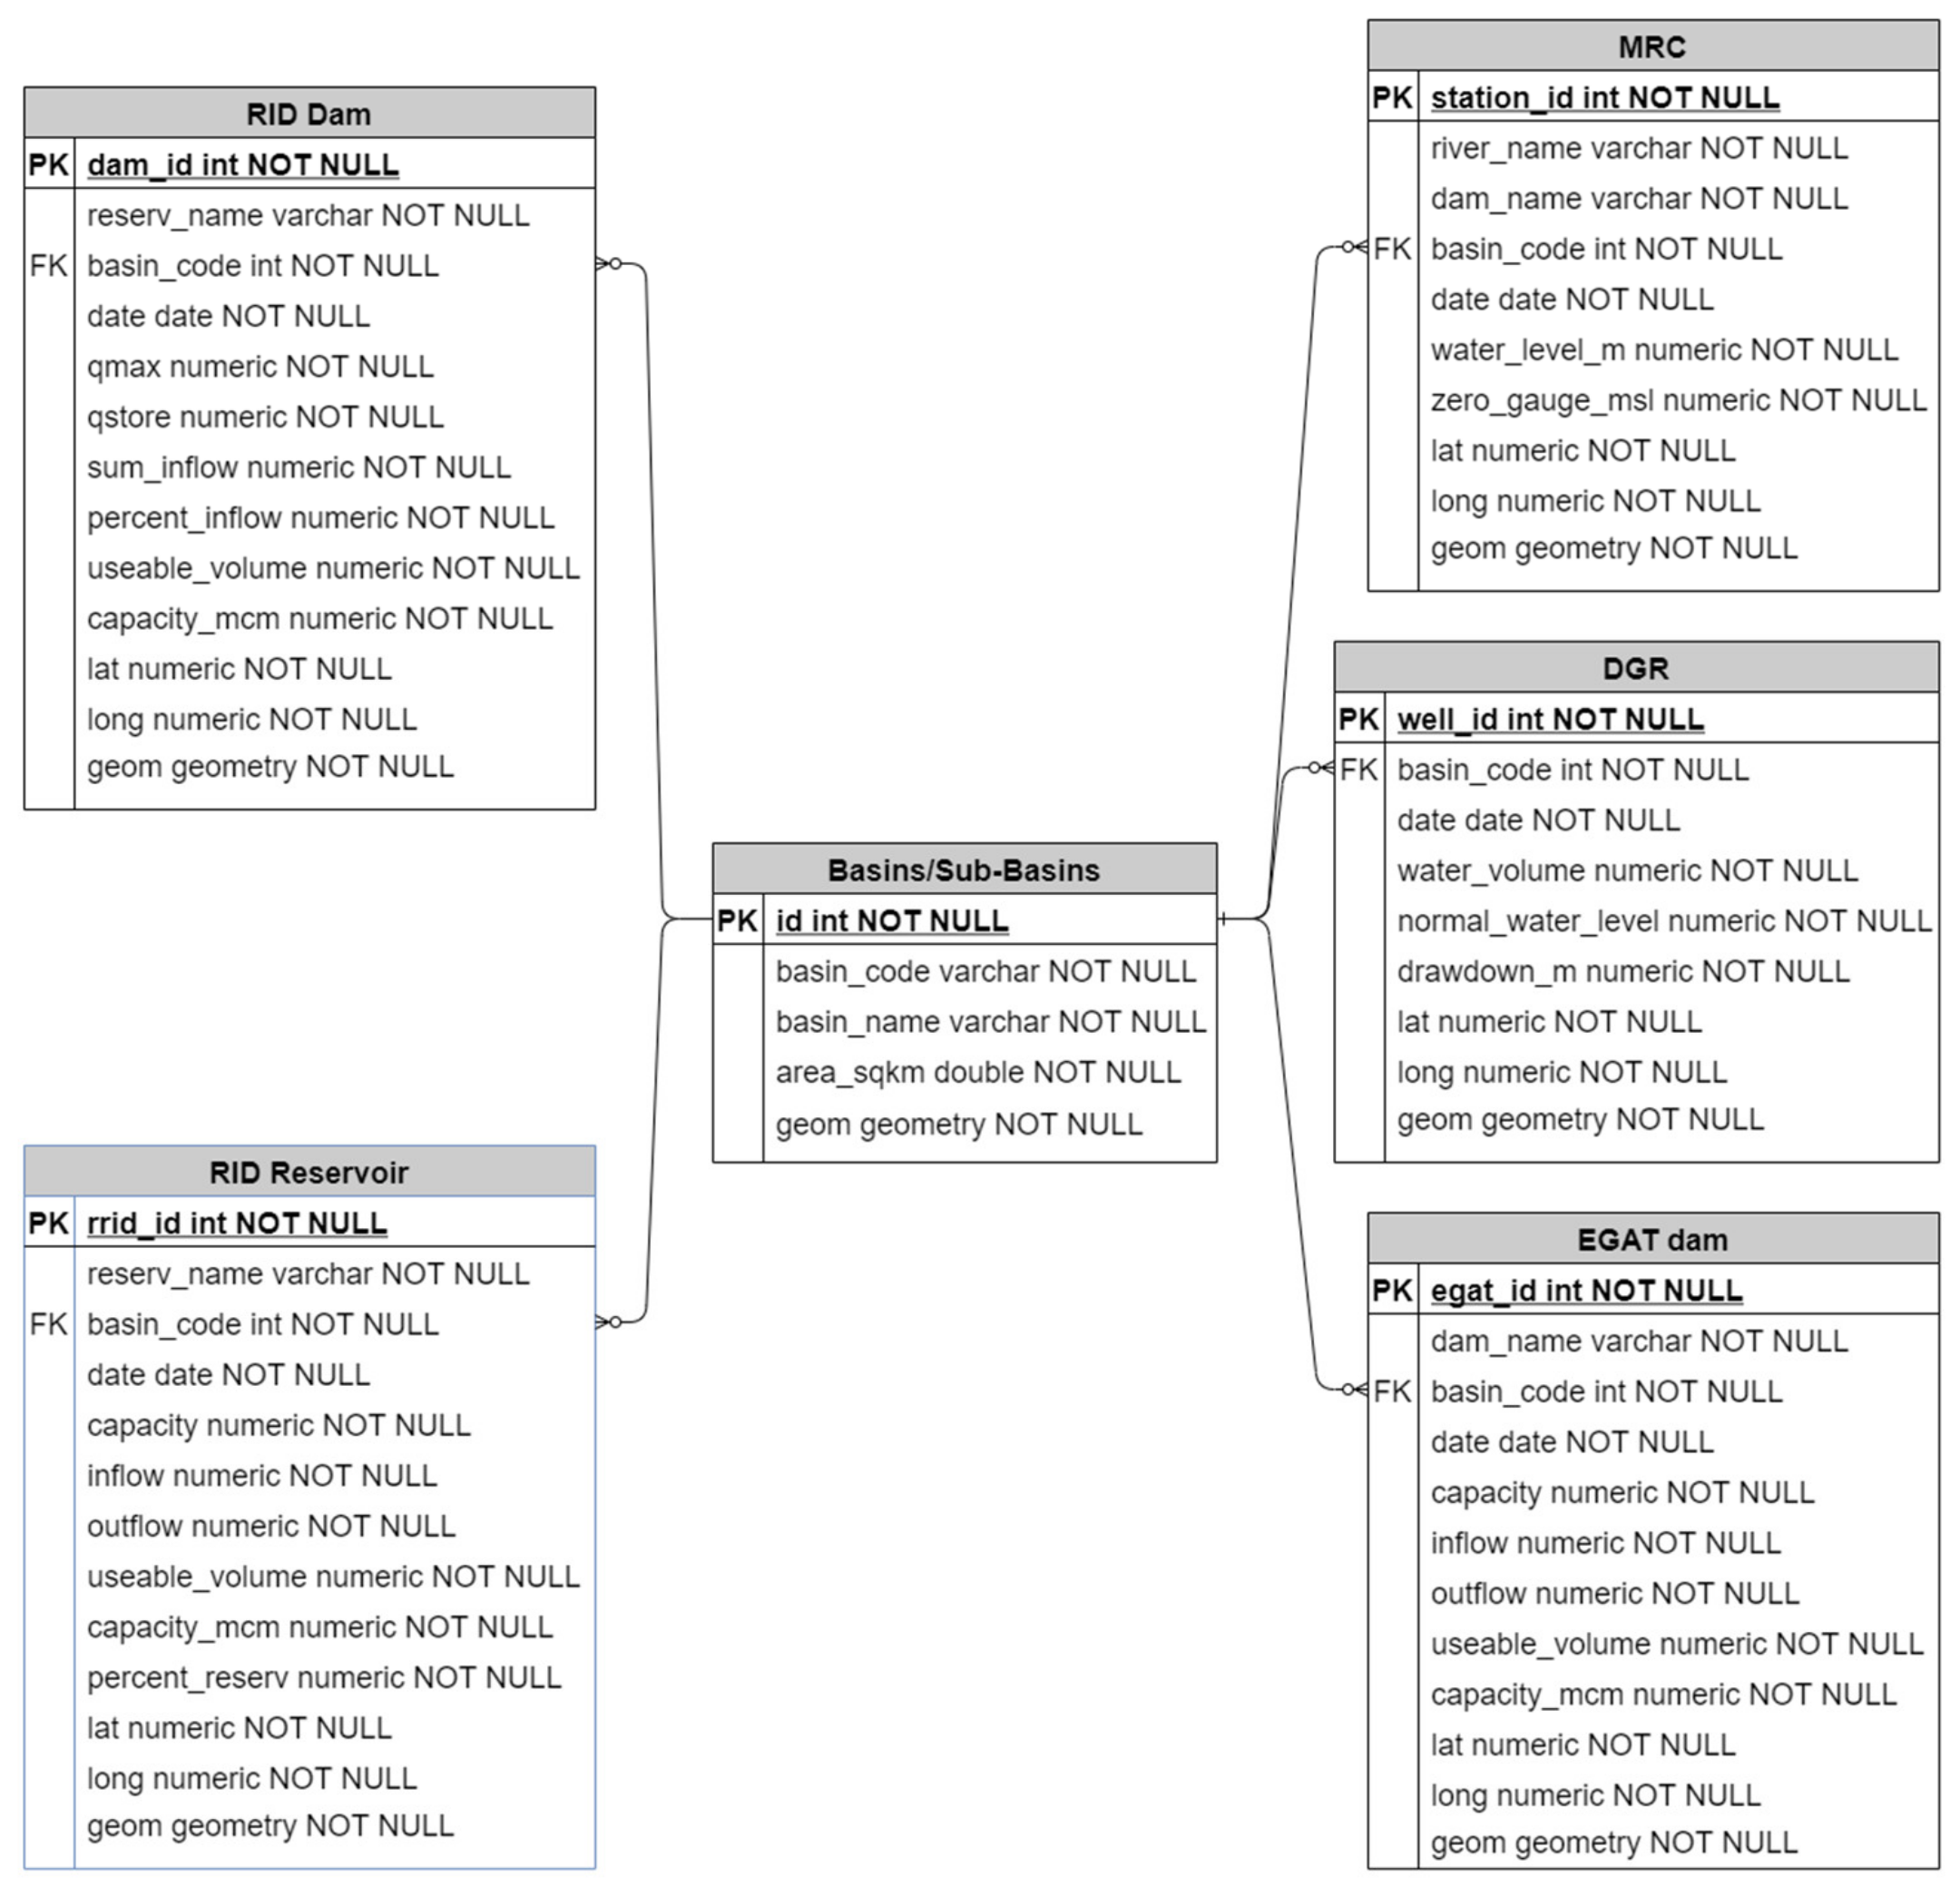
2.1.3. System Database in PostgreSQL
Additionally, a back-end relational database management system was developed in the PostgreSQL that stores the web scraped data with the input format of comma-separated values (CSV;
Figure 2). The PostgreSQL (
https://www.postgresql.org/ accessed on 28 October 2021) was selected for the system because it is an advanced open-source object relational database management system that applies SQL language. The PostGIS extension of the PostgreSQL enhances its capabilities in storage and handing spatial datasets [
58,
59], thus allowing us to store large and sophisticated data safely and steadily that help to build the most complex database, run administrative tasks, and create integral environments to the WMS.
In the current development, the daily web-scraped data from each source are stocked in the system database in the web server. The data retrieval, including river, reservoir, and groundwater levels, has been processed to derive the spatial and temporal structure and the changing characteristics of open water areas. Since groundwater level data were from more than 100,000 points of observations scattered across the tested basin, it was more feasible to convert them to a finer regular grid using interpolation techniques for the analysis of changes in data over time. We, hence, adopted the inverse distance to power or inverse distance weighted (IDW) algorithm [
60,
61,
62,
63,
64,
65], which is found to give best results for interpolating the continuous earth’s surface. This was executed in Python using GDAL [
66] grid functionalities. To calculate value
Z at each grid node, the following formula was used.
where
is a known value at a point
i,
ri is a distance from the grid node to point
i,
p is weighted power, and
n is number of points in
Search Ellipse.
For the current study, p is 3 and both radii of the Search Ellipse are 5. The resulting interpolated raster is transferred to the Google cloud platform to enable its access through the GEE.
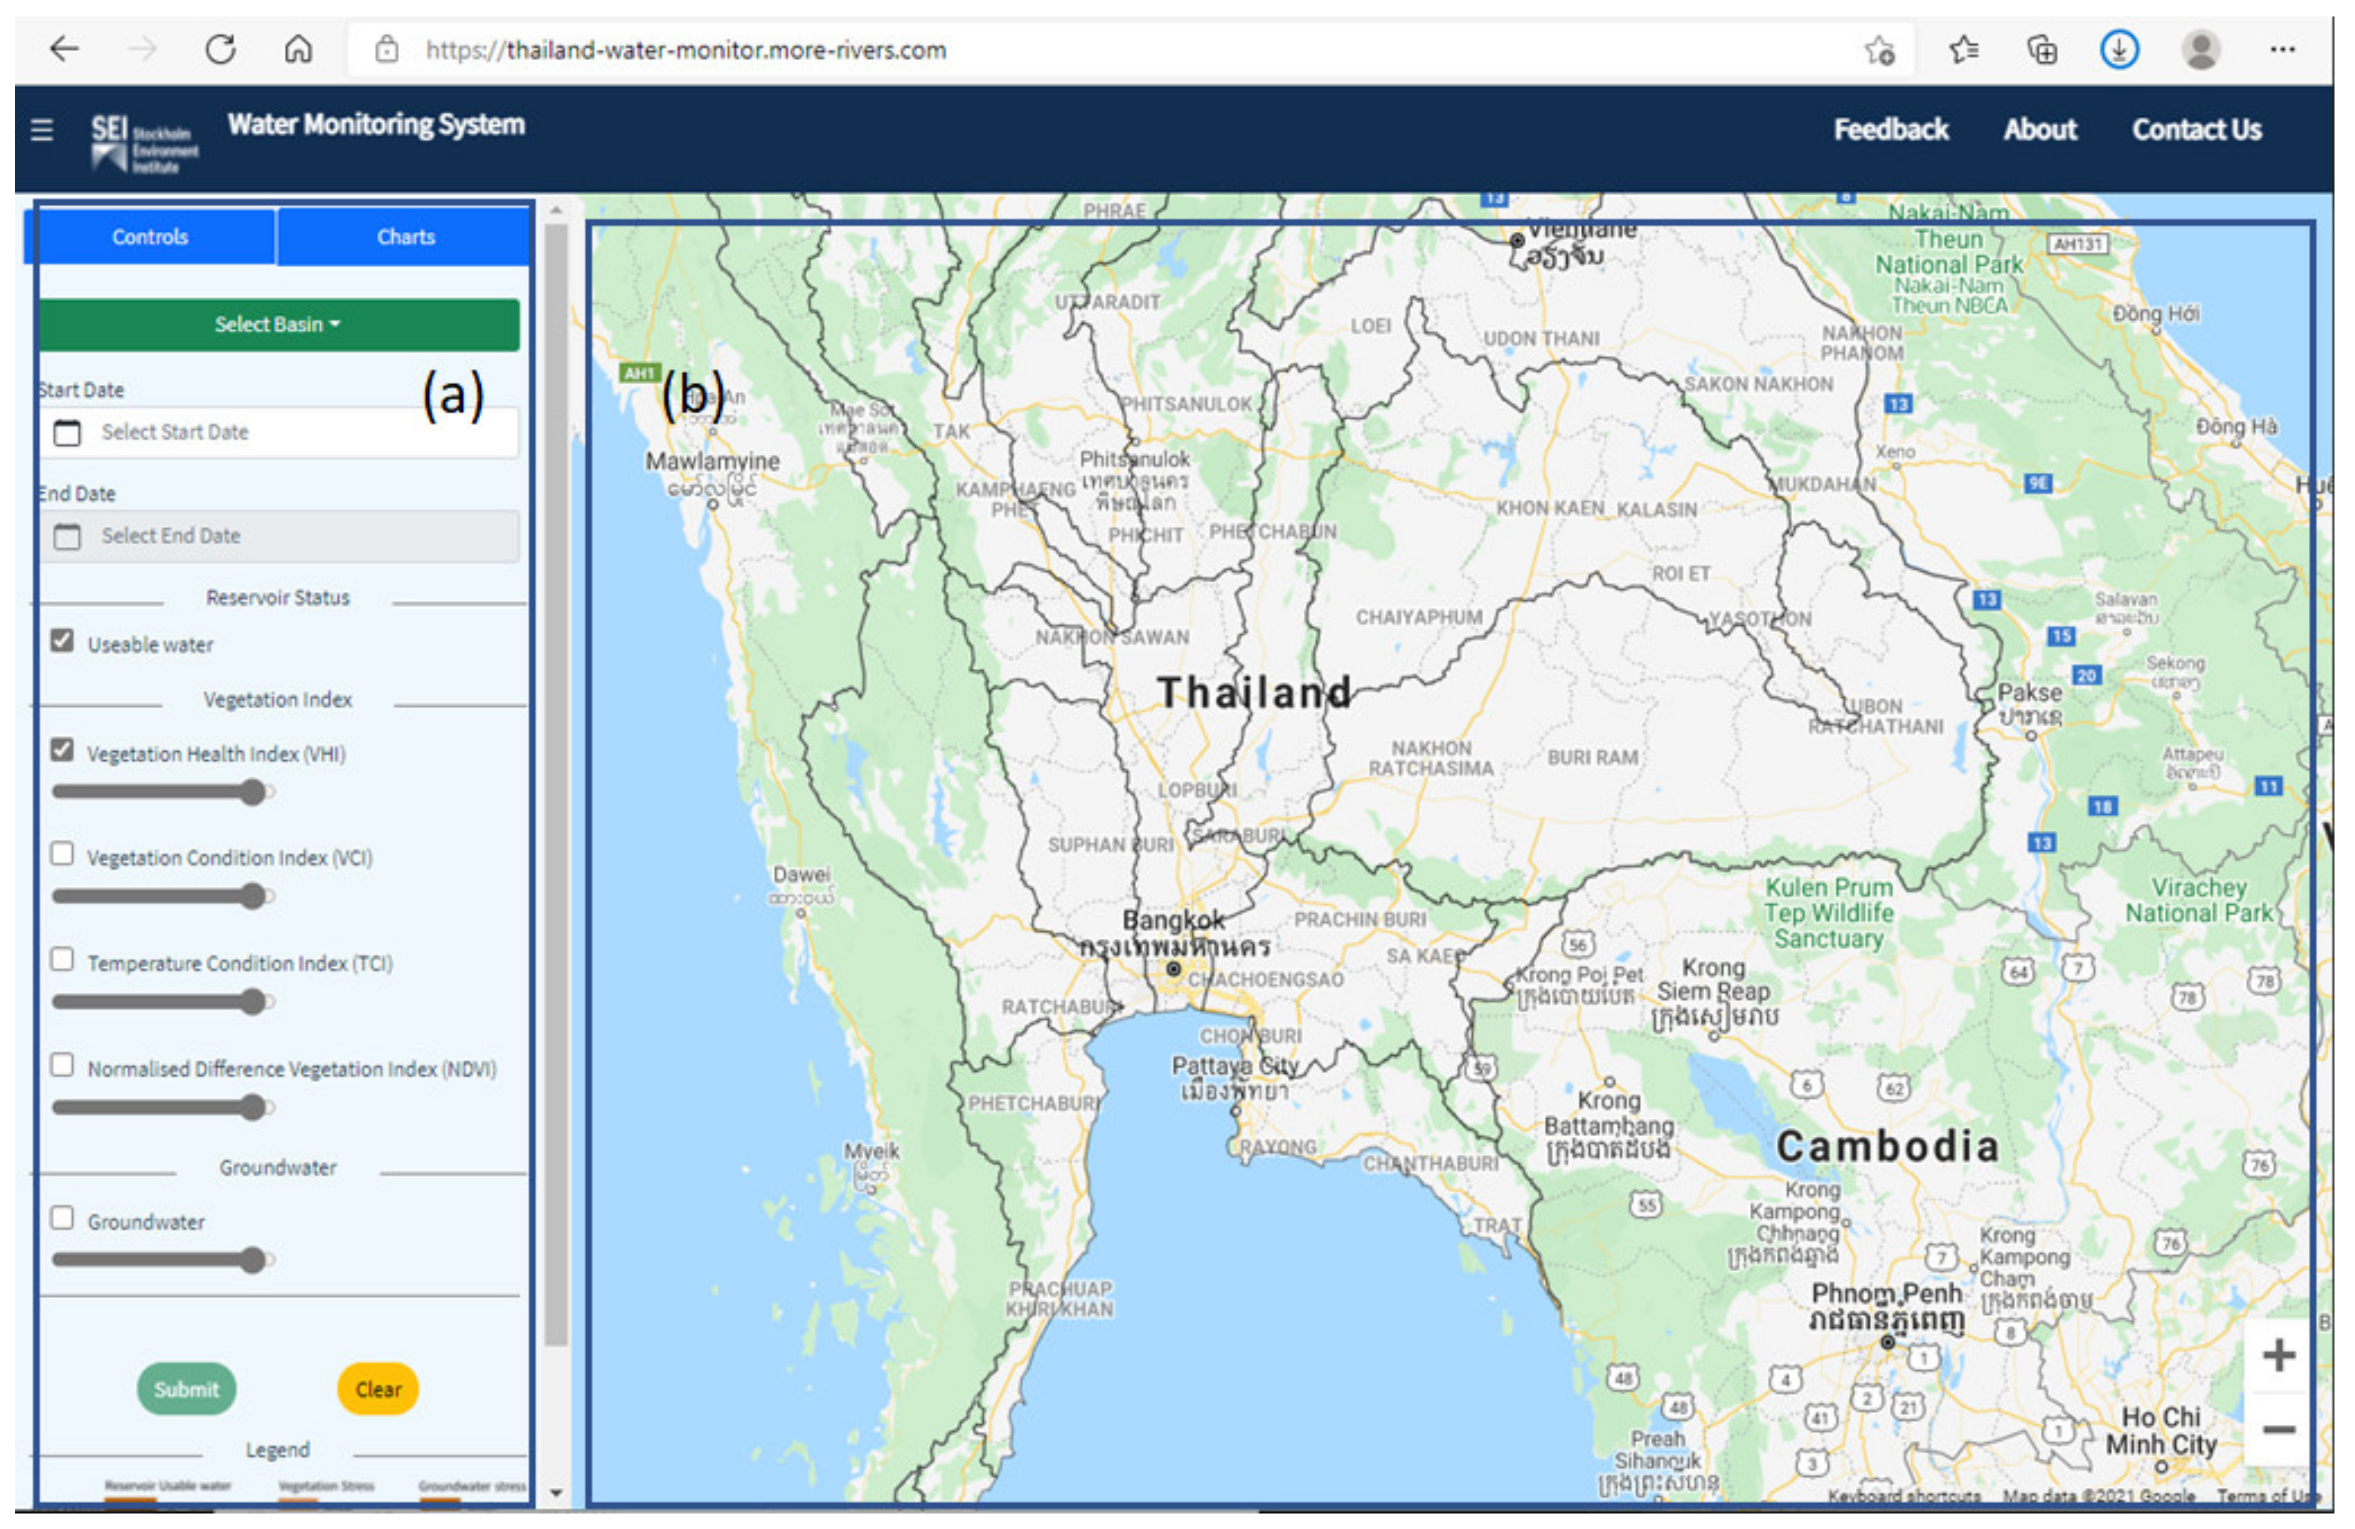
2.1.4. Web-Based Water Monitoring System
We automated user access and the output processes of the WMS through a web-based interface to assess a suite of drought characteristics at the multiple timescales, from daily to annual, at a 10 to 30 m spatial resolution. The web-based interface has been designed to be user-friendly and easily visualize the results, while the processing chain is essentially a computational routine in the back-end system. Our real-time web-based water monitoring system is accessible over the web at the following URL:
https://thailand-water-monitor.more-rivers.com/ (accessed date on 4 November 2021).
Figure 3 depicts the interface with two highlighted parts. First (3a), a list of input variables is in the contents pane where users can specify a river basin, a time-series for monitoring water and drought conditions, a water index, and a vegetation drought index of interest to derive conditions of the open water areas and the evolution of droughts. This includes the reservoir usable water status, a collection of vegetation indices (VHI, VCI, TCI, and NDVI) and the groundwater level changes. The interaction is conducted via the clicking of choices, while moving of sliders allows users to see more or less of the underlying maps. The transparency, or opacity, of any index can be adjusted from 0% to 100%. The more transparent a layer is, the less visible it appears on the resultant map and the more visible the other layers appear. By default, the base map is 0% transparent which means it is fully visible. If users want to focus attention on a specific result of the index map layer, they might consider making it fully visible and adding transparency to the other layers. Second (3b), the right pane is the output window, where it shows an interactive global map for displaying spatially varying responses of open water area changes and drought conditions. The outputs can also be shown as an interactive time-series plot for the changes by switching between the Controls tab and Charts tab in the contents pane.
All figures and time-series plots are the output of the simulated spatial and temporal extents of areas vulnerable to potential extreme weather events at a selected location and overall statistics, respectively. Users can further evaluate the simulated results in the spirit of a data-driven decision-making processes. Specifically, they can access the current condition of open water areas and droughts, respond to hazards or early warnings more effectively, and provide a comparison of the current water and drought events to past events. The users can obtain a daily vegetation index map and an analysis of open water area changes, and these illustrate the spatial extent and index variation of drought and water through the web-based interface of the WMS. The system can be used by decision-makers and technical users to assess drought and water warning conditions and facilitate the management of actionable drought mitigation measures through near real-time monitoring of drought dynamics, in terms of both hydrological and vegetation variables.
On the back-end system, the web-based application processes users’ inputs and triggers a simulation of water and drought assessment at a high spatial resolution. It can easily become an overwhelming task if one wants to simulate all indices at one time. Instead, in this case, the WMS prepares input files, calls the system executable program, and then retrieves outputs for producing spatial and temporal maps and time-series plots. It is, therefore, worth nothing that for a large-scale basin study with a selection of multiple indices, the latency between users’ inputs and output display can be large, due to the longer simulation time. Therefore, the WMS was designed to process users’ requests into the input files and quickly retrieve outputs after simulation for displaying results on the front-end user interface.
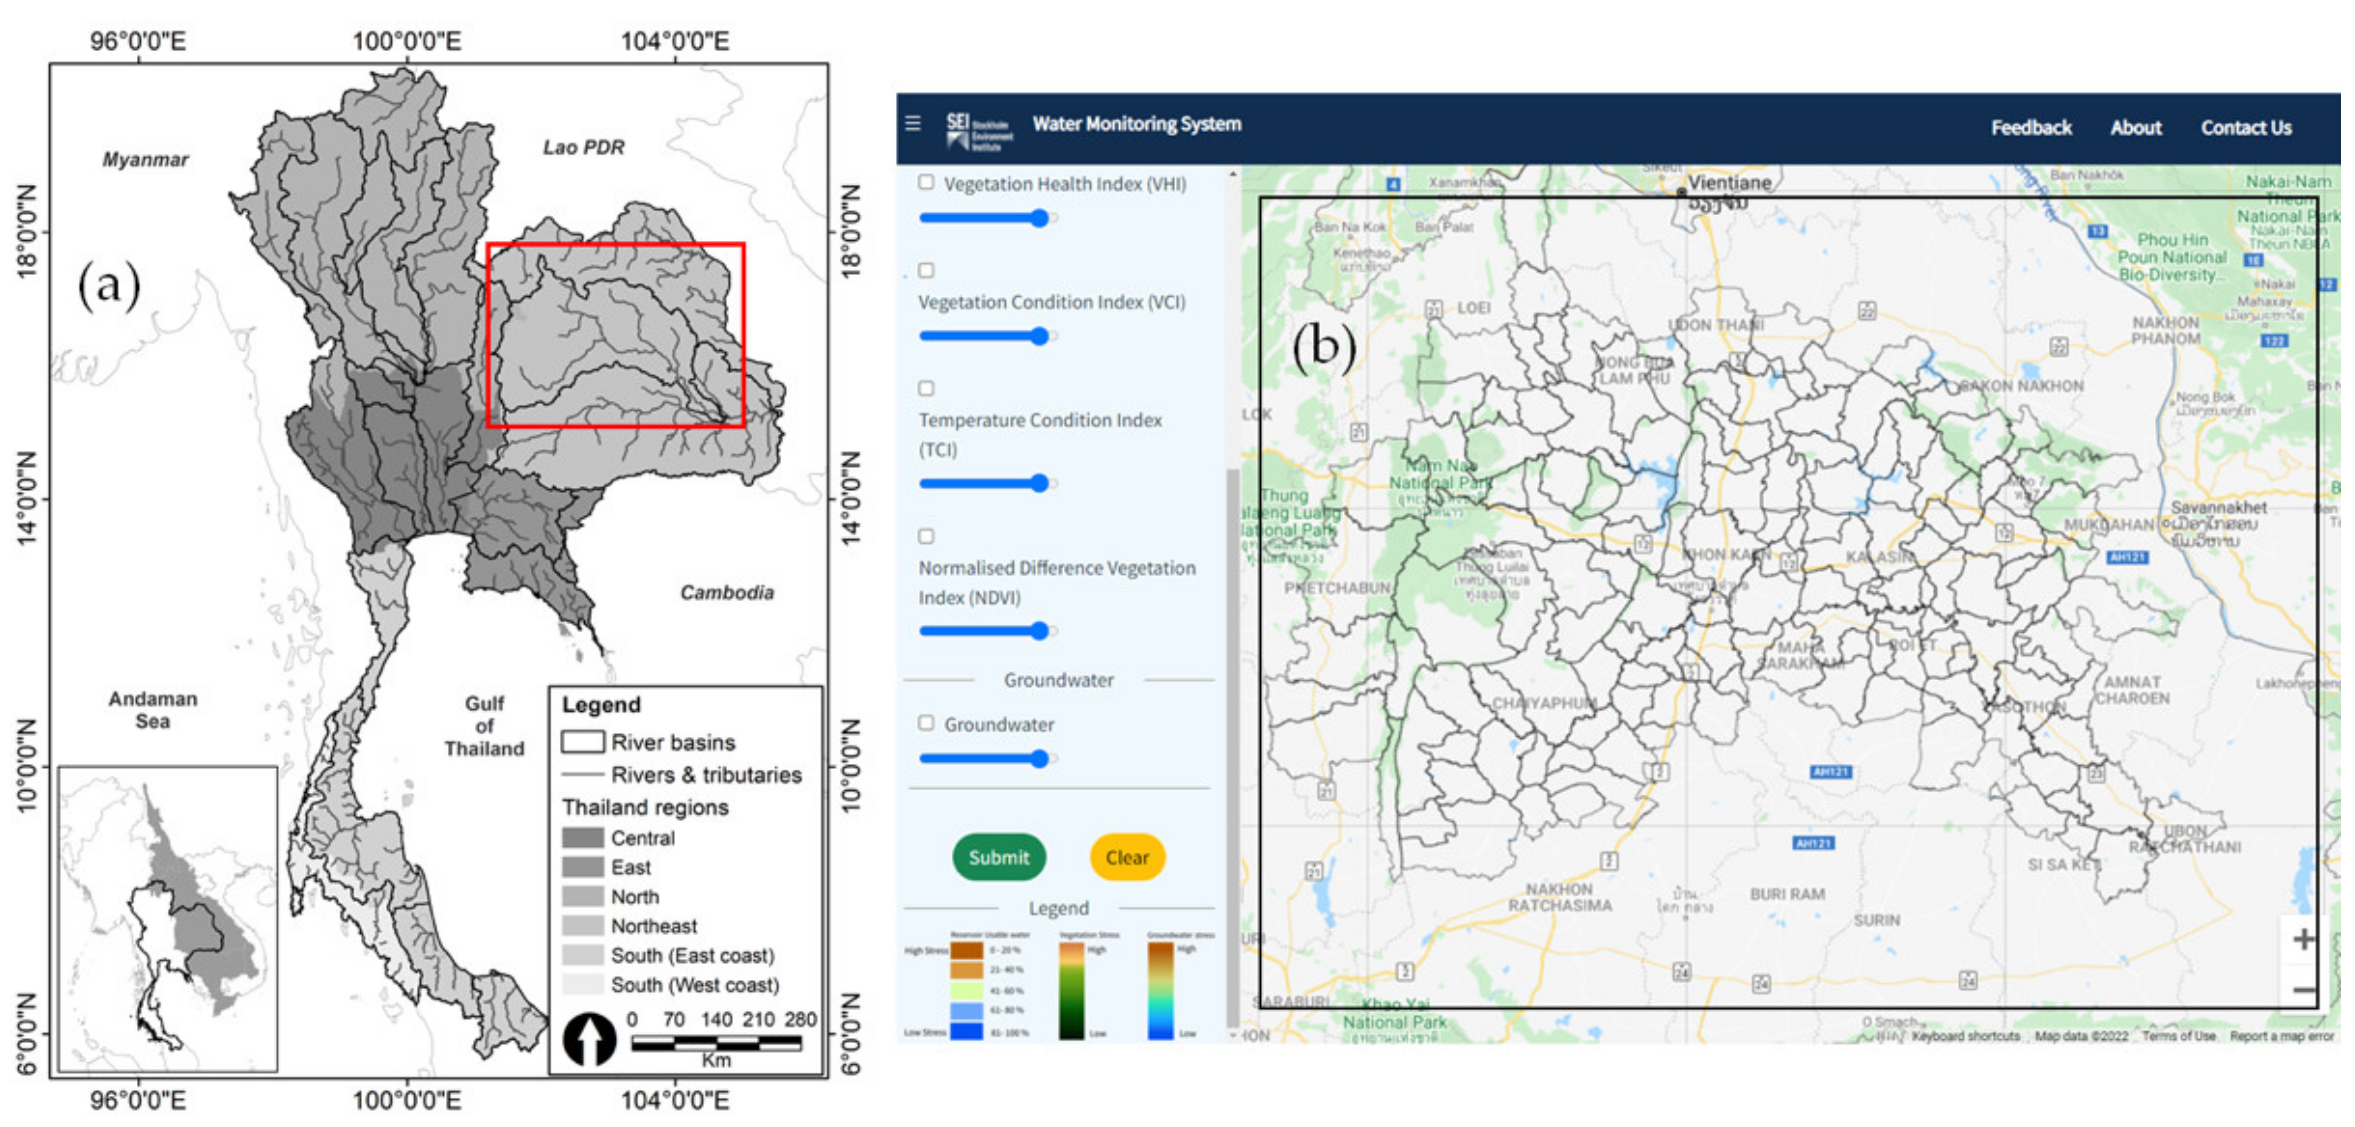
2.2. Testing the WMS in the Case Study Area
Here, we present a case study in which we applied the WMS to Thailand’s river basins (
Figure 4a). The case study provides a lens for the understanding of the WMS’s performance and reliability through the practical experience of functionalities, computation time, the simulated results, and the potential development for additional functionalities to deepen and broaden the results in the future. The results and discussions of the case study are presented in the next section, focusing on the highlighted application and utility of the WMS.
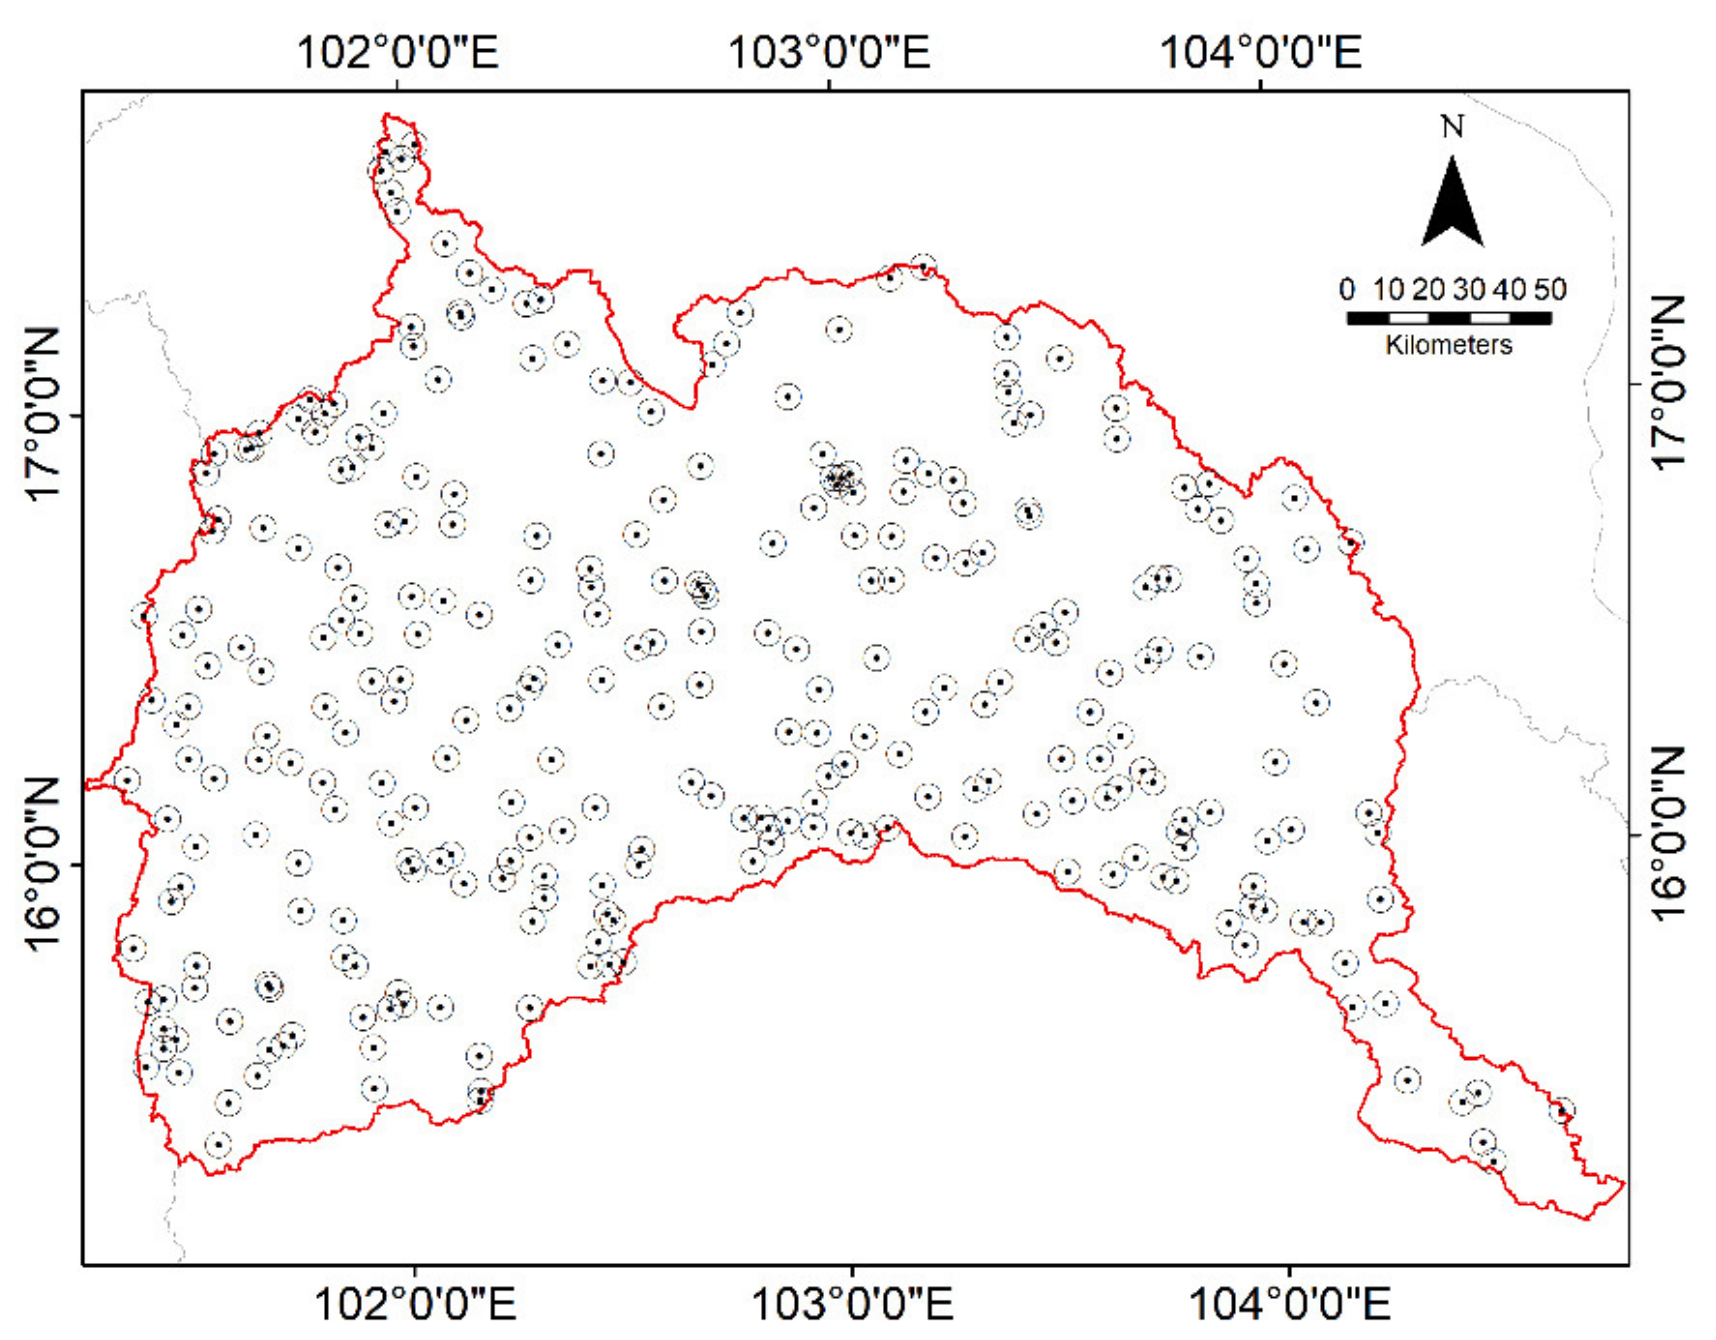
Specifically, the WMS was tested in the Chi River Basin (
Figure 4b), which is located in northeastern Thailand. The basin has a population of around 6.6 million people in the total land area of 49,131.22 square kilometers (km
2). It is composed of mountainous terrain where it forms the border between the Mun Basin in the south, the Mekong and Mun Basins in the east, and the Pasak watershed in the west. The topographic terrain varies between 170 m and 300 m with mountain ranges between 500 m and 1000 m, situated between 15°30′ and 17°30′ N latitude and 101°30′ and 104°30′ NE longitude and influenced by the tropical monsoon. The annual average temperature is 26.9 °C, and the mean annual precipitation is approximately 1170 millimeters (mm), increasing from west to east with a monthly average of 2.3–243.7 mm.
Most of the basin population engages in agriculture on the 60% arable land where there are rice fields (41%), forest (31%), urban (2.9%), water bodies (2.5%) and other lands (3.5%). Rice farming is found in the middle and downstream of the Chi River Basin. Most rainfed rice is grown during the rainy season (June-December) and the second crop of rice is commonly planted under irrigation during the dry season (January-April). Cassava and sugarcane are harvested all year. The main cassava growing region is in the southwest and north basin, while sugarcane is produced in the northwestern, north, and southwest basins.
The Chi River Basin is naturally prone to droughts and floods, due to the influence of the quite irregular and unreliable rainfall, and that makes the basin vulnerable to such hazards. The basin has experienced extensive rice growing and spatial land cover changes with a rapid urban transformation. These changes have resulted in the increased competition of water resources in different sectors. Climate change has already happened at a much faster rate and its devastating impacts have unintended consequences on the local natural systems and people living in poor and marginal conditions. Thus, the lack of a leading edge of knowledge on the local vulnerability and exposures to climate change, the observed impacts, future climate risks, and the associated potential limits adaptation and management at the sub-national levels [
67,
68,
69].
2.3. Correlation Analysis of the Simulated Drought Indices
To compare how well the drought indices can assess the near real-time water dynamics and drought evolution in the present, we used two approaches. First, we snapped the simulated drought indices of the NDVI, VHI, VCI, and TCI to the same extent of the tested Chi River Basin. Every data layer contained different values of active pixels representing the tested basin. Within the GEE environment, we generated 300 random points across the Chi River Basin (
Figure 5) and marked them as the agriculture or non-agriculture for training points, based on the LandCover data [
70]. Areas with no clear determination were omitted from the correlation coefficient assessments. These points were further used to extract the pixel values of the drought indices stored in the GEE assets. For datasets in the database, a spatial query was executed to extract values of the groundwater level, reservoir water volume, and dam water volume. The values of the same point locations from different drought indices and database queried data were aggregated in a tabular format, providing simultaneous values of parameters, such as point number, date time, NDVI, VHI, etc. These data were aggregated to a 16-day time steps for each date stamp (n = 24) at the basin.
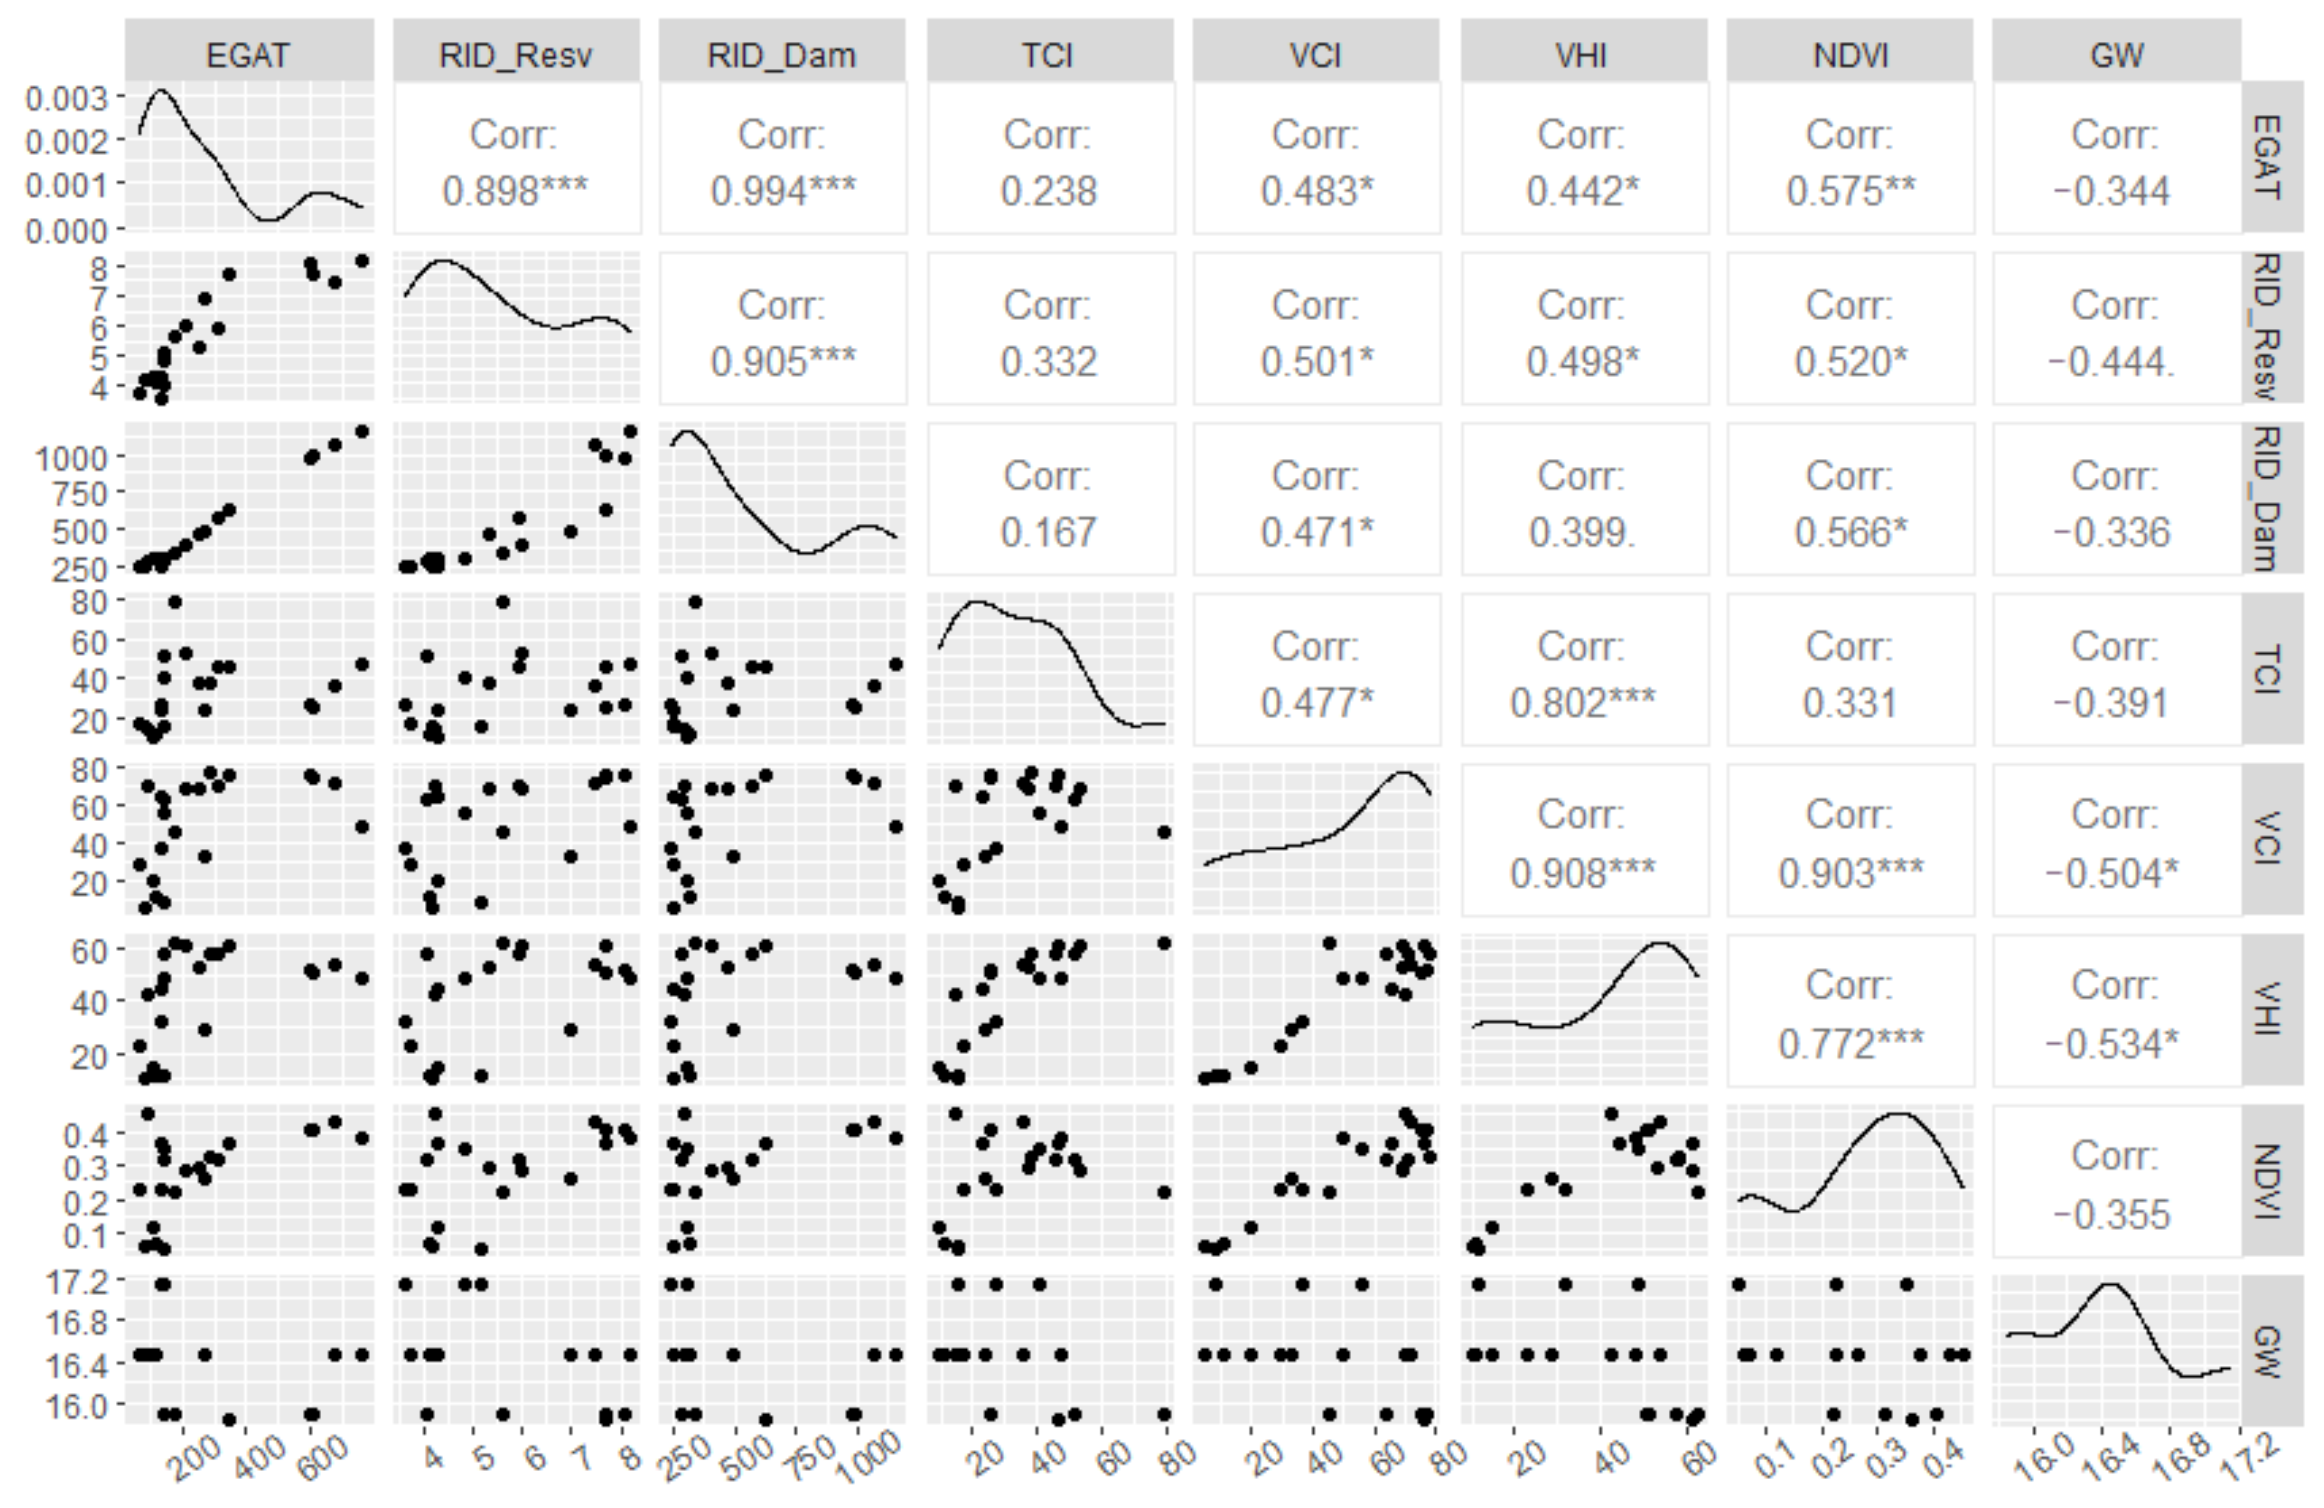
As the second approach, we used the ggpairs function of the GGally R Package (
https://cran.r-project.org/web/packages/GGally/index.html accessed on 10 January 2022) to evaluate the correlations between the groundwater level, reservoir water volume, and dam water volume data and the corresponding values of each index. A matrix of twenty-eight scatter plots was drawn and the Pearson correlation coefficients were calculated for visualizing the intercomparison between the eight variables at bi-weekly scale (16-days composite data) in the tested basin. Due to the first-year implementation of the WMS, we only sought to test whether vegetation greenness varied with groundwater level, reservoir water volume, and dam water volume from 1 January 2021 to 31 December 2021 across the Chi River Basin.
3. Results
As
Figure 6 shows, there was strong positive correlation between VHI with VCI (
r = 0.908), with TCI (
r = 0.802), and with NDVI (
r = 0.772) for 2021. This implies that VHI is considered a good indicator, as it provides better comprehension between the relative effects of temperature changes (TCI) and vegetation responses (VCI).
Figure 6 also demonstrates a positive correlation with a high statistical significance between the dam and reservoir water volume variations. The overall positive correlations were generally stronger between VHI and the changes of annual reservoir water volumes (RID_Resv;
r = 0.498) than EGAT dam water volumes (
r = 0.442) and RID_Dam water volumes (
r = 0.399). The spatiotemporal patterns were very similar to the correlation obtained with the VCI, which had higher positive significance with the changes of annual RID_Resv (
r = 0.501) than EGAT dam water volumes (
r = 0.483) and RID_Dam water volumes (0.471). Generally, NDVI showed a statistically significant positive relationship with the surface water volume datasets of EGAT (
r = 0.575), RID_Dam (
r = 0.566), and RID_Resv (
r = 0.520), accordingly. These demonstrate the advantage of using NDVI over the other drought indices, due to its capacity in identifying and exploring the variations and changes of surface water and vegetation.
In contrast to the surface water changes, groundwater level (GW) had a statistically significant negative correlation with NDVI (r = −0.355), TCI (r = −0.391), VCI (r = −0.504), and VHI (r = −0.534). This means that a further analysis with long time-series of in-situ data and hydrologically and meteorologically sensitive parameters could help in forging their intercomparison.
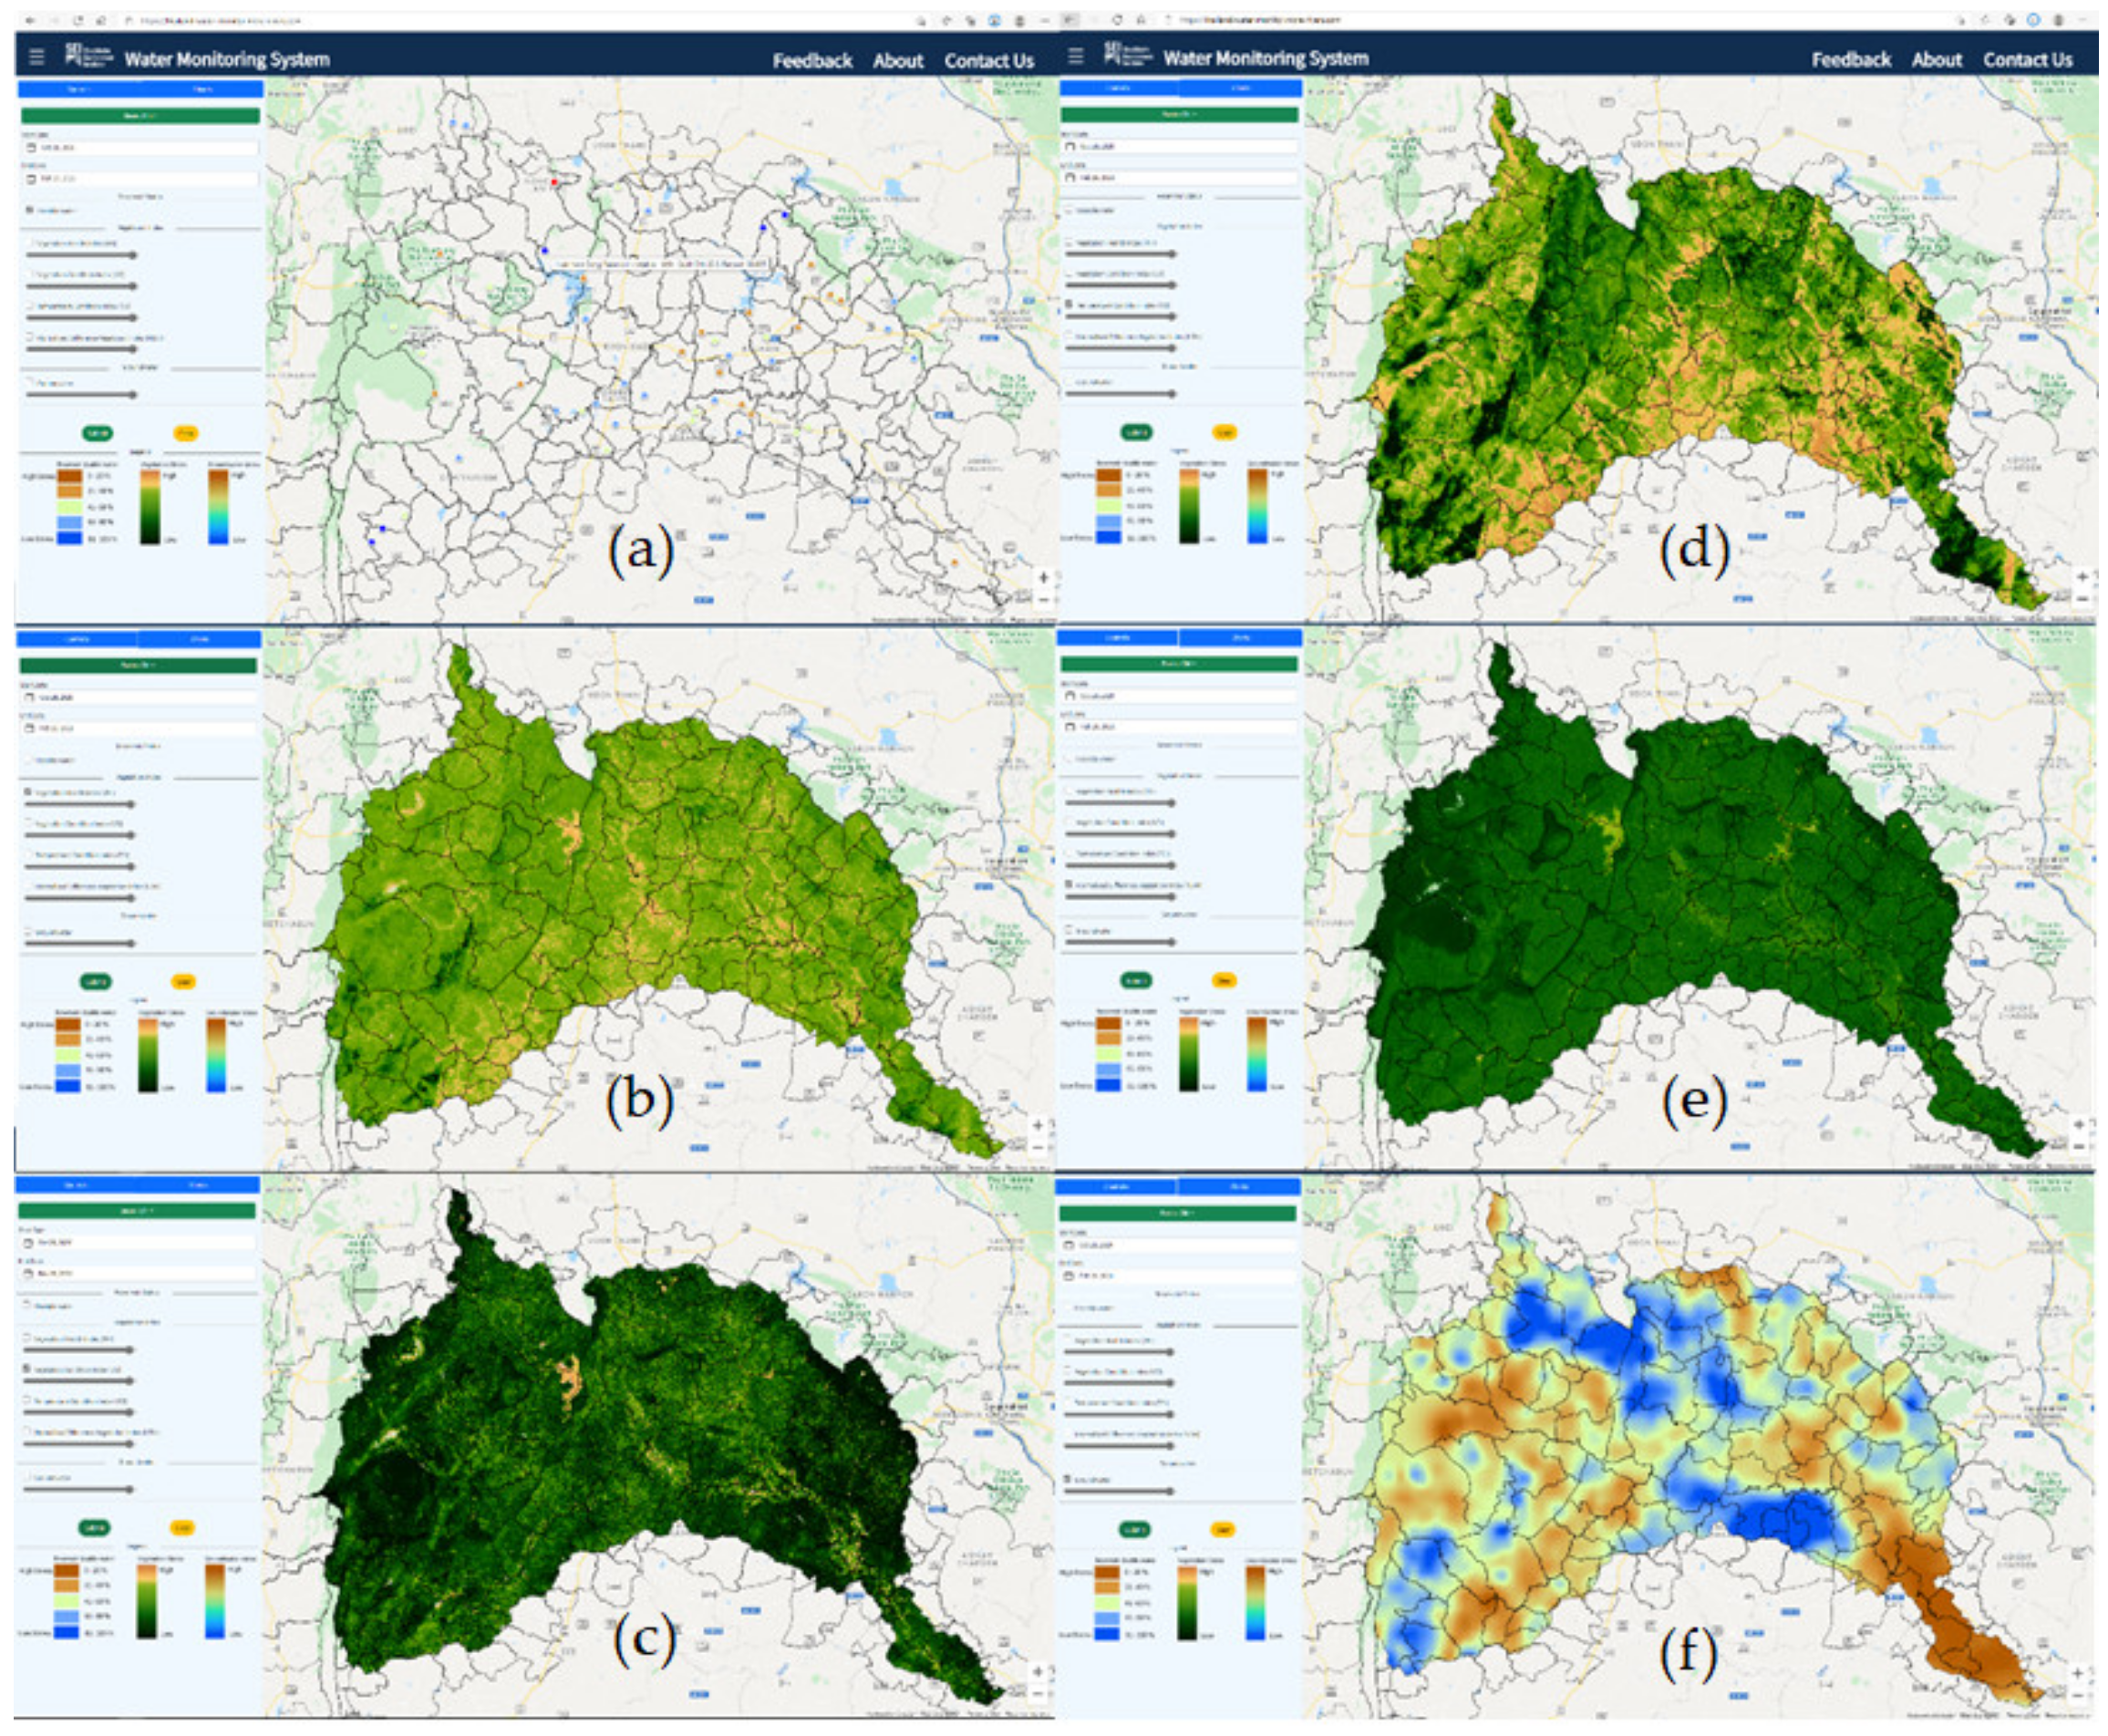
Figure 7 presents the WMS simulation results, showing the observational data (a) and the multi-temporal trend of the drought indices for the dry season in the Chi River Basin (b–f). To reduce the wait time for the WMS users to switch between datasets in real time to intercompare, datasets are preloaded, based on the user query. This usually takes 4 to 7 s, depending on the number of user requests and total number of active users on the application. The data points presented in (a) are the total number of reservoirs and dams sparsely located across the Chi River Basin and operated by the national departments in Thailand, named specifically the Electricity Generating Authority of Thailand (EGAT), the Royal Irrigation Departments (RID) and the international government agency the Mekong River Commission (MRC). Once these data points appear and upon hovering over a data point on the display map, it shows information on the station name, the usable water volume in million cubic meters (MCM), the storage capacity (MCM), and the percent (%) of usable water volume.
Across most of the Chi River Basin, drought is one of the major natural disasters affecting dimensional economies. The agriculture and its products of this basin play an important role for food security in the country, and this agricultural food production is highly affected by drought, which is associated with water deficits. It depends mostly on the arrival time and location of the Intertropical Convergence Zone (ITCZ). Overall, in (b–e), the results of the 4-month monitoring maps obtained from the 16-day composite data show that the basin was not suffering severe agricultural drought during the 2021 dry season when it was evaluated by scientifically accepted thresholds (scale from 0 to 1; of which >0.5 demonstrates no drought phenomena) [
71,
72].
The 2021 dry season observed a moderate agricultural drought period across the basin, where the bi-weekly VHI values were averaged over each of the total provinces in the Chi River Basin with a range between 0.32 and 0.43 (b). This responded to the varying color ramps of the data points at a specific location, for which red is the usable water surplus and brown is the water deficits. As (c) shows, the VCI did not show vegetation water stress in most regions, and only slightly below normal vegetation conditions (VCI ranged between 0.37 and 0.66) at the end of April 2021 were observed in the northwestern and southeastern Chi River Basin, mostly due to temperature stress (see also the TCI spatial distribution map in (d). Following the consideration, the largest TCI values during the 2021 dry season were calculated from the 16-day composite data of the 15 weeks. It was noticeable that the vegetation amount developed healthily during the dry season with more favorable weather (TCI valued between 0.59 and 0.80) for crop growth and successful farming. The main zones included vary favorable weather in the southwestern, north, and northeastern basin. Similarly, no disturbances were observed on the spatial distribution of the NDVI productivity, showing a good NDVI coverage range. In (e), the NDVI values ranged between 0.56 and 0.78.
These indices characterizing VCI (moisture), TCI (thermal), VHI (vegetation health) and NDVI (vegetation condition) demonstrated healthy vegetation, which was associated with favorable moisture and thermal conditions, corresponding with a study showing no 2020/21 drought in Thailand so far.
The interpolation map in (f) is displayed with a brown to blue color ramp map, which indicates deep to shallow groundwater areas. This result was obtained by using the complete sounding groundwater level data in the basin using IDW. It is visually evident that the spatial distribution of daily groundwater levels was located around the central parts of the Chi River Basin.
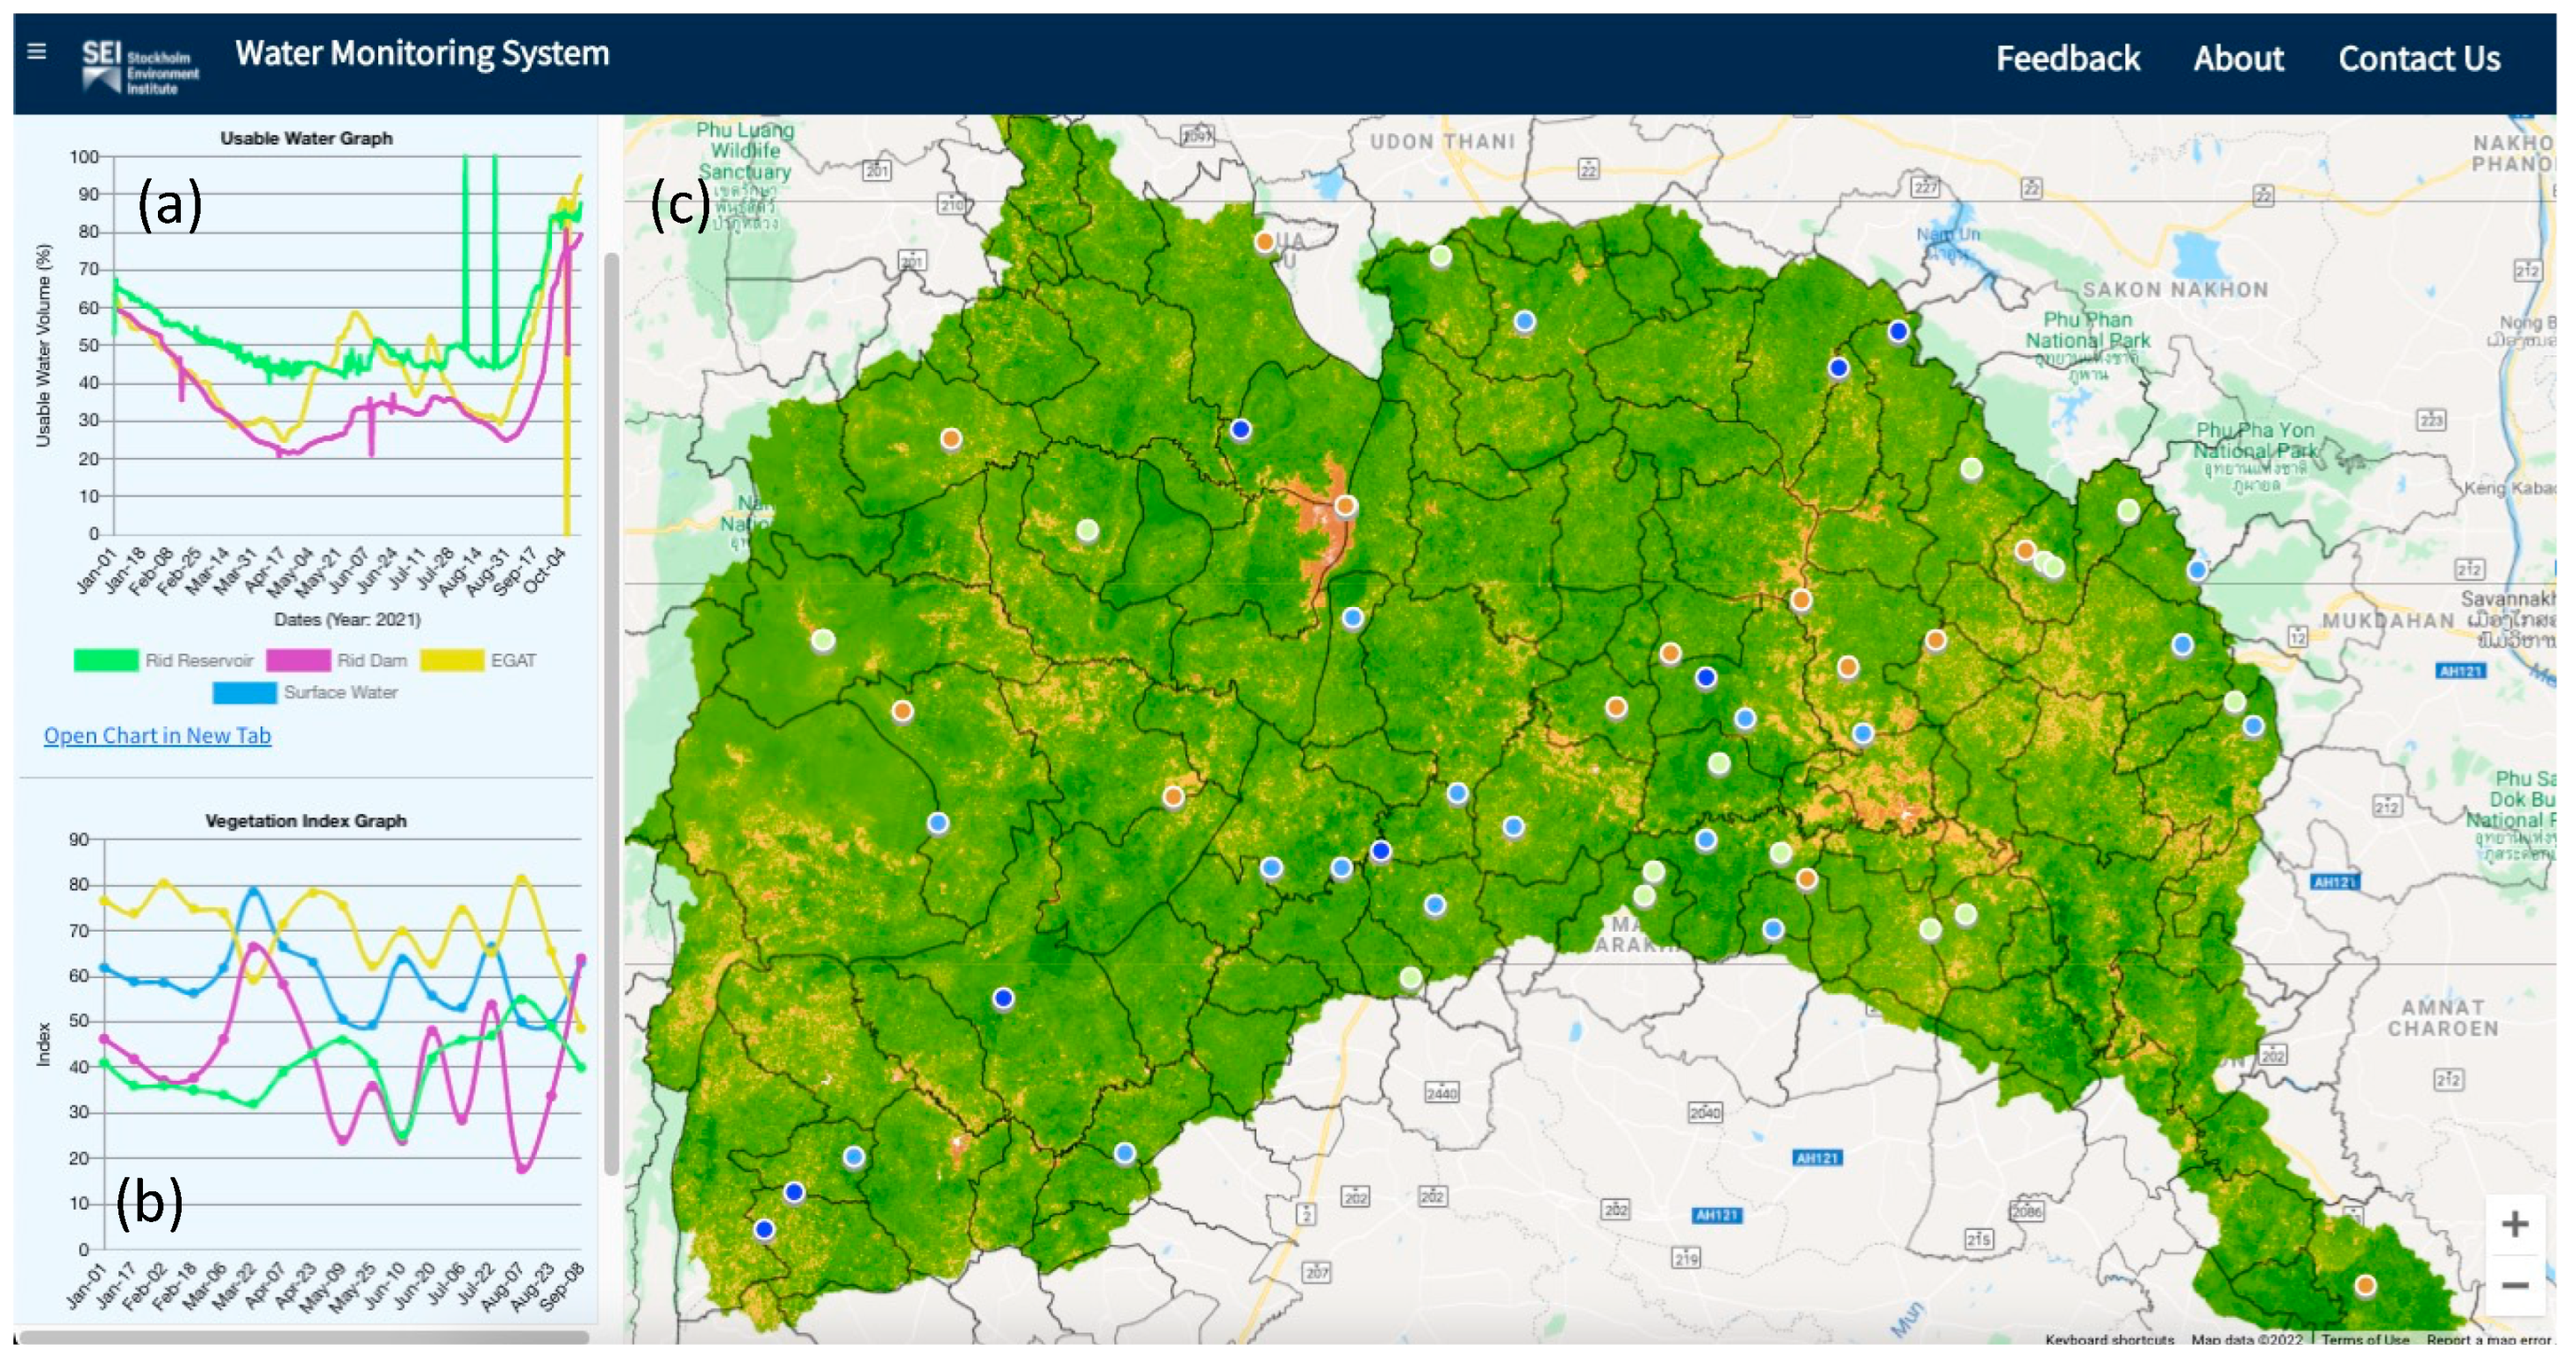
These results are also given in the form of time-series plots, as shown in
Figure 8. The Charts tab in the contents pane (a) controls the opening of the output window and takes users to multiple time-series plots of the open water areas and vegetation water stress estimates. The analytics in the graphical image make it easier for users to observe and gain a broad understanding of the statistics of the drought monitoring information and the multi-temporal trend of the surface waters in different point or pixel locations. However, it is worth nothing that the NDWI values obtained from the daily surface water data are only presented in the form of a time-series plot under the Usable Water plot (b), while ground water IDW interpolation, which is presented in maps, is yet included and displayed in the Vegetation Index plot (c).
4. Discussion
The WMS has marked the first attempt in the development of near real-time monitoring system that integrates multi-source observational data scraping, GEE cloud computing, remote sensing technology, and user intuitive feedback for the monitoring of water changes and drought evolution in the LMR. This development has also laid a solid foundation for integrating accelerating progress on the SDGs. The methodological approach is implemented in an automated processing chain, which makes the products available through a dynamic web-based interface. We have concluded that there is no relevant research on the combination of water and drought monitoring at a 10–30 m spatial resolution in the region and it is still very limited in most parts of the world [
36]. Moreover, the methodological approach for treating the establishing goals is believed to be the innovative aspect of the research, with potential scalability and operationality to other case studies. The promotion of this conceptualized methodology for an open-access high-resolution near real-time drought monitoring web-based platform is considered a merit of the current research and future development work.
4.1. Monitoring Information and Potential Limitations of Drought and Water Indices
The WMS has been developed for drought simulation and changes in open water area information and offered several remotely sensed agricultural drought indices (VHI, VCI, TCI, NDVI, and NDWI) at a 10–30 m spatial resolution in the data poor region of the LMR (
Figure 7). However, the current development of the study has not yet offered near real-time drought monitoring information using hydrological and meteorological drought indices. These could limit the capacity of drought simulation and incompletely characterize and monitor the spatial and temporal patterns of drought incidences in depth [
71]. Different indices for drought monitoring have their limitations. For instance, NDVI is very sensitive to the atmospheric scattering effects directly on the earth’s surface [
73]. NDWI has, thus, been suggested to use as a complementary index of open water area monitoring to in situ monitoring data and NDVI that can help improve the understanding of its useful and reduced limitations, giving better results and reducing the sensitivity of vegetation stress and open water area estimates [
73,
74,
75]. Several different simulated drought indices, hence, provide different index variations, varying with the temporal and spatial patterns and revealing better drought characteristics [
76,
77].
4.2. Practicality and Legality of Web Data Scraping
Here, the web data scraper program proved very useful for delivering big data and facilitating the automatic harvesting of a plethora of environmental data [
25,
42], i.e., river depths, groundwater levels, reservoir and dam waters, on a daily basis, publicly and constantly published on the internet. Although the web scraping stands out as a significant advantage over traditional copy and paste approach by leveraging multi-source data and reducing task duplication, one of the bottlenecks in applying this approach is that it is not always easy to keep track of website structure of the national or international official sources. Each website has a particular structure, which may be subject to changes, i.e., graphical user interface (GUI), anytime, and that directly affected the scraping process of the program. Consequently, the back end of the WMS often requires few lines of code for tackling such changes and is periodically updated. This issue would be solved if there was a collaborative agreement for data or service sharing with the national and or international official sources to grant direct access to their database via HTTPs or FTP [
78]. Controversially, the web data scraping approach remains a topic of debate and is strictly restricted in some parts of the world, despite environmental data being publicly provided on the internet. It is, therefore, essential to check for licensing or copyright restrictions on the extracted data and to share the custom-made scraper code with the scientific community. We, therefore, will publish the codes in Github so that others can discover, study, and build on what we have done. This was one of the establishing goals for the scalability of the WMS development in other regions.
4.3. Output Validation
The correlation matrices revealed that dam and reservoir water volumes were positively correlated with the drought indices, but the overall TCI correlation values did not give a strong indication of the changes of surface water volumes and groundwater levels. This indicates the overall accuracy and validity of the WMS performance in multiple ways. First, the observational data we web-scraped from the national and international official sources can guide the appropriate remote sensing indices to best represent current and past events. Second, spatiotemporal distribution mapping services help the monitoring from point-based to region-based. Third, long-term series of hydrological and meteorological data can enrich the short time-series of remotely sensed data through simulation [
79,
80]. In our assessment, the WMS supplements existing knowledge of drought coherence in the LMR by assessing and providing quantitatively spatiotemporal variations (10–30 m) of local surface water changes and local drought evolution. Moreover, the WMS also highlights that the gridded drought datasets can be a reasonable alternative to observational station data for surface water change and drought assessments where observed data is not readily available.
There was a negative correlation between the different drought indices, NDVI, TCI, VCI, VHI, and groundwater levels. This suggests that further investigation and more detailed analyses of the influence of different drought types on groundwater condition should consider other in-situ factors, such as precipitation, soil moisture, wind speed, temperature, clouds, vegetation coverage, and other weather variables. The particular attention should be paid to the physical properties of land cover in the adjacent areas of the groundwater wells, the hydraulic properties of aquifers, and human interventions. Comprehensive data and information on various parameters of the groundwater drought are needed for operational decision-making and planning, policy development, and infrastructure design at national and basin levels [
21].
4.4. Limitations of Optical Remote Sensing Imageries
In the case application, there were gaps in the spatiotemporal information appearing in some parts of the Chi River Basin, due to a cloud contamination issue. This is especially a known issue for optical remote sensing imageries, such as Landsat 8 and Sentinel 2. Specifically, these imageries are subject to data loss due to cloud coverage hindering the retrieval of spatiotemporal information when using them from the visible to infrared optical spectrum [
80,
81,
82,
83]. It is, therefore, necessary to detect and remove clouds while pre-processing of the imageries to avoid inclusion of cloud-contaminated composite pixels into image processing [
84]. Strong seasonal changes of rainfall and atmospheric patterns is a dominant feature of the intertropical convergence zone (ITCZ) in the LMR and leads to the formation of different cloud patterns throughout the year [
85,
86]. This, consequently, has a high determining impact in the region to acquire cloud-free imageries. Hence, it is essential to remove cloudy pixels from the imageries to have a reasonably consistent coverage over a location, preserving a non-cloudy patch of image while there is loss of data in the other areas. This is particularly exemplified in the monsoon months (June–November) when entire scenes are covered by clouds, rendering images useless for the generation of remote sensing indices and causing a gap in the analysis. It is a caveat that must considered when building an operational system. There have been few effective approaches of reducing the cloud issue when using Landsat-Sentinel 2 fusion or Optical-SAR fusion imageries, which have different overpass time-dates and, thus, can increase the number of cloud-free pixels [
86,
87,
88].
4.5. User Interface and Future Work
At the moment, actual processing and visualization of vegetation water stress simulation within the developed WMS is assembled in a very simple and a user-friendly interface (i.e., sliders, study basin, vegetation index, etc.; see
Figure 3). WMS allows user feedbacks on interface inputs and the core functions for creating drought and water monitoring information that allow the participation of users (mainly focusing on water managers and decision-makers), so they can evaluate the system performance and provide feedback from their direct experience. This is, thus, the beta version WMS, which is a fully functional system and will evolve into a fully designed graphical user interface in the future version.
4.6. Utilization and Maintenance of the WMS
There is a continuous endeavor to create a resourceful WMS, with the goal of enhancing local vegetation water stress monitoring and generating timely and accurate drought information and characteristics of water dynamics. This development is highly scalable and provides tools, databases, and networking services that give government agencies an unprecedented opportunity to harness useful, real-time information about water and drought simulation. However, the government often lack the dedicated expertise and resources to collect, analyze, and create scientific information or products that can inform decision-making processes and assist multi-level policymakers to navigate the potential risks associated with water changes and drought evolution. Thus, the products are available to different interest groups for visualization and exploration [
21,
31]. The practical solution would be engaging the government with a team of developers in the development process. To utilize WMS and interpret its output, user requires a good knowledge about the variables in different drought algorithms, for instance, the correlation of vegetation and temperature dynamics during the annual cycle (NDVI) and the contributing factors of temperature and soil saturation affecting vegetation health (VCI and TCI) [
16,
48,
56,
75,
76], that will help gain a more thorough understanding of the bio-physical processes and their relationships, causing potential impacts of vegetation water stress.
4.7. Supporting Water Management Decisions and the SDGs
The WMS of this paper validated the usefulness of multi-source data and advanced digital technology for monitoring water dynamics and assessing vegetation water stress at the local scale. The WMS currently provides more readily and simplified drought simulation information about the complex and slow evolution of drought phenomena at a 10–30 m spatial resolution. The WMS can be used in a participatory process in order to improve effective communication and transparency with end-user decision makers, water managers, and the general public. The simulation information of the WMS can be taken as a primary analysis of drought and water level changes. Further, it can be used to quantify potential changes and their cascading impacts in agricultural production, irrigation, and water resources management. This level of information provides changes in scale and, over time, guides ways of dealing with an alarming situation, such as drought, flood, irrigation scheduling, land use planning, and crop management. This is considered to be an innovative methodological framework that enables it to fully explore the feedback of human decisions on the environmental dynamics and vice versa. The drought simulation information can be used to establish benchmarks or trigger points as a quantitative basis for making critical decisions, to design disaster risk reduction policies, and to monitor the effectiveness of the policies. It will also be important to have an indicator for preparedness and recovery time fitted in to the local environments. Given these demonstrations, they can enhance the methodological and developmental framework to support evidence-based policy making towards achieving the SDGs, formalizing coordinated multi-source observational data and digital technologies (remote sensing, GEE cloud computing, and user interface) for supporting national and local governments to improve the quality of their decision-making, and assisting the governments to increase efficiency and effectiveness in drought and water resource management.
5. Conclusions
This paper shows that we have begun the development of the high-resolution drought monitoring system to provide evidence-based information to support decision-makers at the local scales (10–30 m). The WMS outputs can help establish or prepare proactive measures for water, agriculture, and drought management strategies on a near real-time basis. Using the developed WMS, local drought evolution and changes of small-scale river basins (<10,000 km2) can be practically assessed within 2 weeks. The results obtained from the WMS drought indices are useful for the primary analysis and can be further used to study different drought types and monitor the effects of droughts on vegetation growth (NDVI), vegetation moisture condition (VCI), land surface temperature (TCI), and vegetation health (VHI). This is a vital step for local food security, land and water management, and beyond. We anticipate that the beta version of the current WMS development will bring more progress in the application of high-resolution operational and research communities.
We will continue to enhance the performance of water monitoring and drought hazards at the high spatial resolution, improve graphical visualization in the front-end interface, increase functionalities in the back- and front-end systems, and better assess spatial and temporal drought monitoring index variations. This newly developed WMS is geared toward the early warning of water and agricultural development and progress on the SDGs. Utilization of digital innovation and capacity development will be aggressively pursued with target users in the tested basin. The WMS will also widen the abilities of decision-makers to monitor and foresee extreme weather events earlier and with high spatial accuracy.
The new high-resolution capacity of the WMS enables us to help with precision water and agriculture and the ability to move from the problem of detection to the mitigation of negative consequences due to water and drought anomalies. Continuously advancing digital technologies (GEE, remote sensing, and data sciences) will strengthen the ability to estimate the potential effectiveness of applied technology to optimize adverse impacts in a more proactive way.


 ,
, 


