
Analysis of Environmental Factors on Intersection Accidents


1
Department of Transportation and Logistics, Feng Chia University, Taichung 40724, Taiwan
2
Department of Information Management, National Taichung University of Science and Technology, Taichung 40401, Taiwan
3
Ph.D. Program College of Construction, Feng Chia University, Taichung 40724, Taiwan
*
Author to whom correspondence should be addressed.
Sustainability 2022, 14(3), 1764; https://0-doi-org.brum.beds.ac.uk/10.3390/su14031764
Submission received: 8 December 2021
/
Revised: 25 January 2022
/
Accepted: 27 January 2022
/
Published: 3 February 2022
(This article belongs to the Special Issue Sustainable Public Transportation and Accident Prevention)
Abstract
:In recent years, the number of fatal traffic accidents has been on the rise in Taiwan, with a total of 2865 fatalities in 2019, representing a 3% increase from the previous year, and indicating an urgent need for the improvement of Taiwan’s traffic conditions. This research focuses on the three-way intersections on provincial roads. In Taiwan, such three-way intersections account for more than 70% of all intersections on provincial roads. From 2018 to 2019, there were 41,137 accidents at three-way intersections, accounting for about 50% of the traffic accidents in Taiwan. Relevant research in Taiwan has been mostly focused on driver characteristics and other factors were less addressed. In this study, we looked into the environmental factors, conducted analysis and the results were proposed for future roadway safety improvements. This study uses a regression model for analysis, in which the dependent variable is the number of traffic accidents at each intersection. However, for 68% of the three-way intersections surveyed, the number of traffic accidents recorded during the observation period was zero. Therefore, this study uses zero-inflated models to construct a model to identify important variables that affect the severity of traffic accidents at three-way intersections. The research results show that two types of factors are related to the risk of traffic accidents at three-way intersections. The first type includes the width of the provincial road, the width of the shoulder, the width of the dividing line and the number of lanes, while the second type relates to the presence of convenience stores, gas stations, supermarkets, and other attractions, such as public retail markets at the intersection.
1. Introduction
Accident data analysis has long been used as a reference basis for road and vehicle design and the formulation of safety policy. Many accident-related issues have been discussed in the international community, such as the identification of accident-prone locations and analysis of accident factors. However, the frequency of traffic accidents has continued to rise, requiring continued scrutiny of traffic safety-related issues.
Previous research on traffic accident factors in Taiwan has focused on the impact of driver characteristics on accidents. However, in addition to driver characteristics, accidents are caused by additional factors, including vehicle, road conditions and environmental conditions. Therefore, improvement strategies that also incorporate an understanding of road and environmental factors will be more effective in reducing the risk of traffic accidents. This research analyzes accident data to identify key road and environmental factors that affect the frequency of traffic accidents as the basis for developing strategies to improve traffic safety.
Previous studies of accident frequency mostly used the Poisson regression model (Ma, 2009 [1]; Ye et al., 2013 [2]), duration mode (Chung, 2010 [3]; Jovanovic et al., 2011 [4]), multivariate models (Castro et al., 2012 [5]; Caliendo et al., 2013 [6]), neural networks (Abdelwahab, 2001 [7]), Bayesian neural networks (Xie et al., 2007 [8]), and vector machine models (Yu and Abdel-Aty, 2013 [9]). Analysis of accident severity relied on logit and probit models (Moudon et al., 2011 [10]; Santolino et al., 2012 [11]), ordered logit and probit models (Mergia et al., 2013 [12]; Ye, 2014 [13]); and artificial neural networks (Delen et al., 2006 [14]; Chimba, 2009 [15]).
This study considers the random and scarce data characteristics of traffic accidents, based on a review of the relevant literature (Miaou, 1994 [16]; Qin et al., 2004 [17]; Lord et al., 2007 [18]; Malyshkina and Mannering, 2010 [19]). When too many data points are recorded as zero (i.e., Y-type intersections with zero accidents), one can use the zero-inflated model to analyze and incorporate the characteristics of the probability distribution between Poisson and the negative binomial, and then construct zero-inflated Poisson (ZIP) and zero-inflated negative binomial models (ZINB). Model analysis can identify road condition and environmental factors that affect the incidence of traffic accidents to propose corresponding improvement suggestions.
2. Background and Literature Review
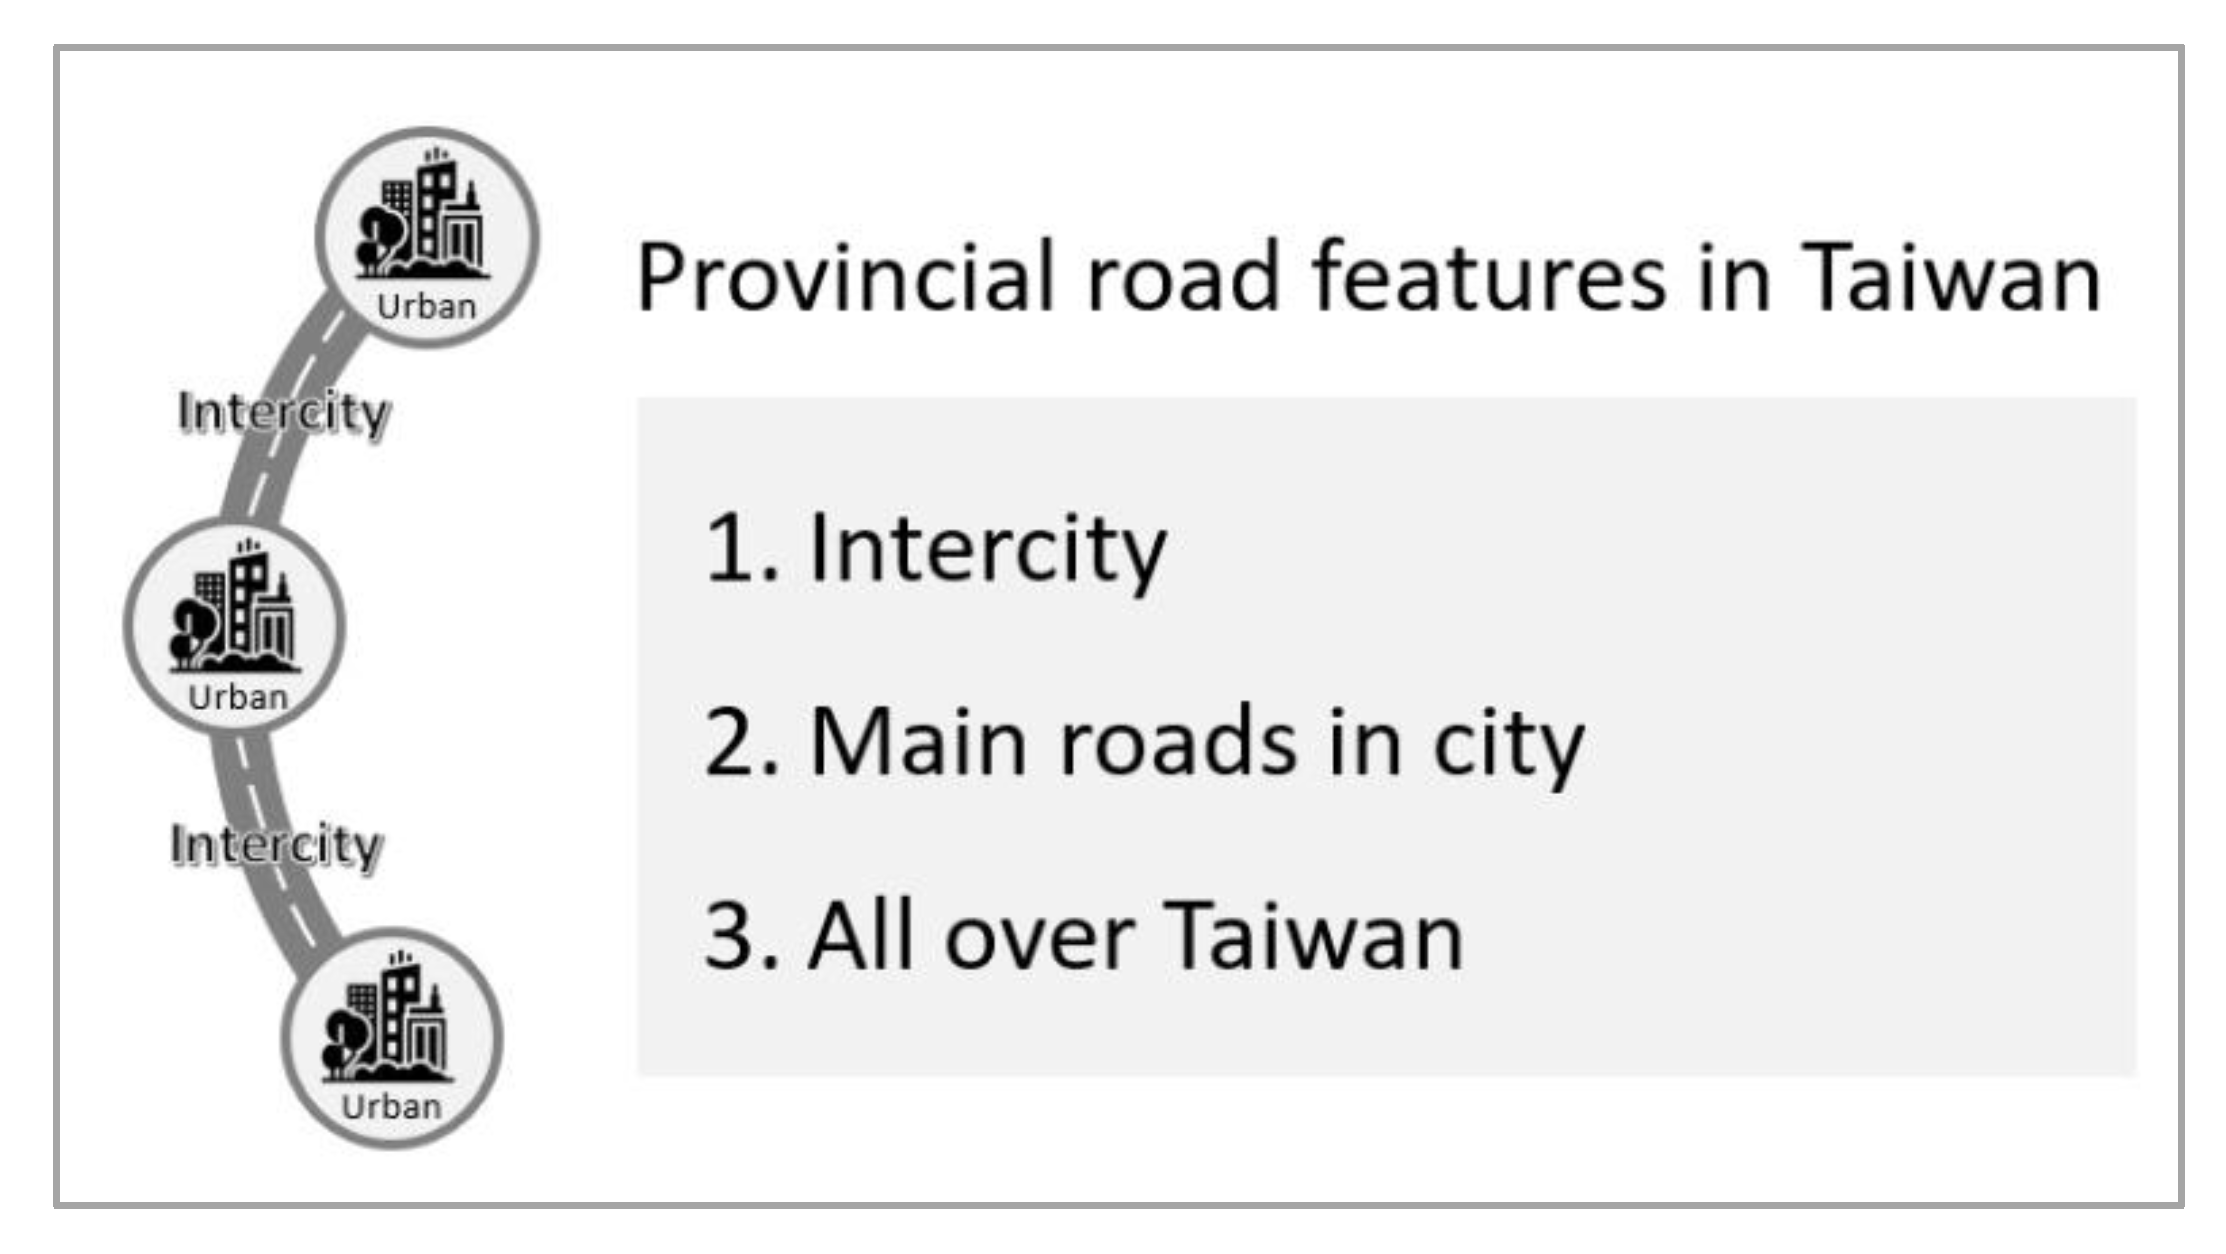
2.1. Research Scope and Objectives
Provincial roads are the subject of study and they constitute the backbone of the road network in Taiwan. Some of them are intercity roadways, some are urban corridors and some are rural roads, as shown in Figure 1.
The data from the National Land Surveying and Mapping Center in Taiwan indicates the following: there are 29,208 intersections in provincial roads in Taiwan and 70% of them are three-way intersections. About 50% of traffic accidents happened in these three-way intersections, from 2018 to 2019, and this is the motivation of this study.
The number of yearly traffic accidents for these three-way intersections in 2018 and 2019 are listed in Table 1. Most of them have a value of zero, meaning no traffic accident happened on them in 2018 or 2019.
2.2. Variables of Accident-Prone Location
This section summarizes the important influencing variables used in the previous literature and individually explains each one, with respect to factors related to road conditions and the environment, seen below:
- Traffic:
- Speed limit: the higher the speed limit, the faster the velocity of steady traffic, which increases accident severity. Research has shown that the road speed limit is related to accident frequency. The higher the speed limit, the higher the frequency of accidents (Xuesong Wang, 2006 [22]; Abhishek Das, 2011 [21]).
- Traffic flow: most studies invest in the analysis of traffic volume (ADT or AADT) factors and find that it is correlated with the severity of accidents and the frequency of accidents. The greater the traffic flow, the higher the frequency and severity of accidents (Greibe, P, 2003 [20]; Xuesong Wang, 2006 [22]; John C. Milton, 2008 [24]; Abhishek Das, 2011 [21]; Sandra Vieira Gomes, 2012 [25]; Chunjiao Dong, 2014 [26]; Cantillo, 2015 [27]).
- Geographic:
- Schools: relevant research results show that accident-prone areas in metropolitan areas typically depend on the surrounding environment and land use. For example, accidents often occur near schools (Anderson, 2009 [23]).
3. Methodology
Many previous studies on the causes of traffic accidents have used analysis methods such as regression analysis, multivariate analysis, and neuroanalysis. However, if too many data points in the data sample are recorded as zero it will cause greater variation in the count data, along with over-dispersion in the zero-inflated model.
Shankar et al. [28] empirically explored the applicability of the zero-inflation model for road section accident frequency analysis. Although some data showed zero values, these data still have the potential to reflect accident risk. The Poisson regression and negative binomial analysis models cannot be used for observation, so their research attempted analysis using the zero-inflated model. The research results found that the distribution of zero-inflated Poisson (ZIP) and zero-inflated negative binomial (ZINB) are in line with reality. The accident pattern is suitable for exploring the causal relationship between related variables and the possible accident risk of data points recording zero accidents.
Based on the above, this study adopts two research methods (ZIP and ZINB) to construct the following analysis model.
3.1. Zero-Inflated Poisson, (ZIP)
The zero-inflated Poisson regression model contains two regressions, the logistic regression (LR) and the Poisson regression (PR). The logistic regression explains whether the sample’s characteristics will affect the probability of the sample becoming a “zero” value, as follows:
where is the logit function of the data sample, and is the probability that this data sample is zero.
The logit function is calculated as follows:
where is model intercept obtained by the Logit regression, is the logistic regression coefficient obtained by the correction of the nth characteristic variable, and is the nth characteristic variable of the ith data sample. This study collected the surrounding environment and traffic information for three-way intersections on provincial roads in 2018 and 2019, as seen in Table 2.
The Poisson regression interprets the probability of accidents caused by the characteristics of the data sample. The calculated expected value is combined with the probability of occurrence of “zero” given by the Logit regression, to obtain the overall ZIP result, as follows:
Assuming accident occurrences Y = (, , …, ) are mutually independent, the Poisson probability density function is Equation (3).
The probability density function of the ZIP overall mode, below, is:
where is the expected value obtained from the Poisson regression, and in this study is the accident occurrence in the data sample Y = (, , , …, .
3.2. Zero-Inflated Negative Binomial (ZINB)
If the data suffers from over-dispersion, the above-mentioned ZIP regression model is changed to the ZINB regression model, that is, the original Poisson model distribution is changed to a negative binomial distribution, and the probability density function as Equation (5), shown below:
where is the observed value; is the matrix of related factors that affect the probability of the overall event, and is the probability value that reflects the special zero value generation mechanism.
4. Empirical Study
4.1. Data Description
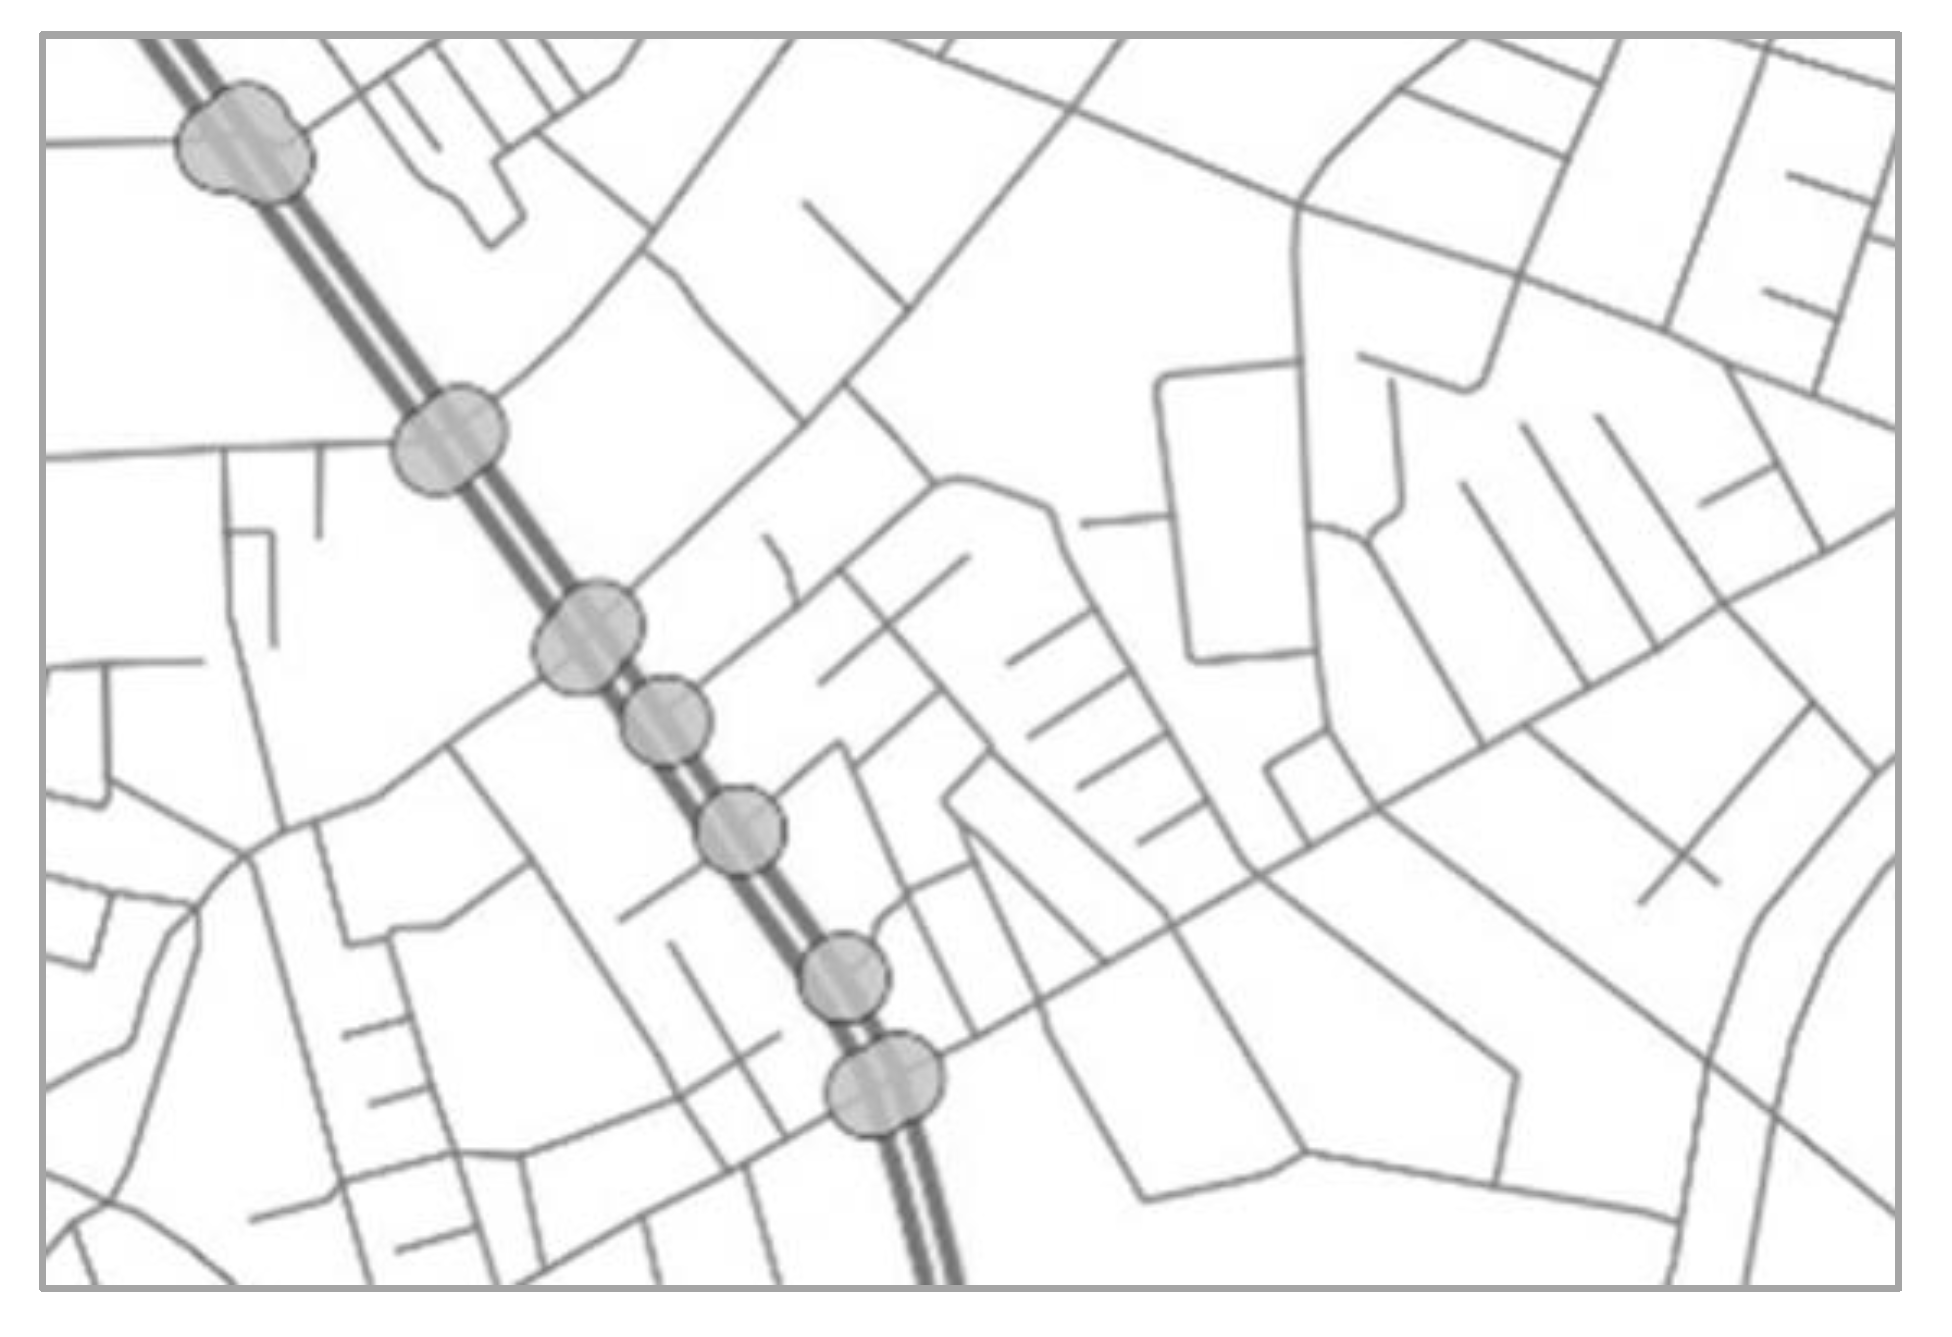
This study collected data on accidents causing death and injury in Taiwan in 2018 and 2019, using Geographic Information Systems to conduct spatial analysis of such accidents at three-way intersections on Taiwan’s provincial roads, as shown in Figure 2.
4.1.1. Response Variable in Model
Accounting for road conditions and variables related to the surrounding environment for each intersection, the number of accidents at each intersection is calculated separately for 2018 and 2019, with a dataset consisting of a total of 39,160 records.
4.1.2. Independent Variables in Model
This study uses GIS to identify traffic information for three-way intersections on provincial roads in 2018 and 2019, using the characteristics of the surrounding environment as independent variables, like those summarized in Table 2.
The data of environmental factors and traffic are from MOI Open Data. Traffic Flow is AADT (Annual Average Daily Traffic) and the values are taken the natural logarithm.
4.2. Analytic Model
This study used a regression analysis model to explore the factors affecting accident incidence. The accident data is statistical data with non-negative integer values; thus, data analysis was performed using the Poisson regression and negative binomial regression. However, an excessive number of data points have a value of zero, which may lead to poor adaptation of ZIP and ZINB. Therefore, the Poisson and negative binomial regressions are combined with the zero-inflated model, to produce ZIP and ZINB, to identify significant influencing factors that affect the incidence of accidents at three-way intersections on provincial roads.
The results of the ZIP model (Table 3) and the ZINB model (Table 4) show that the set of variables that significantly affect death- and injury-causing accidents at three-way intersections are largely the same, and the coefficient directions are also the same. The first part of the model accounts for no fatalities or injuries within the intersection area (Logit model), outlined below:
- Most of the significant variables are the same for both models, and they all show negative effects, indicating that there are environmental features for intersections that can be altered to reduce the probability of death or injury.
- The presence of facilities in which people congregate together (e.g., schools) and commercial developments (e.g., shopping malls, convenience stores), significantly increases the risk of accidents resulting in fatalities and injuries.
The second part of the model accounts for the number of casualties at an intersection (Poisson or Negative binomial model), described below:
- Most of the significant variables for the two models are the same and both show positive effects, indicating there are certain characteristics of intersections that increase the number of accident-related fatalities and injuries.
- Most of the significant variables have positive effects and are related to commercial development or the gathering of crowds, such as schools, hospitals, department stores, convenience stores, etc.
- Variables related to the presence of vehicle entrances and exits (e.g., gas stations and parking lots) increase disruption to traffic flows and thus have a significant impact on the number of accidents.
- There is an absolute positive relationship between traffic volume and the number of accidents, related to the concept of traffic exposure. Therefore, the greater the traffic volume at an intersection, the higher the risk of accidents. In the two regression models, the coefficient values of the traffic flow variables are larger than other variables, so traffic flow is clearly sensitive to accident severity.
- In addition, the greater the road width, the higher the accident risk, possibly because wider roads correlate with higher vehicle speeds, while allowing different vehicle types (e.g., trucks and buses) to operate in the same driving space, and traffic flow at intersections is also more complicated, leading to a higher accident risk.
4.3. Model Evaluation
The following is based on the proposed zero-inflated Poisson and zero-inflated negative binomial models. Different index values are used to judge and compare the suitability of each model, including the log-likelihood, AIC (Akaike information criterion) and BIC (Bayesian information criterion) of each model. Smaller AIC and BIC index values mean that the selected model fits the original data well (Lord and Mannering, 2010 [29]). The results are shown in Table 5. The AIC and BIC values of the zero-inflated negative binomial model are smaller than those of the zero-inflated Poisson model and, thus, fit better. Most accident data feature discrete problems and the Poisson regression model generally has limitations for making assumptions in the data analysis. Due to these limitations, the negative binomial model has gradually become more widely used because it can handle over-dispersed data, where the average value is much greater than the variance. The negative binomial distribution of the zero-inflated negative binomial model is a better fit for the data analyzed in this research.
4.4. Discussion
This research conducted analysis using zero-inflated Poisson (ZIP) and zero-inflated negative binomial (ZINB) and found important variables that affect the incidence of intersection accidents, to facilitate subsequent research on intersection safety improvement strategies. According to the comparison results of different models, the negative binomial distribution is better suited to the data, and the zero-expansion negative binomial model is a better fit than the zero-expansion Poisson.
Traffic flow is a key influencing variable, and the incidence of accidents at three-way intersections increase with traffic volume. However, in terms of actual strategy implementation, traffic volume cannot be directly reduced, leaving only time or spatial diversion measures, or reducing the number of intersection conflict points to reduce the incidence of accidents.
Accident frequency is positively correlated to the presence of commercial districts or places where people gather, such as schools, hospitals, shopping malls, department stores, and convenience stores, where cars stop to drop off or pick up passengers, along with pedestrian traffic volume that can easily increase traffic merging and other points of conflict. In addition to enhancing the enforcement and prohibition of moving violations, it is also important to increase the protections for crossing pedestrians and to enhance measures to prevent speeding and reckless passing.
Analysis results show that parking lots and gas stations are both important variables for accident risk. When building new parking lots or gas stations, attention should be taken to ensure entrances and exits are located away from intersections. At the same time, improved signage, potentially using lights or sound alerts, should warn through-drivers of potential merging vehicles to prevent accidents. In addition, in terms of strategy, strong law enforcement is needed to prevent vehicles exiting gas stations or parking lots from failing to merge properly, thus reducing the accident risk.
The findings show that wider lane widths increase accident risk. Narrower driving lanes would limit maneuverable space for cars, prompting drivers to reduce speed and, therefore, reduce accident risk.
5. Concluding Remarks
The results of this research correspond well with prior findings, such as the significance and directionality of significant variables, comparing the results with related studies in other countries. The present findings can serve as a useful reference to improve intersection design and safety. Recommendations include reducing vehicle speed and applying traffic management methods to segregate vehicles in time and space; thus, reducing accident risk.
Furthermore, points of interest, such as schools and commercial areas near an intersection, usually lead to a higher risk of traffic accident incidence. In order to lower the risk and improve safety, the location of future POI, the speed limit of intersections with POI nearby, etc., should be taken into consideration. The effectiveness of safety measures can be analyzed in future studies based on the findings of this study.
Follow-up research could consider the incorporation of artificial intelligence research methods, such as ANN, CART, etc., to analyze factors contributing to traffic accidents, raising the possibility of predicting accidents at intersections. In addition, the current research focuses exclusively on three-way intersections, but future research could consider four- or more way intersections.
Author Contributions
Conceptualization, D.-J.L. and H.-H.L.; methodology, D.-J.L., J.-R.Y. and H.-S.C.; software, J.-R.Y. and H.-S.C.; validation, D.-J.L., J.-R.Y. and H.-S.C.; formal analysis, J.-R.Y. and H.-S.C.; investigation, D.-J.L. and H.-H.L.; resources, D.-J.L. and H.-H.L.; data curation, D.-J.L., J.-R.Y. and H.-H.L.; writing—original draft preparation, D.-J.L., J.-R.Y. and H.-H.L.; writing—review and editing, D.-J.L., J.-R.Y., H.-H.L., H.-S.C. and L.-Y.W.; visualization, H.-S.C. and L.-Y.W.; supervision, D.-J.L., H.-H.L. and H.-S.C.; project administration, D.-J.L. All authors have read and agreed to the published version of the manuscript.
Funding
This research received no external funding.
Institutional Review Board Statement
Not applicable.
Informed Consent Statement
Not applicable.
Data Availability Statement
The main data used is the annual traffic incident fatality and injury statistics provided by National Police Agency, Ministry of the Interior, Taiwan and supplemented by accident scene map if necessary. The complete dataset may not be shared.
Conflicts of Interest
The authors declare no conflict of interest.
References
- Ma, J. Bayesian analysis of underreporting Poisson regression model with an application to traffic crashes on two-lane highways. In Proceedings of the 88th Annual Meeting of the Transportation Research Board, Washington, DC, USA, 11–15 January 2009. [Google Scholar]
- Ye, X.; Pendyala, R.M.; Shankar, V.; Konduri, K.C. A simultaneous equations model of crash frequency by severity level for freeway sections. Accid. Anal. Prev. 2013, 57, 140–149. [Google Scholar] [CrossRef] [PubMed]
- Chung, Y. Development of an accident duration prediction mode lonthe Korean Freeway Systems. Accid. Anal. Prev. 2010, 42, 282–289. [Google Scholar] [CrossRef] [PubMed]
- Jovanović, D.; Bačkalić, T.; Bašić, S. The application of reliability models in traffic accident frequency analysis. Saf. Sci. 2011, 49, 1246–1251. [Google Scholar] [CrossRef]
- Castro, M.; Paleti, R.; Bhat, C.R. A latent variable representation of count data models to accommodate spatial and temporal dependence: Application to predicting crash frequency at intersections. Transp. Res. Part B Methodol. 2012, 46, 253–272. [Google Scholar] [CrossRef] [Green Version]
- Caliendo, C.; de Guglielmo, M.L.; Guida, M. A crash-prediction model for road tunnels. Accid. Anal. Prev. 2013, 55, 107–115. [Google Scholar] [CrossRef]
- Abdelwahab, H.T.; Abdel-Aty, M.A. Development of Artificial Neural Network Models to Predict Driver Injury Severity in Traffic Accidents at Signalized Intersections. Transp. Res. Rec. J. Transp. Res. Board 2001, 1746, 6–13. [Google Scholar] [CrossRef]
- Xie, Y.; Lord, D.; Zhang, Y. Predicting motor vehicle collisions using Bayesian neuralnet works: An empirical analysis. Accid. Anal. Prev. 2007, 39, 922–933. [Google Scholar] [CrossRef]
- Yu, R.; Abdel-Aty, M. Utilizing support vector machine in real-time crash evaluation. Accid. Anal. Prev. 2013, 51, 252–259. [Google Scholar] [CrossRef]
- Moudon, A.; Lin, L.; Jiao, J.; Hurvitz, P.; Reeves, P. The risk of pedestrian injury and fatality in collisions with mo-torvehicles, a social ecological study of state routes and city streets in King County, Washington. Accid. Anal. Prev. 2011, 43, 11–24. [Google Scholar] [CrossRef]
- Santolino, M.; Bolancé, C.; Alcañiz, M. Factors affecting hospital admission and recovery stay duration of in-patient motor victims in Spain. Accid. Anal. Prev. 2012, 49, 512–519. [Google Scholar] [CrossRef] [Green Version]
- Mergia, W.Y.; Eustace, D.; Chimba, D.; Qumsiyeh, M. Exploring factors contributing to injury severity at freeway merging and diverging locations in Ohio. Accid. Anal. Prev. 2013, 55, 202–210. [Google Scholar] [CrossRef]
- Ye, F.; Lord, D. Comparing three commonly used crash severity models on sample size requirements: Multinomial logit, ordered probit, and mixed logit. Anal. Methods Accid. Res. 2014, 1, 72–85. [Google Scholar] [CrossRef] [Green Version]
- Delen, D.; Sharda, R.; Bessonov, M. Identifying significant predictors of injury severity in traffic accidents using a series of artificial neural networks. Accid. Anal. Prev. 2006, 38, 434–444. [Google Scholar] [CrossRef]
- Chimba, D.; Sando, T. The prediction of highway traffic accident injury severity with neuromorphic techniques. Adv. Transp. Stud. 2009, 19, 17–26. [Google Scholar]
- Miaou, S.-P. The relationship between truck accidents and geometric design of road sections: Poisson versus negative binomial regressions. Accid. Anal. Prev. 1994, 26, 471–482. [Google Scholar] [CrossRef] [Green Version]
- Qin, X.; Ivan, J.N.; Ravishanker, N. Selecting exposure measures in crash rate prediction for two-lane highway segments. Accid. Anal. Prev. 2003, 36, 183–191. [Google Scholar] [CrossRef]
- Lord, D.; Washington, S.; Ivan, J. Further notes on the application of zero-inflated models in highway safety. Accid. Anal. Prev. 2007, 39, 53–57. [Google Scholar] [CrossRef]
- Malyshkina, N.V.; Mannering, F. Zero-state Markov switching count-data models: An empirical assessment. Accid. Anal. Prev. 2010, 42, 122–130. [Google Scholar] [CrossRef] [Green Version]
- Greibe, P. Accident prediction models for urban roads. Accid. Anal. Prev. 2002, 35, 273–285. [Google Scholar] [CrossRef]
- Das, A.; Abdel-Aty, M.A. A combined frequency-severity approach for the analysis of rear-end crashes on urban arterials. Saf. Sci. 2011, 49, 1156–1163. [Google Scholar] [CrossRef]
- Wang, X.; Abdel-Aty, M.A. Temporal and spatial analyses of rear-end crashes at signalized intersections. Accid. Anal. Prev. 2006, 38, 1137–1150. [Google Scholar] [CrossRef]
- Anderson, T.K. Kernel density estimation and K-means clustering to profile road accident hotspots. Accid. Anal. Prev. 2009, 41, 359–364. [Google Scholar] [CrossRef]
- Milton, J.C.; Shankar, V.N.; Mannering, F.L. Highway accident severities and the mixed logit model: An exploratory empirical analysis. Accid. Anal. Prev. 2008, 40, 260–266. [Google Scholar] [CrossRef]
- Gomes, S.V.; Geedipally, S.R.; Lord, D. Estimating the safety performance of urban intersections in Lisbon, Portugal. Saf. Sci. 2012, 50, 1732–1739. [Google Scholar] [CrossRef]
- Dong, C.; Richards, S.H.; Clarke, D.B.; Zhou, X.; Ma, Z. Examining signalized intersection crash frequency using multivariate zero-inflated Poisson regression. Saf. Sci. 2014, 70, 63–69. [Google Scholar] [CrossRef]
- Cantillo, V.; Garcés, P.; Márquez, L. Factors influencing the occurrence of traffic accidents in urban roads: A combined GIS-Empirical Bayesian approach. DYNA 2015, 83, 21–28. [Google Scholar] [CrossRef]
- Shankar, V.; Milton, J.; Mannering, F. Modeling accident frequencies as zero-altered probability processes: An empirical inquiry. Accid. Anal. Prev. 1997, 29, 829–837. [Google Scholar] [CrossRef]
- Lord, D.; Mannering, F. The statistical analysis of crash-frequency data: A review and assessment of methodological alternatives. Transp. Res. Part A Policy Pract. 2010, 44, 291–305. [Google Scholar] [CrossRef] [Green Version]
Figure 1.
Provincial road features in Taiwan.

Figure 2.
A schematic about the analysis shapes of intersection.


Table 1.
Statistical summary of accidents at intersections.
| Number of Accidents Which Resulted in Injuries or Fatalities | Number of Intersections (2018) | % | Number of Intersections (2019) | % |
|---|---|---|---|---|
| 0 Accidents | 13,555 | 69.23% | 13,063 | 66.72% |
| 1~10 Accidents | 5705 | 29.14% | 6191 | 31.62% |
| 11~20 Accidents | 239 | 1.22% | 250 | 1.28% |
| 21~30 Accidents | 48 | 0.25% | 53 | 0.27% |
| 31~40 Accidents | 19 | 0.10% | 15 | 0.08% |
| 41~50 Accidents | 8 | 0.04% | 6 | 0.03% |
| Over 51 Accidents | 6 | 0.03% | 2 | 0.01% |
| Total | 19,580 | 19,580 |
Table 2.
Variables used in the analysis.
| Label | Variable | Type | Descriptive Statistics | Researcher |
|---|---|---|---|---|
| Accident | Continuous | The number of accident-related fatalities and injuries, for three-way intersections on provincial roads in 2018 and 2019. | - | |
| Station | Binary |
| [20,23] | |
| School | Binary |
| [23] | |
| Hospital | Binary |
| - | |
| Market | Binary |
| - | |
| Gas Station | Binary |
| - | |
| Department store | Binary |
| - | |
| Convenience store | Binary |
| - | |
| Parking lot | Binary |
| - | |
| Speed limit | Classification |
| [21,22] | |
| Road width(unit: m) | Continuous | Minimum: 2 Maximum: 88 Mean: 18.74 Standard deviation: 8.74 | [20,21] | |
| Main lane width(unit: m) | Continuous | Minimum: 2 Maximum: 34 Mean: 7 Standard deviation: 3.11 | - | |
| Slow vehicle lane width(unit: m) | Continuous | Minimum: 0 Maximum: 9.5 Mean: 1 Standard deviation: 1.55 | - | |
| Central divider(unit: m) | Continuous | Minimum: 0 Maximum: 2.28 Mean: 0.6 Standard deviation: 1.05 | [20,21,22] | |
| Sidewalk width(unit: m) | Continuous | Minimum: 0 Maximum: 7 Mean: 0.9 Standard deviation: 1.76 | [20,21,23] | |
| Traffic Flow | Continuous | Minimum: 2.41 Maximum: 4 Mean: 5.22 Standard deviation: 0.42 | [20,21,22] [24,25,26,27] |
Note: “Near” indicates the POI is within 300 m in radius of the intersection.
Table 3.
ZIP Model Calibration Results.
| First Segment: Intersections with No Accident Casualties (Zero-Inflated, Logit) | |||||||||
| Estimate | Std.Error | Pr(>|z|) | Estimate | Std.Error | Pr(>|z|) | ||||
| Intercept term | 5.581 | 0.180 | <0.000 | Road width | −0.052 | 0.002 | <0.000 | ||
| School | No | -- | -- | -- | Traffic flow | −0.706 | 0.041 | <0.000 | |
| Yes | −0.264 | 0.030 | <0.000 | Speed limit | Under 30 km/h | -- | -- | -- | |
| Shopping mall | No | -- | -- | -- | 40 km/h | −0.298 | 0.112 | 0.008 | |
| Yes | −0.639 | 0.036 | <0.000 | 50 km/h | −0.683 | 0.098 | <0.000 | ||
| Gas station | No | -- | -- | -- | 60 km/h | −0.587 | 0.097 | <0.000 | |
| Yes | −0.345 | 0.029 | <0.000 | 70 km/h | −0.517 | 0.100 | <0.000 | ||
| Department store | No | -- | -- | -- | Above 80 km/h | 0.435 | 0.168 | 0.010 | |
| Yes | −0.306 | 0.113 | 0.007 | Fast lane width | −0.013 | 0.005 | 0.010 | ||
| Convenience store | No | -- | -- | -- | Slow lane width | 0.027 | 0.009 | <0.000 | |
| Yes | −0.748 | 0.039 | <0.000 | Sidewalk width | −0.052 | 0.009 | <0.000 | ||
| Parking lot | No | -- | -- | -- | |||||
| Yes | −0.272 | 0.053 | <0.000 | ||||||
| Second Segment: Intersections with Accident Casualties (Poisson) | |||||||||
| Estimate | Std.Error | Pr(>|z|) | Estimate | Std.Error | Pr(>|z|) | ||||
| Intercept item | −1.918 | 0.086 | <0.000 | Road width | 0.021 | 0.001 | <0.000 | ||
| Station | No | -- | -- | -- | Traffic flow | 0.388 | 0.017 | <0.000 | |
| Yes | 0.034 | 0.015 | 0.024 | Speed limit | Under 30 km/h | -- | -- | -- | |
| Hospital | No | -- | -- | -- | 40 km/h | 0.400 | 0.051 | <0.000 | |
| Yes | 0.134 | 0.013 | <0.000 | 50 km/h | 0.316 | 0.042 | <0.000 | ||
| Shopping mall | No | -- | -- | -- | 60 km/h | 0.220 | 0.043 | <0.000 | |
| Yes | 0.257 | 0.013 | <0.000 | 70 km/h | 0.078 | 0.044 | 0.075 | ||
| Gas station | No | -- | -- | -- | Above 80 km/h | −0.149 | 0.080 | 0.062 | |
| Yes | 0.110 | 0.011 | <0.000 | Fast lane width | 0.028 | 0.002 | <0.000 | ||
| Department store | No | -- | -- | -- | Slow lane width | 0.009 | 0.003 | 0.002 | |
| Yes | 0.127 | 0.025 | <0.000 | Central divider width | 0.011 | 0.005 | 0.022 | ||
| Convenience store | No | -- | -- | -- | Sidewalk width | 0.021 | 0.003 | <0.000 | |
| Yes | 0.196 | 0.012 | <0.000 | ||||||
| Parking lot | No | -- | -- | -- | |||||
| Yes | 0.215 | 0.014 | <0.000 | ||||||
Table 4.
ZINB Model Calibration Results.
| First Segment: Intersections with No Accident Casualties (Zero-Inflated, Logit) | |||||||||
| Estimate | Std.Error | Pr(>|z|) | Estimate | Std.Error | Pr(>|z|) | ||||
| Intercept term | 6.097 | 0.416 | <0.000 | Road width | −0.068 | 0.009 | <0.000 | ||
| School | No | -- | -- | -- | Traffic flow | −1.026 | 0.105 | <0.000 | |
| Yes | −0.447 | 0.091 | <0.000 | Speed limit | Under 30 km/h | -- | -- | -- | |
| Shopping mall | No | -- | -- | -- | 40 km/h | −0.088 | 0.223 | 0.694 | |
| Yes | −2.191 | 0.363 | <0.000 | 50 km/h | −0.033 | 0.207 | 0.872 | ||
| Gas station | No | -- | -- | -- | 60 km/h | −0.456 | 0.203 | 0.025 | |
| Yes | −0.902 | 0.108 | <0.000 | 70 km/h | −0.536 | 0.220 | 0.015 | ||
| Department store | No | -- | -- | -- | Above 80 km/h | 1.692 | 0.346 | <0.000 | |
| Yes | −3.555 | 1.239 | 0.004 | Fast lane width | −0.053 | 0.021 | 0.011 | ||
| Convenience store | No | -- | -- | -- | Sidewalk width | −0.392 | 0.062 | <0.000 | |
| Yes | −0.668 | 0.219 | 0.002 | ||||||
| Second Segment: Intersections with Accident Casualties (Negative Binomial) | |||||||||
| Estimate | Std.Error | Pr(>|z|) | Estimate | Std.Error | Pr(>|z|) | ||||
| Intercept item | −3.689 | 0.167 | <0.000 | Road width | 0.041 | 0.002 | <0.000 | ||
| Station | No | -- | -- | -- | Traffic flow | 0.475 | 0.032 | <0.000 | |
| Yes | 0.112 | 0.035 | 0.001 | Speed limit | Under 30 km/h | -- | -- | -- | |
| School | No | -- | -- | -- | 40 km/h | 0.632 | 0.110 | <0.000 | |
| Yes | 0.054 | 0.026 | 0.040 | 50 km/h | 0.641 | 0.090 | <0.000 | ||
| Hospital | No | -- | -- | -- | 60 km/h | 0.335 | 0.091 | <0.000 | |
| Yes | 0.145 | 0.029 | <0.000 | 70 km/h | 0.196 | 0.092 | 0.034 | ||
| Shopping mall | No | -- | -- | -- | Above 80 km/h | 0.053 | 0.155 | 0.731 | |
| Yes | 0.399 | 0.028 | <0.000 | Fast lane width | 0.034 | 0.004 | <0.000 | ||
| Gas station | No | -- | -- | -- | Sidewalk width | 0.038 | 0.006 | <0.000 | |
| Yes | 0.142 | 0.024 | <0.000 | ||||||
| Convenience store | No | -- | -- | -- | |||||
| Yes | 0.360 | 0.027 | <0.000 | ||||||
| Parking lot | No | -- | -- | -- | |||||
| Yes | 0.264 | 0.035 | <0.000 | ||||||
Table 5.
Comprehensive comparison of model calibration results.
| Zero-Inflated Poisson | Zero-Inflated Negative Binomial | |
|---|---|---|
| Sample size | 39,160 | 39,160 |
| log-likelihood | −52,099.83 | −42,538.91 |
| AIC | 104,271.7 | 85,143.82 |
| BIC | 104,580.4 | 85,426.82 |
Publisher’s Note: MDPI stays neutral with regard to jurisdictional claims in published maps and institutional affiliations. |
© 2022 by the authors. Licensee MDPI, Basel, Switzerland. This article is an open access article distributed under the terms and conditions of the Creative Commons Attribution (CC BY) license (https://creativecommons.org/licenses/by/4.0/).
Share and Cite
MDPI and ACS Style
Lin, D.-J.; Yang, J.-R.; Liu, H.-H.; Chiang, H.-S.; Wang, L.-Y. Analysis of Environmental Factors on Intersection Accidents. Sustainability 2022, 14, 1764. https://0-doi-org.brum.beds.ac.uk/10.3390/su14031764
AMA Style
Lin D-J, Yang J-R, Liu H-H, Chiang H-S, Wang L-Y. Analysis of Environmental Factors on Intersection Accidents. Sustainability. 2022; 14(3):1764. https://0-doi-org.brum.beds.ac.uk/10.3390/su14031764
Chicago/Turabian StyleLin, Da-Jie, Jia-Rong Yang, Hsin-Hsien Liu, Hsiu-Sen Chiang, and Lin-Yao Wang. 2022. "Analysis of Environmental Factors on Intersection Accidents" Sustainability 14, no. 3: 1764. https://0-doi-org.brum.beds.ac.uk/10.3390/su14031764
Note that from the first issue of 2016, this journal uses article numbers instead of page numbers. See further details here.