
Analyzing Freight Truck Platoon Accessibility with Route Deviations


Department of Civil Engineering and Construction Engineering Management, California State University, Long Beach, CA 90840, USA
*
Author to whom correspondence should be addressed.
Sustainability 2022, 14(4), 2130; https://0-doi-org.brum.beds.ac.uk/10.3390/su14042130
Submission received: 18 December 2021
/
Revised: 9 February 2022
/
Accepted: 10 February 2022
/
Published: 13 February 2022
(This article belongs to the Special Issue Smart and Connected Freight for Sustainable Cities)
Abstract
:Truck platooning is emerging as a sustainable means of transporting goods and commodities to destinations. Platooning optimizes road space and contributes to reducing freight truck emissions. However, there has been limited research on freight truck platoon accessibility to the destination that is often necessary to understand the impact of routes on which platoon is deployed. This study develops an analytical formulation for platoon accessibility by considering the possibility of the detour of trucks forming a platoon. Analyses with four prominent interstates in California, CA, USA, show that accessibility with truck platooning on select lengths of the I-5 continues to increase for about an initial 165 miles, attains a maximum there, and starts to drop after. The other three freeways, I-10, I-405, and I-710, show a continuous increase in accessibility for their lengths and the number of ramps considered. The findings can have significant implications in determining the selection of freeway routes that could be regarded as facilitators for a truck platoon.
1. Introduction and Background
Freight truck operations play a crucial role in sustaining a nation’s economic competitiveness and for the population’s sustenance that depends on transported goods from one location to another [1]. In the United States, the enactment of Fixing America’s Surface Transportation Act (FAST Act) into law in December 2015 recognized the importance of investment in freight transportation [2]. The FAST Act aimed at the sustained economic growth of the freight industry with provisions for establishing a National Multimodal Freight Policy (NMFP) by identifying strategies and best practices to improve intermodal connectivity and performance of the national freight system. The multimodal freight provisions expressed in the FAST Act are concurrent to improvements in safety, mobility, and environment through connected vehicle technology (CVT) supported by the United States Department of Transportation (USDOT), Washington, DC, USA. CVT is covered mainly within the area of Intelligent Transportation Systems (ITS) for freight under the ITS Strategic Plan 2015–2019 of USDOT [3].
Another focus of USDOT has been to adopt automation-related technologies through the ITS Strategic Plan. This has generated interest among private freight truck manufacturing companies (such as Volvo Group, Gothenburg, Sweden) to expand their fleet of next-generation commercial trucks with embedded ITS and CVT features. Recently, Volvo Trucks North America successfully demonstrated truck platooning technology for improving fuel efficiency, reducing traveling distance between vehicles for greater highway utilization, and helping alleviate traffic congestion [4]. However, CVT for freight trucks still is at a very early stage of deployment in the United States, and sustainability benefits that accrue from fuel savings and reduced emissions need to be assessed first [5,6].
Research findings from a renowned consulting firm, McKinsey & Company (tinyurl.com/bdcptche accessed on 18 December 2021), showed that Level 4 vehicles (nearly fully autonomous trucks without a driver) are anticipated to be deployed in the United States as soon as 2025. A test route of 1400 miles on I-10 is currently being considered for a truck platooning pilot from Texas to California, state abbreviation, USA, to assess system performance and capability on actual roads [7]. The success of this effort can motivate considerations of truck platooning—i.e., multiple trucks travel close to each other following a lead truck, braking and accelerating at the same time. Platooning can occur spontaneously in real-time, or sometimes planning is required to create a platoon [8].
Driving technologies such as Cooperative Adaptive Cruise Control (CACC) can help achieve the movement of trucks in tandem and allow them to virtually communicate with each other with a lead truck with respect to braking, steering, and decelerating or accelerating in a platoon [9]. Evidence shows that platoon movement adds to environmental sustainability by reducing fuel consumption and emissions [10,11]. Other benefits of platooning include safety by decreasing chances of rear-end collisions [9] and reduced traffic congestion with minimal space occupied between two trucks moving in a platoon [12]. However, there is complexity involved in platoon movement for the group of trucks as various external interruptions (such as the presence of incidents, lane closure, congestion, etc.) could force one or more trucks in the platoon to abandon a pre-determined path and switch to a newly identified path [9].
In general, routes in platooning planning problems can be divided into fixed vs. flexible types. Trucks moving in a platoon could deviate under flexible routes, whereas deviations might not happen from a pre-planned route for the fixed-route case [9]. Recent research by Sokolov et al. [13] indicates that a flexible routing scheme could result in truck fuel savings. In this case, truck(s) in a platoon could break out to avoid a route obstacle but orient themselves again into a platoon somewhere downstream a path. Building upon this phenomenon, Boysen et al. [14] developed a fundamental scheduling problem for the platoon building process along a single path.
Successful planning for truck platooning requires that information on travel speeds and routes be known beforehand—with the possibility for trucks in a platoon to detour. Appropriate models need to be built to capture complex platooning operations with detours [9]. However, complexities arise in building models that incorporate appropriate technologies and maneuvering for the success of truck platooning [15,16,17]. Most existing models require observation from on-ground experiments under a controlled environment and are empirical—limiting their widespread applications. Theoretical models that describe detour truck operations are often complex as critical factors need to be accounted for—such as infrastructure limitations (whether conducive for detouring), speed limitations, and the presence of surrounding passenger vehicles.
This paper explores and presents how freight truck platoon’s accessibility (used as a measure of economic sustainability) can vary due to potential detour options. This focus has never been researched before in truck platooning.
2. Literature Review
Truck automation and platooning are required for energy savings and enhanced transportation capacity. Truck platoon (compared to conventional freight truck movements) offers various improvements central to the congestion problem, such as increased road space utilization and optimized traffic flow [10].
In the United States, field experiments by the California PATH Program using heavy truck platooning showed improvements of up to 10% in fuel savings [18]. The Volvo Trucks North America, FedEx, Memphis, TN, USA, and the North Carolina Turnpike Authority, Raleigh, NC, USA, recently concluded a successful demonstration of truck platooning technology on N.C. 540 [4]. The platoon consisted of three Volvo VNL tractors, each pulling double 28 ft. trailers. Several other private and public entities in the United States have also conducted truck platoon demonstrations and testing—such as the Federal Highway Administration (FHWA). The Caltrans-PATH-Volvo team demonstrated cooperative adaptive cruise control [19]. In all platooning experiments, the focus was on using some form of cooperative adaptive cruise control (CACC) using radar and vehicle-to-vehicle (V2V) communications involving connected vehicle technology (CVT).
As a freight transportation technology, truck platooning is evolving fast [20]. Truck platooning has a high potential demand in cities that are often hubs of high freight traffic and congestion [21]. Tests carried out with a platoon of autonomous trucks have proven successful for significant savings in fuel and reducing greenhouse gas emissions [3,20].
Economically, for shippers and carriers, freight transportation costs are intrinsically tied to the timely arrival of commodities for transfers at intermodal stations and terminals to be transported further to destinations. Delayed arrivals of a truck at one transfer station or a point in a network eventually result in late pick-ups and deliveries to the last terminal point—which raises the overall transportation cost of the multimodal freight operations and makes freight transportation unsustainable [22,23]. Thus, a truck’s timely access (in the form of accessibility) to destinations needs to be appropriately evaluated for the continued sustainability of goods movement in platooning.
Accessibility is expected to be low when congestion on routes of a truck platoon is high. This is because congestion causes an increase in travel times that reduces accessibility for freight trucks. Although travel time is considered a critical factor in truck operations, delays resulting from an increase in travel time are difficult to model [24]. The travel time and delay impact accessibility to destinations via truck, required for sustained growth of industries and businesses in a region [25]. Adherence to the timely delivery of commodities is important in the optimal operations of a multimodal transportation system. Every mode in the system must operate in tandem under certain predicted travel time ranges to cause a minimal delay (and costs) to overall system operations. Thus, appropriate accessibility should exist between stations or pairs of points of the multimodal transportation system through the efficient mobility of freight trucks.
Accessibility, in general, is an indicator of the mobility of people and goods and is one of the most widely used concepts for policy-related decision making in transportation. In freight studies, accessibility has been evaluated by using expected travel time to access a region [26]. The findings could be used to understand freight accessibility issues and possible policy decisions for regions of importance. However, in research, accessibility changes due to the route chosen by a freight truck have been rarely addressed—especially if the route includes possibilities of a detour for trucks moving in a platoon.
Various forms of impedance functions for travel are used to evaluate accessibility, and the magnitude of travel impedance used is critical in determining the accessibility achieved. The impedances could be in the form of average travel time, distance, or generalized cost considered as appropriate [27].
3. Materials and Methods
Various studies have defined accessibility measures in the context of infrastructure, location, person, or utility [28,29,30]. In this research, we focus on infrastructure and location-based measures of accessibility since freight trucks have limitations in path deviations dictated by the available infrastructure. The location-based measure identifies the tonnage of goods or commodity movement from one point to another, incorporating distance or travel time in a gravity-based potential accessibility measure [26]. We modify the gravity-based accessibility measure by Khalili et al. [26] with possibilities of route deviations of a single truck from a platoon using on and off ramps.
The generic formula for accessibility is as follows:
where is the accessibility of an entity , is the weight indicating the importance of the destination , and is the impedance function that often takes the form of a power decay function such as travel time, distance, generalized cost, etc., with β being the decay parameter.
Weight Wj assumed in this paper is the total truck tonnage of load transported along a path to destination j. The average (or expected) travel time from a source i to a destination j is used as the impedance Tij.
The decay parameter β denotes the extent of variation of accessibility with impedance [31]. The parameter value (which is a positive number) depends on travel data for its determination using calibration. This paper estimates the decay parameter by accounting for the tonnage of goods and commodities moved across the route, facilitating accessibility.
3.1. Determining Decay Parameter
The traditional approach of determining decay parameter, β, in a gravity-based potential accessibility measure involves the evaluation of spatial variation in the attraction potential (in our case, the tonnage or cargo) along the distance traveled (or travel time) for a location [31]. The truck tonnage/cargo is assumed to be transported from an originating location (such as a port or intermodal terminal) via the links of the route to a destination. A link with high tonnage (and having a lower travel time) would have higher freight accessibility towards the destination.
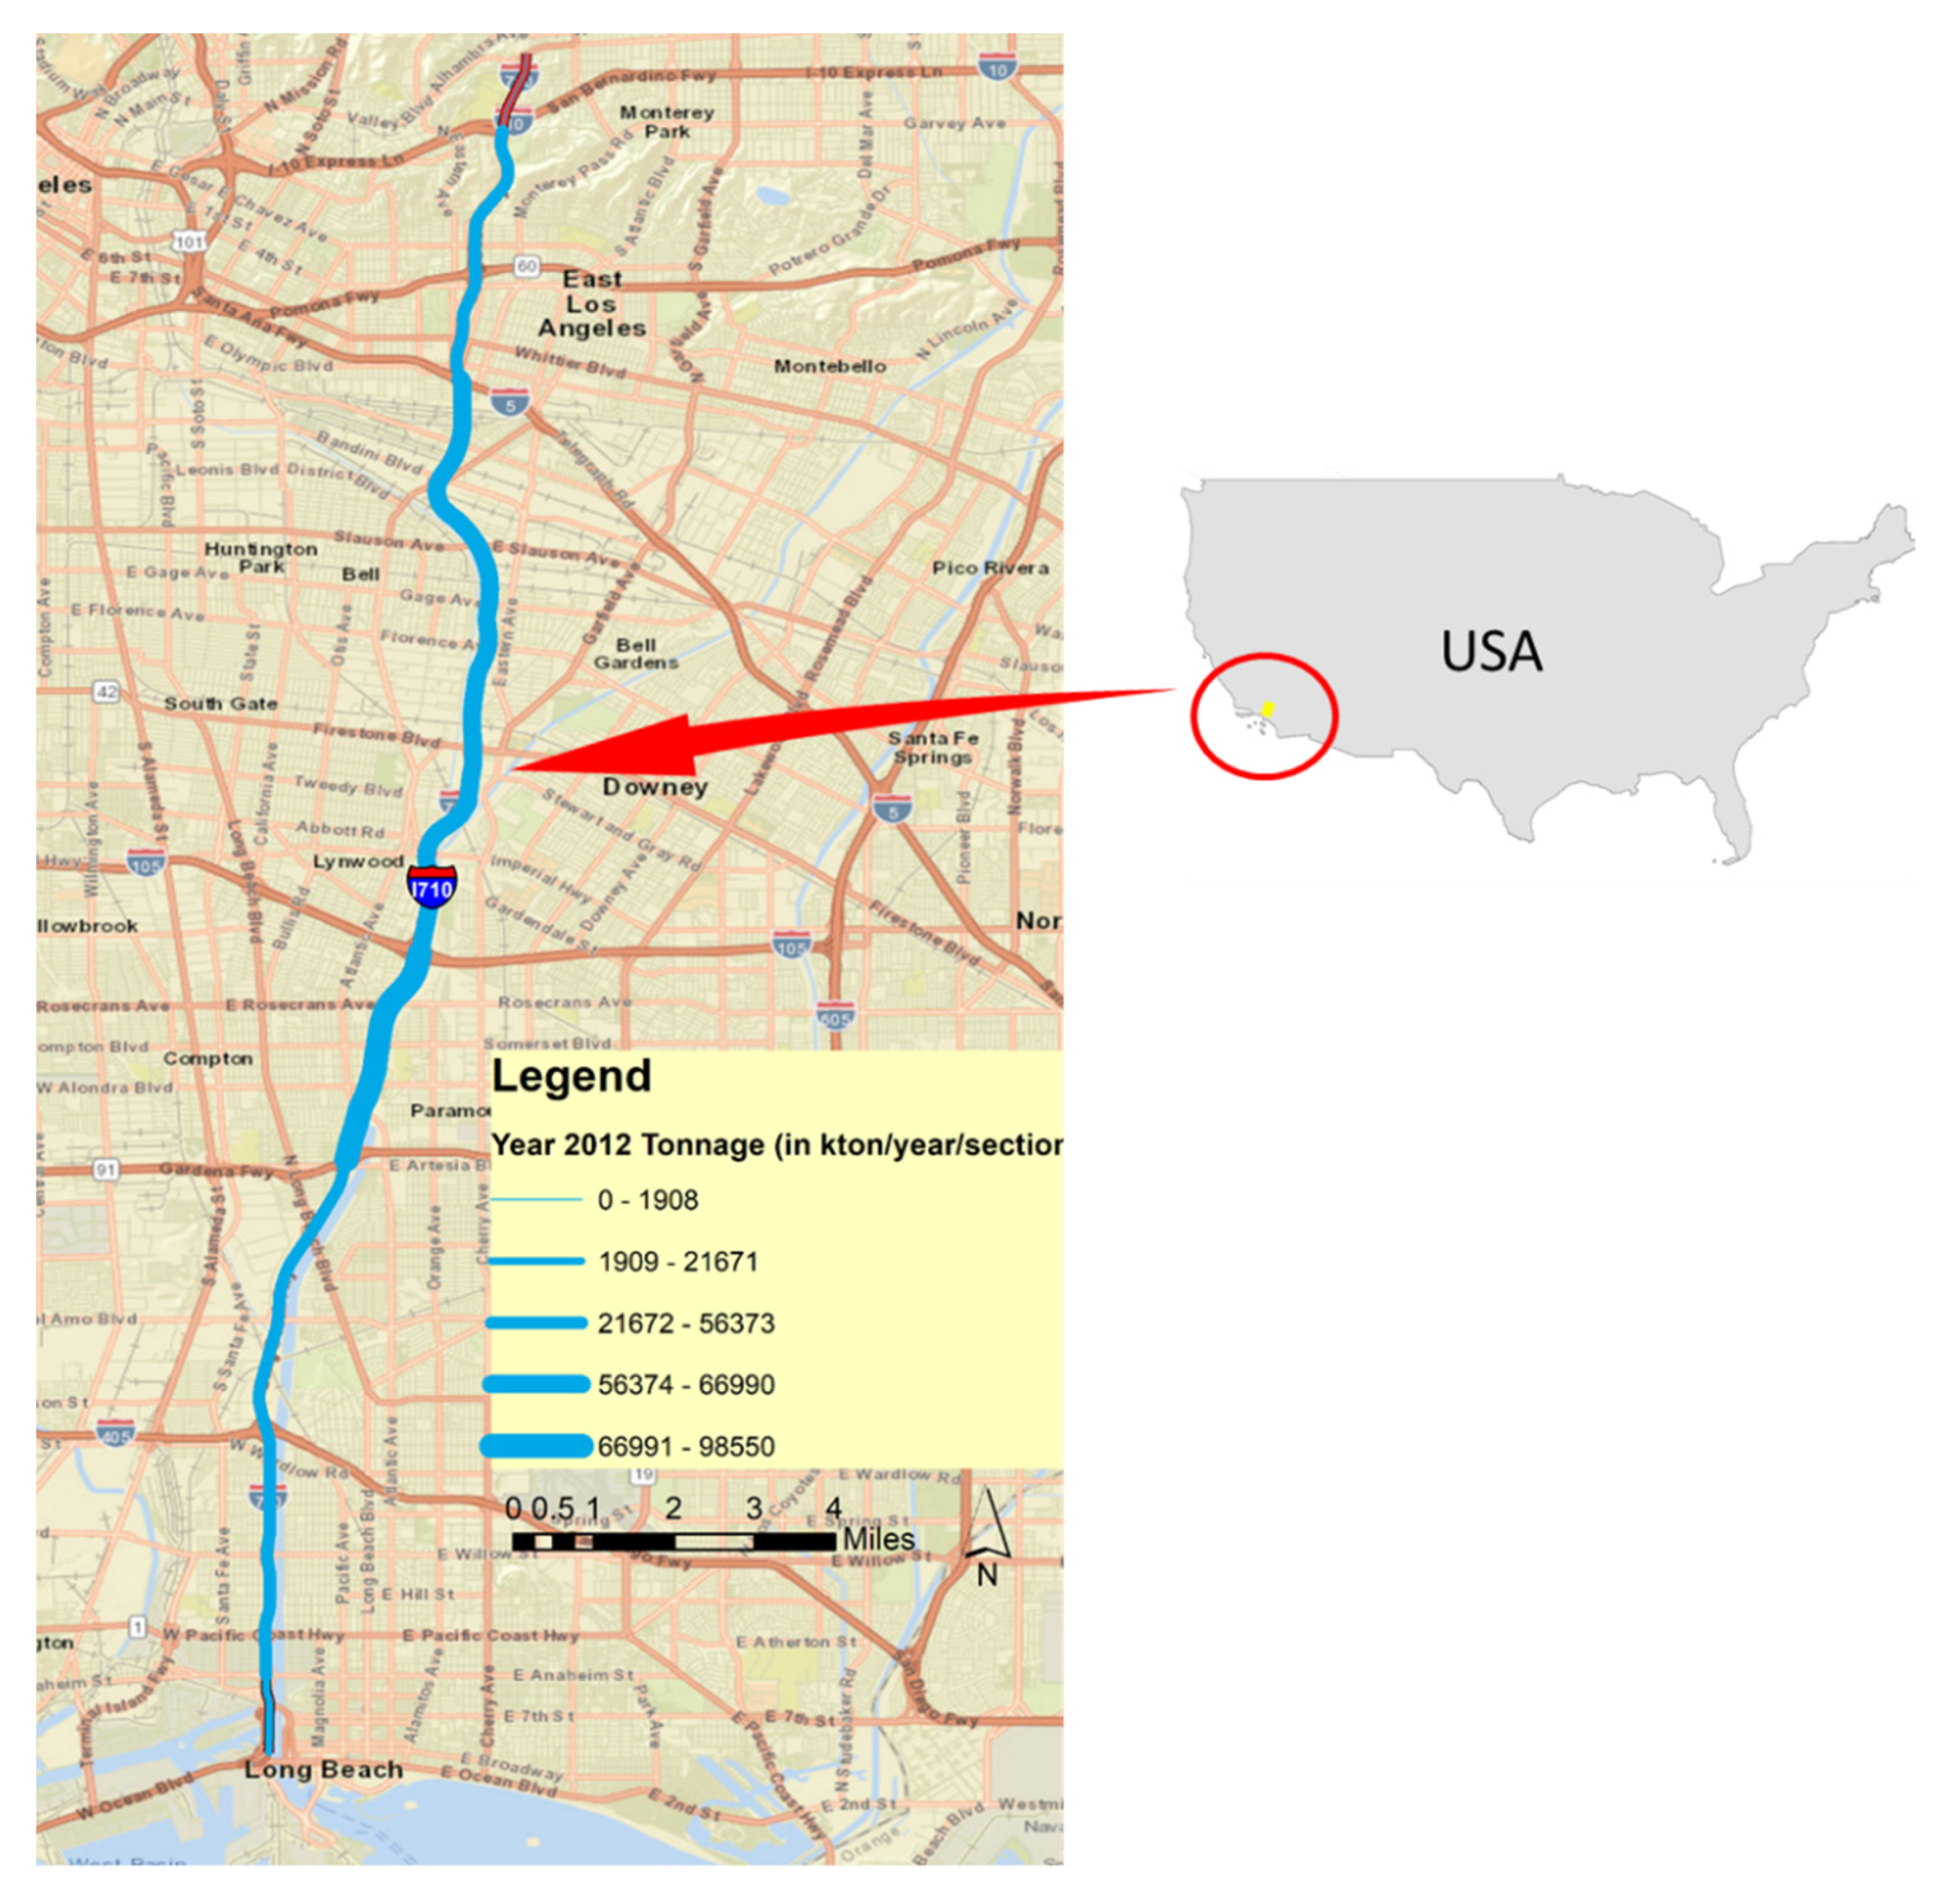
The total truck tonnage transported is expected to be high at the beginning of an origin (such as a port, intermodal station, etc.) but would decrease along the path as the tonnage distributes through other major routes to other destinations. Tonnage on sections along the path could also increase due to merging truck traffic from adjacent links. As an example, the map in Figure 1 shows how the tonnage per year per section of I-710 spatially varies along its stretch in the Southern California Region, beginning from the south. The thicker lines around the middle of I-710 stretch denote tonnage increases from adjacent highways, including CA-91 and I-105.
An estimate of β for I-710 can be made based on spatial variations in high tonnage and accounting for its dissipation along the freeway’s path to the desired endpoint. A similar approach was adopted by Chandra and Vadali [31] to determine the decay parameter and is summarized in the following steps.
Step 1: Obtain the travel times and truck tonnage (or tonnage percentages) along the subject route.
Step 2: Plot percentage of tonnage versus travel times along the route to determine the trend in the variations—if linear, exponential, etc.
Step 3: If the trend is linear, the slope of the line will provide β; otherwise, if the trend follows an exponential or other power law, convert travel time and percentage tonnage to corresponding logarithms. Using the logarithm, convert the dependency into a linear equation, and the slope of the linear equation yields an estimate of the decay parameter β.
In practice, transportation performance evaluations that use accessibility (as defined in Equation (1) above) as a measure are not customized for capturing impacts from freight trucks moving in a platoon, especially with potential detours. However, with detour allowed, assessing impedance with route deviation can help determine a more suitable accessibility equation.
3.2. Determining Impedance
In this research, we use travel time as an indicator of impedance. Therefore, a setup of the freeway length is assumed, as shown in Figure 2—which can help determine a closed-form of travel time that can be used to customize the accessibility formula defined in Equation (1).
In the sketch of Figure 2, a freight truck’s travel is considered along the route from point (A) to (B) of the freeway segment, with exits (or detour options) as marked. In the sketch of Figure 2, n number of individual links and n number of nodes at each exit point diverging away from the freight movement make up the distance from (A) to (B). Every link has a beginning and an ending, with uncongested truck travel times ti—where i is the segment number between two ramps and varies from 1 to (n − 1). The ending node of one link serves as the beginning node of its immediately following link along the direction, as shown using arrows in the set-p shown in Figure 2. The average travel time of a freight truck from point (A) to point (B) with detours allowed is derived. It is assumed that a truck can exit a ramp to avoid a congested point of the freeway and re-enter the freeway using a downstream on-ramp. The truck can use one of the exits very close to the beginning of the congestion location concentrated between two ramps to detour. This mimics the process in which one or more trucks moving a platoon exits the freeway to avoid downstream congestion and rejoins the freeway at a suitable on-ramp to save time and fuel [9].
For simplification purposes, the sketch of Figure 2 also shows the location of n ramps with a rectangular area, length, L, and width, W, divided into (n − 1) partitions (each with width W and having a constant spacing d between two exit ramps).
Congestion usually occurs at on-ramp locations when vehicles from the ramp join the mainstream freeway traffic [32]. Options for avoiding such points on a freeway exist for freight truck needing to detour, if the access or frontage roads are present. For example, if the truck needs to avoid heavy congestion that has occurred on the segment between ramp 2 and ramp 3 in Figure 2, the truck can either exit ramp 2 and rejoin the freeway on-ramp 3 or it could exit ramp 1 and rejoin freeway using on-ramp 3. In this case, the truck is assumed to be traveling on the right-most lane to be able to use the exit ramp when needed for the detour. This maneuver allows the truck to avoid a downstream congested point located before the next exit ramp. Generally, it is observed that an on-ramp is followed by an exit ramp, and both are connected near a freeway. Thus, it can be assumed that there is negligible distance between an on-ramp and the closest exit ramp, as illustrated in Figure 2. In other words, the congestion point is located between two consecutive exit ramps (or two consecutive on-ramps) along a given route from (A) to (B) at one of the links.
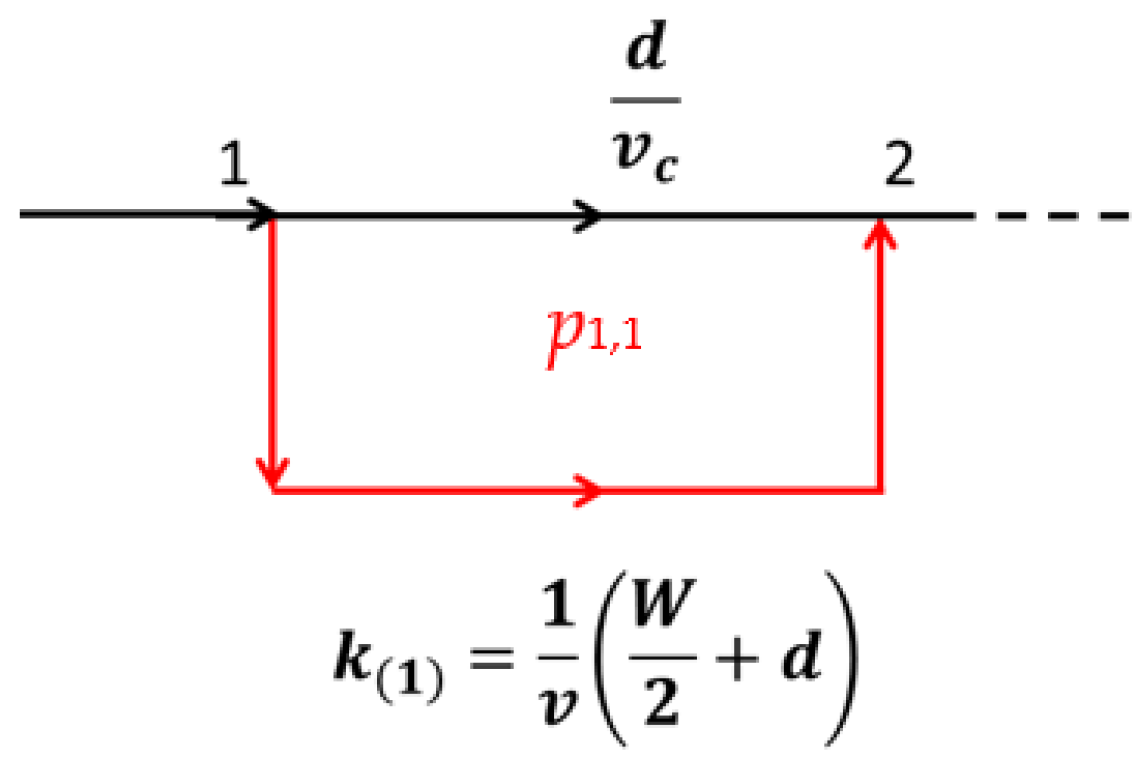
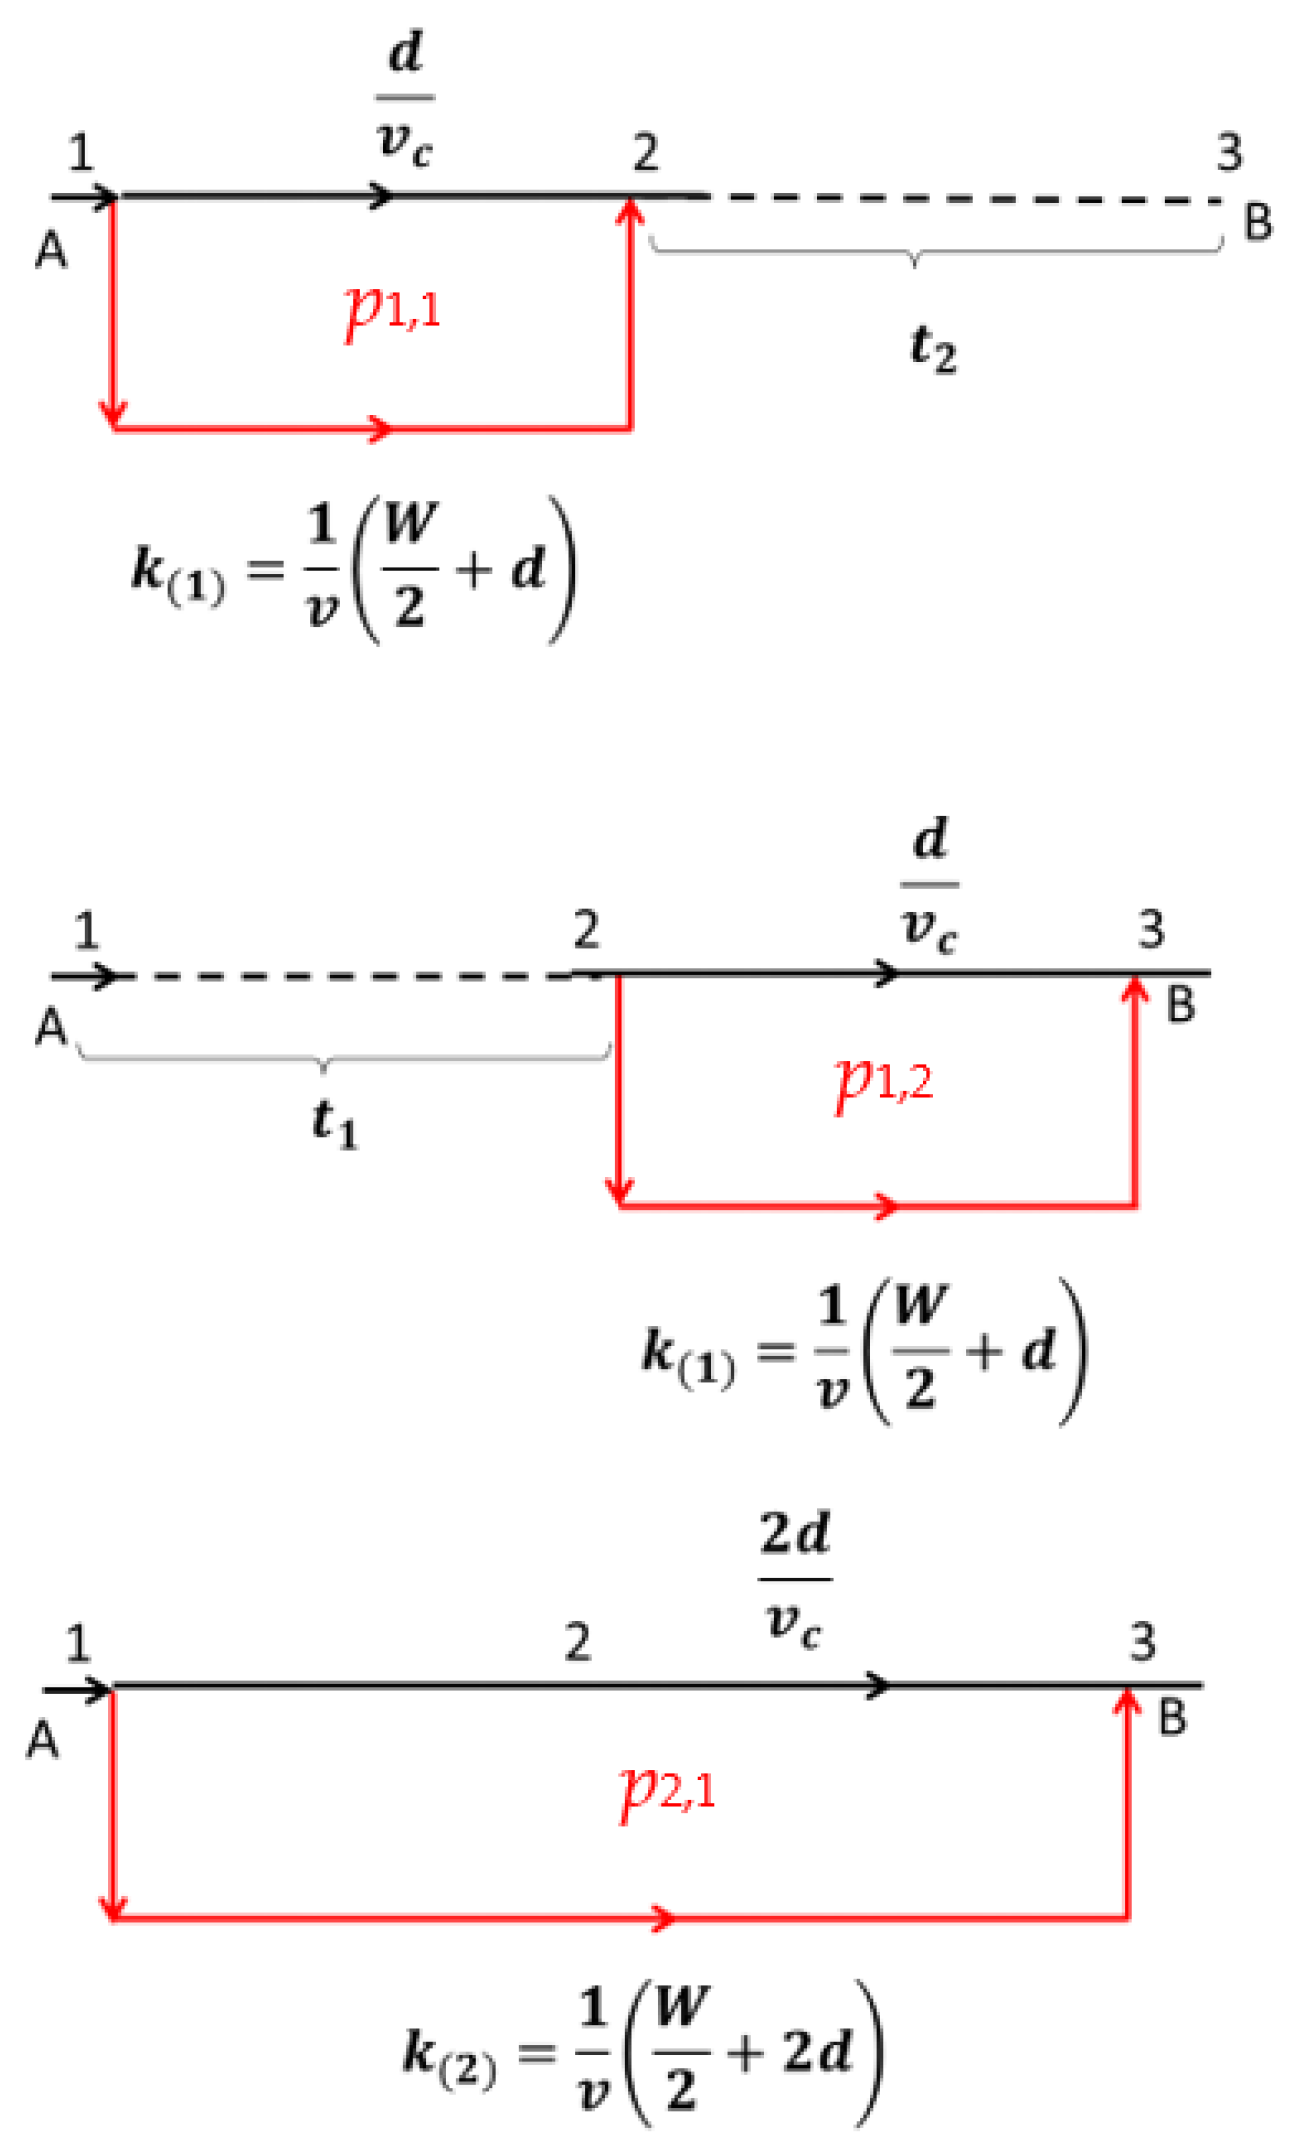
For a segment with one link from 1 to 2, we express the probability of one link being skipped during detour to be p1,1—since there is only one available detour option (see Figure 2). For 2 link case, shown in Figure 3, there are three possible paths, 1–2, 2–3, and 1–3, denoted with the probabilities of one link skips as p1,1, p1,2, and two consecutive link segments as p2,1. Similarly, for three links with 4 ramps in Figure 4, we have total detour paths with probabilities of skipping one link: p1,1, p1,2, p1,3, two consecutive links as p2,1, p2,2, and three links as p3,1. With n − 1 number of links and n ramps, we have probabilities as follows: p1,1, p1,2, …, p1,n−1, p2,1, p2,2,…, p2,n−2, p3,1, p3,2,…, p3,n−3, …, pn−2,1, pn−2,2,…, pn−1,1—where pn−2,1 means the probability of skipping n − 1 links when n ramps are present on segment (A) to (B).
We also define k = average truck travel time from exit ramp on to next immediate downstream on-ramp joining to the freeway, as observed in Figure 3. The derivation of k(1), which stands for k when 1 congested link on the freeway is skipped, follows from the rectilinear approximation of travel to the closest average point located at distance (W/4) in the area adjoining the exit ramp 1 and traveling distance d to the closest downstream on-ramp 2 connecting to the freeway or original path. Thus, , with v being the average speed of the truck traveling from any exit ramp to the immediate next on-ramp. Similarly to k(1), k(2) and k(3) are derived and represented in the sketches of Figure 3, Figure 4 and Figure 5. It can be observed that the feasibilities for k(2) and k(3) are possible only with n ≥ 2. Thus, by generalizing, we have the expression for .
With k(r) defined, the expressions for various detour probabilities for n ramps are as follows:
By generalizing, we have, for any n number of ramps, the following probability expressions.
Alternatively, with simplification, for any n ramps, i number of links on a path, and for the jth path with for a given i, we generalize the probability pi,j as follows.
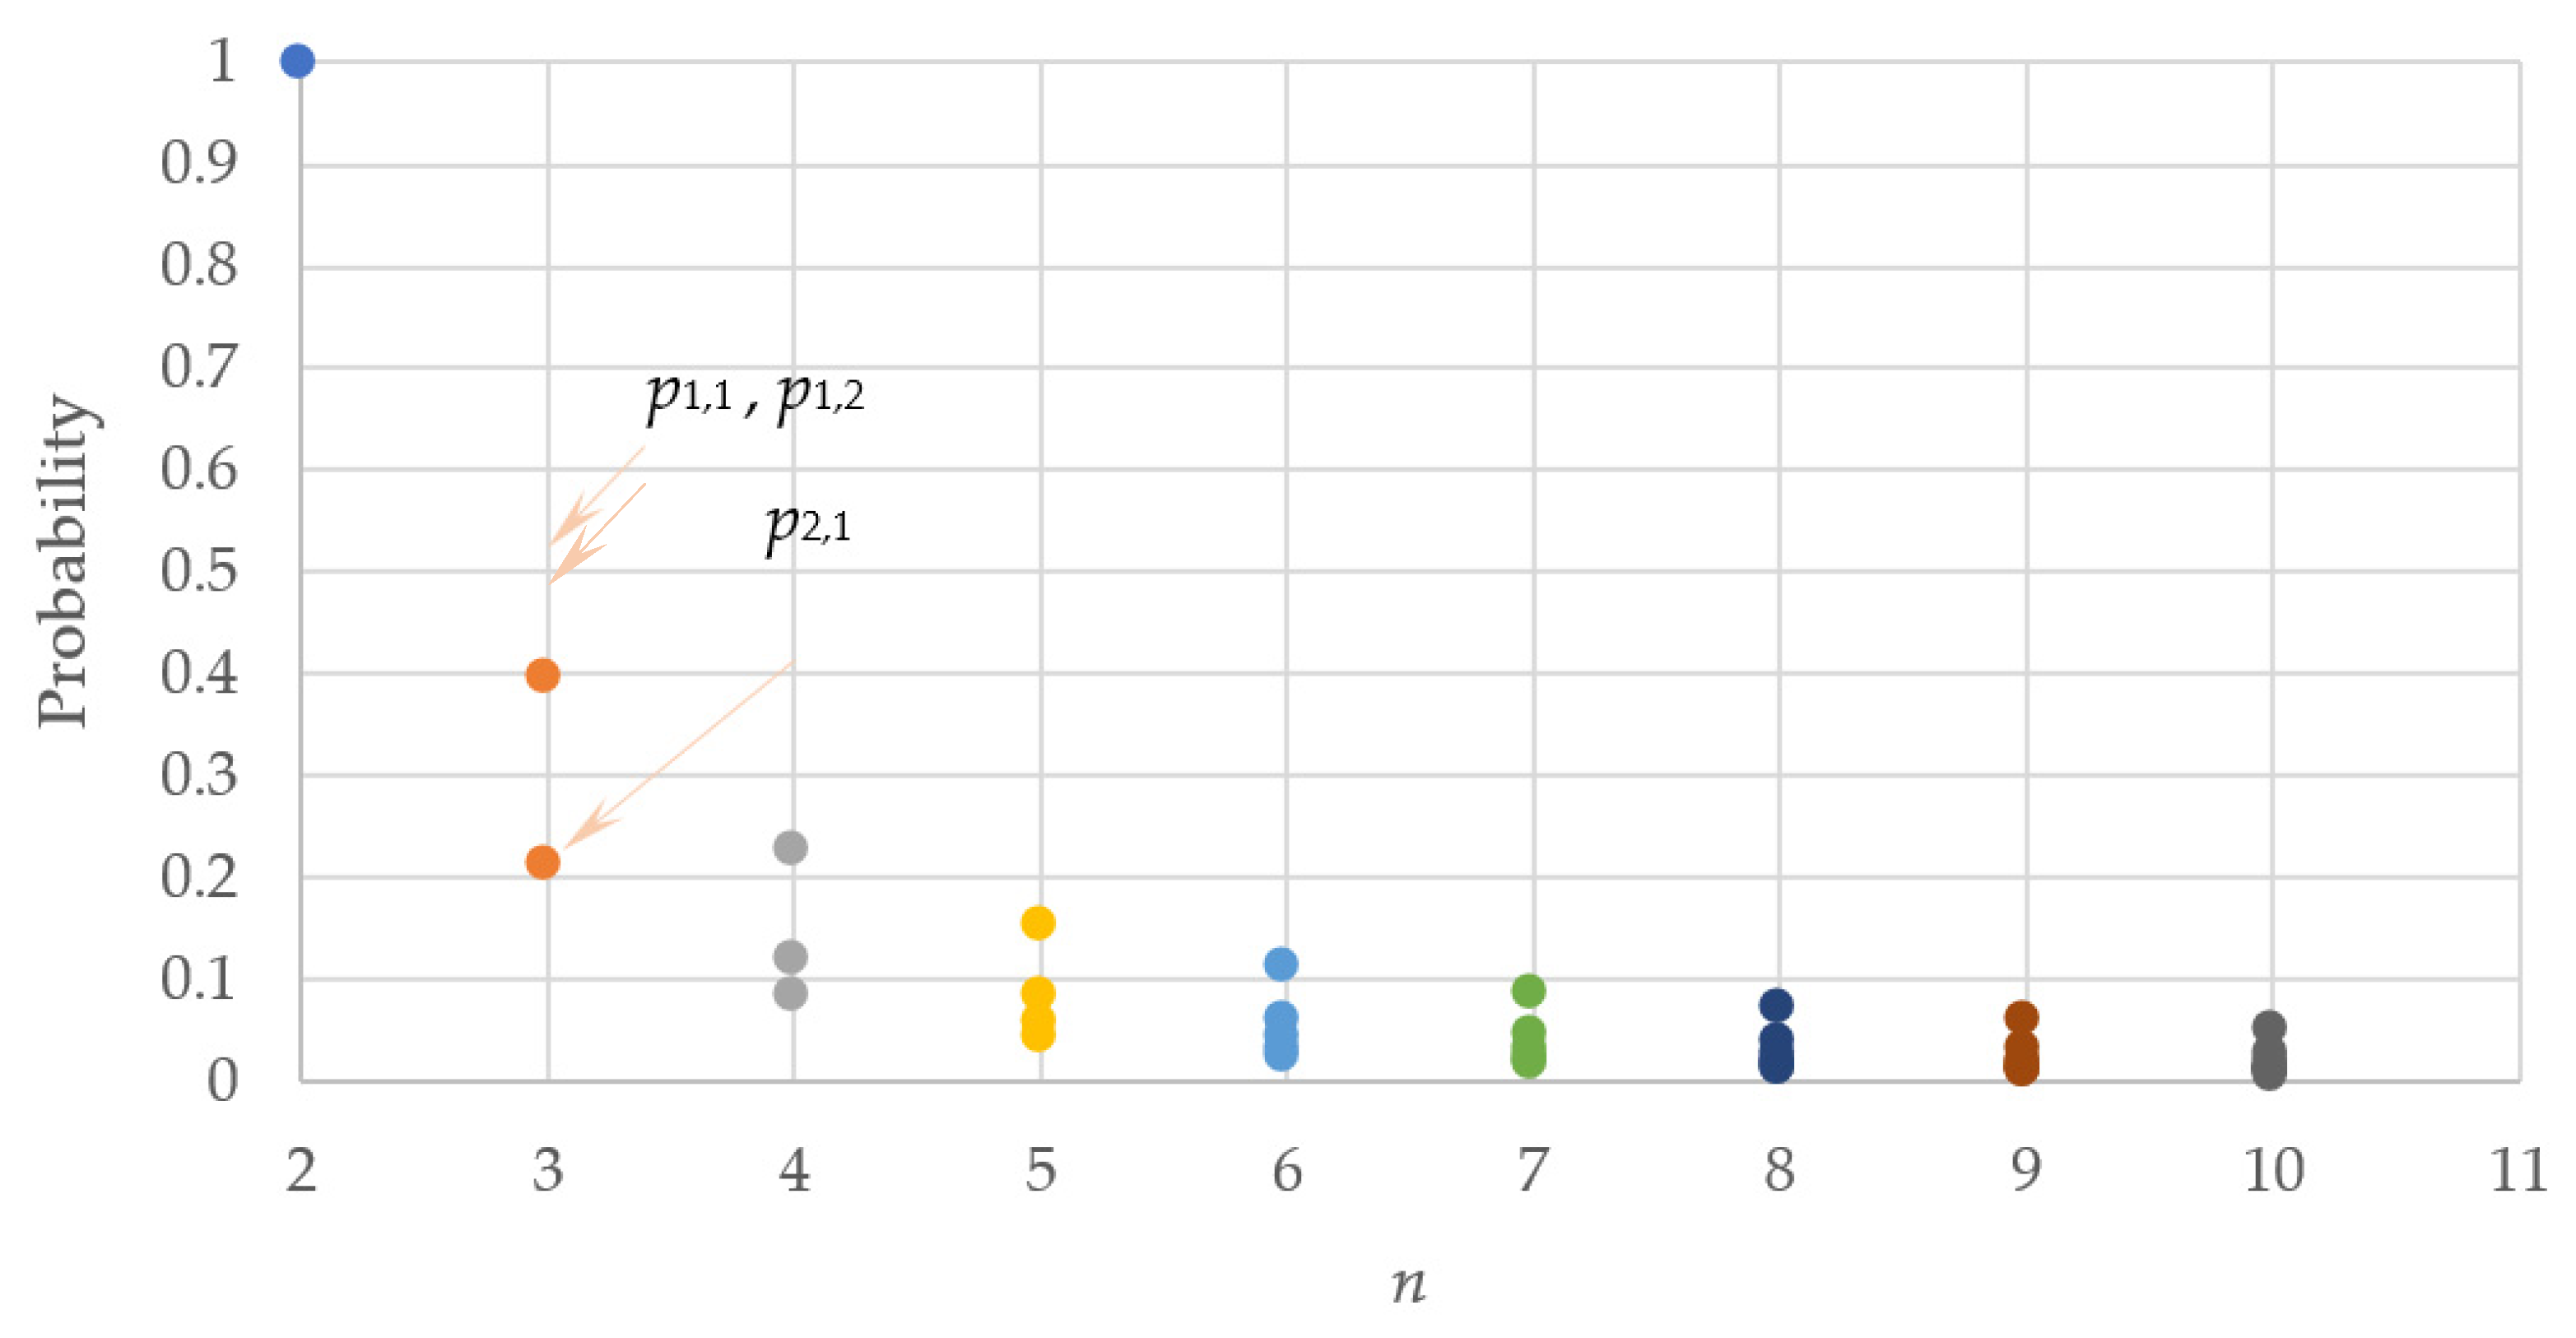
The chart in Figure 6 shows the variation in probability pi,j with n for d = 1 mile, speed on the auxiliary/frontage road, v = 25 mph, and W = 0.25 mile.
Due to infrastructure limitations that usually allow select streets for trucks, a truck that is detouring away from the platoon and deviating from its original path would not be able to skip several continuous links on its primary path. This is somewhat also reflected in the decreasing magnitude of the detour probability with increasing n as shown in Figure 6. The probability of truck-only detouring to avoid a single link and rejoining its original path is higher than probabilities when multiple continuous links on the original path are skipped. Further analysis shows an increasing percentage difference between p1,j and pi,j for i > 1 in Figure 7. Therefore, we assume that the probability p1,j >> ps,j for higher values of n with s > 1. Henceforth, we consider only the p1,j’s in our analysis for determining impedance expression for accessibility.
With the above simplification, the expected travel time, E[Tn], as impedance, for n number of ramps from (A) to (B) of Figure 2 is expressed as follows (see Appendix A.1 for detailed derivation):
where vc = speed on a congested link; d/vc is the travel time on the congested link on the freeway between two consecutive ramps; x denotes (non-detour) the probability of traveling through the congested link on the freeway; (1 − x) is the detour probability; and Δ denotes the average time taken at each ramp (on or exit) during the merge. This is factored separately to account for the fact that vehicle maneuvers near or at ramp locations cause delays for trucks moving in the rightmost lane. Simplifying travel times on each link of approximately equal length and using the average speed for the uncongested situation such that , we have the following.
The expectation value formulation in Equation (8) assumes that the probability of congestion occurrence follows a uniform random distribution along the freeway.
The findings above allow us to simplify the accessibility expression in Equation (1). Assuming that there is a uniform tonnage, g, commodity flow through at each of the n − 1 links on the path from (A) to (B), and with the average travel time in Equation (8), freight accessibility in Equation (1) is written as follows:
where is the accessibility to point (B).
The expression for accessibility in Equation (9) is a closed-form expression that can be easily calculated and depends on transportation infrastructure and freight truck platoon speed.
Optimizing accessibility in Equation (9) is possible by realizing that while increase in number of ramp exits, n, would result in an increase in distance covered for a fixed tonnage of commodities and goods transported from origin to destination, this would also cause an increase in travel time as impedance, resulting in a reduction in accessibility. On the contrary, a low number of exits would mean lesser options available to exit from the freeway, limiting detour options for the freight truck. This would ultimately result in a reduction in accessibility to the destination. Thus, an optimal value for route accessibility would occur for some n. In fact, with the 1st and 2nd derivatives of the accessibility expression in Equation (9), maximum route accessibility with n and decay parameter, β, was observed, as stated in Table 1 (see details of derivation in Appendix A.2 and Appendix A.3). In Table 1, n * represents the optimal n. For all β < 1, accessibility is a monotonically increasing function.
4. Results
4.1. Optimal Accessibility
A detailed analysis is carried out to understand the impacts from the number of ramps (as exit options) considered in freight truck platoon accessibility, based on route length, non-detour probability, and assumed values of the decay parameter. The chart in Figure 8 shows the variation of accessibility for a given freight truck path with route deviation width, W = 2 miles, link/section length, d = 1 mile, v = 15 miles per h, vc = 5 miles per h, V = 55 miles per h, g = 1000 kton/year/section, and number of on/off ramps varying from n = 2 to 200. Thus, the length of the freight path considered varies from 2 miles (short-haul) to 200 miles (long haul). The outputs are shown for β = 1.5, 1 and 0.5, with three non-detour probabilities of x = 0, 0.5, and 1.0.
The chart in Figure 8 shows that with β = 1.5, accessibility attains a maximum value at n = 124, 142, and 160 for non-detour probabilities x = 0, 0.5, and 1, respectively. With β = 1, accessibility attains a constant value at distances beyond 200 miles around n = 200 along the freight path starting from the origin (around n = 2). Accessibility increases monotonically with an increase in the distance toward the destination with β = 0.5.
4.2. California Freight Truck Routes
The application of accessibility formulation developed in this paper has been analyzed for some select freeways of California, USA, beside the I-710 known for a daily high truck volume.
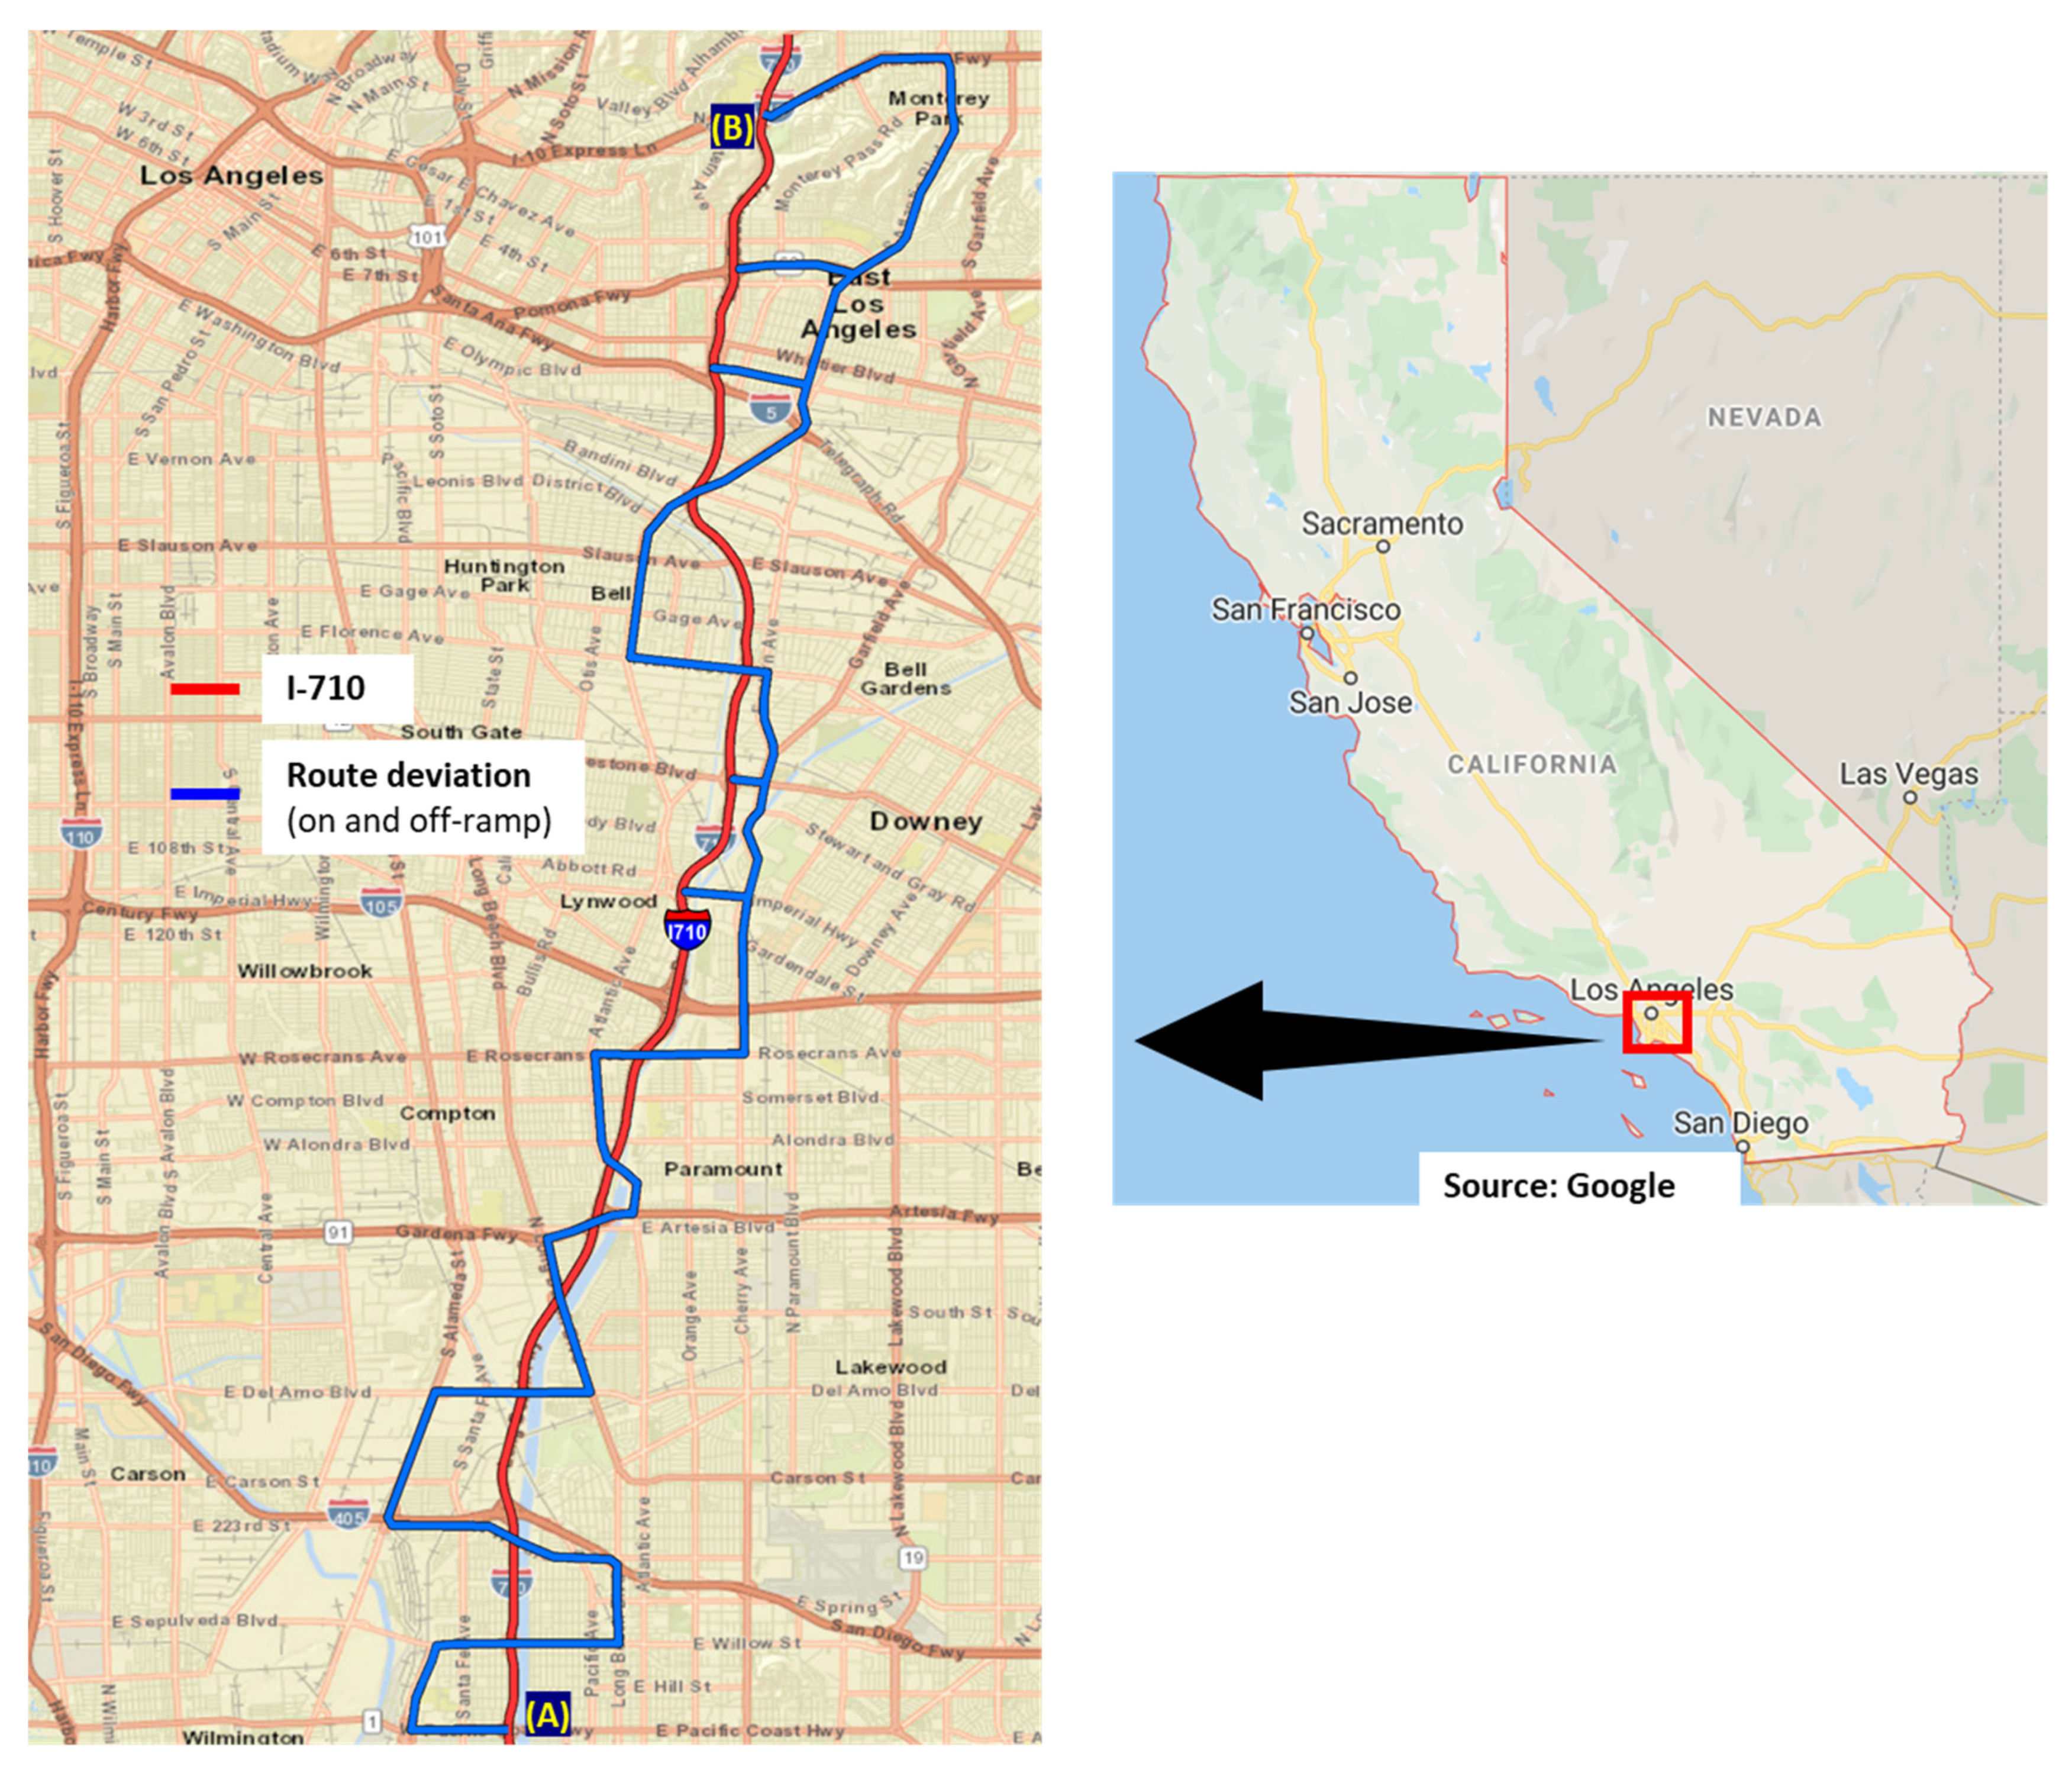
We showcase the analytically derived expression variation for impedance in Equation (8) with a simulated scenario that could closely mimic the truck detour from a platoon. The simulation exercise was carried out on the I-710 freeway in California. We assume congestion has occurred on randomly selected links of the I-710 that is the platoon’s original path. With reference to Figure 9, which shows the spatial location of I-710 freeway in California, point (A) is the starting point of the route on I-710, and point (B) is the endpoint. The length of the freeway is L = 20 miles, W = 2.6 miles (the average width for all possible truck routes that deviate from I-710), speed on arterial/frontage/access road, v = 25 mph, congestion speed on the freeway between two ramps, vc = 7.5 mph of the I-710, and delay ∆ is assumed to be 10 s. There are n = 14 links along the freeway length from (A) to (B), with the average distance between on and off-ramps being d = 1.42 miles.
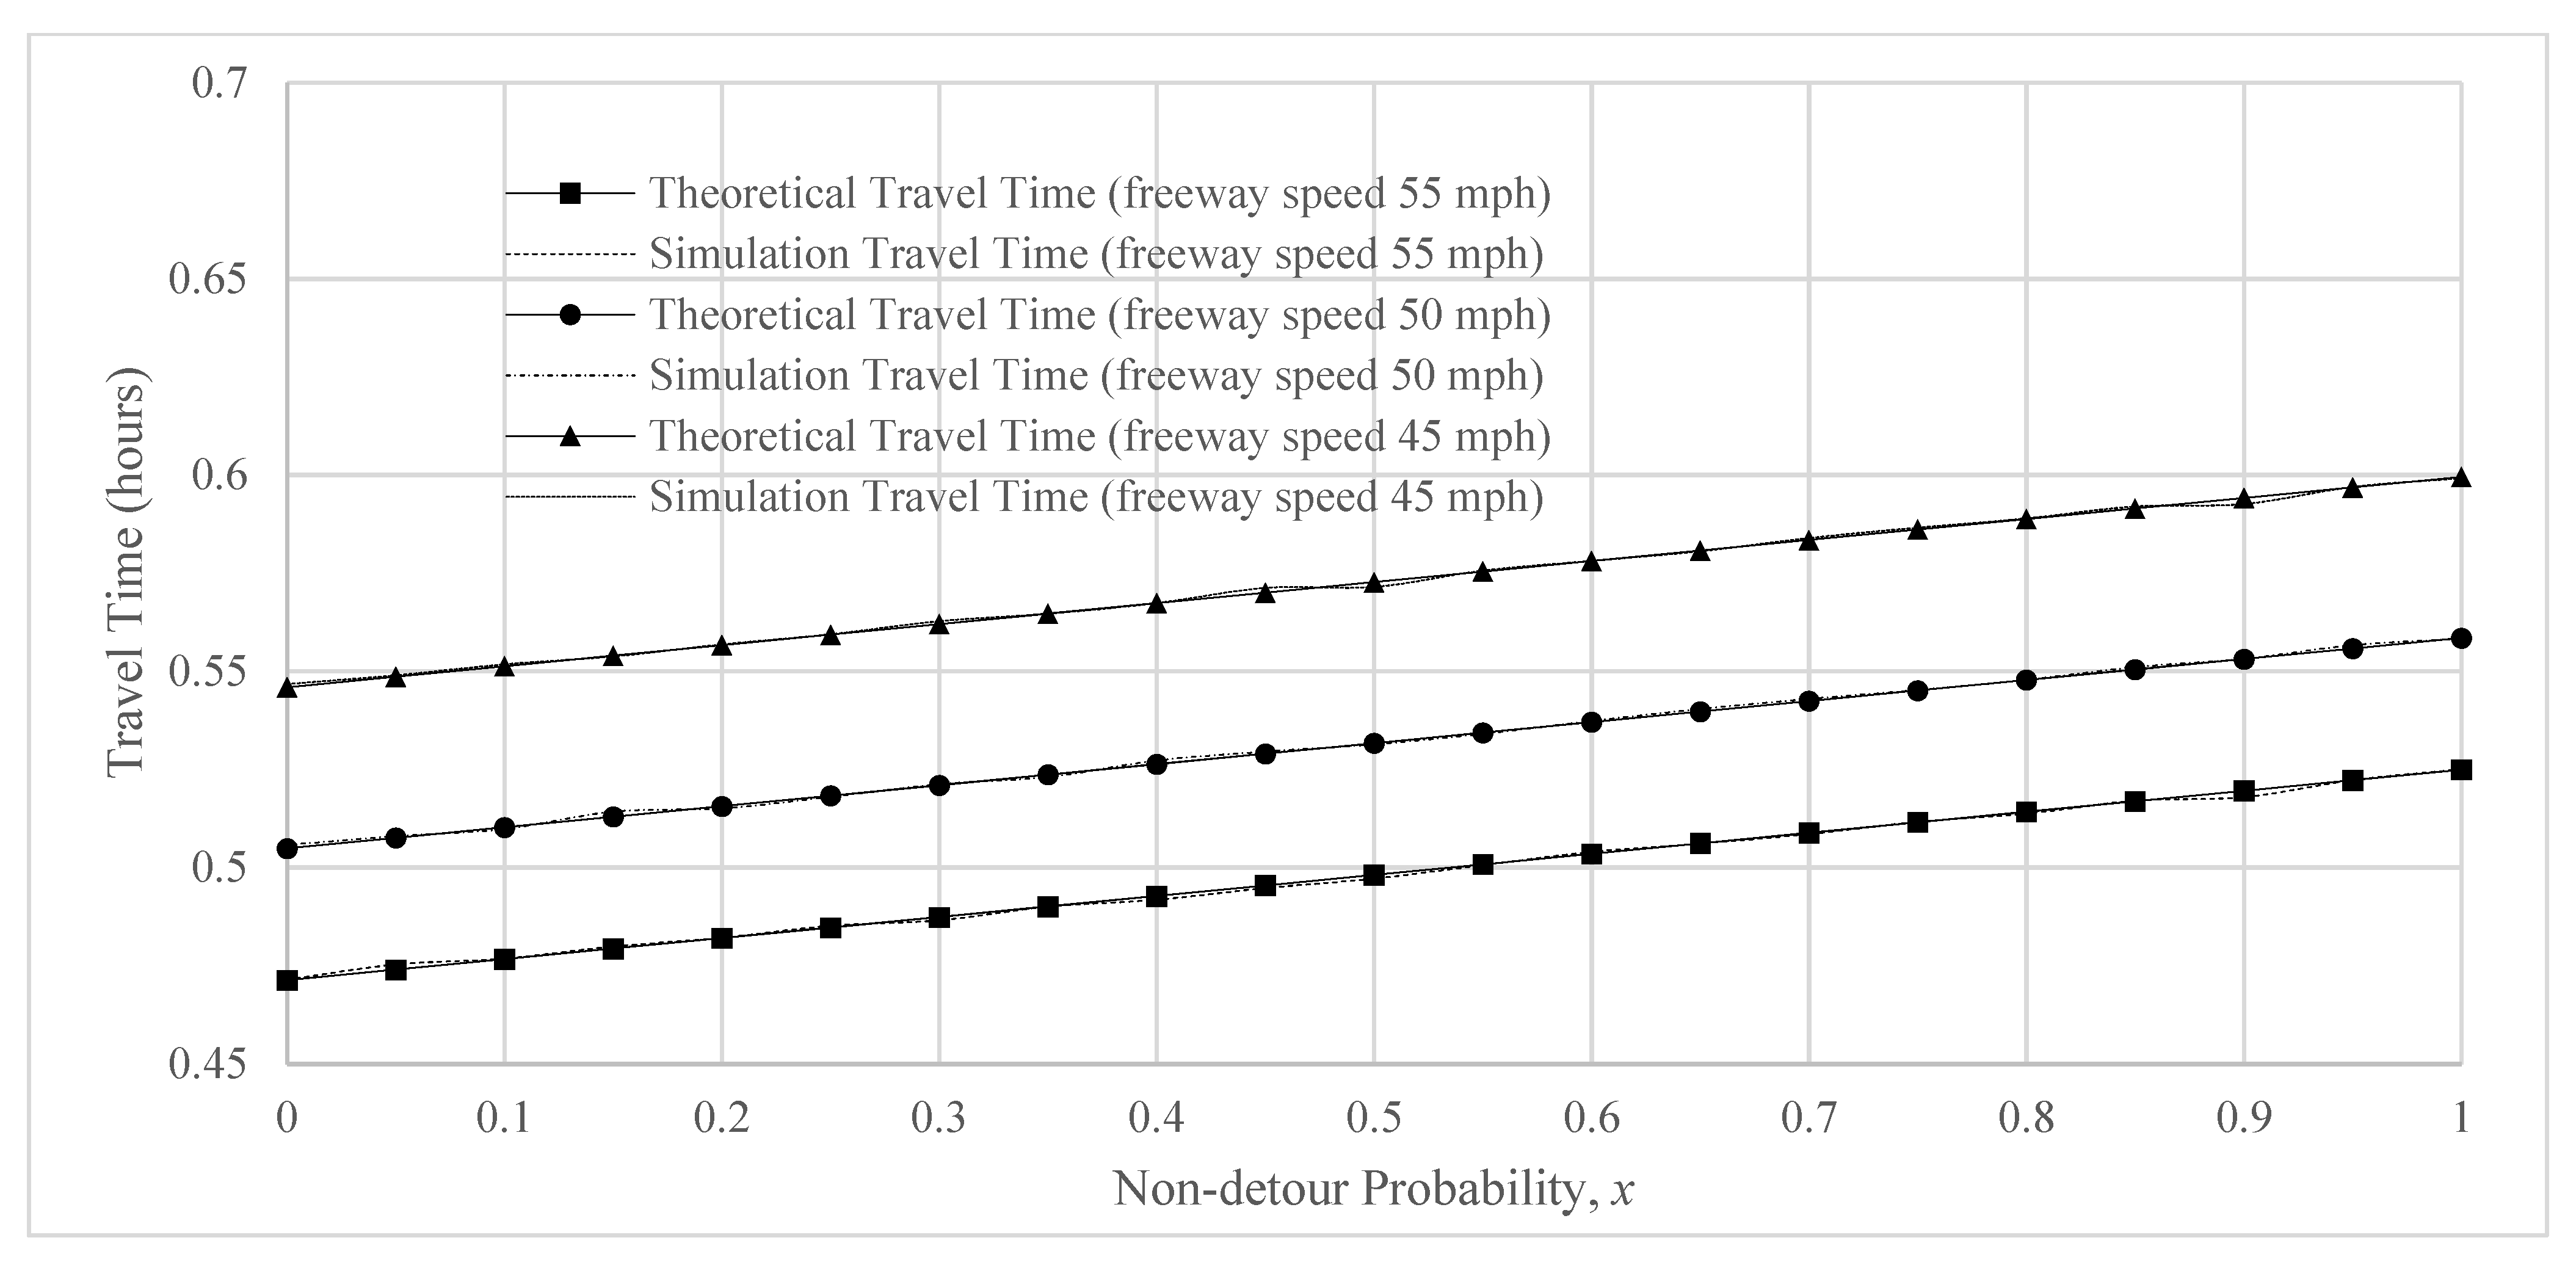
The chart in Figure 10 shows the simulation results compared with the theoretical/analytical outputs for travel time as impedance. The chart shows the average travel time for truck speeds on freeway varying from 45 mph to 55 mph (speed limit for trucks on I-710), along with variable detour probability x that varies from 0 to 1 at an interval of 0.05. With 1000 replications of congestion on one of the links of the freeway, the chart shows that average truck travel times using simulations is quite close to that obtained theoretically using Equation (8), i.e., considering route deviations to avoid congestion only on one link of the freeway. With x = 1 (i.e., with no route deviation), the truck travels through the congested link on the freeway. In this case, travel time is approximately 32 min—which was verified to be true for the uncongested travel time on I-710 using Google Maps historical travel time data for vehicles on a typical weekday.
California’s truck freight network system is one of the largest and most complex in the United States. The network is interconnected with other modal networks such as the railroad, seaports, and airports, which complement diverting some of the goods traffic off the roads. However, due to interconnectivity and multimodal structure, several disadvantages also arise. For example, congestion on one single point of the multimodal network ripples across several other modes, thus diminishing the performance of the multimodal freight network operations. California, which houses several internationally valued seaports, freeways, intermodal terminals, and air cargo facilities, is sensitive to cascading effects of congestion on truck routes. Studies have been undertaken to understand how some of the truck routes, such as the I-710 freeway in California, could serve as the next generation deployment of communication technologies that can allow trucks to know where downstream congestions are and manage emissions and fuel consumption accordingly [6,33]. The significance of this paper lies in contributing to the sustainability of the environment through efficient goods transportation by detouring congestion points by one or more trucks when moving in a platoon. Assessing the impacts of access to destinations by a truck in a platoon related to how effective sustainability of the commodity movement is.
California is already experiencing critical truck platoon pilot program deployments on its freeways. The Trade Corridor Enhancement Program (TCEP) in California provides $300 million each year for high-priority freight corridor improvements—particularly for corridors that experience inefficiencies in freight movement [34]. The investment also involves exploring options for deploying automated truck platoon (ATP) to alleviate increasing congestion due to freight activities in California. In fact, as per Assembly Bill (AB) 669, California permits platooning for testing purposes [35].
The application of accessibility formulation developed in Equation (9) is shown with the four major interstates/freeways of I-5, I-10, I-405, and I-710 that are prominent truck routes of the Southern California Region. These interstates facilitate the movement of goods and containers to/from intermodal freight facilities and the Port of Long Beach/Los Angeles, CA, USA, of the Region. The spatial locations of the interstates are shown in the map of Figure 11 (Data Source: Caltrans GIS [36]).
The decay parameter β for the four analyzed interstates are calculated using the methodology discussed in the earlier section. Approximate travel times used for determining β are obtained using the speed limits from the links along the lengths of the interstates. The speed limits are obtained from USDOT’s Freight Analysis Framework (FAF) data [37]. The values of inputs needed for accessibility calculation in Equation (9) are as follows: v = 15 miles per h, vc = 7.5 mph, and V = 55 miles per h. These values are presented in Table 2. The average tonnage on each of the interstates shown in Table 2 is based on interpolation with FAF data for 2012 and 2045 [38]. Origin and destination points and tonnage distribution (in kton/year/section) on the analyzed interstates, as noted in Table 2, are shown in the map of Figure 11.
5. Discussion
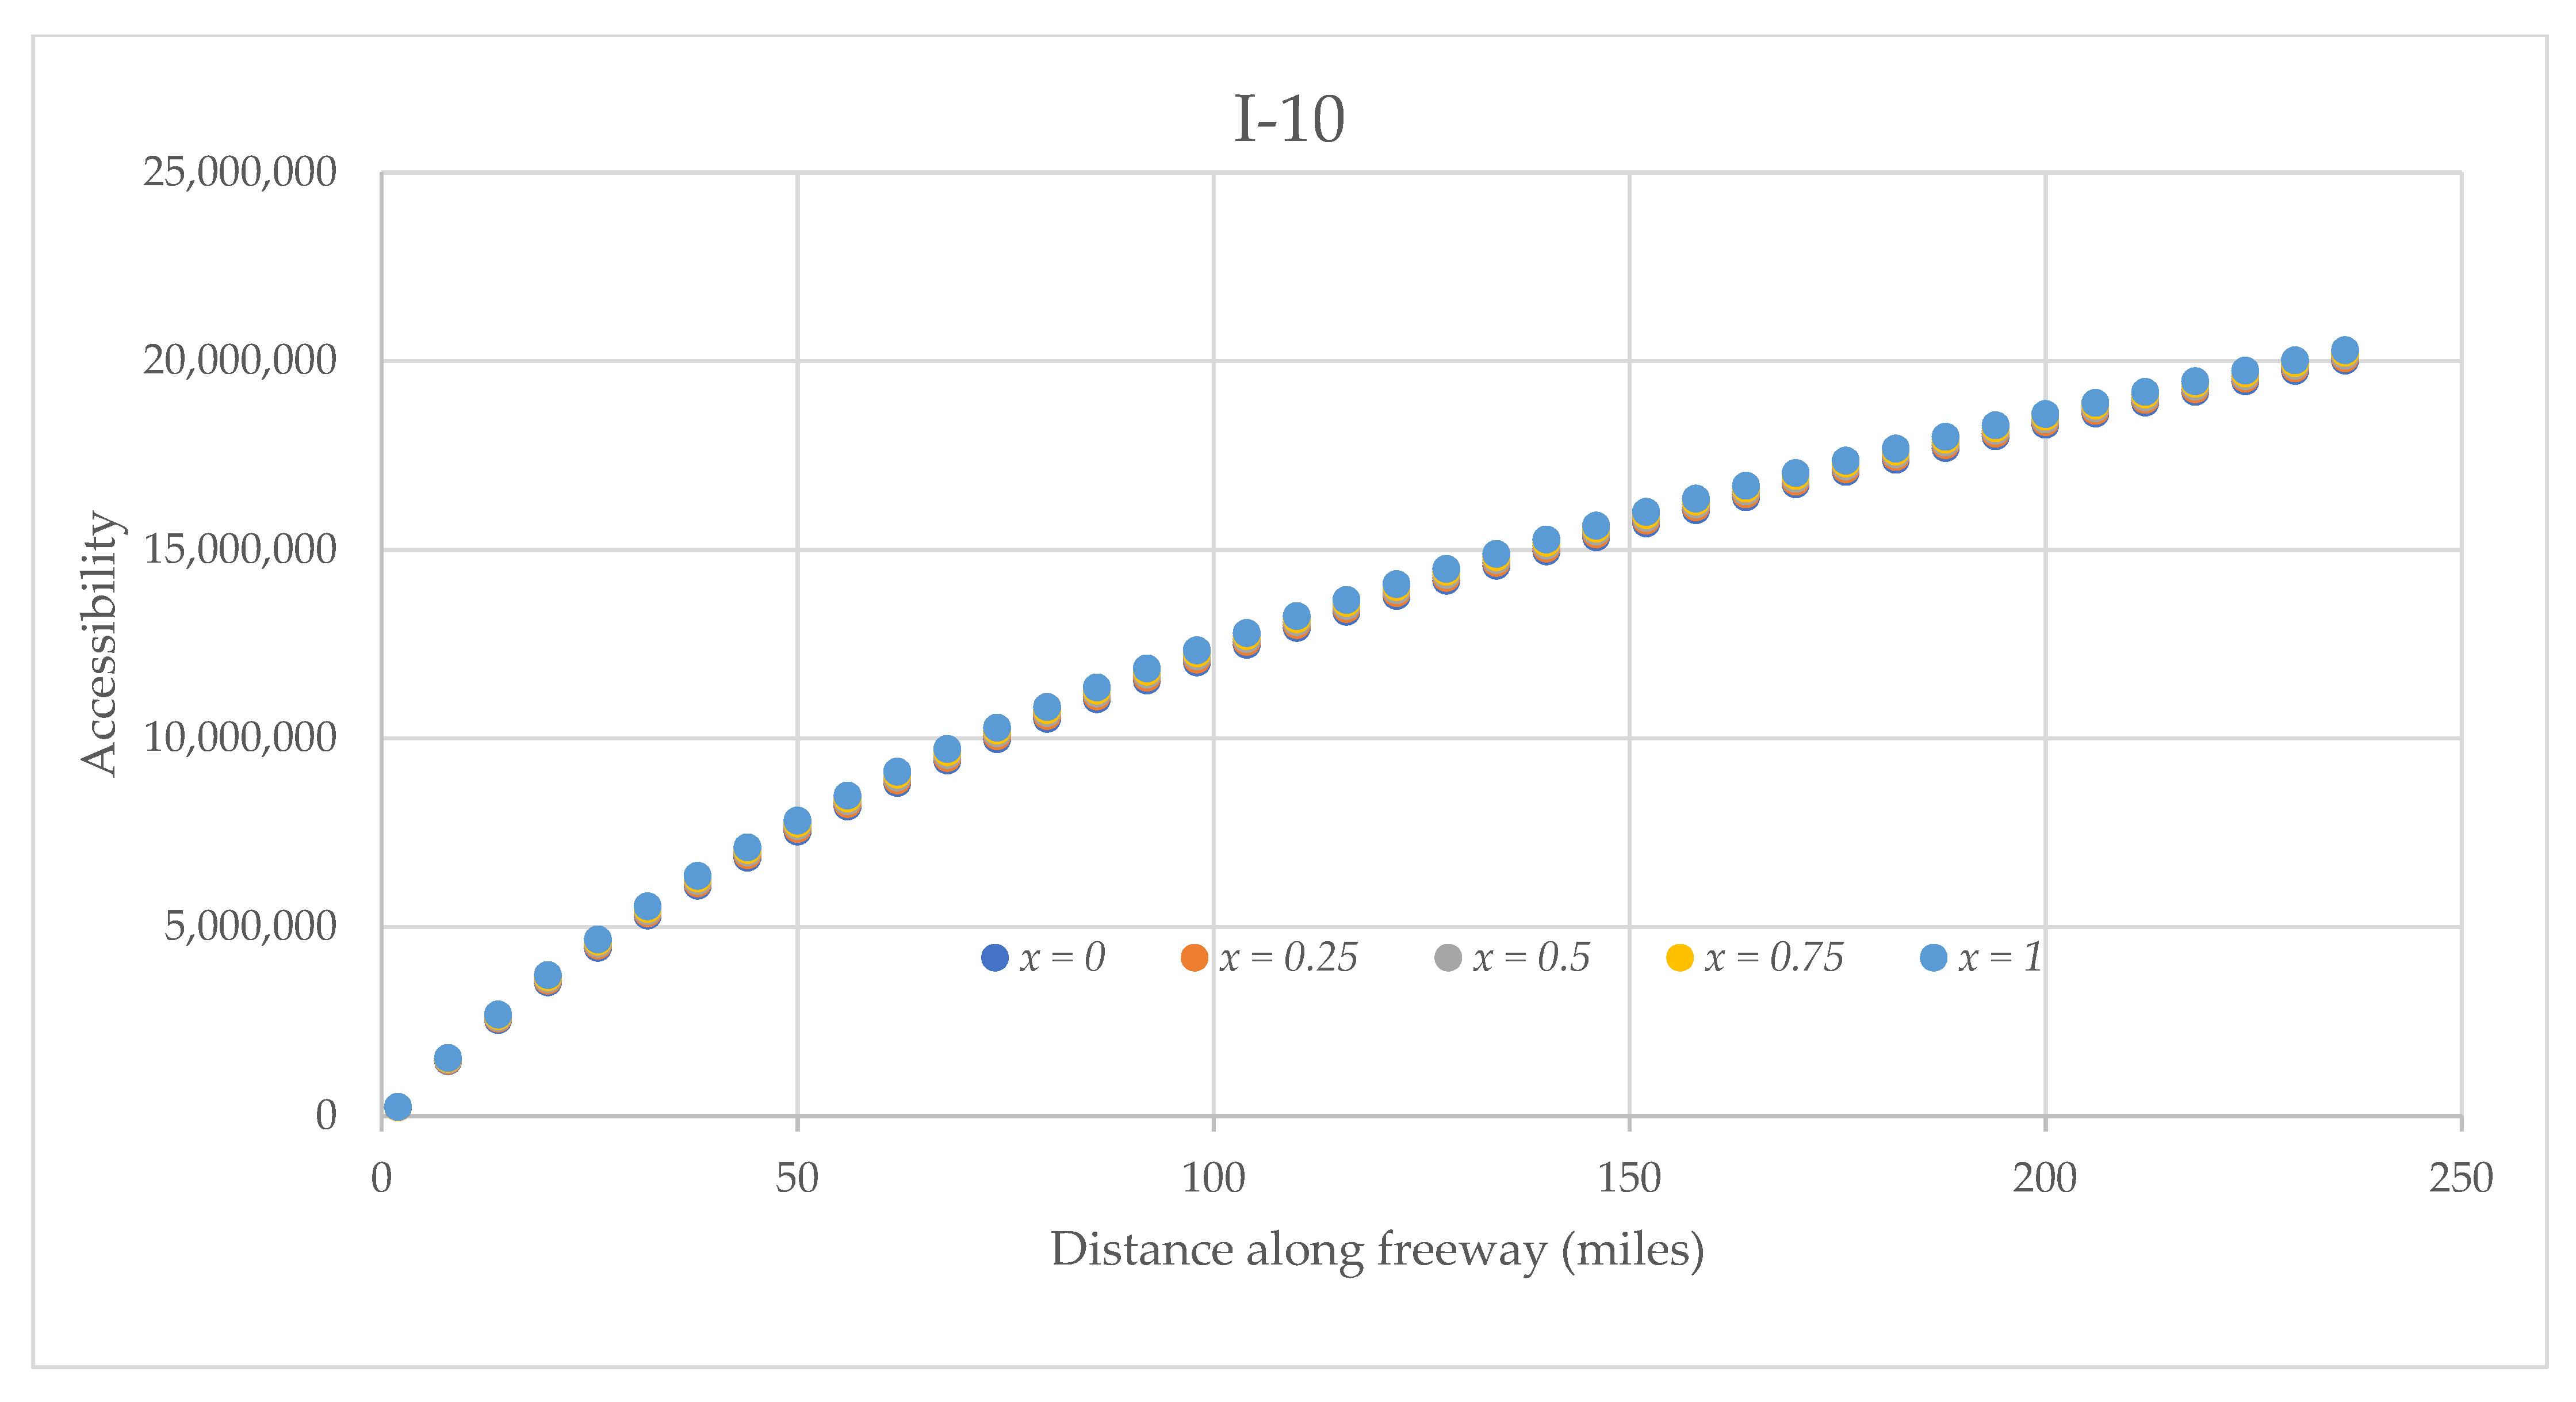
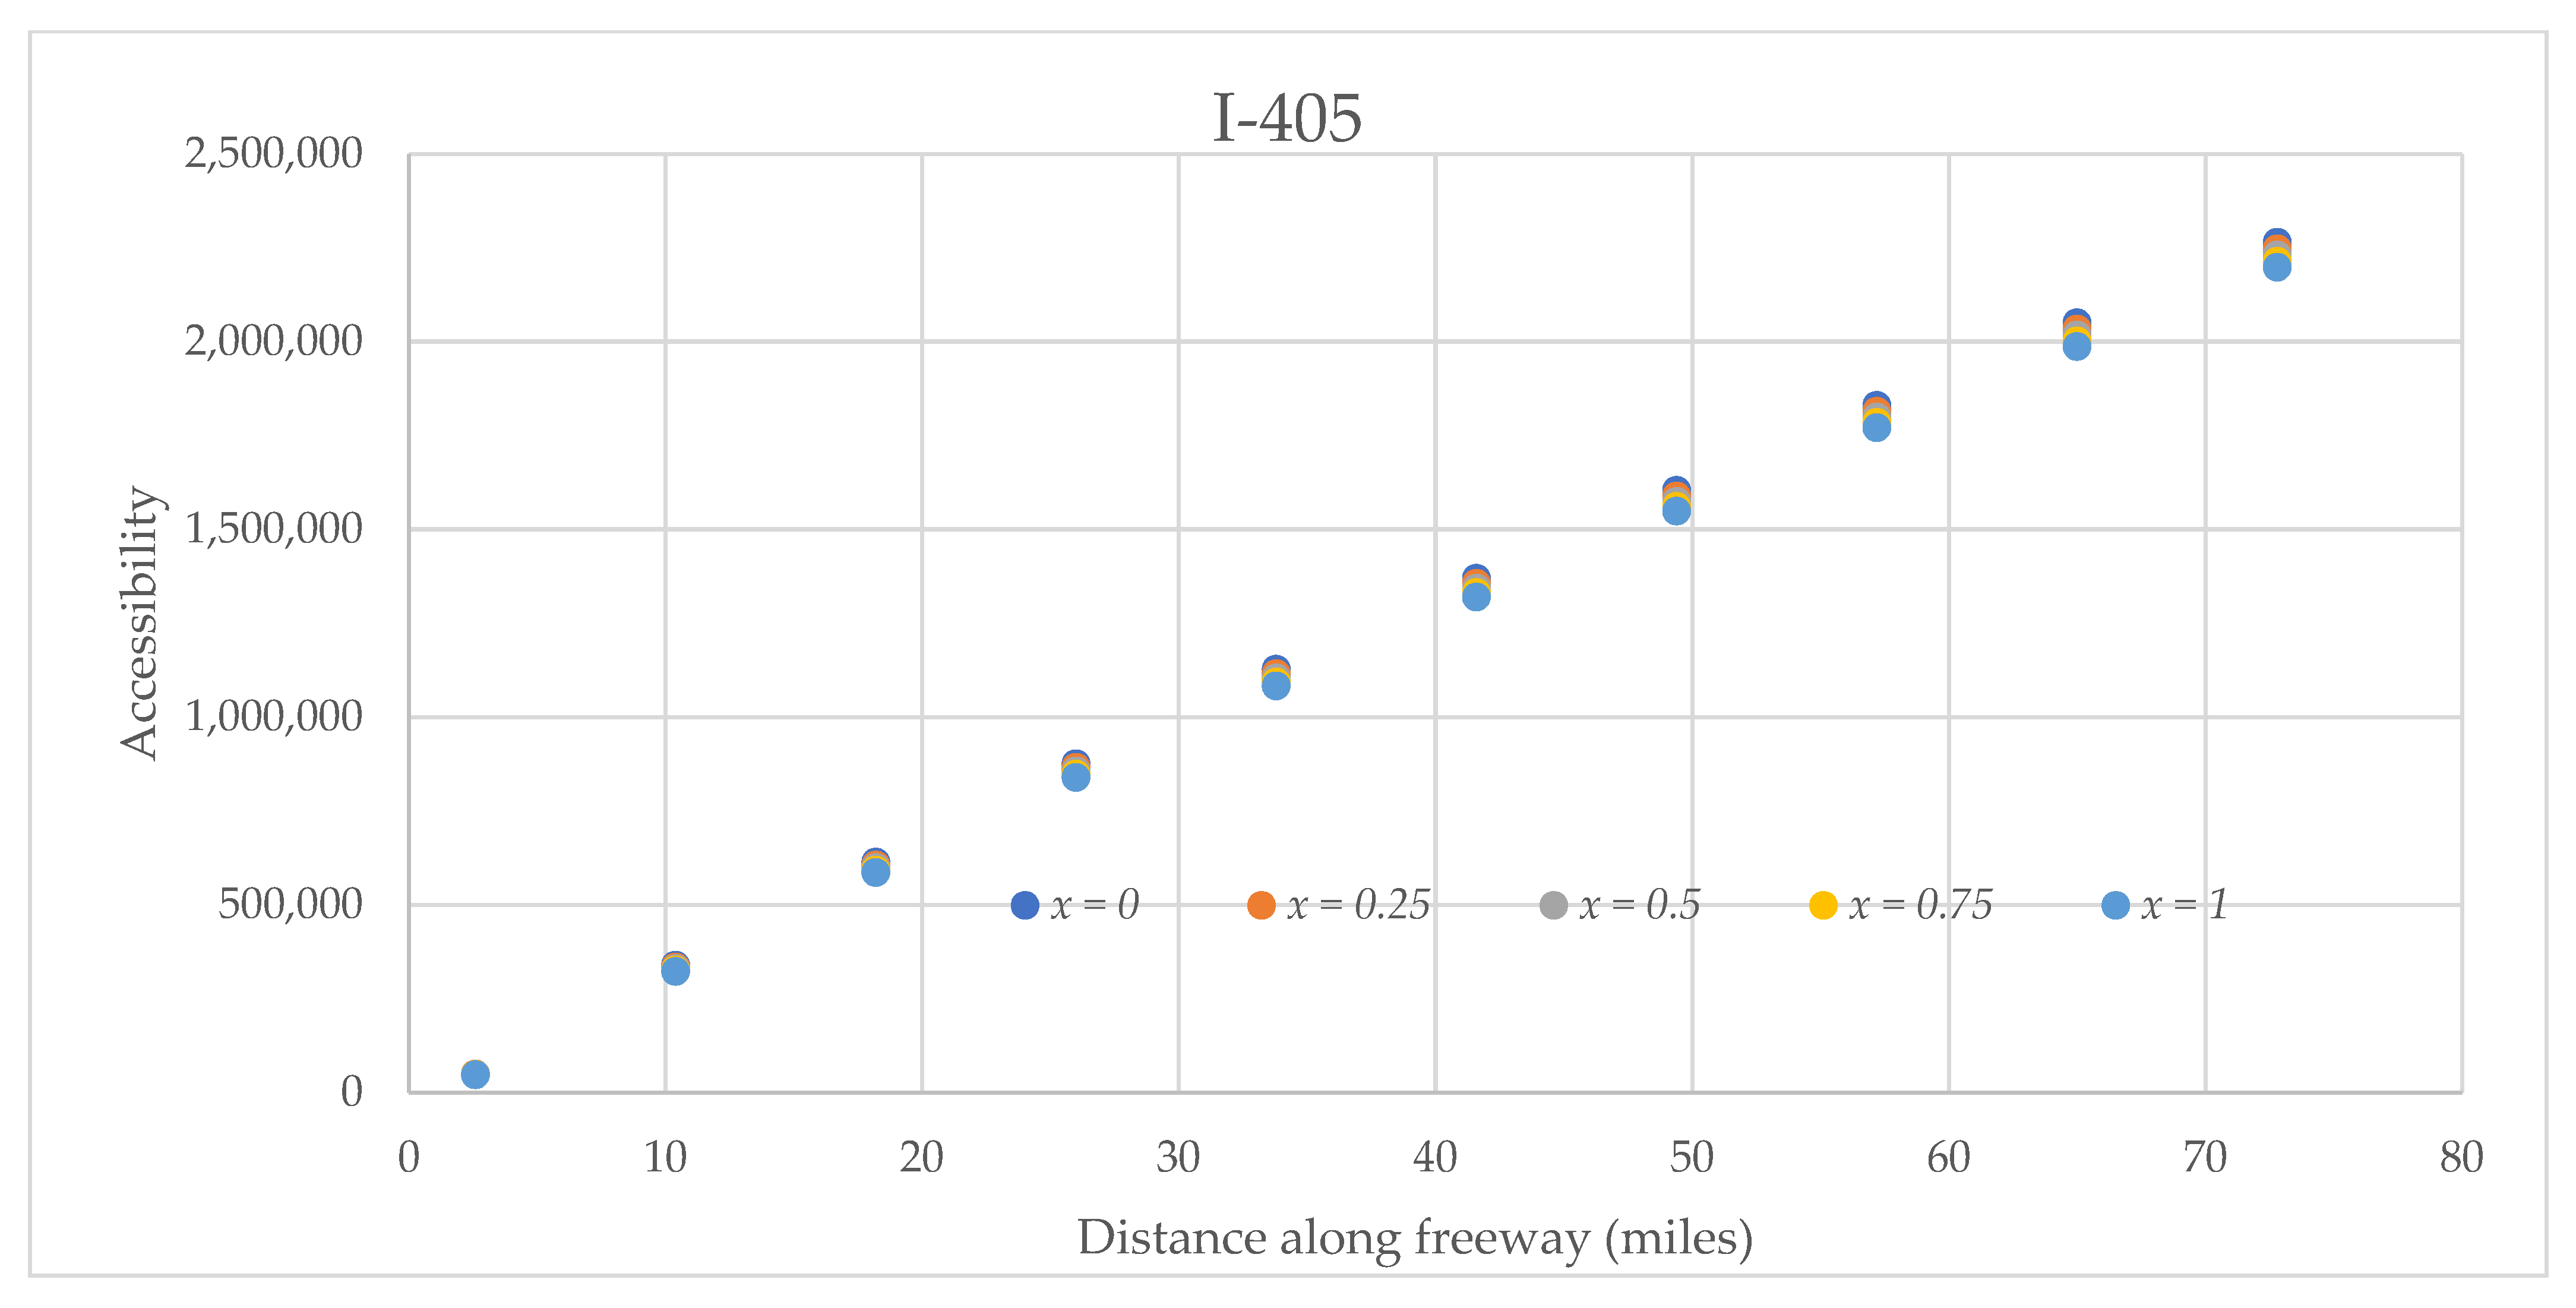
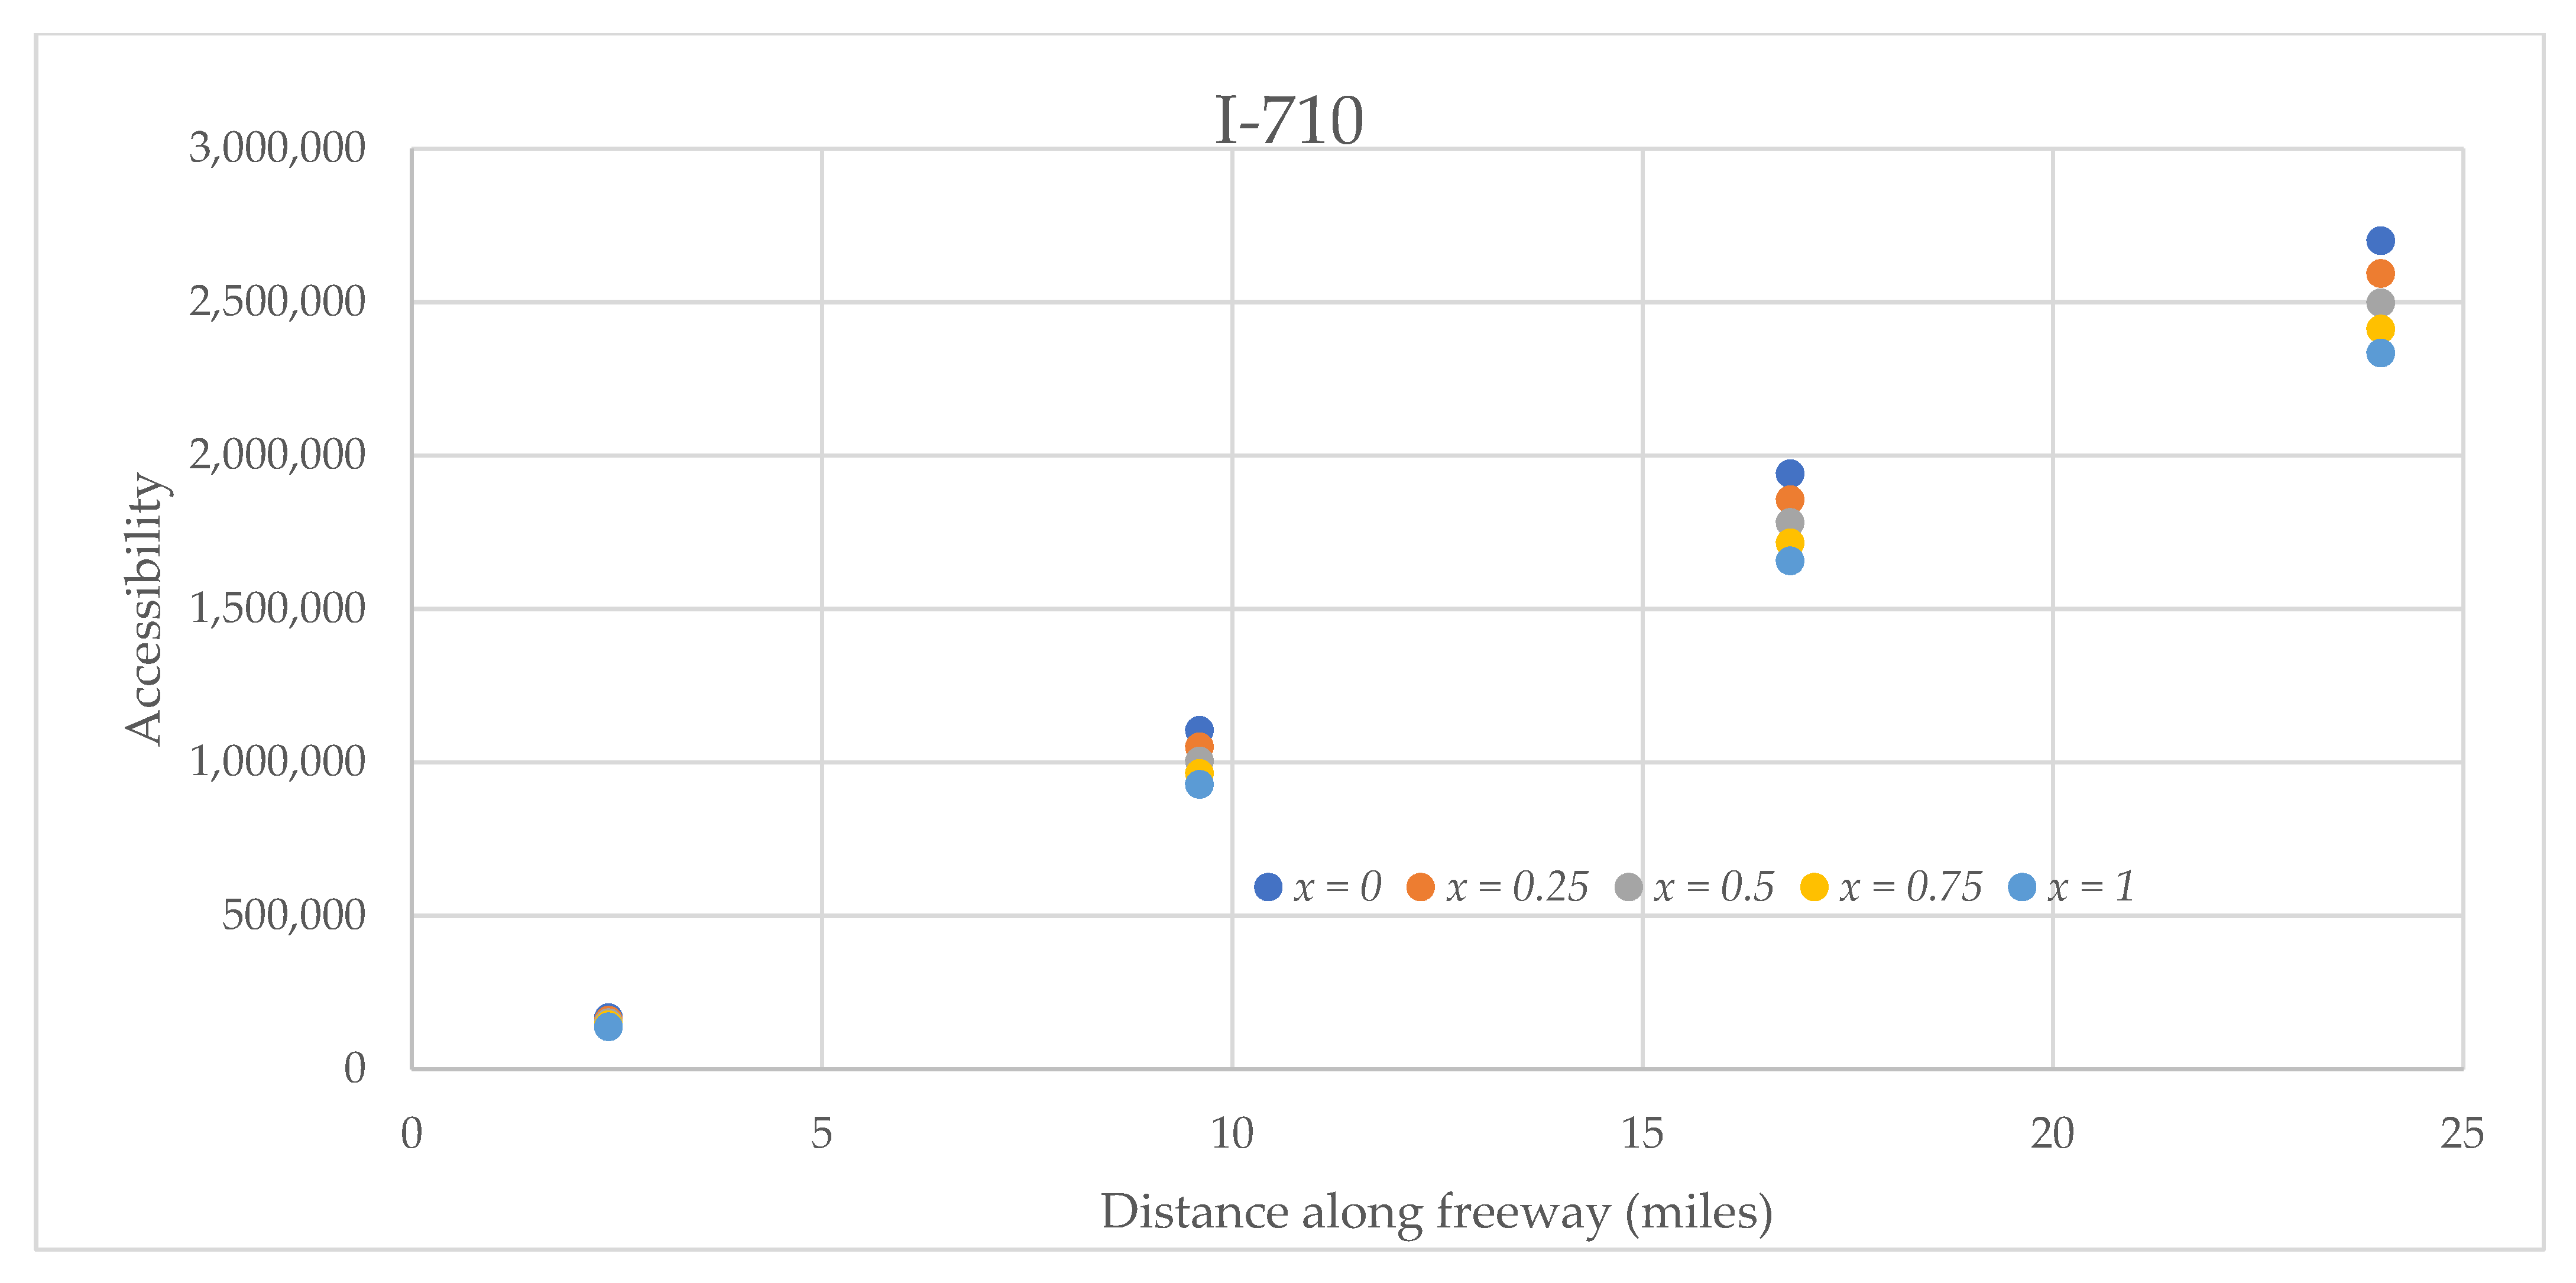
Freight truck platoon accessibility is shown by charts in Figure 12, Figure 13, Figure 14 and Figure 15 for each of the four interstates. Accessibility varies with an increase in distance traveled on each interstate, irrespective of the direction of the freight truck’s travel.
Five different values of non-detour probabilities x (=0, 0.25, 0.5, 0.75, and 1.0) were used to compare the accessibility of freight truck platoon considering detour possibilities. A low value of x = 0 would indicate that a truck would detour from its path due to downstream congestion. In contrast, a high value of x = 1 would suggest that the truck would continue to travel on its path, considering no congestion on the entire route.
Accessibility plots for a truck platoon with route deviations on the four freeways show that, in the case of I-5, accessibility increases for the initial 165 miles, around ramp location 150, attains a maximum there, and starts to drop after. This is observed in Figure 12. For the other three freeways, I-10, I-405, and I-710, accessibility continuously increases for their lengths and the number of ramps considered. These are shown in Figure 12, Figure 13, Figure 14 and Figure 15. Therefore, as the truck platoon moves along I-10, I-405, and I-710 with possible route deviations to avoid congestion points on their paths, accessibility would continue to increase.
Various detour/non-detour probabilities impact the accessibility of the four interstates for truck platoon differently, as observed in Figure 12, Figure 13, Figure 14 and Figure 15. The accessibilities of the interstates I-5 and I-10 increase with an increase in non-detour probabilities, i.e., (1 − x). On the other hand, for both I-405 and I-710, accessibilities decrease with an increase in non-detour probabilities. These observations could result from the impacts combined due to the magnitude of tonnage, decay parameters, and the average route deviations considered.
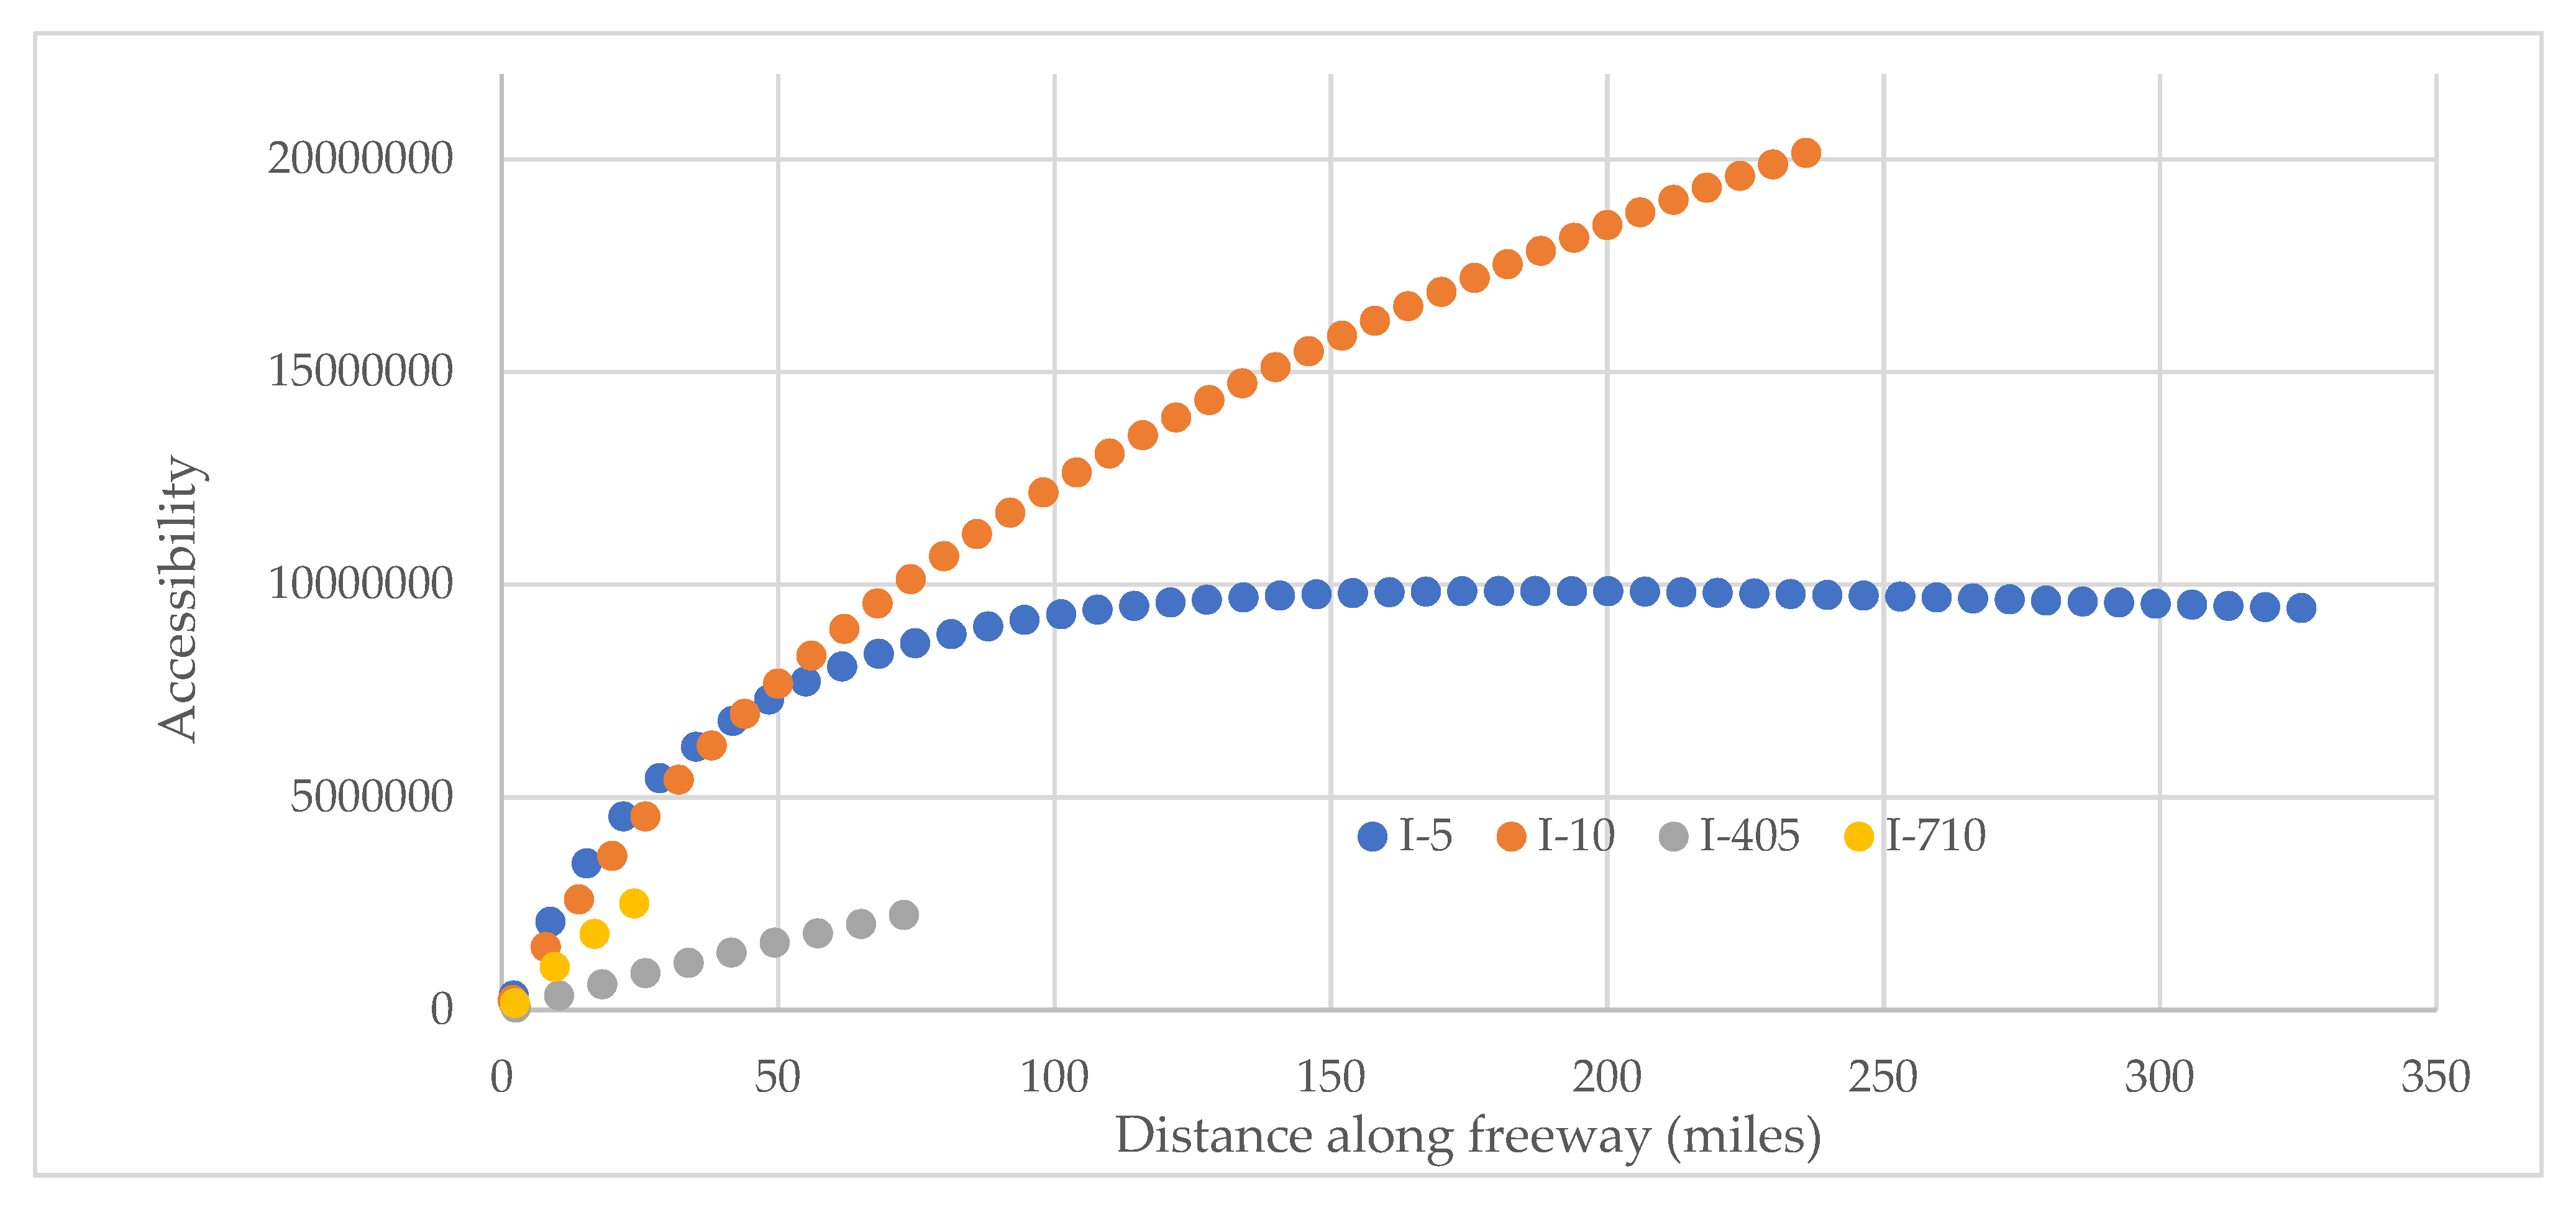
As observed from Figure 16, findings show along the length of the four freeways considered with route deviation percentage, x = 0.5, accessibility of I-5 for up to 50 miles of distance, is the highest among the four freeways considered. This occurs due to the fractional value of the decay parameter for I-10, I-405, and I-710. The accessibility of I-5 starts to decrease after reaching a peak at 165 miles distance and has been shown for up to 325 miles only for comparison purposes. Beyond the 50-mile distance observation for the freeways, the accessibility of I-10 is the highest among all four freeways. This results from a high average tonnage that moves on I-10 and causes accessibility to increase in magnitude after the 50-mile distance.
The above findings have important implications for shippers and carriers who anticipate utilizing truck platoon strategies for commodity and goods movement within and outside California (via I-10 that stretches to other states of the USA). As noted from the I-10 example, the higher the tonnage movement on a freeway, the higher the accessibility of the platoon route will be. However, this could happen only when the increase in tonnage (translated to truck volumes) does not cause an increase in congestion (and, hence, impedance) on the route. An increase in impedance due to an increase in congestion would result in lowering accessibility, rendering tonnage movement inefficient.
6. Conclusions
Freight truck operations are crucial for the economic growth of a country. Truck platooning promotes the efficient movement of trucks adds to environmental sustainability by reducing fuel consumption and emissions. There is a thrust by various stakeholders, including private and public agencies, to test and deploy truck platoon for operations—in all of these efforts, access to destination is the essential focus. This paper develops an accessibility measure of the truck platoon, considering the possibility of detours to destinations. We did not consider a graph theory approach for describing the network setup—since our network was elementary, consisting of a contiguous set of segments and nodes upon which a probabilistic route deviation model was built.
Trucks in a platoon can detour based on a probability value built into the accessibility formula developed in this paper. The probability for detours can determine how likely a truck would detour from its original route and use an exit ramp to maximize its accessibility to the destination. This can guide carriers to move their truck fleet in a platoon and choose a suitable exit ramp to detour to avoid congestions, with an assumed detour probability.
In this paper, the proposed accessibility formula for freight truck platoon is demonstrated by using the four popular truck routes from California. These truck routes are the freeways of I-5, I-10, I-405, and I-710. These interstates connect intermodal terminals and ports in California. It is found that accessibility with truck platooning on I-5 increases for the initial 165 miles, attains a maximum there, and starts to drop after. The other three freeways, I-10, I-405, and I-710, show a continuous increase in accessibility for their lengths and the number of ramps considered. The findings can have significant implications in determining the selection of freeway routes that could be considered for truck platoons.
Based on research findings, non-detour probability impacts accessibility for freight trucks moving in a platoon to a destination. If an advanced relay of information on downstream congestion is available, one or more trucks in a platoon can avoid a congestion point on the path. In this paper, it is observed that a detour probability could be used to guide a truck in the platoon in terms of whether to continue to travel on its original path or to take a detour. If the value of the detour probability is close to zero, it would mean that the truck could detour to avoid a downstream congested link. Otherwise, the detour probability of one will mean avoiding the congestion point entirely by using the access/frontage road to its path if on a freeway.
The accessibility formulation presented in this paper can be made time-sensitive with a varying value of link travel times. Thus, the accessibility to a destination would vary temporally during the day. Analytical results in this paper show that, for a truck to use an exit ramp for detour possibly dictated using CVT, accessibility can be maximized. The closed-form expression for freight truck platoon accessibility can be further used to design an efficient multimodal freight network system for trucks, especially on routes where truck-only lanes could be feasible.
The limitation of this research is that the distance between two on-ramps that make up accessibility formulation has been assumed to be an average/constant value for the length of the freeway considered. This may not always be true and could impact the magnitude of the measured accessibility. Therefore, the accessibility measure can be enhanced by analyzing a truck platoon path using the actual value for the distance between two on-ramps. However, this will require simulation, which could be time consuming.
Our future research aims to examine the application of the accessibility developed in this paper in freight traffic assignment problems. With truck detours while platooning, the impact of congestion will be studied on adjacent roads of the transportation network. Such a study’s outcomes will help finetune the accessibility formulation for utility in four-step travel demand modeling.
Author Contributions
Conceptualization, S.C.; methodology, S.C.; literature review, S.C. and T.T.; formal analysis, S.C. and T.T.; writing—original draft preparation, S.C.; writing—review and editing, S.C.; visualization, S.C.; supervision, S.C.; project administration, S.C. All authors have read and agreed to the published version of the manuscript.
Funding
This research received no external funding.
Institutional Review Board Statement
Not applicable.
Informed Consent Statement
Not applicable.
Data Availability Statement
Data used can be found at FAF4 Network Database and Flow Assignment: 2012 and 2045, Freight Analysis Framework (FAF), Federal Highway Administration, United States Department of Transportation, https://ops.fhwa.dot.gov/freight/freight_analysis/faf/faf4/netwkdbflow/index.htm (accessed on 2 July 2020).
Conflicts of Interest
The authors declare no conflict of interest.
Appendix A
Appendix A.1. Derivation for Impedance
The expected travel time used as a notation for impedance from exit ramp A to on-ramp B is derived for n number of ramps, as follows.
Case 1: For n = 2, we have the following.
In this case, there is only one freeway segment between A (i.e., point 1) to B (i.e., point 2), and congestion can only occur on this segment between these two end points.
Case 2: For n = 3, if the detour occurs at ramp 1, the expected travel time from point A to B is , and for detour at ramp 2, the expected travel time from point A to point B is ; thus, we have the following.
Case 3: For n = 4, we have the following.
Similarly, for , the following is obtained.
Appendix A.2. Derivation of Optimal Accessibility
First and Second derivatives of accessibility AB with respect to n provides the following.
Substituting the value of in the second derivative, we obtain the following.
Appendix A.3. Maximum Freight Truck Accessibility
By substituting the expression for , we have the following.
References
- Vadali, S.; Chandra, S. Supply Chain–Consistent Threshold Accessibility Measures for Megaregion Economic Development. Transp. Res. Rec. 2014, 2453, 37–45. [Google Scholar] [CrossRef]
- FAST Act Factsheet, U.S. Department of Transportation. Available online: https://www.transportation.gov/fastact/freight-factsheet (accessed on 20 March 2016).
- The Integrated Truck Program, Intelligent Transportation Systems Joint Program Office, U.S. Department of Transportation. Available online: http://www.its.dot.gov/presentations/pdf/Integrated_Truck_Program.pdf (accessed on 20 March 2016).
- Volvo Trucks USA. 2019. Available online: https://www.volvotrucks.us/news-and-stories/press-releases/2018/june/volvo-trucks-and-fedex-successfully-demonstrate-truck-platooning-on-nc-540/ (accessed on 31 March 2019).
- Chandra, S.; Jimenez, J.; Nguyen, A.; Iniguez, L. Evaluating Economic Mobility and Resilience of Multimodal Freight Operations in a Connected Vehicle Environment, METRANS Report No. TO 018.2. 2018. Available online: https://trid.trb.org/view/1575927 (accessed on 7 December 2021).
- Chandra, S.; Camal, F. A simulation-based evaluation of connected vehicle technology for emissions and fuel consumption. Procedia Eng. 2016, 145, 296–303. [Google Scholar] [CrossRef] [Green Version]
- Rutter, A.; Aldrete, R.; Middleton, D.; Morgan, C.; Balke, K.; Kuhn, B.; Seymour, E.; Macias, R.; Jensen, M.; Stock, D. Interstate 10 Western Connected Freight Corridor, Volume 1: Improvement Strategies; Department of Transportation: Phoenix, AZ, USA, 2019.
- Janssen, G.; Zwijnenberg, J.; Blankers, I.; de Kruijff, J. Truck Platooning: Driving the Future of Transportation. Report 523175. 2015. Available online: https://repository.tudelft.nl/view/tno/uuid:778397eb-59d3-4d23-9185-511385b91509 (accessed on 25 March 2019).
- Bhoopalam, A.K.; Agatz, N.; Zuidwijk, R. Planning of truck platoons: A literature review and directions for future research. Transp. Res. Part B Methodol. 2018, 107, 212–228. [Google Scholar] [CrossRef] [Green Version]
- Alam, A.; Besselink, B.; Turri, V.; Mårtensson, J.; Johansson, K.H. Heavy-Duty Vehicle Platooning for Sustainable Freight Transportation: A Cooperative Method to Enhance Safety and Efficiency. IEEE Control Syst. Mag. 2015, 35, 34–56. [Google Scholar]
- Scora, G.; Barth, M. Comprehensive modal emissions model (cmem), version 3.01. User guide. Centre for environmental research and technology. University of California. Riverside 2006, 1070, 79. [Google Scholar]
- Shladover, S.E.; Nowakowski, C.; Lu, X.-Y.; Ferlis, R. Cooperative adaptive cruise control: Definitions and operating concepts. Transp. Res. Rec. 2015, 2489, 145–152. [Google Scholar] [CrossRef]
- Sokolov, V.; Larson, J.; Munson, T.; Auld, J.; Karbowski, D. Maximization of platoon formation through centralized routing and departure time coordination. Transp. Res. Rec. 2017, 2667, 10–16. [Google Scholar] [CrossRef]
- Boysen, N.; Briskorn, D.; Schwerdfeger, S. The identical-path truck platooning problem. Transp. Res. Part B Methodol. 2018, 109, 26–39. [Google Scholar] [CrossRef]
- Maiti, S.; Winter, S.; Kulik, L. A conceptualization of vehicle platoons and platoon operations. Transp. Res. Part C Emerg. Technol. 2017, 80, 1–19. [Google Scholar] [CrossRef]
- Kavathekar, P.; Chen, Y. Vehicle platooning: A brief survey and categorization. In Proceedings of the International Design Engineering Technical Conferences and Computers and Information in Engineering Conference, St. Louis, MO, USA, 16–19 August 2020; Volume 54808, pp. 829–845. [Google Scholar]
- Hjälmdahl, M.; Krupenia, S.; Thorslund, B. Driver behaviour and driver experience of partial and fully automated truck platooning–a simulator study. Eur. Transp. Res. Rev. 2017, 9, 8. [Google Scholar] [CrossRef] [Green Version]
- Tsugawa, S.; Jeschke, S.; Shladover, S.E. A Review of Truck Platooning Projects for Energy Savings. IEEE Trans. Intell. Veh. 2016, 1, 68–77. [Google Scholar] [CrossRef]
- Truck Platooning, Federal Motor Carrier Safety Administration, United States Department of Transportation. 2018. Available online: https://www.fmcsa.dot.gov/sites/fmcsa.dot.gov/files/docs/safety/395146/loftus-tershak-truck-platooning-final-508c.pdf (accessed on 31 March 2019).
- Bibeka, A.; Songchitruksa, P.; Zhang, Y. Assessing environmental impacts of ad-hoc truck platooning on multilane freeways. J. Intell. Transp. Syst. 2021, 25, 281–292. [Google Scholar] [CrossRef]
- Browne, M.; Macharis, C.; Sanchez-Diaz, I.; Brolinson, M.; Billsjö, R. Urban traffic congestion and freight transport: A comparative assessment of three European cities. In Proceedings of the Interdisciplinary Conference on Production, Logistics and Traffic, Darmstadt, Germany, 25–26 September 2017; pp. 25–26. [Google Scholar]
- Comtois, C.; Slack, B. The Geography of Transport Systems; Routledge: London, UK, 2009. [Google Scholar]
- Vis, I.F.; De Koster, R. Transshipment of containers at a container terminal: An overview. Eur. J. Oper. Res. 2003, 147, 1–16. [Google Scholar] [CrossRef]
- Simoni, M.D.; Claudel, C.G. A fast simulation algorithm for multiple moving bottlenecks and applications in urban freight traffic management. Transp. Res. Part B Methodol. 2017, 104, 238–255. [Google Scholar] [CrossRef]
- Fowkes, A.S.; Firmin, P.E.; Tweddle, G.; Whiteing, A.E. How highly does the freight transport industry value journey time reliability—and for what reasons? Int. J. Logist. Res. Appl. 2004, 7, 33–43. [Google Scholar] [CrossRef]
- Khalili, F.B.; Antunes, A.P.; Mohaymany, A.S. Evaluating interregional freight accessibility conditions through the combination of centrality and reliability measures. J. Transp. Geogr. 2020, 83, 102665. [Google Scholar] [CrossRef]
- Chandra, S.; Jimenez, J.; Radhakrishnan, R. Accessibility evaluations for nighttime walking and bicycling for low-income shift workers. J. Transp. Geogr. 2017, 64, 97–108. [Google Scholar] [CrossRef]
- Geurs, K.T.; van Wee, B. Accessibility evaluation of land-use and transport strategies: Review and research directions. J. Transp. Geogr. 2004, 12, 127–140. [Google Scholar] [CrossRef]
- Gonzalez-Feliu, J.; Grau, J.M.S.; Beziat, A. A location-based accessibility analysis to estimate the suitability of urban consolidation facilities. Int. J. Urban Sci. 2014, 18, 166–185. [Google Scholar] [CrossRef]
- Heuvel, F.P.V.D.; Rivera, L.; van Donselaar, K.H.; de Jong, A.; Sheffi, Y.; de Langen, P.W.; Fransoo, J.C. Relationship between freight accessibility and logistics employment in US counties. Transp. Res. Part A Policy Pract. 2014, 59, 91–105. [Google Scholar]
- Chandra, S.; Vadali, S. Evaluating accessibility impacts of the proposed America 2050 high-speed rail corridor for the Appalachian Region. J. Transp. Geogr. 2014, 37, 28–46. [Google Scholar] [CrossRef]
- Evans, J.L.; Elefteriadou, L.; Gautam, N. Probability of breakdown at freeway merges using markov chains. Transp. Res. Part B Methodol. 2001, 35, 237–254. [Google Scholar] [CrossRef]
- Chandra, S.; Nguyen, A. Freight truck emissions reductions with connected vehicle technology: A case study with I-710 in California. Case Stud. Transp. Policy 2020, 8, 920–927. [Google Scholar] [CrossRef]
- Trade Corridor Enhancement Program (TCEP), California Transportation Commission (CTC). Available online: https://catc.ca.gov/programs/sb1/trade-corridor-enhancement-program (accessed on 7 December 2021).
- Caltrans. 2019. Available online: https://dot.ca.gov/-/media/dot-media/programs/legislative-affairs/documents/2019-truck-platooning-testing-report-a11y.pdf (accessed on 7 December 2021).
- Caltrans GIS Data. Available online: http://www.dot.ca.gov/hq/tsip/gis/datalibrary/ (accessed on 16 June 2018).
- Freight Analysis Framework (FAF), United States Department of Transportation (USDOT). Available online: https://ops.fhwa.dot.gov/freight/freight_analysis/faf/ (accessed on 11 December 2021).
- FAF4 Network Database and Flow Assignment: 2012 and 2045, Freight Analysis Framework (FAF), Federal Highway Administration, United States Department of Transportation. Available online: https://ops.fhwa.dot.gov/freight/freight_analysis/faf/faf4/netwkdbflow/index.htm (accessed on 2 July 2020).
Figure 1.
Tonnage variation across I-710 in California, USA.

Figure 2.
Setup for travel time (impedance) determination.

Figure 3.
Detour from exit ramp 1 to join freeway by using on-ramp 2.

Figure 4.
Three possible paths with for two links and three ramps, n = 3.

Figure 5.
Six possible paths with for three links and four ramps, n = 4.

Figure 6.
Probability variation with the number of ramps in the route segment (A)–(B).

Figure 7.
Percentage difference between p1,j and pi,j with i > 1.

Figure 8.
Accessibility variation with distance and number of ramps along the freight route.

Figure 9.
I-710 with possible truck route deviations.

Figure 10.
Comparison of simulation and theoretical travel times with non-detour probabilities.

Figure 11.
Example interstates (truck routes) analyzed for accessibility.

Figure 12.
Variation of accessibility with number of exit ramps for I-5.

Figure 13.
Variation of accessibility with number of exit ramps for I-10.

Figure 14.
Variation of accessibility with number of exit ramps for I-405.

Figure 15.
Variation of accessibility with number of exit ramps for I-710.

Figure 16.
Accessibility variation of freeways with distance for 50% route deviation.


Table 1.
Accessibility maximization with n (i.e., number of off-ramp exits on a freeway).
| Decay Factor (β) | Maximum Freight Route Accessibility (AB) | n * (i.e., Optimal n for Maximum Accessibility) |
|---|---|---|
Table 2.
Input values to calculate accessibility.
| Interstate | Origin Point | Destination Point | Average Length of Route Considered, L (Miles) | Average Width of Route Deviation, W (Miles) | Average Distance between On/Off Ramps, d (Miles) | Decay Parameter, β | Average Tonnage, g (kton/Year/Section) |
|---|---|---|---|---|---|---|---|
| I-5 | A | B | 798 | 6.8 | 1.1 | 1.3 | 32,236 |
| I-10 | C | D | 241 | 5.6 | 1 | 0.6 | 75,882 |
| I-405 | E | F | 73 | 4.4 | 1.3 | 0.3 | 29,227 |
| I-710 | G | H | 24 | 2.6 | 1.2 | 0.5 | 59,832 |
Publisher’s Note: MDPI stays neutral with regard to jurisdictional claims in published maps and institutional affiliations. |
© 2022 by the authors. Licensee MDPI, Basel, Switzerland. This article is an open access article distributed under the terms and conditions of the Creative Commons Attribution (CC BY) license (https://creativecommons.org/licenses/by/4.0/).
Share and Cite
MDPI and ACS Style
Chandra, S.; Thai, T. Analyzing Freight Truck Platoon Accessibility with Route Deviations. Sustainability 2022, 14, 2130. https://0-doi-org.brum.beds.ac.uk/10.3390/su14042130
AMA Style
Chandra S, Thai T. Analyzing Freight Truck Platoon Accessibility with Route Deviations. Sustainability. 2022; 14(4):2130. https://0-doi-org.brum.beds.ac.uk/10.3390/su14042130
Chicago/Turabian StyleChandra, Shailesh, and Timothy Thai. 2022. "Analyzing Freight Truck Platoon Accessibility with Route Deviations" Sustainability 14, no. 4: 2130. https://0-doi-org.brum.beds.ac.uk/10.3390/su14042130
Note that from the first issue of 2016, this journal uses article numbers instead of page numbers. See further details here.