
A Framework to Evaluate the Social Life Cycle Impact of Products under the Circular Economy Thinking


1
Department of Mineral Resources Engineering, University of Western Macedonia, Koila, 50100 Kozani, Greece
2
Laboratory of Environmental Engineering and Management, School of Chemical and Environmental Engineering, Technical University of Crete, 73100 Chania, Greece
3
Business Economics and Environmental Technology Laboratory, Department of Environmental Engineering, Democritus University of Thrace, Vas. Sofias, 12, 67100 Xanthi, Greece
*
Author to whom correspondence should be addressed.
Sustainability 2022, 14(4), 2196; https://0-doi-org.brum.beds.ac.uk/10.3390/su14042196
Submission received: 21 December 2021
/
Revised: 5 February 2022
/
Accepted: 11 February 2022
/
Published: 15 February 2022
(This article belongs to the Special Issue Social Sustainability)
Abstract
:Today, the circular economy is regarded as a promising alternative for modern economies to preserve “virgin” natural resources for future generations by valorizing waste materials. The concept is also used to promote the goals of sustainable development, where, apart from the environmental dimension, the economic and social dimensions are also integrated. So far, the largest part of the related research has emphasized the environmental and economic dimensions, while little attention has been paid to the social dimension of circular economy. Thus, this paper develops a framework to evaluate the social impacts of circular products and materials throughout their life cycle, which is based on social life thinking, circular economy principles and strategies and social responsibility principles. Moreover, computational examples are presented to show the functionality and applicability of the proposed framework. Finally, critical points for future research are pinpointed in order to assist scholars in applying and improving such frameworks through case studies, helping them to better understand the social aspects of circular economy.
1. Introduction
The concept of circular economy (CE) has gained great recognition from many scholars and practitioners over the last few decades [1,2,3] as an effective tool, method, technique and theory to achieve win–win solutions, such as economic opportunities and environmental protection [4,5,6,7,8]. The main goal of CE is to shift the focus of the current production system from the linear logic of “take, produce, consume and dispose” to “close the loop”, where the end-of-life products return to the production stage and interventions are made throughout the technical or biological cycles of materials. A large part of the international literature has focused on CE’s ability to contribute to sustainable development [9,10]. Particularly, studies have analyzed how and when the concept of CE is able to contribute to economic development, environmental preservation and social cohesion [11,12]. Though the current literature places great emphasis on the environmental and economic dimensions, there is limited research on the social dimension [2,13,14].
The social dimension of CE has been examined by Padilla-Rivera et al. [15] through Social Life Cycle Analysis, which comprises four thematic social areas, namely, labor practices and decent work, human rights, society, and product responsibility, and they identified that 49% of the reviewed articles focused on society and employment aspects. Moreau et al. [16] pointed out the opportunity for institutions and the social economy to promote CE principles mainly to protect natural resources, rather than to maximize their profits. In a similar context, Mies and Gold [17] examined the social aspects of CE at three levels, and their results showed that at the micro-, meso- and macro-levels, the emphasis is on consumers, employees and society, respectively.
Furthermore, many of the current studies have analyzed the most appropriate procedures and favorable conditions that are able to facilitate scholars to introduce social aspects into the concept of CE [18]. Although such studies provide detailed and valuable information and guidance to scholars, there are still weak points in terms of practicability in daily applications at the product level. To make clearer and more practicable the social dimension, this article develops a methodological framework to facilitate the assessment of the social aspects of CE throughout the life cycle of a product, to overcome the gap in the related literature and to introduce social aspects into CE thinking. The lack of commonly accepted frameworks to provide comparative information regarding the social dimension of CE is why the suggested framework is based on standard guidelines and ideas, such as the Social Life Cycle Analysis (S-LCA) of a product and Global Reporting Initiative (GRI) guidelines. These guidelines aim at developing an operational and practical framework that can assess the social footprints of products under the concept of CE. Additionally, the choice of methodology was based on the relevant literature on composite indicators, as the aim was to calculate the final degree of social impact of products produced following CE principles. These techniques follow some basic steps to define specific indicators, normalize different types of measurements and synthesize the indicators into a final measurement [19,20]. The usefulness and practicality of the proposed index is tested with some computational examples, as is the standard international practice for this type of survey [21,22]. Three experts in the field were selected to rate the importance of the indicators and to highlight the key points of the proposed index to assess the social aspects of business and product circularity. The findings of the computational examples indicate the important issues in product circularity. Good examples and critical points are presented, allowing product designers, managers and scholars to focus on improving both the natural environment and the economic growth of firms, but more importantly, on improving the social impacts of circular products. The novelty of this framework is based on its practicability, and the introduction of life cycle thinking, GRI guidelines and the social dimension into CE. Finally, it should be noted that the main limitation of the survey is that the data are based on the opinions of a small number of experts rather than on real data from firms, which is a good target for future research.
The rest of the paper is divided into four sections. Section 2 presents the theoretical background of the CE field and the relevant social aspects. Section 3 discusses the methodological steps used to develop the proposed framework, while Section 4 includes some computational examples of the suggested framework. The last section summarizes the main conclusions of the paper.
2. Literature Review and Theoretical Background
Today, the concept of CE is rapidly gaining popularity among scholars, think tanks, international organizations and governments. Indeed, many international organizations and institutions (e.g., European Commission, Ellen MacArthur Foundation) have suggested and discussed various policies to promote CE practices in modern societies and economies [23,24]. In addition, institutional interventions have been placed at the center of this discussion since they are considered very important in affecting the behavior of citizens and firms in relation to CE [25].
Many scholars have focused on analyzing various aspects of CE through systematic literature reviews of current studies. By this logic, Merli et al. [26] identified that the majority of the examined studies focused on cleaner production techniques to improve environmental quality and quantity throughout the life cycles of products. Similarly, Sassanelli et al. [27] showed that the key topics regarding firms and products in CE include many decision-making and management techniques, such as design for CE, LCA, Material Flow Analysis, DEA analysis, multicriteria approaches and system dynamic modeling. Furthermore, Centobelli et al. [1] highlighted the combination of key points of business models and CE topics. Finally, Geisendorf and Pietrulla [18] concluded that a classification regarding products and services would eliminate the environmental impacts at the micro and macro levels of analysis.
An equally important research topic refers to the incentives of modern society and the economy to adopt the principles of CE. As it is well known, CE is essentially a creation of political processes and normative assumptions. Consequently, dissemination of the concepts requires incentives. In particular, institutional interventions are considered very important, useful and necessary to promote CE strategies [28,29,30]. For reasons of simplicity and clarity, institutional interventions could be classified into three general categories, namely command and control, market-based, and voluntary and institutional semi-voluntary interventions [16].
The command and control interventions are related to ad hoc policies and legislations that aim at promoting the principles of CE in different market actors, such as firms and consumers (e.g., promotion of circular business models and circular consumption patterns). Particularly, some indicative examples of such interventions include legislation related to waste management and recycling (e.g., EU waste management directives), plastic materials (e.g., plastic bags EU directives) and also reuse incentives (e.g., water reuse legislation in the European Union) [31]. As for the market-based interventions, they are associated with taxes (e.g., landfill taxes, waste management taxes, wastewater taxes) and subsidies (e.g., subsidies to waste recovery), which affect the price mechanisms (e.g., demand and supply curves) creating a new context for firms and consumers and helping them to change their attitudes towards products, materials and waste materials [32,33]. The third category refers to policies that focus on supported mechanisms for promoting CE principles on a voluntary basis (e.g., through education and promotion programs) [34]. This implies that firms and consumers might voluntarily adopt CE behaviors in order to gain benefits. Environmentally responsible consumers are willing to change their consumption behaviors and habits, purchasing CE products in order to preserve natural resources, while firms adopt CE principles in order to improve their environmental profile and simultaneously strengthen their financial position (win–win solutions) [35].
Regardless of the incentive type that leads firms and consumers to change their behavior in relation to CE, the conceptual analysis of CE, the analysis of the relationship between CE and sustainability, and the social aspects of CE are interesting topics that should be examined in order to develop the suggested framework.
2.1. A Conceptual Analysis of the Circular Economy Term: A Triple Level Analysis
The concept of CE offers an alternative approach to overcome the limits of the current linear production system. In general, CE is defined as a vehicle to shift the overall economy from the classical “take–produce–dispose” production system to a “closed materials loop system” by returning to the production systems all useful waste materials. As for the definition of the concept of CE, there are numerous suggestions [18]. Kirchherr et al. [9] identified 114 definitions of the CE concept that emphasize different “Rs” (e.g., reduce, recycle, reuse). In this context, a popular definition of CE has been proposed by the Ellen MacArthur Foundation as “a restorative and a regenerative procedure which intends to retain final products, their parts, and waste materials into production processes every time” [36]. Similarly, the European Union (Directive 2008/98/EC) defines CE as processes that preserve the worth of materials in production for a long period, thus minimizing the production of waste materials. Alhawari et al. [37] identified that many of the CE definitions focus on different aspects such as recycling, eco-efficiency, the reduction of materials, regeneration, redesign, increases in the products’ lifetimes, and sustainability. This variety of definitions’ focal points could be attributed to the different school of thought, such as cradle to cradle, industrial ecology, blue economy, performance economy, biomimicry, regeneration design and natural capitalism [38].
Interestingly, Korhonen et al. [39] grouped the CE definition into two categories using the criterion of whether or not a definition is based on the EMF’s definition. They also provided their definition for CE as an “economy constructed from societal production–consumption systems that maximizes the service produced from the linear nature–society–nature material and energy throughput flow” (p. 39). A basic idea of this definition is to extend the materials’ life in a linear economy. Henry et al. [40] defined CE as “the creation of resource loops in a defined (economic) system according to the system’s underlying biophysical roots to minimize waste and pollution or maximize resource utilization” (p. 38). This definition mainly focuses on biomimicry in order to increase the product’s lifespan.
Despite the diversity of CE definitions, it is easy to examine and classify them at three socioeconomic levels. The first level is widely known as the micro level, and refers to the strategies/practices/principles adopted by a firm to transform its business model from the linear to the circular [41]. Kristensen and Mosgaard [42] collected 30 indicators regarding CE at the micro level. Such indicators emphasize remanufacturing, recycling, reusing, end-of-life products and packaging, life time extension, and efficiency of material utilization. Similarly, Barreiro-Gen and Lozano [43] identified that the sampled firms put more emphasis on CE principles, such as repair and remanufacturing. They also found that several of the firms examined were applying several of the CE principles inconsistently and without any systematic approach.
The meso level is the second level, mainly referring to the incorporation of the principles of ecology into firms’ strategic management, whereby all parts of an ecosystem are useful for the food chain and the viability of organisms [44]. In particular, Masi et al. [45] classified the closed-loop supply chain and eco-industrial parks into the meso level, which contribute to closing the loop of materials and returning them to the production stage. Alvarez and Ruiz-Puente [46] proposed a new tool that explores the needs of businesses and identifies where they could cooperate in the context of industrial symbiosis.
The last level focuses on the design and implementation of CE actions at the municipality, regional or state level [47]. Additionally, this macro-level is mainly associated with holistic circular economy plans, where the active participation of all industry sectors and societal actors is necessary to promote these plans and the CE concept. To assist in promoting CE at the macro level, Pires and Martinho [48] suggested a waste hierarchy index (WHI) to facilitate measuring municipalities to classify their waste in a CE context based on the principles of recycling, reusing, incineration and landfill disposal. Similarly, Tomić and Schneider [49] suggested a methodology to promote CE at the municipality level based on life cycle analysis for the evaluation of secondary raw materials.
2.2. Circularity of Products
CΕ products are defined as products that have a high degree of circularity, which can be assessed by informal or formal measurement systems (e.g., labeling). With regard to informal measurement systems, Vanegas et al. [50] collected five indexes from the existing literature that measure product circularity, such as EMF’s Material Circularity Indicator, the LCA-based Eco-Costs Value Ratio (EVR) Model, the circular economy index, REPRO, and Material Reutilization. They identified that these methods have many weaknesses in relation to some criteria, such as construct viability, reliability, transparency, generality and aggregation principles. To overcome these weaknesses, they suggested an index that combines virgin and recirculated materials. Specifically, Niero and Kalbar [51] developed an index through Multicriteria Decision Analysis to assist firms in developing different packaging using CE principles. They suggested eight alternatives for beer packaging. Similarly, Vogtlander et al. [52] suggested a composite index to evaluate the eco-costs of circular business models and products.
Additionally, Corona et al. [53] reported 17 indexes to measure product circularity in financial and non-financial terms: the New Product-Level Circularity Metric, the Cumulative Service Index, the Material Circularity Indicator, the Circularity Index, the Global Circularity Metric, Circular Economy Indicator Prototype and Circular Economic Value, Reuse Potential Indicator, Value-Based Resource Efficiency, Longevity Indicator, Sustainable Circular Index, Eco-Efficiency Index, Circular Performance Indicator, Eco-Efficient Value Ratio, Global Resource Indicator and Circularity Degree. Other frameworks to measure circularity include Life Cycle Analysis, Material Flow Analysis and Input-Output systems. To this end, Figge et al. [54] suggested a longevity indicator to calculate the material use in production processes. Furthermore, Jawahir and Bradley [55] attempted to develop a methodology to evaluate products and firms through the 6R life cycle costs model and the triple bottom line approach. This is based on life cycle phases, the 6Rs model (i.e., reduce, redesign, reuse, remanufacture, recycle and recover) and the three pillars of sustainability (i.e., economy, social and environment).
The category of formal measurement systems includes circularity labeling schemes. In actuality, such measurement systems and methodologies provide appropriate metrics for measuring product circularity, which are necessary for consumers who are willing to pay for labeled products regarding reusing, remanufacturing and recycling [56]. An indicative example of CE label is the Environmental Quality Guarantee Symbol, which is based on LCA and aims to help eliminate the use of energy and waste materials. Similarly, the European Union (EU) level(s) focuses on building circularity by introducing criteria in relation to energy consumption, water resources, materials, the health and comfort of residents, carbon footprint, and life cycle costs of buildings. Another significant CE label and certification is the Cradle to Cradle project. All this implies that a new design strategy must be developed in order to introduce CE principles into the design phase of products mainly to encourage an a priori reduction in, and the reuse and recycling of, materials, packaging and end-of-product materials [57].
2.3. Social Orientation of Circular Economy
The definition of the CE concept is based on two terms: (a) the term circular, which refers to the protection of virgin natural resources by reducing, narrowing and slowing down the use of resources, and (b) the term economy, which implies, regardless of the level of analysis (e.g., micro, meso or macro), a reduction in the costs and an increase in the revenues. Hence, the concept of CE mainly focuses on environmental protection and economic development, without paying much attention to the social dimension. For this reason, there is an increasing need to analyze in great detail the social impacts of CE.
Despite the fact that the overall literature concerning CE’s social impacts is limited, there are two sections of the literature that provide information regarding the social aspects of CE. The first section includes articles regarding the effects of CE on sustainable development; the majority of these articles examine the ways in which the concept of CE contributes to the three dimensions of sustainability, i.e., economic development, environmental protection and social cohesion. In this sense, Korhonen et al. [39] pointed out that CE contributes to the social perspective of sustainability by addressing labor and society issues. Furthermore, they highlighted the impact of CE on the creation of new jobs as well as on society’s participation in new economic forms and relationships, such as the shared economy. It is also worth noting that many authors have tried to link CE with the 17 SDGs [58,59,60]. By examining the impacts of circular business models on sustainability, Pieroni et al. [61] have highlighted that the most critical societal aspects that could be adopted by firms are social well-being, local people engagement, employment, ethical sourcing, and business longevity. In addition, Stewart and Niero [62] analyzed corporate sustainability reports and found that the coverage of the social aspects of CE is very limited. Kristensen and Mosgaard [42] suggested that the number of created jobs can be used for assessing the social impacts of CE. It is important to mention that jobs are an important factor used by international organizations to emphasize the value of adopting CE principles [63].
The second section of the literature focuses only on the social aspects of CE. Few studies try to evaluate the effects of CE on social aspects by examining ethical, social and well-being issues, as well as working conditions [17]. Some scholars have utilized life cycle thinking to evaluate the social aspects of CE. For instance, Mesa and Ligthart [64] suggested a mathematical formula to evaluate the sustainability life cycle of CE through the Social Life Cycle, Life Cycle Costing and Environmental Life Cycle. Reinales et al. [65] provided a methodology to evaluate the social impacts of alternative ways to utilize CE products; they developed a matrix based on SLCA and materiality analysis in order to identify the views of stakeholders regarding CE products.
3. Methods and Materials
This section presents the steps of the proposed methodological framework, based on the GRI indexes and the use of composite indexes [66,67,68]. It is important to point out that many authors have utilized the methodology of composite indexes to develop life cycle analysis and sustainability indexes [69,70]. Particularly, Dočekalová and Kocmanová [71] suggested five steps to create composite indexes. The first step includes the design of specific indicators and the second step includes a correlation index for cases wherein the pool of indicators is high, and many of these are correlated. As is known, scholars use standard and commonly accepted guidelines to draw indicators, and many of these measure similar dimensions. In order to avoid double measurements and address the need for such information, Dočekalová and Kocmanová [71] suggested a correlation index to exclude some indicators from the final composite index. The next step focuses on measuring measurement units, such as economic, environmental and social performance. Finally, the fourth step focuses on calculating a weight factor based on the input of experts for each indicator, and the fifth step gives the final score for estimating the composite index. However, due to the different units of measurement of such indicators (financial and non-financial measurement), many scholars have suggested standardization formulas [70,72]. This method is based on the LCA ISO 14040, which provides some standard steps to collect the necessary data. It derives classical life cycle steps from the goal of the LCA, inventory analysis and impact assessment. The materials have been selected through the inputs of experts in the field of corporate environmental management and CE.
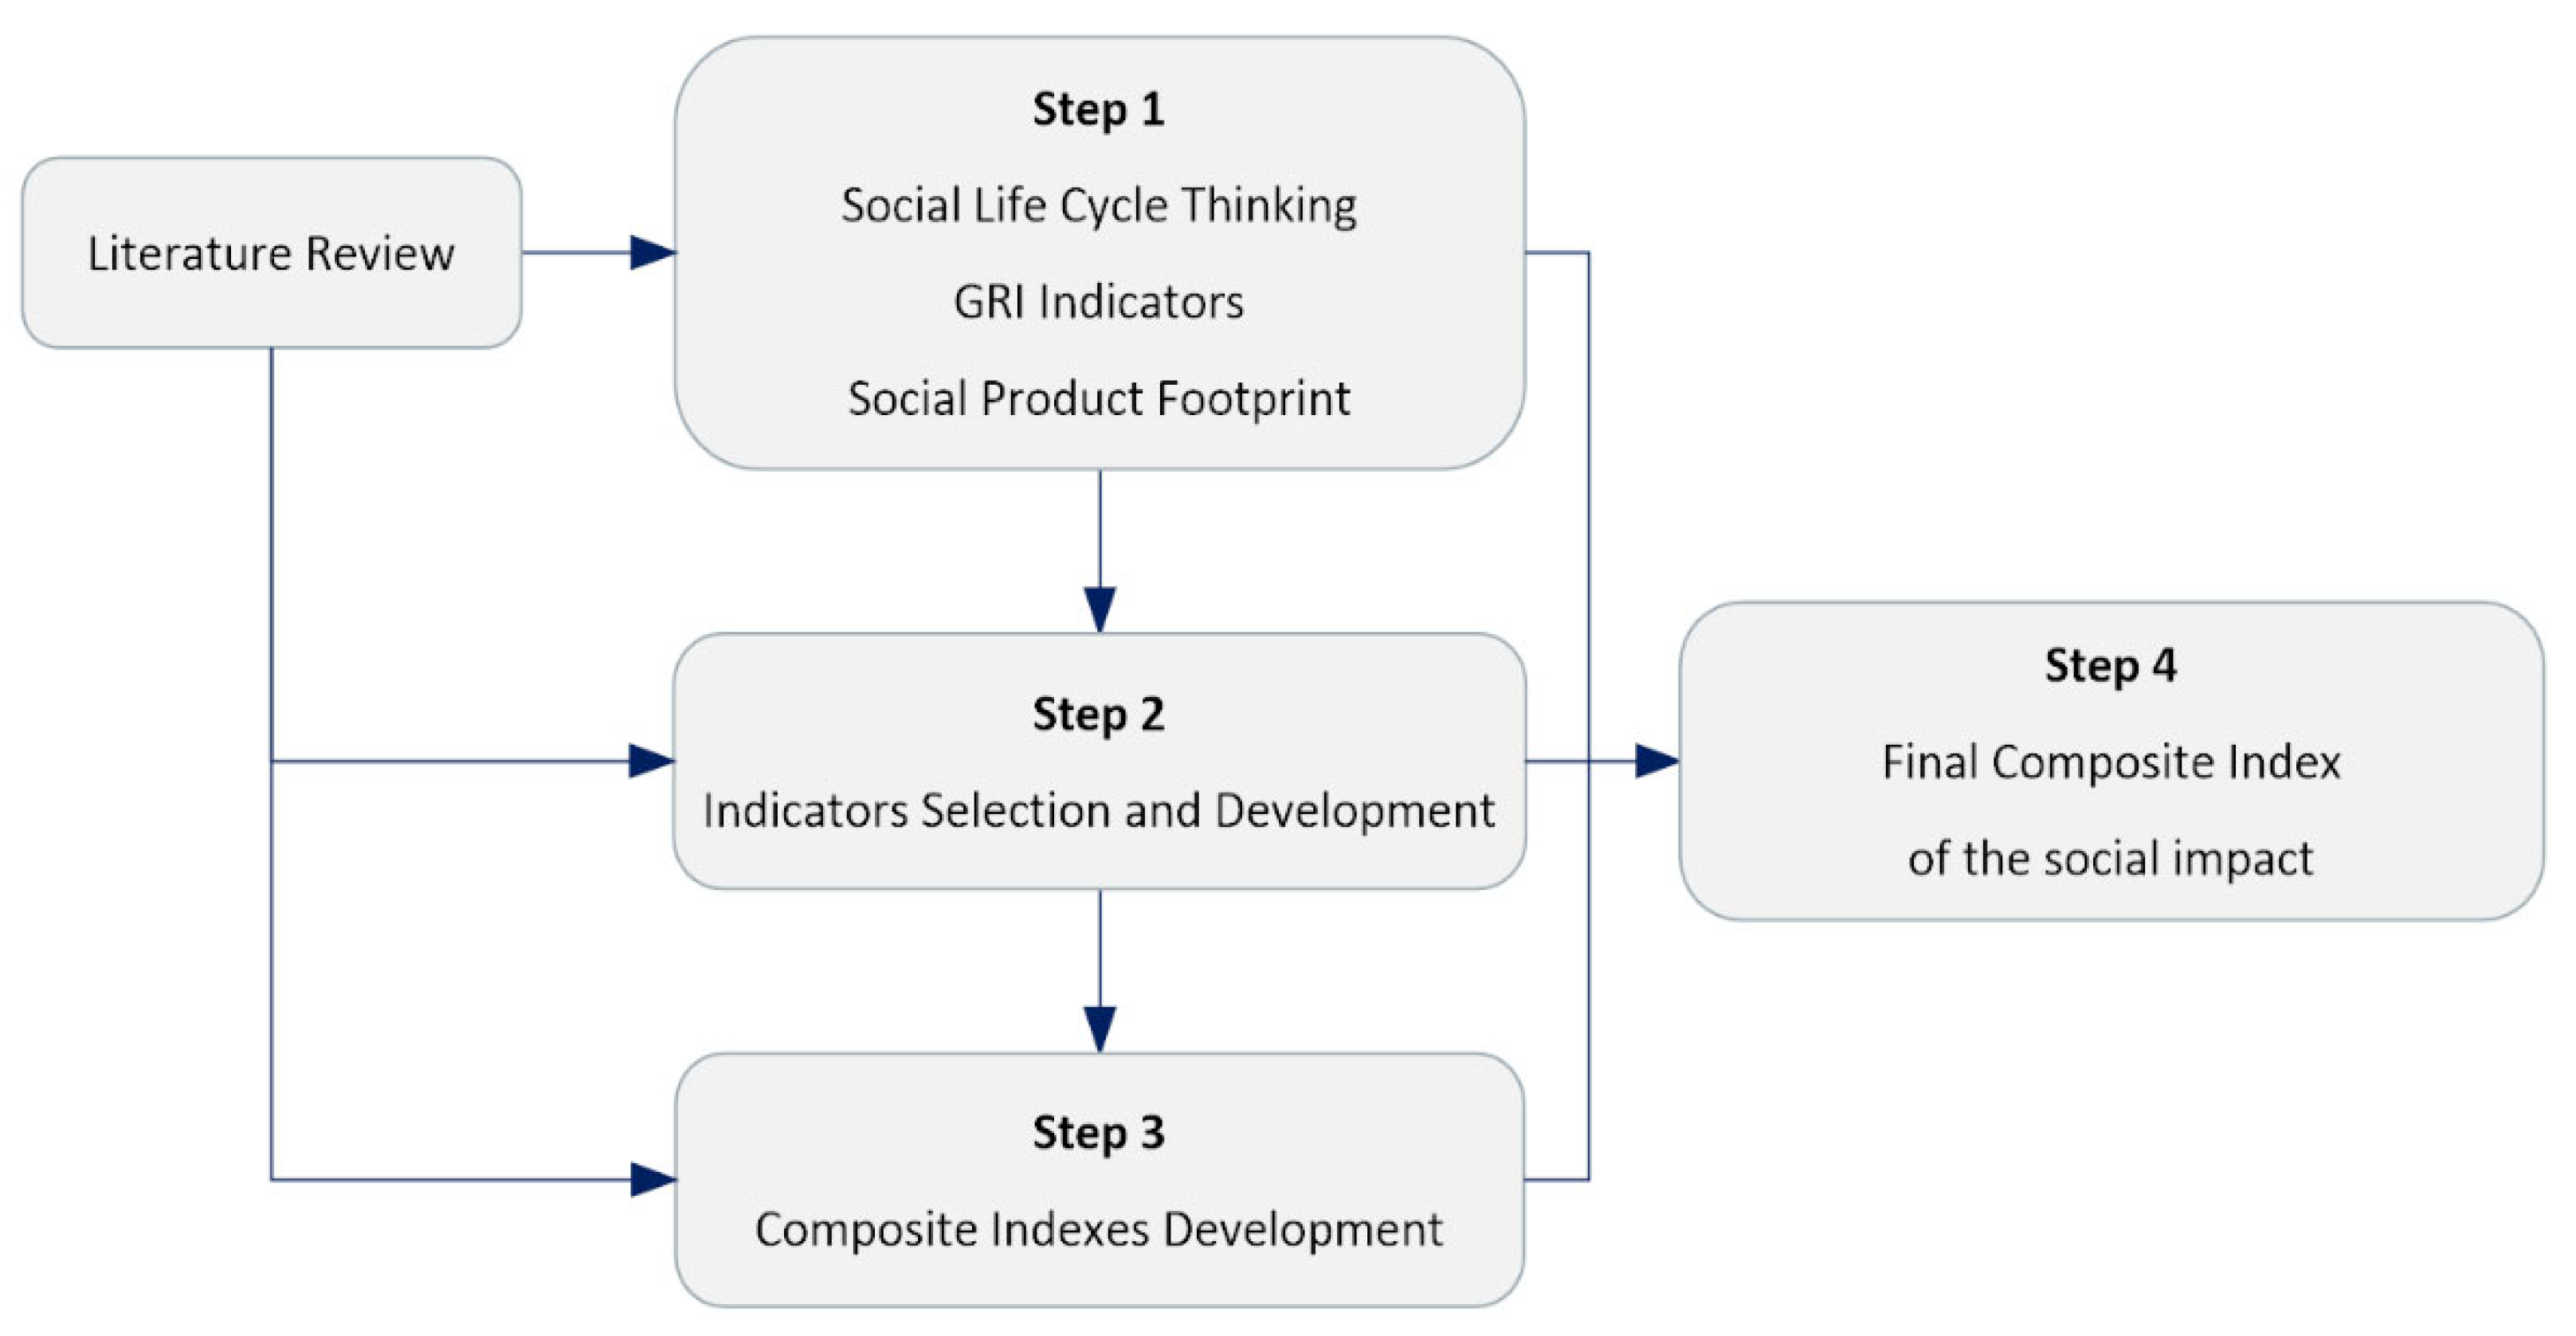
The suggested framework in this study focuses on four steps, as shown in Figure 1. The first step presents the suggested indicators that emerge through a combination of Social Life Cycle Analysis (S-LCA) thinking, Global Reporting Initiative (GRI) indexes and the logic of the socioeconomic footprint of products. The second step suggests a procedure for selecting appropriate indicators to evaluate the circularity of products. The third step presents techniques to design the composite indexes for each phase of the LCA system, and the final step gives a suggested composite index that is able to evaluate the total social impact/footprint of the CE product.
3.1. The First Step
Based on the LCA ISO 14040, which is the most popular standard for life cycle thinking, there are some standard and interrelated tasks. The first task is to define the goal of an LCA study that focuses on quantifying the social–economic responsibility of the product by shifting from “cradle to grave” to “cradle to cradle” thinking. So far, the current most-used S-LCA techniques have focused on examining the LCA from the extraction of raw materials to the disposal of waste. However, according to the logic of CE, the loop of materials is also associated with the flows from two streams; the first stream concerns the maintenance and return of (waste) materials through the technical cycle by adopting the principles of reusing, recycling, remanufacturing, refurbishing, repurposing, and redesigning [73], whereas the second stream mainly refers to the return of (waste) materials through the biological cycle by transforming them into useful materials for the production process (e.g., biogas, fertilize).
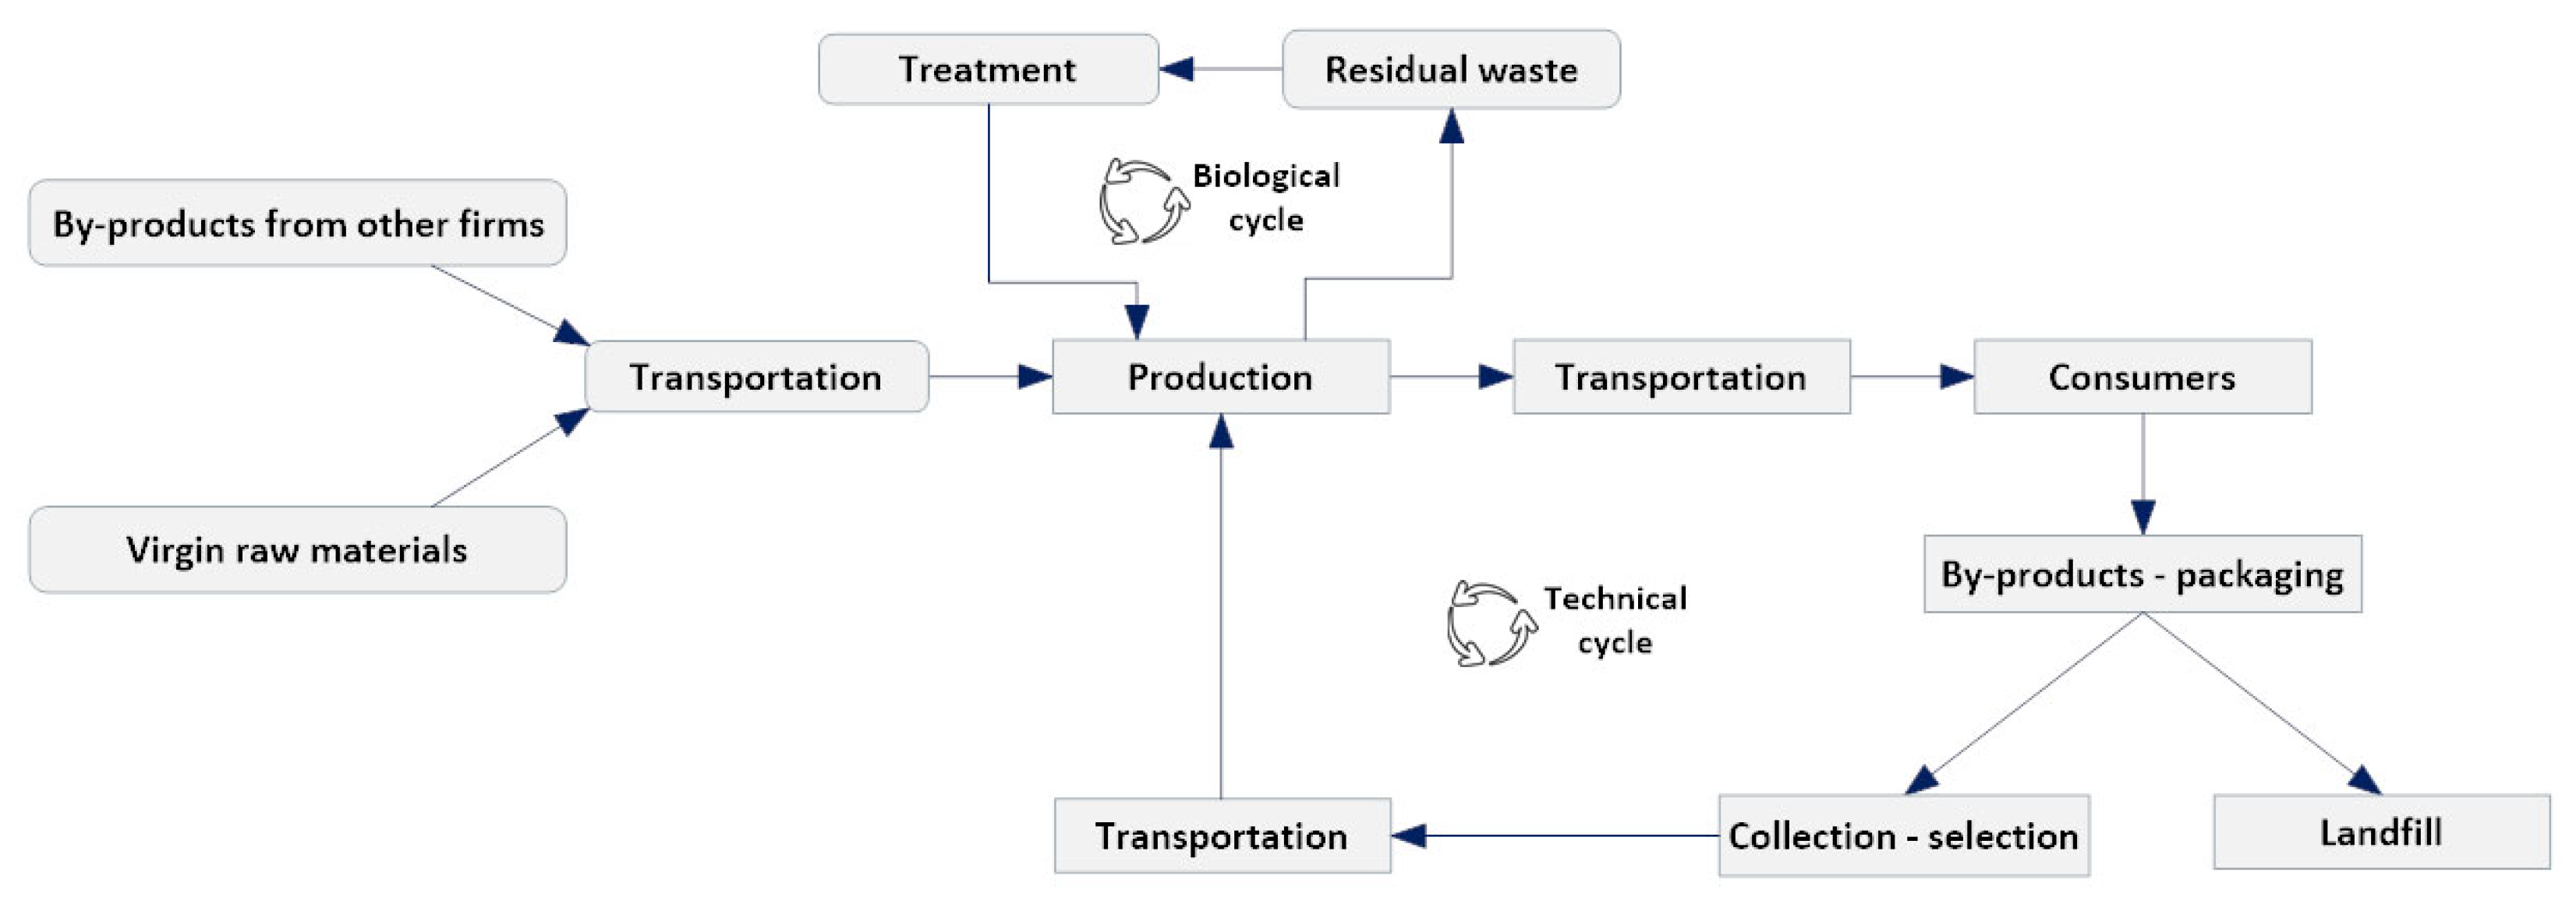
The second task is linked to technical product life cycle analysis, undertaken to determine the functional unit used for the assessment of the social impacts. The third task is to define the examined system. Figure 2 shows the system boundaries for a firm’s operations in relation to CE principles. The boundaries include the supply of inputs for production. This includes by-products of other firms, related to the technical cycle and CE principles such as recycle, reuse, remanufacture, refurbish and recover [74]. This implies that end-of-life materials and packaging could return to the firm to be managed [75]. The system encompasses the environmental impacts accrued from the transport of raw materials and the production process (within the boundaries of the firm) related to the transport of products, consumption and packaging issues, as well as the return of by-products to the firm (technical cycle) or to the landfill. Additionally, it includes the biological cycle within which by-products of the same firm are returned to be transformed to biogas or fertilizer [76]. The distinction of the two cycles is based on the EMF’s idea, whereby the materials of products could be returned to any production phase by utilizing CE principles.
3.2. The Second Step
A widely known guideline for measuring the S-LCA of products is UNEP/SETAC, which offers three general categories: impact categories, sub-impact categories and inventory indicators. Although it suggests some social indicators, such as occupational health and safety, human rights, working conditions and governance, the goal is to help researchers to develop their own indicators related to the research scope as well as the sector or business they intend to study. In the absence of a commonly accepted measurement system or indicators for measuring the social impacts, the proposed methodology utilizes the indexes suggested by GRI [68,77].
Another critical issue for the measurement of the social impacts of products, in relation to the CE concept, is the economic footprint of the product at each stage of its life cycle. Up till now, most techniques have focused on the social responsibility of the company in the product life cycle, without focusing on the socio-economic parameters that may have both positive and negative economic impacts. In actuality, the positive economic impacts refer to the economic value that arises from each phase of the life cycle, and they affect various stakeholders, while the negative impacts are related to the potential negative externalities [78]. For the calculation of economic impacts, information can be gathered from various guidelines concerning the distribution of the company’s revenues at each phase of the product life cycle and the recording of possible externalities (e.g., [79,80]).
Table 1 shows some indicative indicators throughout the closed life cycle of a product. The categorization of the indicators is based on six procedures according to the system’s boundaries (see Figure 2) and the groups of stakeholders (i.e., suppliers, employees, management/managers, customers, local communities and the financial system) that influence or are influenced by firms’ operations.
3.3. The Third Step
The next step of the proposed methodological framework is the development of composite indexes in order to assess both the CE social impacts and the socio-economic added value accrued from products at each phase of the life cycle. Such composite indexes should satisfy some key criteria, such as flexibility (i.e., appropriateness for all industrial sectors), holistic nature (i.e., coverage of all possible social and economic impacts), timeliness (e.g., usage of up-to-date information), comparability (e.g., comparison of firms’ performance over time, comparison between companies or LCA phases) and standardization (e.g., well-known and useful indicators for all sectors) [81].
Then, it is necessary to analyze the structure of the indicators in order to improve the applicability and practicability of the proposed framework. Table 2 outlines the procedures for assessing the social and economic indicators. The first column provides the codes of the indicators (Table 1 and Appendix A). In particular, the first letter of the phase of LCA and a ranking number are used for the codification. For example, the first indicator in the Supply phase (102-22) is codified as S1.
Since the proposed indicators can be measured in non-financial or financial units, the second column of Table 2 shows the equation that can be used for the normalization of the values of all indicators on a scale from 0 to 1. The next column presents the mathematical formula used to assign weight factors in each indicator for each phase. Due to the fact that there are six proposed phases, the importance of each phase is approximately 16.7% (i.e., 1/6 ≈ 0.167 × 100 = 16.7%). Finally, a composite index is calculated for each of the life cycle phases, which is estimated as the product of the normalized indicators by the weight.
3.4. The Fourth Step
The final step of the methodology is the calculation of an overall composite index, namely, the Social Impact Index (SII), which indicates the overall social impact of the product throughout its life cycle by incorporating the reverse logistic phase associated with CE. This index is calculated as the sum of the composite indexes of each phase (Table 2).
It is obvious that the value of the SII ranges from 0 to 1, where values near to 1 indicate that the product has a highly significant social impact across the entire life cycle.
4. Computational Examples
In order to test the proposed methodology and assess its applicability, some computational examples are given. To this end, three hypothetical firms that operate in different sectors were chosen, i.e., Firm 1 (F1)—food sector, Firm 2 (F2)—chemical sector, Firm 3 (F3)—telecommunication sector. These firms operate in sectors that are considered very important for CE. For example, Pagotto and Halog [82] highlight the significance of the food industry to sustainable development by utilizing industrial ecology principles. Additionally, Li and Su [83] emphasized the role of CE in the chemical industry’s efforts to promote sustainable development, and Ezeudu and Ezeudu [84] indicated the significance of the telecommunication sector given the higher amount of solid waste production. To measure the social impacts of products at each stage of the product’s life cycle, a scoring scale is suggested, ranging from 1 (low score) to 10 (high score). In alignment with similar techniques, three experts in the field of CE and corporate sustainability were asked to assign a score to each selected indicator [85]. These experts were selected from the academic sector and come from the United Kingdom and Greece. The experts’ research interests are environmental management in business, the circular economy, and the social impact of products. It should be pointed out that this score provides an initial value of each indicator according to the opinion of each expert regarding the significance of each indicator.
For the sake of simplicity, clarity and space, the results of this study are based on the data of the first firm (F1). This approach is mainly applied to avoid multiple and large tables for data presentation, which would make it difficult for the readership to understand the suggested framework. Thus, it is not considered necessary to present the tables for all the firms (three firms × six tables), as they would not add to scholars’ understanding. Clearly, the way the indicators are calculated for each phase of the LCA for the first firm is no different from the way the indicators are calculated for the other two firms. Consequently, the presentation of all the tables would not really help in understanding the proposed framework. However, it should also be noted that in Figure 3 and Figure 4, the estimated composite indexes are based on the data from all three firms.
As the aim of this section is to show the application of the proposed methodology, detailed calculations for each phase of the examined system are presented for the firm F1, which operates in the food sector. In particular, Table 3 presents the scores calculated for the supply phase of firm F1. The experts put significant emphasis on new suppliers that utilized environmental criteria to make their procurements (S7), as well as to assess the H&S issues related to products and services (S18). Additionally, high emphasis was placed on anti-corruption in operations and suppliers at significant risk of child labor and stakeholder involvement (S26, S32, S34, S39 and S48). These are important indicators for the food industry, since this is considered a human capital-intensive sector, and stakeholders such as suppliers, employees and local communities play a critical role in its operation [86].
Table 4 presents the results from the Transportation phase. The scores show that some indicators, such as T21 and T27, have a high score, which means that they are extremely important for the social impacts of such types of firms. These indicators pay attention to issues related to the human rights of workers and forced labor during the transportation of production inputs from suppliers to the firm. This trend is very significant for the food industry, since many studies have focused on examining the supply selection criteria, which are based on the human rights of workers and on green transportation [87]. Particularly, Núñez-Cacho et al. [88] examined the behaviors of consumers in relation to the plastic packaging used by the food industry. They introduced some criteria regarding plastic in order to facilitate consumers in their selection of food with less plastic packaging.
Table 5 presents the calculation in the production phase, aiming to estimate the social impacts on a number of stakeholder groups (e.g., employees, suppliers, management, and local communities). A great emphasis was placed on production indicators such as P2, P10, P13, P26, P27, P28, P36, P40, P44, P46, P52, P53, P56, P58, P59, P65 and P69. These indicators consider a range of social topics, such as ethics, governance issues, management approaches, corruption issues, new employee hiring, employee turnover, the relationship of workers with management, employees’ H&S issues, and economic issues (ROE and ROA). The scoring of the experts was rational here since the food industry is based on human resources. This is confirmed by the current literature in the fields of food industry and sustainability, which shows that food firms pay great attention to employee issues and ethics [89].
Similar to the previous tables, Table 6, Table 7 and Table 8 present the scores for the disposal, consumption and reverse logistic phases. The scores reflect the importance of each indicator in the evaluation of the firm’s social impact. These phases are very important for the food industry and its effort to adopt CE principles. Vijayan et al. [90] examined the benefits and challenges related to retailers in Malaysia adopting reverse logistics practices. Kazancoglu et al. [91] suggested a system dynamic model in the context of a food supply chain in order to identify the best reverse logistics practices that could significantly contribute to green performance management and CE. Similarly, the scores of the experts for the suggested indicators align with many previous studies that focused on social topics [19]. Consumption topics are also important in the food industry and CE, since consumers play a critical role in pushing firms to change their production and consumption practices [92].
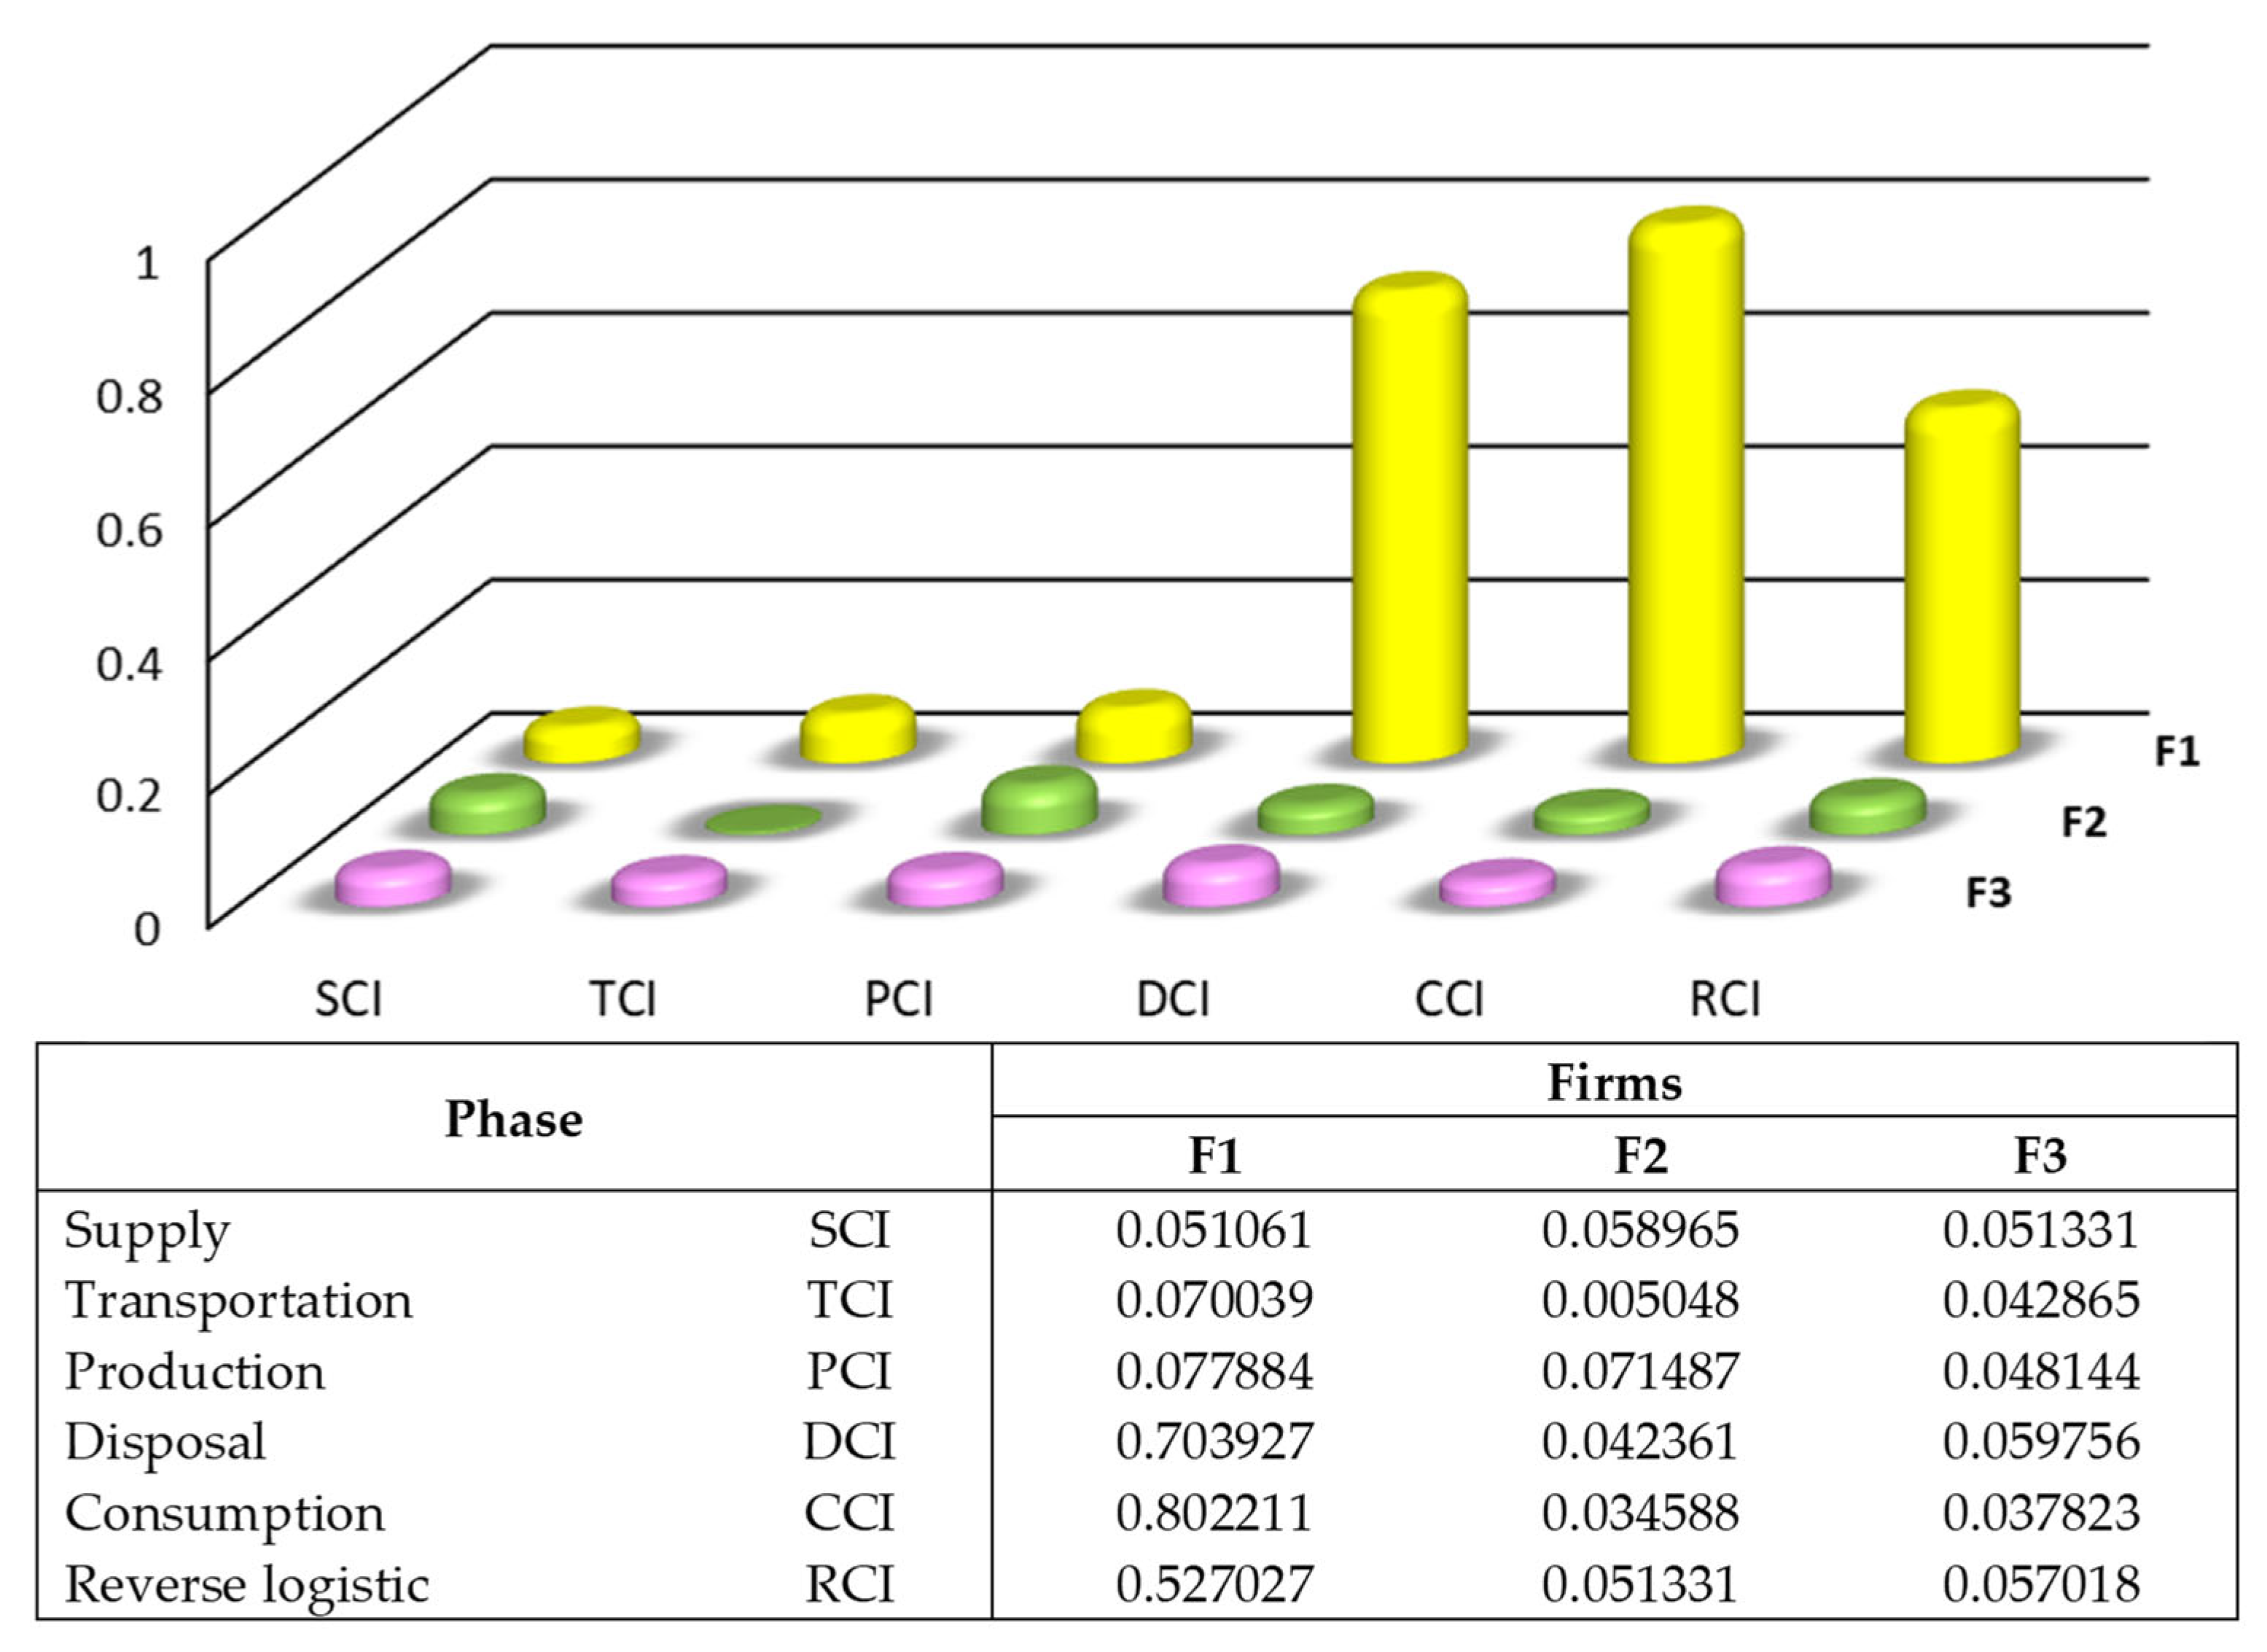
Based on the previous calculations, the composite index for each phase was estimated. Figure 3 depicts the values of the composite indexes for each hypothetical firm. As can be seen, the composite indexes of the distribution, consumption and reverse logistic phases (DCI, CCI and RCI, respectively) for F1 had the highest values.
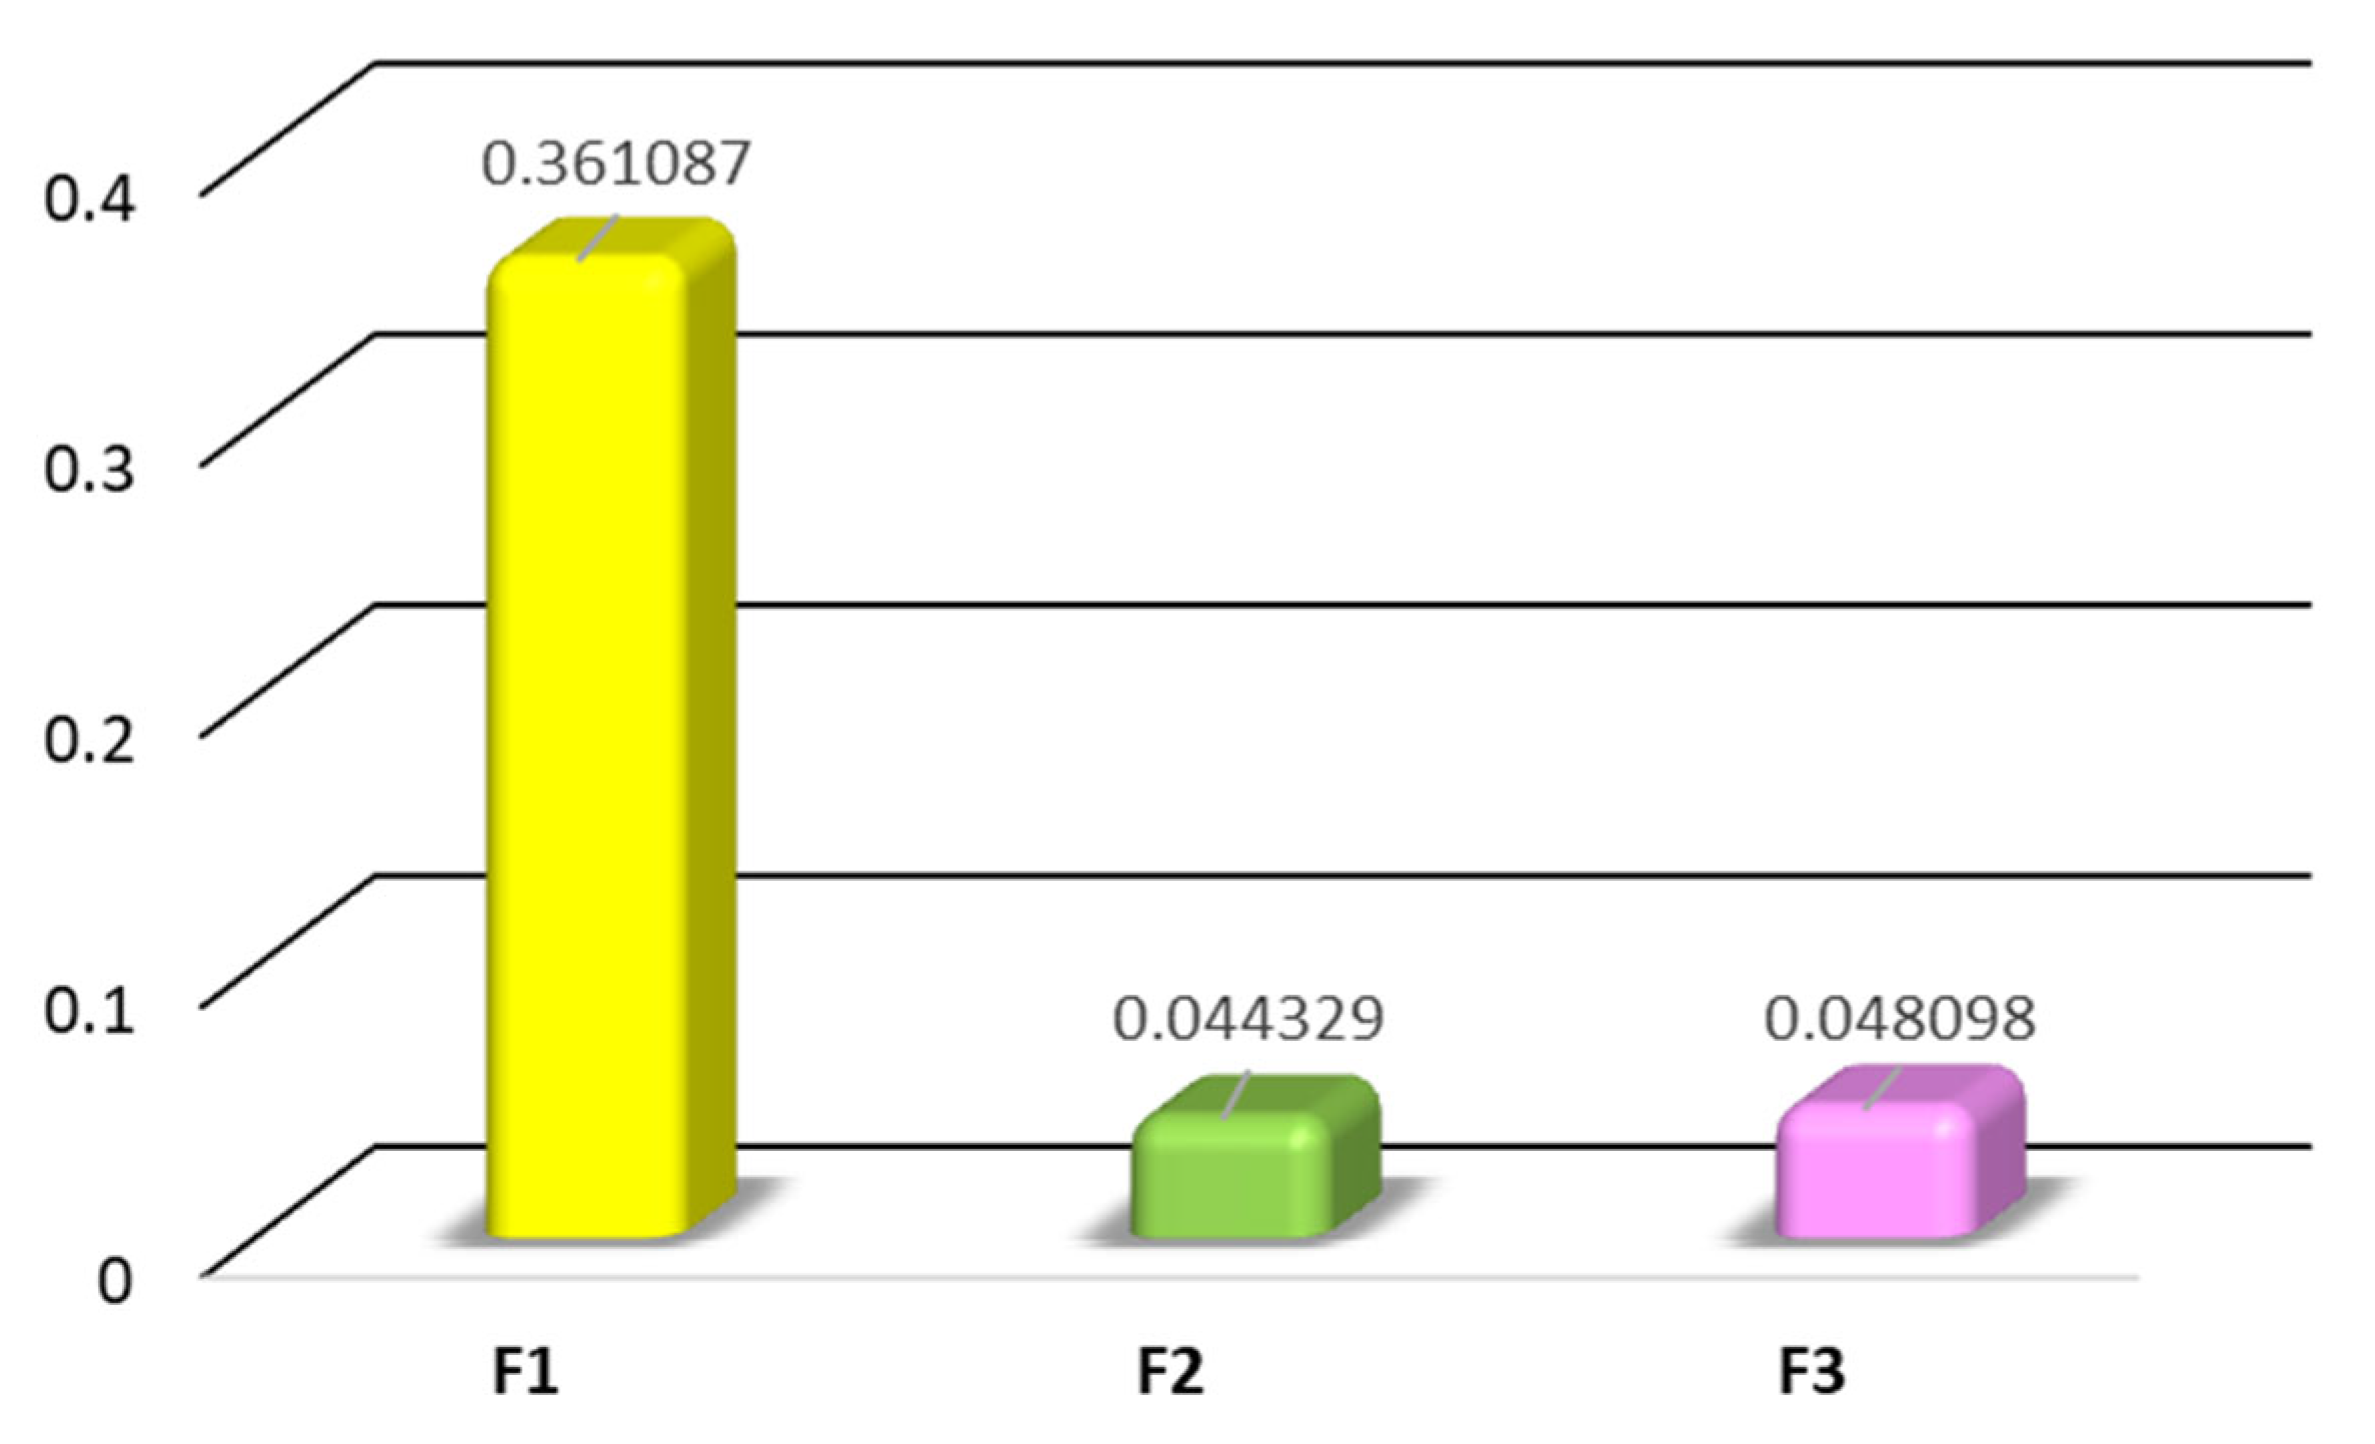
Finally, Figure 4 shows the SII scores achieved by each firm, which demonstrate the social impacts of firms on the whole product life cycle. Obviously, the first firm had the greatest impact on the social life cycle of the product, while the other two firms had very low impacts.
5. Conclusions
This study developed a framework for measuring the social impacts of a product throughout its life cycle, incorporating a CE perspective. An important component of the proposed methodology is the GRI disclosure standards, which provide the indicators that a system follows certain necessary principles (e.g., comparability, materiality, reliability). Additionally, using UN guidelines for product life cycle analysis, these indicators are classified into groups related to various stakeholders and life cycle phases. This classification is very useful for decision-makers, managers and scholars seeking to identify the needs of the most significant stakeholder group, in order to focus on them.
Furthermore, the proposed evaluation framework could facilitate longitudinal, cross-sectoral, and intra-sectoral comparisons regarding social impact throughout the LCA of a product that is based on CE principles. Particularly, owing to its structure, it assists various interested parties in evaluating a firms’ performance over the years and/or the performance of different firms from the same or different industries. Such information is valuable for all stakeholders in terms of making decisions about a firm (e.g., consumers and investors).
These findings are derived from computational examples, wherein composite indexes have been compared among firms. In this context, a comparison and classification could be made among firms. For instance, as regards the SCI index, F2 achieved the best score (0.058965) compared to the other two firms (0.051331 for F3 and 0.0510061 for F2). Similarly, in the transportation (TCI), production (PCI), disposal (DCI) and consumption phases (PCI), F1 achieved a better performance than the other two firms. In addition, the F3 showed a better score in the last index (RCI) than the other two firms. Finally, F1 achieved the best score in the Social Impact Index (SII) among the three firms.
Further significant contributions to the field of CE’s social aspects are made by the suggested framework. First, it focuses on developing a systematic means to estimate the social impacts of products’ circularity, which promotes the basic principles of comparability, materiality, reliability and precision. This is achieved by utilizing GRI indicators, due to the lack of specific indicators suitable for each sector and firm. This approach could be very useful to scholars and practitioners seeking to gain information regarding the social impacts of different products and sectors. Second, the suggested framework introduces the basic ideas of the social footprints of firms into CE, i.e., it is proposed to allocate the revenue of firms per stakeholder group and phase of life cycle analysis. This demonstrates how a product creates value in each product phase. Thirdly, it emphasizes developing a new framework for measuring the social aspect, which is today sought by many scholars, seeking either to show that the concept of CE is an effective tool to achieve the goals of sustainable development, or to evidence the social impact of CE. This overcomes the problems of reliability and trust facing the new normative concepts of sustainable development, green economy, green entrepreneurship and CE, which are considered beneficial for societies.
The proposed framework also represents an excellent opportunity for most industrial sectors, as it improves decision-making processes. The set of indicators that have been proposed help firms to better design their CE programs and highlight critical points in the field of CE. Another important implication is the emergence of a tool for communication with stakeholders, which is now a popular concern in management. The proposed framework highlights social characteristics, and considers the demands of stakeholders at each stage of the circular economy.
The proposed model also helps to integrate the technical and biological cycle, which, on a practical level, connects the engineering subjects with the management subjects and actually enables CE to provide integrated solutions for businesses. In essence, the proposed framework provides an integrated CE model. It also helps to integrate the principles of the CE in a practical way in the field of business, which also helps policy-makers to adopt better and more effective policies in the field of CE. It also has a positive impact on the decisions of stakeholders, as the final scores can help them to make better and more appropriate decisions.
Inevitably, there are some limitations that should be addressed in future research. The computational examples are based on expert opinions formed without real data on performance, which precludes drawing conclusions about the outcome from computational examples. This leads to a certain weakening of the results, which do show the prevailing trend but are not as representative as when real business data are used. However, future research will be carried out on a sample of firms using real data gathered from various corporate sources, such as corporate financial and sustainability reports. Another limitation is the low number of firms and sectors selected. However, for the purpose of this paper, the number is useful and sufficient to show the operational nature of the proposed framework. Nevertheless, it would be necessary to use a larger number of firms and sectors to show the different social impacts of adopting CE principles.
In addition, new studies could be conducted to examine different aspects of the proposed framework. Future research could examine the list of suggested indicators by removing or adding new indicators that will better reflect the social impacts of firms. Some scenario, reliability and sensitivity tests should also be conducted to identify the sensitive of the framework. Finally, apart from the calculation of firms’ performances in each phase of the examined system, future research can focus on examining the impacts of corporate operations and products in each stakeholder group at each phase.
Author Contributions
Conceptualization, I.N. and A.I.S.; methodology, I.N. and A.I.S.; software, T.T.; validation, T.T. and I.N.; formal analysis, T.T. and I.N.; investigation, I.N. and A.I.S.; resources, I.N.; data curation, T.T. and I.N.; writing—original draft preparation, I.N. and T.T.; writing—review and editing, A.I.S.; visualization, T.T.; supervision, A.I.S.; project administration, I.N.; All authors have read and agreed to the published version of the manuscript.
Funding
This research received no external funding.
Data Availability Statement
The data used in this study are available from the corresponding author.
Conflicts of Interest
The authors declare no conflict of interest.
Appendix A

Table A1.
GRI indicators description (available online: https://wikirate.org/GRI_Indicator_Table, accessed on 20 December 2021).
Table A1.
GRI indicators description (available online: https://wikirate.org/GRI_Indicator_Table, accessed on 20 December 2021).
| GRI Standard Number | Disclosure Number | Description |
|---|---|---|
| GRI-102 | 102-22 | Composition of the highest governance body and its committees |
| 102-23 | Chair of the highest governance body | |
| 102-24 | Nominating and selecting the highest governance body | |
| 102-25 | Conflicts of interest | |
| 102-26 | Role of highest governance body in setting purpose, values, and strategy | |
| 102-27 | Collective knowledge of highest governance body | |
| 102-28 | Evaluating the highest governance body’s performance | |
| 102-32 | Highest governance body’s role in sustainability reporting | |
| 102-35 | Remuneration policies | |
| 102-36 | Process for determining remuneration | |
| 102-37 | Stakeholders’ involvement in remuneration | |
| 102-38 | Annual total compensation ratio | |
| 102-39 | Percentage increase in annual total compensation ratio | |
| 102-16 | Values, principles, standards, and norms of behavior | |
| 102-17 | Mechanisms for advice and concerns about ethics | |
| 102-43 | Approach to stakeholder engagement | |
| 102-44 | Key topics and concerns raised | |
| 102-2 | Activities, brands, products, and services | |
| GRI 103 | 103-1 | Explanation of the material topic and its boundary |
| 103-2 | The management approach and its components | |
| 103-3 | Evaluation of the management approach | |
| GRI 201 | 201-3 | Defined benefit plan obligations and other retirement plans |
| GRI 202 | 202-1 | Ratios of standard entry-level wage by gender compared to local minimum wage |
| 202-2 | Proportion of senior management hired from the local community | |
| GRI 204 | 204-1 | Proportion of spending on local suppliers |
| GRI 205 | 205-1 | Operations assessed for risks related to corruption |
| 205-2 | Communication and training about anti-corruption policies and procedures | |
| 205-3 | Confirmed incidents of corruption and actions taken | |
| GRI 206 | 206-1 | Legal actions for anti-competitive behavior, anti-trust, and monopoly practices |
| GRI 306 | 306-4 | Transport of hazardous waste |
| GRI 308 | 308-1 | New suppliers that were screened using environmental criteria |
| 308-2 | Negative environmental impacts in the supply chain and actions taken | |
| GRI 401 | 401-1 | New employee hiring and employee turnover |
| 401-2 | Benefits provided to full-time employees that are not provided to temporary or part-time employees | |
| 401-3 | Parental leave | |
| GRI 403 | 403-1 | Workers representation in formal joint management–worker health and safety committees |
| 403-2 | Types of injury and rates of injury, occupational diseases, lost days, absenteeism, and number of work-related fatalities | |
| 403-3 | Workers with high incidences or high risks of diseases related to their occupation | |
| 403-4 | Health and safety topics covered in formal agreements with trade unions | |
| GRI 404 | 404-1 | Average hours of training per year per employee |
| 404-2 | Programs for upgrading employee skills and transition assistance programs | |
| 404-3 | Percentage of employees receiving regular performance and career development reviews | |
| GRI 405 | 405-1 | Diversity of governance bodies and employees |
| 405-2 | Ratio of basic salary and remuneration of women to men | |
| GRI 412 | 412-3 | Significant investment agreements and contracts that include human rights clauses or that underwent human rights screening |
| 412-2 | Employee training on human rights policies or procedures | |
| GRI 406 | 406-1 | Incidents of discrimination and corrective actions taken |
| GRI 407 | 407-1 | Operations and suppliers in which the right to freedom of association and collective bargaining may be at risk |
| GRI 408 | 408-1 | Operations and suppliers at significant risk for incidents of child labor |
| GRI 409 | 409-1 | Operations and suppliers at significant risk for incidents of forced or compulsory labor |
| GRI 410 | 410-1 | Security personnel trained in human rights policies or procedures |
| GRI 411 | 411-1 | Incidents of violations involving rights of indigenous peoples |
| GRI 412 | 412-1 | Operations that have been subject to human rights reviews or impact assessments |
| GRI 414 | 414-1 | New suppliers that were screened using social criteria |
| 414-2 | Negative social impacts in the supply chain and actions taken | |
| GRI 413 | 413-1 | Operations with local community engagement, impact assessments, and development programs |
| 413-2 | Operations with significant actual and potential negative impacts on local communities | |
| GRI 415 | 415-1 | Political contributions |
| GRI 416 | 416-1 | Assessment of the health and safety impacts of product and service categories |
| 416-2 | Incidents of non-compliance concerning the health and safety impacts of products and services | |
| GRI 417 | 417-1 | Requirements for product and service information and labeling |
| 417-2 | Incidents of non-compliance concerning product and service information and labeling | |
| 417-3 | Incidents of non-compliance concerning marketing communications | |
| GRI 418 | 418-1 | Substantiated complaints concerning breaches of customer privacy and losses of customer data |
| GRI 419 | 419-1 | Non-compliance with laws and regulations in the social and economic area |
| GRI 302 | 302-5 | Reductions in energy requirements of products and services |
| GRI 303 | 303-3 | Water recycled and reused |
| GRI 301 | 301-3 | Reclaimed products and their packaging materials |
References
- Centobelli, P.; Cerchione, R.; Chiaroni, D.; Del Vecchio, P.; Urbinati, A. Designing business models in circular economy: A systematic literature review and research agenda. Bus. Strategy Environ. 2020, 29, 1734–1749. [Google Scholar] [CrossRef]
- Nikolaou, I.E.; Jones, N.; Stefanakis, A. Circular Economy and Sustainability: The Past, the Present and the Future Directions. Circ. Econ. Sustain. 2021, 1, 1–20. [Google Scholar] [CrossRef]
- Oliveira, M.; Miguel, M.; van Langen, S.K.; Ncube, A.; Zucaro, A.; Fiorentino, G.; Passaro, R.; Santagata, R.; Coleman, N.; Lowe, B.H.; et al. Circular Economy and the Transition to a Sustainable Society: Integrated Assessment Methods for a New Paradigm. Circ. Econ. Sustain. 2021, 1, 99–113. [Google Scholar] [CrossRef]
- Geissdoerfer, M.; Savaget, P.; Bocken, N.M.; Hultink, E.J. The Circular Economy–A new sustainability paradigm? J. Clean. Prod. 2017, 143, 757–768. [Google Scholar] [CrossRef] [Green Version]
- Nikolaou, E.I.; Tsagarakis, P.K. An introduction to circular economy and sustainability: Some existing lessons and future directions. Sustain. Prod. Consum. 2021, 28, 600–609. [Google Scholar] [CrossRef]
- Webster, K.A. Circular Economy Is about the Economy. Circ. Econ. Sustain. 2021, 1, 115–126. [Google Scholar] [CrossRef]
- Stefanakis, A.I.; Nikolaou, I. Circular Economy and Sustainability—Management and Policy, Volume I, 1st ed.; Elsevier Publishing: Amsterdam, The Netherlands, 2021. [Google Scholar]
- Stefanakis, A.I.; Nikolaou, I. Circular Economy and Sustainability—Environmental Engineering, Volume II, 1st ed.; Elsevier Publishing: Amsterdam, The Netherlands, 2021. [Google Scholar]
- Barbosa, M.W. A Critical Appraisal of Review Studies in Circular Economy: A Tertiary Study. Circ. Econ. Sustain. 2021; in press. [Google Scholar] [CrossRef]
- Cecchin, A.; Salomone, R.; Deutz, P.; Raggi, A.; Cutaia, L. What Is in a Name? The Rising Star of the Circular Economy as a Resource-Related Concept for Sustainable Development. Circ. Econ. Sustain. 2021, 1, 83–97. [Google Scholar] [CrossRef]
- Kirchherr, J.; Reike, D.; Hekkert, M. Conceptualizing the circular economy: An analysis of 114 definitions. Resour. Conserv. Recycl. 2017, 127, 221–232. [Google Scholar] [CrossRef]
- Stefanakis, A.I.; Calheiros, C.S.C.; Nikolaou, I. Nature-Based Solutions as a Tool in the New Circular Economic Model for Climate Change Adaptation. Circ. Econ. Sustain. 2021, 1, 303–318. [Google Scholar] [CrossRef]
- Murray, A.; Skene, K.; Haynes, K. The circular economy: An interdisciplinary exploration of the concept and application in a global context. J. Bus. Ethics 2017, 140, 369–380. [Google Scholar] [CrossRef] [Green Version]
- Oral, H.V.; Radinja, M.; Rizzo, A.; Kearney, K.; Andersen, T.R.; Krzeminski, P.; Buttiglieri, G.; Ayral-Cinar, D.; Comas, J.; Gajewska, M.; et al. Management of Urban Waters with Nature-Based Solutions in Circular Cities-Exemplified through Seven Urban Circularity Challenges. Water 2021, 13, 3334. [Google Scholar] [CrossRef]
- Padilla-Rivera, A.; Russo-Garrido, S.; Merveille, N. Addressing the social aspects of a circular economy: A systematic literature review. Sustainability 2020, 12, 7912. [Google Scholar] [CrossRef]
- Moreau, V.; Sahakian, M.; Van Griethuysen, P.; Vuille, F. Coming full circle: Why social and institutional dimensions matter for the circular economy. J. Ind. Ecol. 2017, 21, 497–506. [Google Scholar] [CrossRef]
- Mies, A.; Gold, S. Mapping the social dimension of the circular economy. J. Clean. Prod. 2021, 321, 128960. [Google Scholar] [CrossRef]
- Geisendorf, S.; Pietrulla, F. The circular economy and circular economic concepts—A literature analysis and redefinition. Thunderbird Int. Bus. Rev. 2018, 60, 771–782. [Google Scholar] [CrossRef]
- Nikolaou, I.E.; Evangelinos, K.I.; Allan, S. A reverse logistics social responsibility evaluation framework based on the triple bottom line approach. J. Clean. Prod. 2013, 56, 173–184. [Google Scholar] [CrossRef]
- Dietz, T.; Auffenberg, J.; Chong, A.E.; Grabs, J.; Kilian, B. The voluntary coffee standard index (VOCSI). Developing a composite index to assess and compare the strength of mainstream voluntary sustainability standards in the global coffee industry. Ecol. Econ. 2018, 150, 72–87. [Google Scholar] [CrossRef]
- Zhou, L.; Tokos, H.; Krajnc, D.; Yang, Y. Sustainability performance evaluation in industry by composite sustainability index. Clean Technol. Environ. Policy 2012, 14, 789–803. [Google Scholar] [CrossRef]
- Nikolaou, I.E.; Tsalis, T.A.; Evangelinos, K.I. A framework to measure corporate sustainability performance: A strong sustainability-based view of firm. Sustain. Prod. Consum. 2019, 18, 1–18. [Google Scholar] [CrossRef]
- Chioatto, E.; Sospiro, P. Transition from waste management to circular economy: The European Union roadmap. Environ. Dev. Sustain. 2022, 1–28. [Google Scholar] [CrossRef]
- Lanaras-Mamounis, G.; Kipritsis, A.; Tsalis, T.A.; Vatalis, K.Ι.; Nikolaou, I.E. A Framework for Assessing the Contribution of Firms to Circular Economy: A Triple-Level Approach. Circ. Econ. Sustain. 2022; in press. [Google Scholar] [CrossRef]
- Herrador, M.; de Jong, W.; Nasu, K.; Granrath, L. Circular economy and zero-carbon strategies between Japan and South Korea: A comparative study. Sci. Total Environ. 2022, 820, 153274. [Google Scholar] [CrossRef]
- Merli, R.; Preziosi, M.; Acampora, A. How do scholars approach the circular economy? A systematic literature review. J. Clean. Prod. 2018, 178, 703–722. [Google Scholar] [CrossRef]
- Sassanelli, C.; Rosa, P.; Rocca, R.; Terzi, S. Circular economy performance assessment methods: A systematic literature review. J. Clean. Prod. 2019, 229, 440–453. [Google Scholar] [CrossRef]
- de Abreu, M.C.S.; Ceglia, D. On the implementation of a circular economy: The role of institutional capacity-building through industrial symbiosis. Resour. Conserv. Recycl. 2018, 138, 99–109. [Google Scholar] [CrossRef]
- Ranta, V.; Aarikka-Stenroos, L.; Ritala, P.; Mäkinen, S.J. Exploring institutional drivers and barriers of the circular economy: A cross-regional comparison of China, the US, and Europe. Resour. Conserv. Recycl. 2018, 135, 70–82. [Google Scholar] [CrossRef]
- Magazzino, C.; Mele, M.; Schneider, N.; Sarkodie, S.A. Waste generation, wealth and GHG emissions from the waste sector: Is Denmark on the path towards circular economy? Sci. Total Environ. 2021, 755, 142510. [Google Scholar] [CrossRef]
- Zhang, Z.; Malik, M.Z.; Khan, A.; Ali, N.; Malik, S.; Bilal, M. Environmental impacts of hazardous waste, and management strategies to reconcile circular economy and eco-sustainability. Sci. Total Environ. 2022, 807, 150856. [Google Scholar] [CrossRef]
- De Weerdt, L.; De Jaeger, S.; Compernolle, T.; Van Passel, S. How an incineration tax changes waste management practices among firms. Resour. Conserv. Recycl. 2022, 180, 106172. [Google Scholar] [CrossRef]
- Hina, M.; Chauhan, C.; Kaur, P.; Kraus, S.; Dhir, A. Drivers and barriers of circular economy business models: Where we are now, and where we are heading. J. Clean. Prod. 2022, 333, 130049. [Google Scholar] [CrossRef]
- Rizos, V.; Bryhn, J. Implementation of circular economy approaches in the electrical and electronic equipment (EEE) sector: Barriers, enablers and policy insights. J. Clean. Prod. 2022, 338, 130617. [Google Scholar] [CrossRef]
- Ta, A.H.; Aarikka-Stenroos, L.; Litovuo, L. Customer Experience in Circular Economy: Experiential Dimensions among Consumers of Reused and Recycled Clothes. Sustainability 2022, 14, 509. [Google Scholar] [CrossRef]
- EMF. Towards the Circular Economy. Economic and Business Rationale for an Accelerated Business; Ellen MacArthur Foundation: Cowes, UK, 2013. [Google Scholar]
- Alhawari, O.; Awan, U.; Bhutta, M.K.S.; Ülkü, M.A. Insights from circular economy literature: A review of extant definitions and unravelling paths to future research. Sustainability 2021, 13, 859. [Google Scholar] [CrossRef]
- Homrich, A.S.; Galvao, G.; Abadia, L.G.; Carvalho, M.M. The circular economy umbrella: Trends and gaps on integrating pathways. J. Clean. Prod. 2018, 175, 525–543. [Google Scholar] [CrossRef]
- Korhonen, J.; Honkasalo, A.; Seppälä, J. Circular economy: The concept and its limitations. Ecol. Econ. 2018, 143, 37–46. [Google Scholar] [CrossRef]
- Henry, M.; Schraven, D.; Bocken, N.; Frenken, K.; Hekkert, M.; Kirchherr, J. The battle of the buzzwords: A comparative review of the circular economy and the sharing economy concepts. Environ. Innov. Soc. Transit. 2021, 38, 1–21. [Google Scholar] [CrossRef]
- Franco, M.A. Circular economy at the micro level: A dynamic view of incumbents’ struggles and challenges in the textile industry. J. Clean. Prod. 2017, 168, 833–845. [Google Scholar] [CrossRef]
- Kristensen, H.S.; Mosgaard, M.A. A review of micro level indicators for a circular economy–moving away from the three dimensions of sustainability? J. Clean. Prod. 2020, 243, 118531. [Google Scholar] [CrossRef]
- Barreiro-Gen, M.; Lozano, R. How circular is the circular economy? Analysing the implementation of circular economy in organisations. Bus. Strategy Environ. 2020, 29, 3484–3494. [Google Scholar] [CrossRef]
- Bruel, A.; Kronenberg, J.; Troussier, N.; Guillaume, B. Linking industrial ecology and ecological economics: A theoretical and empirical foundation for the circular economy. J. Ind. Ecol. 2019, 23, 12–21. [Google Scholar] [CrossRef] [Green Version]
- Masi, D.; Day, S.; Godsell, J. Supply chain configurations in the circular economy: A systematic literature review. Sustainability 2017, 9, 1602. [Google Scholar] [CrossRef] [Green Version]
- Alvarez, R.; Ruiz-Puente, C. Development of the tool symbiosis to support the transition towards a circular economy based on industrial symbiosis strategies. Waste Biomass Valorization 2017, 8, 1521–1530. [Google Scholar] [CrossRef]
- Geng, Y.; Fu, J.; Sarkis, J.; Xue, B. Towards a national circular economy indicator system in China: An evaluation and critical analysis. J. Clean. Prod. 2012, 23, 216–224. [Google Scholar] [CrossRef]
- Pires, A.; Martinho, G. Waste hierarchy index for circular economy in waste management. Waste Manag. 2019, 95, 298–305. [Google Scholar] [CrossRef] [PubMed]
- Tomić, T.; Schneider, D.R. Circular economy in waste management–Socio-economic effect of changes in waste management system structure. J. Environ. Manag. 2020, 267, 110564. [Google Scholar] [CrossRef] [PubMed]
- Vanegas, P.; Peeters, J.R.; Cattrysse, D.; Tecchio, P.; Ardente, F.; Mathieux, F.; Dewulf, W.; Duflou, J.R. Ease of disassembly of products to support circular economy strategies. Resour. Conserv. Recycl. 2018, 135, 323–334. [Google Scholar] [CrossRef]
- Niero, M.; Kalbar, P.P. Coupling material circularity indicators and life cycle based indicators: A proposal to advance the assessment of circular economy strategies at the product level. Resour. Conserv. Recycl. 2019, 140, 305–312. [Google Scholar] [CrossRef]
- Vogtlander, J.G.; Scheepens, A.E.; Bocken, N.M.; Peck, D. Combined analyses of costs, market value and eco-costs in circular business models: Eco-efficient value creation in remanufacturing. J. Remanuf. 2017, 7, 1–17. [Google Scholar] [CrossRef] [Green Version]
- Corona, B.; Shen, L.; Reike, D.; Carreón, J.R.; Worrell, E. Towards sustainable development through the circular economy -A review and critical assessment on current circularity metrics. Resour. Conserv. Recycl. 2019, 151, 104–498. [Google Scholar] [CrossRef]
- Figge, F.; Thorpe, A.S.; Givry, P.; Canning, L.; Franklin-Johnson, E. Longevity and circularity as indicators of eco-efficient resource use in the circular economy. Ecol. Econ. 2018, 150, 297–306. [Google Scholar] [CrossRef]
- Jawahir, I.S.; Bradley, R. Technological elements of circular economy and the principles of 6R-based closed-loop material flow in sustainable manufacturing. Procedia Cirp 2016, 40, 103–108. [Google Scholar] [CrossRef] [Green Version]
- Boyer, R.H.; Hunka, A.D.; Linder, M.; Whalen, K.A.; Habibi, S. Product labels for the circular economy: Are customers willing to pay for circular? Sustain. Prod. Consum. 2021, 27, 61–71. [Google Scholar] [CrossRef]
- De Pauw, I.C.; Karana, E.; Kandachar, P.; Poppelaars, F. Comparing Biomimicry and Cradle to Cradle with Ecodesign: A case study of student design projects. J. Clean. Prod. 2014, 78, 174–183. [Google Scholar] [CrossRef]
- Rodriguez-Anton, J.M.; Rubio-Andrada, L.; Celemín-Pedroche, M.S.; Alonso-Almeida, M.D.M. Analysis of the relations between circular economy and sustainable development goals. Int. J. Sustain. Dev. World Ecol. 2019, 26, 708–720. [Google Scholar] [CrossRef]
- Dong, L.; Liu, Z.; Bian, Y. Match Circular Economy and Urban Sustainability: Re-investigating Circular Economy Under Sustainable Development Goals (SDGs). Circ. Econ. Sustain. 2021, 1, 243–256. [Google Scholar] [CrossRef]
- Fassio, F.; Tecco, N. Circular economy for food: A systemic interpretation of 40 case histories in the food system in their relationships with SDGs. Systems 2019, 7, 43. [Google Scholar] [CrossRef] [Green Version]
- Pieroni, M.P.; McAloone, T.C.; Pigosso, D.C. Business model innovation for circular economy and sustainability: A review of approaches. J. Clean. Prod. 2019, 215, 198–216. [Google Scholar] [CrossRef]
- Stewart, R.; Niero, M. Circular economy in corporate sustainability strategies: A review of corporate sustainability reports in the fast-moving consumer goods sector. Bus. Strategy Environ. 2018, 27, 1005–1022. [Google Scholar] [CrossRef] [Green Version]
- IISD; SITRA. Effects of the Circular Economy on Jobs; International Institute for Sustainable Development: Helsinki, Finland, 2020. [Google Scholar]
- Mesa Alvarez, C.; Ligthart, T. A social panorama within the life cycle thinking and the circular economy: A literature review. Int. J. Life Cycle Assess. 2021, 26, 2278–2291. [Google Scholar] [CrossRef]
- Reinales, D.; Zambrana-Vasquez, D.; Saez-De-Guinoa, A. Social Life Cycle Assessment of Product Value Chains under a Circular Economy Approach: A Case Study in the Plastic Packaging Sector. Sustainability 2020, 12, 6671. [Google Scholar] [CrossRef]
- Nikolaou, I.E.; Tsalis, T.A. Development of a sustainable balanced scorecard framework. Ecol. Indic. 2013, 34, 76–86. [Google Scholar] [CrossRef]
- Kayal, B.; Abu-Ghunmi, D.; Abu-Ghunmi, L.; Archenti, A.; Nicolescu, M.; Larkin, C.; Corbet, S. An economic index for measuring firm’s circularity: The case of water industry. J. Behav. Exp. Financ. 2019, 21, 123–129. [Google Scholar] [CrossRef]
- GRI. GRI G4 Part1 Reporting Principles and Standard Disclosures; Global Reporting Initiative: Amsterdam, The Netherlands, 2013. [Google Scholar]
- Khan, F.I.; Sadiq, R.; Veitch, B. Life cycle iNdeX (LInX): A new indexing procedure for process and product design and decision-making. J. Clean. Prod. 2004, 12, 59–76. [Google Scholar] [CrossRef]
- Singh, R.K.; Murty, H.R.; Gupta, S.K.; Dikshit, A.K. Development of composite sustainability performance index for steel industry. Ecol. Indic. 2007, 7, 565–588. [Google Scholar] [CrossRef]
- Dočekalová, M.P.; Kocmanová, A. Composite indicator for measuring corporate sustainability. Ecol. Indic. 2016, 61, 612–623. [Google Scholar] [CrossRef]
- Tsalis, T.A.; Nikolaou, I.E.; Konstantakopoulou, F.; Zhang, Y.; Evangelinos, K.I. Evaluating the corporate environmental profile by analyzing corporate social responsibility reports. Econ. Anal. Policy 2020, 66, 63–75. [Google Scholar] [CrossRef]
- Prabhu, V.S.; Shrivastava, S.; Mukhopadhyay, K. Life Cycle Assessment of Solar Photovoltaic in India: A Circular Economy Approach. Circ. Econ. Sustain. 2021. [Google Scholar] [CrossRef]
- Mestre, A.; Cooper, T. Circular product design. A multiple loops life cycle design approach for the circular economy. Des. J. 2017, 20 (Suppl. 1), S1620–S1635. [Google Scholar] [CrossRef] [Green Version]
- Östlin, J.; Sundin, E.; Björkman, M. Product life-cycle implications for remanufacturing strategies. J. Clean. Prod. 2009, 17, 999–1009. [Google Scholar] [CrossRef] [Green Version]
- Navare, K.; Muys, B.; Vrancken, K.C.; Van Acker, K. Circular economy monitoring–How to make it apt for biological cycles? Resour. Conserv. Recycl. 2021, 170, 105563. [Google Scholar] [CrossRef]
- Kaminioti, E.; Kottaridi, C.; Economidou, C. Bioeconomy and Corporate GRI Reporting: A Case Study Analysis. Circ. Econ. Sustain. 2021. [Google Scholar] [CrossRef]
- Velter, M.G.E.; Bitzer, V.; Bocken, N.M.P. A boundary tool for multi-stakeholder sustainable business model innovation. Circ. Econ. Sustain. 2021. [Google Scholar] [CrossRef] [PubMed]
- World Business Council for Sustainable Development. Guide to Corporate Ecosystem Valuation: A Framework for Improving Corporate Decision-Making; World Business Council for Sustainable Development: Geneva, Switzerland, 2011. [Google Scholar]
- Hanson, C.; Ranganathan, J.; Iceland, C.; Finisdore, J. The Corporate Ecosystem Services Review-Guidelines for Identifying Business Risks and Opportunities Arising from Ecosystem Change, Version 2; World Business Council for Sustainable Development: Geneva, Switzerland, 2012. [Google Scholar]
- Tasdemir, C.; Gazo, R.; Quesada, H.J. Sustainability benchmarking tool (SBT): Theoretical and conceptual model proposition of a composite framework. Environ. Dev. Sustain. 2020, 22, 6755–6797. [Google Scholar] [CrossRef]
- Pagotto, M.; Halog, A. Towards a circular economy in Australian agri-food industry: An application of input-output oriented approaches for analyzing resource efficiency and competitiveness potential. J. Ind. Ecol. 2016, 20, 1176–1186. [Google Scholar] [CrossRef]
- Li, R.H.; Su, C.H. Evaluation of the circular economy development level of Chinese chemical enterprises. Procedia Environ. Sci. 2012, 13, 1595–1601. [Google Scholar] [CrossRef] [Green Version]
- Ezeudu, O.B.; Ezeudu, T.S. Implementation of circular economy principles in industrial solid waste management: Case studies from a developing economy (Nigeria). Recycling 2019, 4, 42. [Google Scholar] [CrossRef] [Green Version]
- Harik, R.; El Hachem, W.; Medini, K.; Bernard, A. Towards a holistic sustainability index for measuring sustainability of manufacturing companies. Int. J. Prod. Res. 2015, 53, 4117–4139. [Google Scholar] [CrossRef]
- Dora, M. Collaboration in a circular economy: Learning from the farmers to reduce food waste. J. Enterp. Inf. Manag. 2019, 33, 769–789. [Google Scholar] [CrossRef]
- Sharma, V.K.; Chandna, P.; Bhardwaj, A. Green supply chain management related performance indicators in agro industry: A review. J. Clean. Prod. 2017, 141, 1194–1208. [Google Scholar] [CrossRef]
- Núñez-Cacho, P.; Leyva-Díaz, J.C.; Sánchez-Molina, J.; Van der Gun, R. Plastics and sustainable purchase decisions in a circular economy: The case of Dutch food industry. PLoS ONE 2020, 15, e0239949. [Google Scholar] [CrossRef] [PubMed]
- Maloni, M.J.; Brown, M.E. Corporate social responsibility in the supply chain: An application in the food industry. J. Bus. Ethics 2006, 68, 35–52. [Google Scholar] [CrossRef]
- Vijayan, G.; Kamarulzaman, N.H.; Mohamed, Z.A.; Abdullah, A.M. Sustainability in food retail industry through reverse logistics. Int. J. Supply Chain Manag. 2014, 3, 11–23. [Google Scholar]
- Kazancoglu, Y.; Ekinci, E.; Mangla, S.K.; Sezer, M.D.; Kayikci, Y. Performance evaluation of reverse logistics in food supply chains in a circular economy using system dynamics. Bus. Strategy Environ. 2021, 30, 71–91. [Google Scholar] [CrossRef]
- Borrello, M.; Caracciolo, F.; Lombardi, A.; Pascucci, S.; Cembalo, L. Consumers’ perspective on circular economy strategy for reducing food waste. Sustainability 2017, 9, 141. [Google Scholar] [CrossRef] [Green Version]
Figure 1.
Structure of the methodology to assess the social impact of a circular economy product.

Figure 2.
Boundaries of the system of a firm’s operations related to circular economy principles.

Figure 3.
The values of the composite indexes for each phase and firm.

Figure 4.
The SII scores for each firm.

Table 1.
Indicators for measuring the social impacts of circular economy in the product’s life cycle. The codification used for the GRI-based indicators is presented according to the GRI standard disclosure codification (GRI, 2018; see also Appendix A).
Table 1.
Indicators for measuring the social impacts of circular economy in the product’s life cycle. The codification used for the GRI-based indicators is presented according to the GRI standard disclosure codification (GRI, 2018; see also Appendix A).
| Stakeholders | Life Cycle Phases | International Guidelines | |||||
|---|---|---|---|---|---|---|---|
| Supply | Transportation | Production | Distribution | Consumption | Reverse Logistics | ||
| Employees | 102-22,35,37, 43; 201-3; 202-2; 308-1,2; 401-1,2,3; 404-1,2,3; 412-1,2; 406-1; 416-1,2 | 102-35,37; 201-3; 202-2; 401-1,2,3; 404-1,2,3; 412-1,2; 406-1; 416-1,2 | 102-2,17,35,36, 37,38,43; 201-3; 202-2; 401-1,2,3; 403-1,2,3,4; 404-1,2; 406-1; 412-1,2; 416-1,2 | 102-35,37; 201-3; 202-2; 401-1,2,3; 403-1,2,3,4; 404-1,2,3,4; 412-1,2; 416-1,2 | 102-35,37; 201-3; 202-2; 401-1,2,3; 403-1,2,3,4; 404-1,2,3,4; 412-1,2; 416-1,2 | 102-35,37; 202-2; 401-1,2,3; 403-1,2,3,4; 404-1,2,3,4; 406-1; 412-1,2; 416-1 | GRI |
| Ec-1: Financial impact on employment of suppliers | Ec-2: Financial impact on employment at transportation | Ec-3: Employment costs Ec-4: Costs for employment insurance | Ec-5: Financial impacts on employment of logistics firms | Ec-6: Costs of sales | Ec-7: Financial impacts on employment in reverse logistics firms | Authors’ own work | |
| Administration/Managers | 102-37,43; 103-2,3; 205-1,2,3; 206-1 | 102-17,22,23,24, 25,26,32,43; 103-2,3; 205-1,2,3; 206-1 | 102-2; 103-3 | 102-2; 103-3 | 102-2; 103-3 | GRI | |
| Ec-8: Costs of purchasing management | Ec9: Costs of transportation management | Ec: Costs of production management; Ec-10: ROI; Ec-11: ROE; Ec-12: ROA; Ec-13: Manager’s dividends remuneration | Ec-14: Costs of distribution management | Ec-15: Costs of sales; Ec-16: Revenues | Ec-17: Costs of reverse logistic procedures | Authors’ own work | |
| Suppliers | 102-37,43; 204-1; 407-1; 408-1; 409-1; 414-1; 404-1 | 306-4; 407-1; 408-1; 409-1 | 102-17,37,43; 103-1; | 306-4; 407-1; 408-1; | GRI | ||
| Ec-18: Cost for suppliers | Ec-19: Costs for raw materials | Ec-20: Costs for recycling and reusing packaging | Authors’ own work | ||||
| Local community | 102-37,43; 412-1,2; 413-1,2; 415-1; 419-1 | 306-4; 412-1,2; 410-1; 411-1; 412-1; 413-1,2; 415-1; 419-1 | 102-2,17,43; 410-1; 411-1; 412-1; 413-1; 415-1 | 102-2; 410-1; 411-1; 412-1,2; 413-1; 415-1; 419-1 | 306-4; 102-2; 410-1; 411-1; 412-1,2; 413-1; 415-1; 419-1 | 102-2; 410-1; 411-1; 412-1,2; 413-1,2; 415-1; 419-1 | GRI |
| Ec-21: Costs for local suppliers | Ec-22: Externalities costs | E-23: Goodwill; Ec-24: Taxes; Ec-25: Charities; Ec-26: Sponsorships | Ec-27: Financial impact on logistics firms | Ec-28: Products/revenue | Authors’ own work | ||
| Consumers | 102-37,43; 412-1,2 | 412-1,2 | 102-2,17,37,43; 103-1; 302-5; 303-1,3; | 102-2; 103-1; 302-5; 303-1,3; 412-1,2; 417-1,2,3; 418-1 | 102-2; 103-1; 302-5; 303-1,3; 412-1,2; 417-1,2,3; 418-1 | GRI | |
| Ec-29: Costs for marketing; Ec-30: Cost for circular economy design; Ec-31: Costs of packaging; Ec-32: RD costs; Ec-33: Investment costs; Ec-34: Revenue from sales; Ec-35: Net profit | Ec-36: Costs for transportation | Ec-37: Costs for sales | Ec-38: Costs for return packaging; Ec-39: Costs for reuse; Ec-40: Costs for recycle revenue | Authors’ own work | |||
| Financial Sector | 102-37,43 | 102-17,37,43; 205-1,2,3; 206-1 | GRI | ||||
| Ec-41: Costs of capital; Ec-42: Total debt monthly; Ec-43: Repayment of loan repayments | Authors’ own work | ||||||
Table 2.
Life cycle social footprint assessment framework for circular economy of a product.
| Indicators | Codification | Normalization | Weights | Composite Indexes | |
|---|---|---|---|---|---|
| Supply | 102-22, 102-35, 102-37, 102-43, 201-3, 202-2, 308-1, 308-2, 401-1, 401-2, 401-3, 404-1, 404-2, 404-3, 412-1, 412-2, 406-1, 416-1, 416-2, Ec-1, 102-37, 102-43, 103-2, 103-3, 205-1, 205-2, 205-3, 206-1, Ec-8, 102-37, 102-43, 204-1, 407-1, 408-1, 409-1, 414-1, 404-1, Ec-18, 102-37, 102-43, 412-1, 412-2, 413-1, 413-2, 415-1, 419-1, Ec-21, 102-37, 102-43, 412-1, 412-2, 102-37, 102-43 | S1, S2, S3, S4, S5, S6, S7, S8, S9, S10, S11, S12, S13, S14, S16, S17, S18, S19, S20, S21, S22, S23, S24, S25, S26, S27, S28, S29, S30, S31, S32, S33, S34, S35, S36, S37, S38, S39, S40, S41, S42, S43, S44, S45, S46, S47, S48, S49, S50, S51, S52, S53 | is the normalized values of Supply phase indicators | ||
| Transportation | 102-35, 102-37, 201-3, 202-2, 401-1, 401-2, 402-3, 404-1, 404-2, 404-3, 412-1, 412-2, 406-1, 416-1, 416-2, Ec-2, Ec-9, 306-4, 407-1, 408-1, 409-1, 306-4, 412-1, 412-2, 410-1, 411-1, 412-1, 413-1, 413-2, 415-1, 419-1, Ec-22, 412-1, 412-2 | T1, T2, T3, T4, T5, T6, T7, T8, T9, T10, T11, T12, T13, T14, T15, T16, T17, T18, T19, T20, T21, T22, T23, T24, T25, T26, T27, T28, T29, T30, T31, T32, T33 | is the normalized values of Transportation phase indicators | ||
| Production | 102-2, 102-17, 102-35, 102-36, 102-37, 102-38, 102-43, 201-3, 202-2, 401-1, 401-2, 401-3, 403-1, 403-2, 403-3, 403-4, 404-1, 404-2, 406-1, 412–1, 412-2, 41-1, 416-2, Ec-3, Ec- 4, 102-17, 102-22, 102-23, 102-24, 102-25, 102-26, 102-32, 102-43, 103-2, 103-3, 205-1, 205-2, 205-3, 206-1, Ec-10, Ec-11, Ec-12, Ec-13, 102-17, 102-37, 102-43, 103-1, 102-2, 102-17, 102-43, 410-1, 411-1, 412-1, 413-1, 415-1, 410-1, Ec-19, 102-2, 102-17, 102-43, 410-1, 411-1, 412-1, 413-1, 415-1, 410-1, Ec-23, Ec-29, Ec-30, Ec-31, Ec-32, Ec-33, Ec-34, Ec-35, Ec-24, Ec-25, Ec-26, 102-2, 102-17, 102-37, 102-43, 10-1, 302–5, 303-1, 303-3, Ec-29, Ec-30, Ec-31, Ec-32, Ec-33, Ec-34, Ec-35, 102-17, 102-37, 102-43, 205-1, 205-2, 205-3, 206-1, Ec-41, Ec-42, Ec- 43 | P1, P2, P3, P4, P5, P6, P7, P8, P9, P10, P11, P12, P13, P14, P15, P16, P17, P18, P19, P20 P21, P22, P23, P24, P25, P26, P27, P28, P29, P30, P31, P32, P33, P34, P35, P36, P37, P38, P39, P40, P41, P42, P43, P44, P45, P46, P47, P48, P49, P50, P51, P52, P53, P54, P55, P56, P57, P58, P59, P60, P61, P62, P63, P64, P65, P66, P67, P68, P69, P70, P71, P72, P73, P74, P75, P76, P77, P78, P79, P80, P81, P82, P83, P84, P85, P86, P87, P88, P89, P90, P91, P92, P93, P94, P95, P96, P97, P98, P99, P100 | is the normalized values of production indicators | ||
| Disposal | 102-35, 102-37, 201-3, 202-2, 401-1, 401-2, 401-3, 403-1, 403-2, 403-3, 403-4, 404-1, 404-2, 404-3, 404-4, 412-1, 412-2, 41-1, 416-2, Ec-5, 102-2, 103-3, Ec-14, 102-2, 410-1, 411-1, 412-1, 412-2, 413-1, 415-1, 419-1, Ec-27, 102-2, 103-1, 30-5, 303-1, 303-3, 412-1, 412-2, 417-1, 417-2, 417-3, 418-1, Ec-36 | D1, D2, D3, D4, D5, D6, D7, D8, D9, D10, D11, D12, D13, D14, D15, D16, D17, D18, D19, D20, D21, D22, D23, D24, D25, D26, D27, D28, D29, D30, D31, D32, D33, D34, D35, D36, D37, D38, D39, D40, D41, D42, D43 | is the normalized values of the dispose phase indicators | ||
| Consumption | 102-35, 102-37, 201-3, 202-2, 401-1, 401-2, 401-3, 403-1, 403-2, 403-3, 403-4, 404-1, 404-2, 404-3, 404-4, 412-1, 412-2, 416-1, 416-2, Ec-6, 102-1, 103-3, Ec-15, Ec-1, 306-4, 407-1, 408-1, 409-1, 306-4, 102-2, 410-1, 411-1, 412-1, 412-2, 413-1, 415-1, 419-1, Ec-28, 102-2, 103-1, 302-5, 303-1, 303-3, 412-1, 412-2, 417-1, 417-2, 417-3, 418-1, Ec-37 | C1, C2, C3, C4, C5, C6, C7, C8, C9, C10, C11, C12, C13, C14, C15, C16, C17, C18, C19, C20, C21, C22, C23, C24, C25, C26, C27, C28, C29, C30, C31, C32, C33, C34, C35, C36, C37, C38, C39, C40, C41, C42, C43, C44, C45, C46, C47, C48, C49, C50 | is the normalized values of the consumption phase indicators | ||
| Reverse logistics | 102-35, 102-37, 202-2, 401-1, 401-2, 401-3, 403-1, 403-2, 403-3, 403-4, 404-1, 404-2, 404-3, 404-4, 406-1, 412-1, 412-2, 416-1, 103-3, Ec-7, Ec-17, 102-2, 103-3, Ec-20, 102-2, 410-1, 41-1, 412-1, 412-2, 413-1, 413-2, 415-1, 419-1, Ec-38, Ec-39, Ec-40 | R1, R2, R3, R4, R5, R6, R7, R8, R9, R10, R11, R12, R13, R14, R15, R16, R17, R18, R19, R20, R21, R22, R23, R24, R25, R26, R27, R28, R29, R30, R31, R32, R33, R34, R35, R36, R37 | is the normalized values of reverse logistics phase indicators |
Table 3.
The results from the supply phase for the firm F1.
| Score | Normalized Values | Weight | Final Score | Score | Normalized Values | Weight | Final Score | ||
|---|---|---|---|---|---|---|---|---|---|
| S1 | 8 | 0.75 | 0.001989 | 0.001492 | S28 | 7 | 0.5 | 0.001326 | 0.000663 |
| S2 | 7 | 0.5 | 0.001326 | 0.000663 | S29 | 8 | 0.75 | 0.001989 | 0.001492 |
| S3 | 6 | 0.25 | 0.000663 | 0.000166 | S30 | 7 | 0.5 | 0.001326 | 0.000663 |
| S4 | 7 | 0.5 | 0.001326 | 0.000663 | S31 | 8 | 0.75 | 0.001989 | 0.001492 |
| S5 | 8 | 0.75 | 0.001989 | 0.001492 | S32 | 9 | 1 | 0.002653 | 0.002653 |
| S6 | 6 | 0.25 | 0.000663 | 0.000166 | S33 | 7 | 0.5 | 0.001326 | 0.000663 |
| S7 | 9 | 1 | 0.002653 | 0.002653 | S34 | 9 | 1 | 0.002653 | 0.002653 |
| S8 | 7 | 0.5 | 0.001326 | 0.000663 | S35 | 8 | 0.75 | 0.001989 | 0.001492 |
| S9 | 8 | 0.75 | 0.001989 | 0.001492 | S36 | 6 | 0.25 | 0.000663 | 0.000166 |
| S10 | 6 | 0.25 | 0.000663 | 0.000166 | S37 | 7 | 0.5 | 0.001326 | 0.000663 |
| S11 | 7 | 0.5 | 0.001326 | 0.000663 | S38 | 8 | 0.75 | 0.001989 | 0.001492 |
| S12 | 5 | 0 | 0 | 0 | S39 | 9 | 1 | 0.002653 | 0.002653 |
| S13 | 6 | 0.25 | 0.000663 | 0.000166 | S40 | 7 | 0.5 | 0.001326 | 0.000663 |
| S14 | 7 | 0.5 | 0.001326 | 0.000663 | S41 | 6 | 0.25 | 0.000663 | 0.000166 |
| S15 | 5 | 0 | 0 | 0 | S42 | 5 | 0 | 0 | 0 |
| S16 | 7 | 0.5 | 0.001326 | 0.000663 | S43 | 6 | 0.25 | 0.000663 | 0.000166 |
| S17 | 8 | 0.75 | 0.001989 | 0.001492 | S44 | 5 | 0 | 0 | 0 |
| S18 | 9 | 1 | 0.002653 | 0.002653 | S45 | 6 | 0.25 | 0.000663 | 0.000166 |
| S19 | 7 | 0.5 | 0.001326 | 0.000663 | S46 | 7 | 0.5 | 0.001326 | 0.000663 |
| S20 | 6 | 0.25 | 0.000663 | 0.000166 | S47 | 8 | 0.75 | 0.001989 | 0.001492 |
| S21 | 5 | 0 | 0 | 0 | S48 | 9 | 1 | 0.002653 | 0.002653 |
| S22 | 6 | 0.25 | 0.000663 | 0.000166 | S49 | 8 | 0.75 | 0.001989 | 0.001492 |
| S23 | 7 | 0.5 | 0.001326 | 0.000663 | S50 | 7 | 0.5 | 0.001326 | 0.000663 |
| S24 | 8 | 0.75 | 0.001989 | 0.001492 | S51 | 7 | 0.5 | 0.001326 | 0.000663 |
| S25 | 8 | 0.75 | 0.001989 | 0.001492 | S52 | 6 | 0.25 | 0.000663 | 0.000166 |
| S26 | 9 | 1 | 0.002653 | 0.002653 | S53 | 7 | 0.5 | 0.001326 | 0.000663 |
| S27 | 8 | 0.75 | 0.001989 | 0.001492 |
Table 4.
The results from the transportation phase for firm F1.
| Score | Normalized Values | Weight | Final Score | Score | Normalized Values | Weight | Final Score | ||
|---|---|---|---|---|---|---|---|---|---|
| T1 | 8 | 0.75 | 0.002918 | 0.002189 | T18 | 8 | 0.75 | 0.002918 | 0.002189 |
| T2 | 9 | 1 | 0.003891 | 0.003891 | T19 | 7 | 0.5 | 0.001946 | 0.000973 |
| T3 | 8 | 0.75 | 0.002918 | 0.002189 | T20 | 8 | 0.75 | 0.002918 | 0.002189 |
| T4 | 9 | 1 | 0.003891 | 0.003891 | T21 | 9 | 1 | 0.003891 | 0.003891 |
| T5 | 8 | 0.75 | 0.002918 | 0.002189 | T22 | 8 | 0.75 | 0.002918 | 0.002189 |
| T6 | 7 | 0.5 | 0.001946 | 0.000973 | T23 | 7 | 0.5 | 0.001946 | 0.000973 |
| T7 | 8 | 0.75 | 0.002918 | 0.002189 | T24 | 6 | 0.25 | 0.000973 | 0.000243 |
| T8 | 9 | 1 | 0.003891 | 0.003891 | T25 | 7 | 0.5 | 0.001946 | 0.000973 |
| T9 | 9 | 1 | 0.003891 | 0.003891 | T26 | 8 | 0.75 | 0.002918 | 0.002189 |
| T10 | 5 | 0 | 0 | 0 | T27 | 9 | 1 | 0.003891 | 0.003891 |
| T11 | 6 | 0.25 | 0.000973 | 0.000243 | T28 | 8 | 0.75 | 0.002918 | 0.002189 |
| T12 | 7 | 0.5 | 0.001946 | 0.000973 | T29 | 7 | 0.5 | 0.001946 | 0.000973 |
| T13 | 8 | 0.75 | 0.002918 | 0.002189 | T30 | 8 | 0.75 | 0.002918 | 0.002189 |
| T14 | 9 | 1 | 0.003891 | 0.003891 | T31 | 9 | 1 | 0.003891 | 0.003891 |
| T15 | 8 | 0.75 | 0.002918 | 0.002189 | T32 | 8 | 0.75 | 0.002918 | 0.002189 |
| T16 | 7 | 0.5 | 0.001946 | 0.000973 | T33 | 7 | 0.5 | 0.001946 | 0.000973 |
| T17 | 8 | 0.75 | 0.002918 | 0.002189 |
Table 5.
The results from the production phase for firm F1.
| Score | Normalized Values | Weight | Final Score | Score | Normalized Values | Weight | Final Score | Score | Normalized Values | Weight | Final Score | Score | Normalized Values | Weight | Final Score | ||||
|---|---|---|---|---|---|---|---|---|---|---|---|---|---|---|---|---|---|---|---|
| P1 | 8 | 0.8 | 0.001032 | 0.000826 | P26 | 9 | 1 | 0.00129 | 0.00129 | P51 | 8 | 0.8 | 0.001032 | 0.000826 | P76 | 8 | 0.8 | 0.001032 | 0.000826 |
| P2 | 9 | 1 | 0.00129 | 0.00129 | P27 | 9 | 1 | 0.00129 | 0.00129 | P52 | 9 | 1 | 0.00129 | 0.00129 | P77 | 6 | 0.4 | 0.000516 | 0.000206 |
| P3 | 8 | 0.8 | 0.001032 | 0.000826 | P28 | 9 | 1 | 0.00129 | 0.00129 | P53 | 9 | 1 | 0.00129 | 0.00129 | P78 | 7 | 0.6 | 0.000774 | 0.000465 |
| P4 | 7 | 0.6 | 0.000774 | 0.000465 | P29 | 5 | 0.2 | 0.000258 | 5.16E-05 | P54 | 7 | 0.6 | 0.000774 | 0.000465 | P79 | 8 | 0.8 | 0.001032 | 0.000826 |
| P5 | 8 | 0.8 | 0.001032 | 0.000826 | P30 | 6 | 0.4 | 0.000516 | 0.000206 | P55 | 8 | 0.8 | 0.001032 | 0.000826 | P80 | 9 | 1 | 0.00129 | 0.00129 |
| P6 | 8 | 0.8 | 0.001032 | 0.000826 | P31 | 7 | 0.6 | 0.000774 | 0.000465 | P56 | 9 | 1 | 0.00129 | 0.00129 | P81 | 8 | 0.8 | 0.001032 | 0.000826 |
| P7 | 8 | 0.8 | 0.001032 | 0.000826 | P32 | 8 | 0.8 | 0.001032 | 0.000826 | P57 | 8 | 0.8 | 0.001032 | 0.000826 | P82 | 7 | 0.6 | 0.000774 | 0.000465 |
| P8 | 7 | 0.6 | 0.000774 | 0.000465 | P33 | 6 | 0.4 | 0.000516 | 0.000206 | P58 | 9 | 1 | 0.00129 | 0.00129 | P83 | 6 | 0.4 | 0.000516 | 0.000206 |
| P9 | 8 | 0.8 | 0.001032 | 0.000826 | P34 | 7 | 0.6 | 0.000774 | 0.000465 | P59 | 9 | 1 | 0.00129 | 0.00129 | P84 | 7 | 0.6 | 0.000774 | 0.000465 |
| P10 | 9 | 1 | 0.00129 | 0.00129 | P35 | 8 | 0.8 | 0.001032 | 0.000826 | P60 | 8 | 0.8 | 0.001032 | 0.000826 | P85 | 8 | 0.8 | 0.001032 | 0.000826 |
| P11 | 8 | 0.8 | 0.001032 | 0.000826 | P36 | 9 | 1 | 0.00129 | 0.00129 | P61 | 7 | 0.6 | 0.000774 | 0.000465 | P86 | 7 | 0.6 | 0.000774 | 0.000465 |
| P12 | 8 | 0.8 | 0.001032 | 0.000826 | P37 | 8 | 0.8 | 0.001032 | 0.000826 | P62 | 6 | 0.4 | 0.000516 | 0.000206 | P87 | 6 | 0.4 | 0.000516 | 0.000206 |
| P13 | 9 | 1 | 0.00129 | 0.00129 | P38 | 7 | 0.6 | 0.000774 | 0.000465 | P63 | 7 | 0.6 | 0.000774 | 0.000465 | P88 | 7 | 0.6 | 0.000774 | 0.000465 |
| P14 | 8 | 0.8 | 0.001032 | 0.000826 | P39 | 8 | 0.8 | 0.001032 | 0.000826 | P64 | 8 | 0.8 | 0.001032 | 0.000826 | P89 | 8 | 0.8 | 0.001032 | 0.000826 |
| P15 | 7 | 0.6 | 0.000774 | 0.000465 | P40 | 9 | 1 | 0.00129 | 0.00129 | P65 | 9 | 1 | 0.00129 | 0.00129 | P90 | 9 | 1 | 0.00129 | 0.00129 |
| P16 | 6 | 0.4 | 0.000516 | 0.000206 | P41 | 8 | 0.8 | 0.001032 | 0.000826 | P66 | 8 | 0.8 | 0.001032 | 0.000826 | P91 | 9 | 1 | 0.00129 | 0.00129 |
| P17 | 7 | 0.6 | 0.000774 | 0.000465 | P42 | 7 | 0.6 | 0.000774 | 0.000465 | P67 | 7 | 0.6 | 0.000774 | 0.000465 | P92 | 9 | 1 | 0.00129 | 0.00129 |
| P18 | 8 | 0.8 | 0.001032 | 0.000826 | P43 | 8 | 0.8 | 0.001032 | 0.000826 | P68 | 8 | 0.8 | 0.001032 | 0.000826 | P93 | 8 | 0.8 | 0.001032 | 0.000826 |
| P19 | 6 | 0.4 | 0.000516 | 0.000206 | P44 | 9 | 1 | 0.00129 | 0.00129 | P69 | 9 | 1 | 0.00129 | 0.00129 | P94 | 7 | 0.6 | 0.000774 | 0.000465 |
| P20 | 7 | 0.6 | 0.000774 | 0.000465 | P45 | 8 | 0.8 | 0.001032 | 0.000826 | P70 | 8 | 0.8 | 0.001032 | 0.000826 | P95 | 8 | 0.8 | 0.001032 | 0.000826 |
| P21 | 8 | 0.8 | 0.001032 | 0.000826 | P46 | 9 | 1 | 0.00129 | 0.00129 | P71 | 7 | 0.6 | 0.000774 | 0.000465 | P96 | 7 | 0.6 | 0.000774 | 0.000465 |
| P22 | 9 | 1 | 0.00129 | 0.00129 | P47 | 8 | 0.8 | 0.001032 | 0.000826 | P72 | 8 | 0.8 | 0.001032 | 0.000826 | P97 | 6 | 0.4 | 0.000516 | 0.000206 |
| P23 | 4 | 0 | 0 | 0 | P48 | 7 | 0.6 | 0.000774 | 0.000465 | P73 | 9 | 1 | 0.00129 | 0.00129 | P98 | 7 | 0.6 | 0.000774 | 0.000465 |
| P24 | 8 | 0.8 | 0.001032 | 0.000826 | P49 | 8 | 0.8 | 0.001032 | 0.000826 | P74 | 8 | 0.8 | 0.001032 | 0.000826 | P99 | 8 | 0.8 | 0.001032 | 0.000826 |
| P25 | 8 | 0.8 | 0.001032 | 0.000826 | P50 | 9 | 1 | 0.00129 | 0.00129 | P75 | 7 | 0.6 | 0.000774 | 0.000465 | P100 | 8 | 0.8 | 0.001032 | 0.000826 |
Table 6.
The results from the disposal phase for firm F1.
| Score | Normalized Values | Weight | Final Score | Score | Normalized Values | Weight | Final Score | ||
|---|---|---|---|---|---|---|---|---|---|
| D1 | 7 | 0.5 | 0.021148 | 0.010574 | D23 | 8 | 0.75 | 0.024169 | 0.018127 |
| D2 | 7 | 0.5 | 0.021148 | 0.010574 | D24 | 9 | 1 | 0.02719 | 0.02719 |
| D3 | 6 | 0.25 | 0.018127 | 0.004532 | D25 | 8 | 0.75 | 0.024169 | 0.018127 |
| D4 | 7 | 0.5 | 0.021148 | 0.010574 | D26 | 9 | 1 | 0.02719 | 0.02719 |
| D5 | 8 | 0.75 | 0.024169 | 0.018127 | D27 | 9 | 1 | 0.02719 | 0.02719 |
| D6 | 7 | 0.5 | 0.021148 | 0.010574 | D28 | 8 | 0.75 | 0.024169 | 0.018127 |
| D7 | 8 | 0.75 | 0.024169 | 0.018127 | D29 | 8 | 0.75 | 0.024169 | 0.018127 |
| D8 | 9 | 1 | 0.02719 | 0.02719 | D30 | 7 | 0.5 | 0.021148 | 0.010574 |
| D9 | 8 | 0.75 | 0.024169 | 0.018127 | D31 | 7 | 0.5 | 0.021148 | 0.010574 |
| D10 | 7 | 0.5 | 0.021148 | 0.010574 | D32 | 9 | 1 | 0.02719 | 0.02719 |
| D11 | 8 | 0.75 | 0.024169 | 0.018127 | D33 | 8 | 0.75 | 0.024169 | 0.018127 |
| D12 | 7 | 0.5 | 0.021148 | 0.010574 | D34 | 7 | 0.5 | 0.021148 | 0.010574 |
| D13 | 6 | 0.25 | 0.018127 | 0.004532 | D35 | 8 | 0.75 | 0.024169 | 0.018127 |
| D14 | 5 | 0 | 0.015106 | 0 | D36 | 9 | 1 | 0.02719 | 0.02719 |
| D15 | 6 | 0.25 | 0.018127 | 0.004532 | D37 | 8 | 0.75 | 0.024169 | 0.018127 |
| D16 | 7 | 0.5 | 0.021148 | 0.010574 | D38 | 8 | 0.75 | 0.024169 | 0.018127 |
| D17 | 8 | 0.75 | 0.024169 | 0.018127 | D39 | 7 | 0.5 | 0.021148 | 0.010574 |
| D18 | 9 | 1 | 0.02719 | 0.02719 | D40 | 8 | 0.75 | 0.024169 | 0.018127 |
| D19 | 8 | 0.75 | 0.024169 | 0.018127 | D41 | 9 | 1 | 0.02719 | 0.02719 |
| D20 | 7 | 0.5 | 0.021148 | 0.010574 | D42 | 8 | 0.75 | 0.024169 | 0.018127 |
| D21 | 8 | 0.75 | 0.024169 | 0.018127 | D43 | 7 | 0.5 | 0.021148 | 0.010574 |
| D22 | 9 | 1 | 0.02719 | 0.02719 |
Table 7.
The results from the consumption phase for firm F1.
| Score | Normalized Values | Weight | Final Score | Score | Normalized Values | Weight | Final Score | ||
|---|---|---|---|---|---|---|---|---|---|
| C1 | 8 | 0.75 | 0.019656 | 0.014742 | C26 | 9 | 1 | 0.022113 | 0.022113 |
| C2 | 9 | 1 | 0.022113 | 0.022113 | C27 | 9 | 1 | 0.022113 | 0.022113 |
| C3 | 8 | 0.75 | 0.019656 | 0.014742 | C28 | 8 | 0.75 | 0.019656 | 0.014742 |
| C4 | 7 | 0.5 | 0.017199 | 0.0086 | C29 | 7 | 0.5 | 0.017199 | 0.0086 |
| C5 | 8 | 0.75 | 0.019656 | 0.014742 | C30 | 8 | 0.75 | 0.019656 | 0.014742 |
| C6 | 9 | 1 | 0.022113 | 0.022113 | C31 | 8 | 0.75 | 0.019656 | 0.014742 |
| C7 | 9 | 1 | 0.022113 | 0.022113 | C32 | 9 | 1 | 0.022113 | 0.022113 |
| C8 | 8 | 0.75 | 0.019656 | 0.014742 | C33 | 8 | 0.75 | 0.019656 | 0.014742 |
| C9 | 8 | 0.75 | 0.019656 | 0.014742 | C34 | 9 | 1 | 0.022113 | 0.022113 |
| C10 | 7 | 0.5 | 0.017199 | 0.0086 | C35 | 9 | 1 | 0.022113 | 0.022113 |
| C11 | 8 | 0.75 | 0.019656 | 0.014742 | C36 | 8 | 0.75 | 0.019656 | 0.014742 |
| C12 | 8 | 0.75 | 0.019656 | 0.014742 | C37 | 7 | 0.5 | 0.017199 | 0.0086 |
| C13 | 8 | 0.75 | 0.019656 | 0.014742 | C38 | 8 | 0.75 | 0.019656 | 0.014742 |
| C14 | 7 | 0.5 | 0.017199 | 0.0086 | C39 | 9 | 1 | 0.022113 | 0.022113 |
| C15 | 8 | 0.75 | 0.019656 | 0.014742 | C40 | 8 | 0.75 | 0.019656 | 0.014742 |
| C16 | 9 | 1 | 0.022113 | 0.022113 | C41 | 9 | 1 | 0.022113 | 0.022113 |
| C17 | 8 | 0.75 | 0.019656 | 0.014742 | C42 | 9 | 1 | 0.022113 | 0.022113 |
| C18 | 8 | 0.75 | 0.019656 | 0.014742 | C43 | 8 | 0.75 | 0.019656 | 0.014742 |
| C19 | 9 | 1 | 0.022113 | 0.022113 | C44 | 7 | 0.5 | 0.017199 | 0.0086 |
| C20 | 9 | 1 | 0.022113 | 0.022113 | C45 | 6 | 0.25 | 0.014742 | 0.003686 |
| C21 | 8 | 0.75 | 0.019656 | 0.014742 | C46 | 7 | 0.5 | 0.017199 | 0.0086 |
| C22 | 8 | 0.75 | 0.019656 | 0.014742 | C47 | 8 | 0.75 | 0.019656 | 0.014742 |
| C23 | 7 | 0.5 | 0.017199 | 0.0086 | C48 | 9 | 1 | 0.022113 | 0.022113 |
| C24 | 8 | 0.75 | 0.019656 | 0.014742 | C49 | 9 | 1 | 0.022113 | 0.022113 |
| C25 | 9 | 1 | 0.022113 | 0.022113 | C50 | 8 | 0.75 | 0.019656 | 0.014742 |
Table 8.
The results from the reverse logistics phase for firm F1.
| Score | Normalized Values | Weight | Final Score | Score | Normalized Values | Weight | Final Score | ||
|---|---|---|---|---|---|---|---|---|---|
| R1 | 8 | 0.75 | 0.030888 | 0.023166 | R20 | 8 | 0.75 | 0.030888 | 0.023166 |
| R2 | 8 | 0.75 | 0.030888 | 0.023166 | R21 | 7 | 0.5 | 0.027027 | 0.013514 |
| R3 | 7 | 0.5 | 0.027027 | 0.013514 | R22 | 7 | 0.5 | 0.027027 | 0.013514 |
| R4 | 7 | 0.5 | 0.027027 | 0.013514 | R23 | 7 | 0.5 | 0.027027 | 0.013514 |
| R5 | 6 | 0.25 | 0.023166 | 0.005792 | R24 | 7 | 0.5 | 0.027027 | 0.013514 |
| R6 | 7 | 0.5 | 0.027027 | 0.013514 | R25 | 7 | 0.5 | 0.027027 | 0.013514 |
| R7 | 6 | 0.25 | 0.023166 | 0.005792 | R26 | 7 | 0.5 | 0.027027 | 0.013514 |
| R8 | 7 | 0.5 | 0.027027 | 0.013514 | R27 | 7 | 0.5 | 0.027027 | 0.013514 |
| R9 | 6 | 0.25 | 0.023166 | 0.005792 | R28 | 7 | 0.5 | 0.027027 | 0.013514 |
| R10 | 7 | 0.5 | 0.027027 | 0.013514 | R29 | 8 | 0.75 | 0.030888 | 0.023166 |
| R11 | 6 | 0.25 | 0.023166 | 0.005792 | R30 | 8 | 0.75 | 0.030888 | 0.023166 |
| R12 | 5 | 0 | 0.019305 | 0 | R31 | 8 | 0.75 | 0.030888 | 0.023166 |
| R13 | 5 | 0 | 0.019305 | 0 | R32 | 7 | 0.5 | 0.027027 | 0.013514 |
| R14 | 6 | 0.25 | 0.023166 | 0.005792 | R33 | 7 | 0.5 | 0.027027 | 0.013514 |
| R15 | 6 | 0.25 | 0.023166 | 0.005792 | R34 | 6 | 0.25 | 0.023166 | 0.005792 |
| R16 | 7 | 0.5 | 0.027027 | 0.013514 | R35 | 7 | 0.5 | 0.027027 | 0.013514 |
| R17 | 8 | 0.75 | 0.030888 | 0.023166 | R36 | 8 | 0.75 | 0.030888 | 0.023166 |
| R18 | 9 | 1 | 0.034749 | 0.034749 | R37 | 7 | 0.5 | 0.027027 | 0.013514 |
| R19 | 8 | 0.75 | 0.030888 | 0.023166 |
Publisher’s Note: MDPI stays neutral with regard to jurisdictional claims in published maps and institutional affiliations. |
© 2022 by the authors. Licensee MDPI, Basel, Switzerland. This article is an open access article distributed under the terms and conditions of the Creative Commons Attribution (CC BY) license (https://creativecommons.org/licenses/by/4.0/).
Share and Cite
MDPI and ACS Style
Tsalis, T.; Stefanakis, A.I.; Nikolaou, I. A Framework to Evaluate the Social Life Cycle Impact of Products under the Circular Economy Thinking. Sustainability 2022, 14, 2196. https://0-doi-org.brum.beds.ac.uk/10.3390/su14042196
AMA Style
Tsalis T, Stefanakis AI, Nikolaou I. A Framework to Evaluate the Social Life Cycle Impact of Products under the Circular Economy Thinking. Sustainability. 2022; 14(4):2196. https://0-doi-org.brum.beds.ac.uk/10.3390/su14042196
Chicago/Turabian StyleTsalis, Thomas, Alexandros I. Stefanakis, and Ioannis Nikolaou. 2022. "A Framework to Evaluate the Social Life Cycle Impact of Products under the Circular Economy Thinking" Sustainability 14, no. 4: 2196. https://0-doi-org.brum.beds.ac.uk/10.3390/su14042196
Note that from the first issue of 2016, this journal uses article numbers instead of page numbers. See further details here.