Article

Land Use, Landform, and Soil Management as Determinants of Soil Physicochemical Properties and Microbial Abundance of Lower Brahmaputra Valley, India

1
ICAR-National Bureau of Soil Survey and Land Use Planning, Jorhat 785004, AS, India
2
Indira Gandhi Krishi Vishwavidyalaya, Raipur 492012, CT, India
3
Rain Forest Research Institute, Jorhat 785001, AS, India
4
Indian Institute of Soil Water Conservation, Datia 475661, MP, India
5
Feed the Future Innovation Lab for Collaborative Research on Sustainable Intensification, Kansas State University, Manhattan, KS 66506, USA
6
Department of Agronomy, Kansas State University, Manhattan, KS 66506, USA
*
Author to whom correspondence should be addressed.
Sustainability 2022, 14(4), 2241; https://0-doi-org.brum.beds.ac.uk/10.3390/su14042241
Submission received: 28 December 2021 / Revised: 27 January 2022 / Accepted: 7 February 2022 / Published: 16 February 2022
(This article belongs to the Special Issue Land Cover/Land-Use Changes Impacts on Ecosystem)

Abstract

:
Due to the shifting course of the Brahmaputra River, the fluvial landforms of the Brahmaputra Valley of Assam, India, are prone to changes in landform and land use. For sustainable soil management under such conditions, it is crucial to have information about soil physicochemical and biological properties for different land uses. Therefore, the present study was conducted to investigate the soil physicochemical properties and soil microbial population across five major land uses under different landforms, such as paddy fields, banana systems, and arecanut cultivations in the alluvial plains; and rubber plantations and sal forests in the uplands, with varying slope gradients and soil depths (0–25 cm and 25–50 cm) in the lower Brahmaputra Valley. The results of the analysis of variance revealed that the effects of different landforms and land uses were found to be statistically significant on very labile soil organic carbon (VLSOC), available K, B, Fe, Mn, Zn, and Cu, and soil moisture content across two different soil depths. Paddy cultivated systems recorded the highest (1.23%) soil organic carbon (SOC), but these levels were statistically at par with other land use scenarios except for banana systems; whereas, forests and rubber plantations showed the highest VLSOC (0.38% and 0.34%, respectively,) and were significantly different from other land use scenarios. All soil microbial populations (bacteria, fungi, and actinomycetes) studied varied significantly in different land uses across varying soil depths. Perennial land uses under arecanut, rubber, and forest cultivations showed significantly higher microbial populations than paddy and banana systems. The principal component analysis (PCA) identified SOC, VLSOC, Cu, K, B, P, and the bacteria count as the major soil quality parameters of the study area. The results showed that landforms, land use, and management practices collectively affect soil properties. Therefore, soil management choices should take into consideration the landforms and land use for maintaining soil health and its sustainability.

1. Introduction

Investigations on the effect of land-use on the functions of the soil ecosystem is necessary to understand the soil processes in order to protect and regenerate the capacity of the soil to deliver ecosystem services [1]. This vitality of a soil is primarily governed by its health. The biological and physicochemical parameters together determine the sustainability of a land use in terms of soil health [2]. Land use influences both the biological and physicochemical properties of a soil. For example, land use governs the addition of soil organic matter (SOM), the composition of carbon (C) compound being added to soil, the development of soil by the action of the plant roots [3], the variations in soil physicochemical properties, and nutrient availability. The land cover type also influences the microbial dynamics through their litter, root exudates, symbiosis in the root systems, and the provision of a source of carbon (C) to the microbes [4,5]. Land use not only influences the soil surface but also its sub-surface characteristics, leading to variations in physical and chemical conditions, nutrient availability, soil moisture dynamics, and microbial population across different depths [6,7]. The biological and physicochemical properties are interlinked. Soil microbes are the major drivers of nutrient cycling, mineralization-immobilization, organic carbon (OC) dynamics, and nutrient distribution. Furthermore, physicochemical properties such as soil pH, soil organic carbon (SOC), and nutrient dynamics influence microbial abundance [8,9]. Land use, in turn, is closely associated with the landform of a particular land parcel [10]. The topography decides the type of land use, erosion-deposition cycle, retention, and the washing away of soil C and nutrients. Together, the landform, its respective land use, and the management practices determine the long-term sustainability of a particular land parcel [11].
However, the shifts in land use have been reported to create significant differences in the soil health status [12,13]. Fluvial landforms like the Brahmaputra Valley of Assam, India, are prone to change in landforms and related land-uses in the due course of time [14,15] because of the shifting course of the Brahmaputra River. The Brahmaputra Valley is a part of Indus-Ganga-Brahmaputra plains covering a major area of the state of Assam in India. The Brahmaputra Valley is a structural depression whose evolution was governed by the eastern Himalayan syntaxis during the India-Eurasia collision [16]. The lower Brahmaputra Valley is characterized by large widths of channel belts and the development of large alluvial islands and wetlands, along with isolated hillocks sparsely distributed all over the lower Brahmaputra Valley. The varied geomorphology of the area has led to varied land use scenarios. The major land uses of the area are for paddy rice (Oryza sativa) in the younger and older alluvial plains with 0–1% slope, banana (Musa spp.) and arecanut (Areca catechu) in the older alluvial plains and char lands of 1–3% to 3–5% slope, and rubber (Hevea brasiliensis) in the uplands of 3–5% to 5–8% slope. A substantial area is also covered by a public reserve forest of sal (Shorea robusta) plantations in the uplands and inselbergs with a slope of 5–8% to 8–15% or more.
Changes in the biological and physicochemical properties under different land use systems have been studied in North-Eastern India [17,18,19], including the upper Brahmaputra Valley [20]. However, studies regarding the interactions of topography, land use, and management practices in view of long-term sustainability, including the biological parameters of a particular land parcel, are scarce for the Brahmaputra Valley. With this background, our study was an attempt to assess how the topography, major land uses, and management practices act together under natural and farmed field conditions to give rise to the variations in soil physicochemical properties and soil microbial population counts across varying soil depths, important for maintaining the social and environmental vitality of an area.
The present research was carried out in the Rangjuli block of the Goalpara District of the lower Brahmaputra Valley of Assam, India, with the objectives (1) to study the integrative effect of different land uses, topography, and soil depth on microbial population and soil physicochemical properties and underlying processes; (2) to study the interaction among the microbial population count and soil physicochemical properties; and (3) to identify the major drivers of soil quality.

2. Materials and Methods
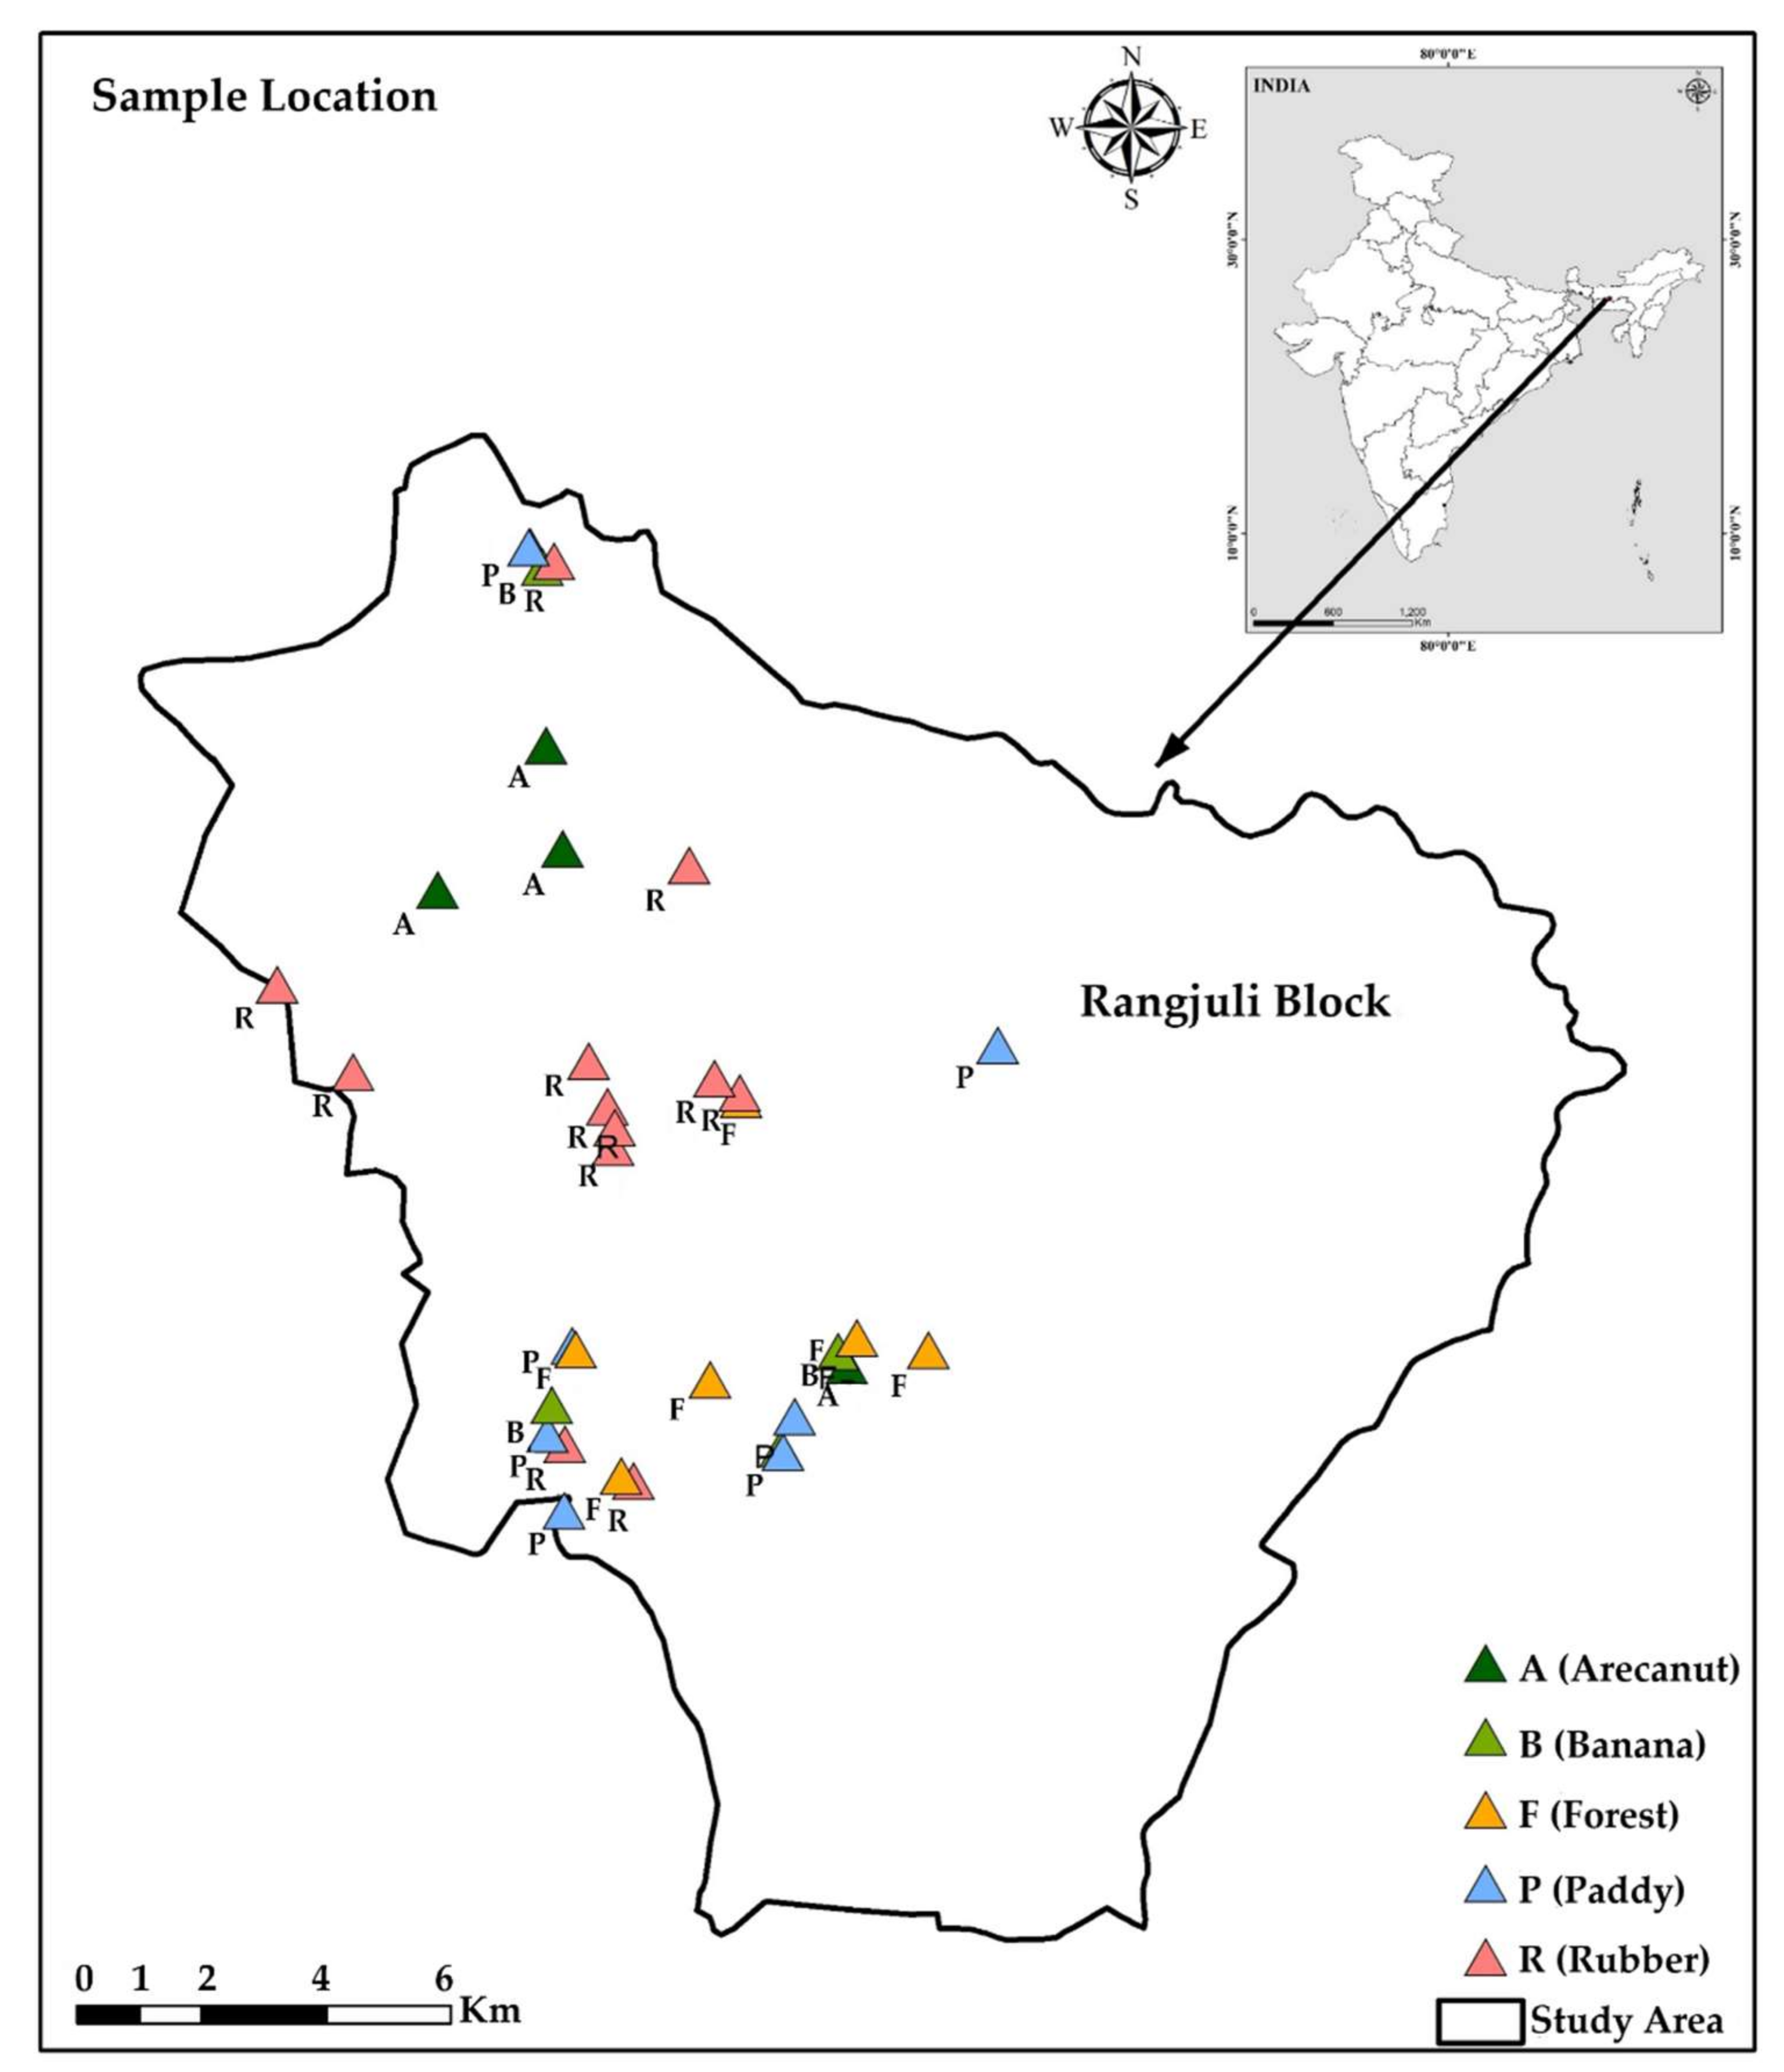
2.1. Study Area

The Rangjuli block of the Goalpara District in Assam is located between 25°53.3’3.637’’ to 26°6’4.73’’ N latitude and from 90°53.3’ 8.231’’ to 90° 5’59.075’’ E longitude, covering an area of 27,725 ha in the lower Brahmaputra Valley (Figure 1). The block displays heterogeneous physiographic condition, viz., alluvial plains in the northern part, gently sloping hillside slopes towards the southern part, and sparsely distributed hillocks or inselbergs in both the northern and southern parts, with elevations ranging from 21 to 210 m above mean sea level (MSL). Due to this physiographic variation, the soils in the various landforms are geologically different. The soils of the plains are mostly derived from the quaternary alluvial sediments brought down by the Brahmaputra River and its tributaries, and soils occurring on the isolated hillocks in the southern parts are made of gneissic materials [21]. The study area belongs to the hot humid eco subregion (15.2) of the agroecological regions of India [22], with a udic moisture regime, a hyperthermic temperature regime [23], and a mean annual precipitation of 2000 to 2500 mm.
Before going to the field for sampling, a base map was prepared merging the land use/land cover map and the landform map of the study area. The maps were prepared using SRTM (30 m) DEM and Sentinel–2 (12.5 m) satellite imagery data using ArcGIS 10.0 software at 1:10,000 scale. Afterwards, using the base map, soils used for this study were collected in February of 2020 from five different land uses, viz., paddy, banana, arecanut, and rubber under long-term (>15 years) cultivation, and sal forests of recent plantations (from 2009 to 2010) under monocropping in farmed fields. The data on management practices collected from the farmers and sites using the same management practices under similar topographies and land uses were treated as one treatment and, based on the availability of such similar plots, samples were collected and treated as replications. The soil samples were collected with an auger at a depth of 0 to 25 cm and 25 to 50 cm. The combination of land use, topography, and management practices has been termed as the ‘scenario’ in our study (Table 1), which is also the treatment. Paddy cultivation in the study area uses no or negligible amounts of fertilizer, and cow dung manure is incorporated before transplanting. Tillage is done before cultivation in the months of May to June and stubble is incorporated into the field. Rubber plantations are fertilized only during planting and afterwards, no fertilization or intercultural operations are performed. Banana plantations are regularly fertilized with urea, SSP (single super phosphate), and MOP (muriate of potash) as per local recommendations. Arecanut plantations are occasionally fertilized with SSP and cow dung manures, as per recommendations. Rubber plantations are not significantly explored or highlighted in the study area, but they are a growing venture in last few years, as is evident from the higher number of plantations of 4 to 7 years old and the relatively lesser number of old plantations of >25 years. The scenarios have been named according to their land uses for ease of representation of the study and are presented in Table 1.
A total of 34 samples were collected from both soil depths. From each field, composite samples were collected by mixing soils from five spots in one field. The number of replications were different for each land use owing to their availability and accessibility in the study area. Along with the soil sample collection, the plantation history, fertilizer management and yield data were also collected from the farmers. Samples were collected aseptically and kept in the sterile polythene bags until further analysis. Half of the soil samples were air-dried, ground, passed through a 2 mm sieve, and stored in plastic bags, while the other half were stored at 4 °C until they were used for performing the microbial population count. Nutrient agar (NA), potato dextrose agar (PDA), and Actinomycete isolation agar (AIA) media were used for obtaining bacterial, fungal, and actinomycetes population counts, respectively. One gram (1 g) of soil sample was transferred into glass vials containing 9 mL sterile distilled water and mixed thoroughly; a series of successive dilutions up to 10-6 were prepared. One mL volume of 10−4-fold diluted samples were spread on the petri dishes in order to obtain the fungal and actinomycetes count. However, 10−6-fold diluted samples were used for the bacterial population count. The inoculated NA plates were incubated at 28 °C for 24 h to determine viable bacterial counts, while the PDA plates were incubated at 28 °C for 5 days. For the actinomycetes population count, inoculated petri plates were incubated at 37 °C for 5 days. Colony forming units (CFUs) were counted using the following formula:
Viable CFU (per g of soil) = Number of colonies × dilution factor/inoculum volume.
The air-dried samples were used for the physicochemical analysis. The samples were passed through a 2 mm sieve and were analyzed for DTPA-extractable Zn, Cu, Mn, and Fe using an atomic absorption spectrophotometer [24], the pH was determined by taking a 1:2 soil–water mixture using a pH meter [25], the available N was determined using the Kjeldahl distillation unit by the KMnO4 method [26], the available P was evaluated by the Bray method for acidic soils using colorimetry [27], the available K was determined by the neutral normal ammonium acetate method and a flame photometer [28], the available S by turbidimetric method [29] and hot water extractable B by colorimetry method of Berger and Troug [30]. For soil organic C, soils were passed through a 100-mesh sieve and analyzed by the chromic acid oxidation and titration method [31]. For the evaluation of very labile soil organic carbon (VLSOC), the methodology of [32] with a 5 mL acid oxidizable fraction of C was followed. The C:N ratio of soils was determined using the ratio of SOC and total N determined by a CN analyzer. The soil moisture content (SMC) was analyzed using the gravimetric method [33]. Soil textural analysis was done using the international pipette method [34].

2.2. Statistical Analysis

The IBM SPSS 28.0.0.0 software was used to perform the statistical analysis. To compare the means of the microbial population counts and the soil physicochemical properties, one-way analysis of variance (ANOVA) was conducted separately for two soil depths, i.e., 0–25 cm and 25–50 cm. The significance of the means was tested using the F-test [35]. Duncan’s multiple range test (DMRT) [36] was used to interpret the treatment (scenario) effect on the soil physicochemical properties and the microbial population count. The Pearson correlation analysis [37] was carried out among the microbial population and soil physicochemical parameters and a correlation matrix was prepared. A principal component analysis (PCA) was carried out using the R statistical package for the complete set of data to determine the variables that have the maximum contribution towards the variability, or the parameters that are the limiting factors. R for each individual was carried out to delineate the PCA biplot for the individual land uses in order to mark a clear differentiation between each land use according to the effect of the biological and physicochemical variables. In total, five treatments (scenarios) were considered, viz., rubber, paddy, banana, arecanut, and sal forest. All the graphs have been prepared using RStudio 1.3.1093. All data are an average ± SD (standard deviation) of the composite soil samples.

3. Results

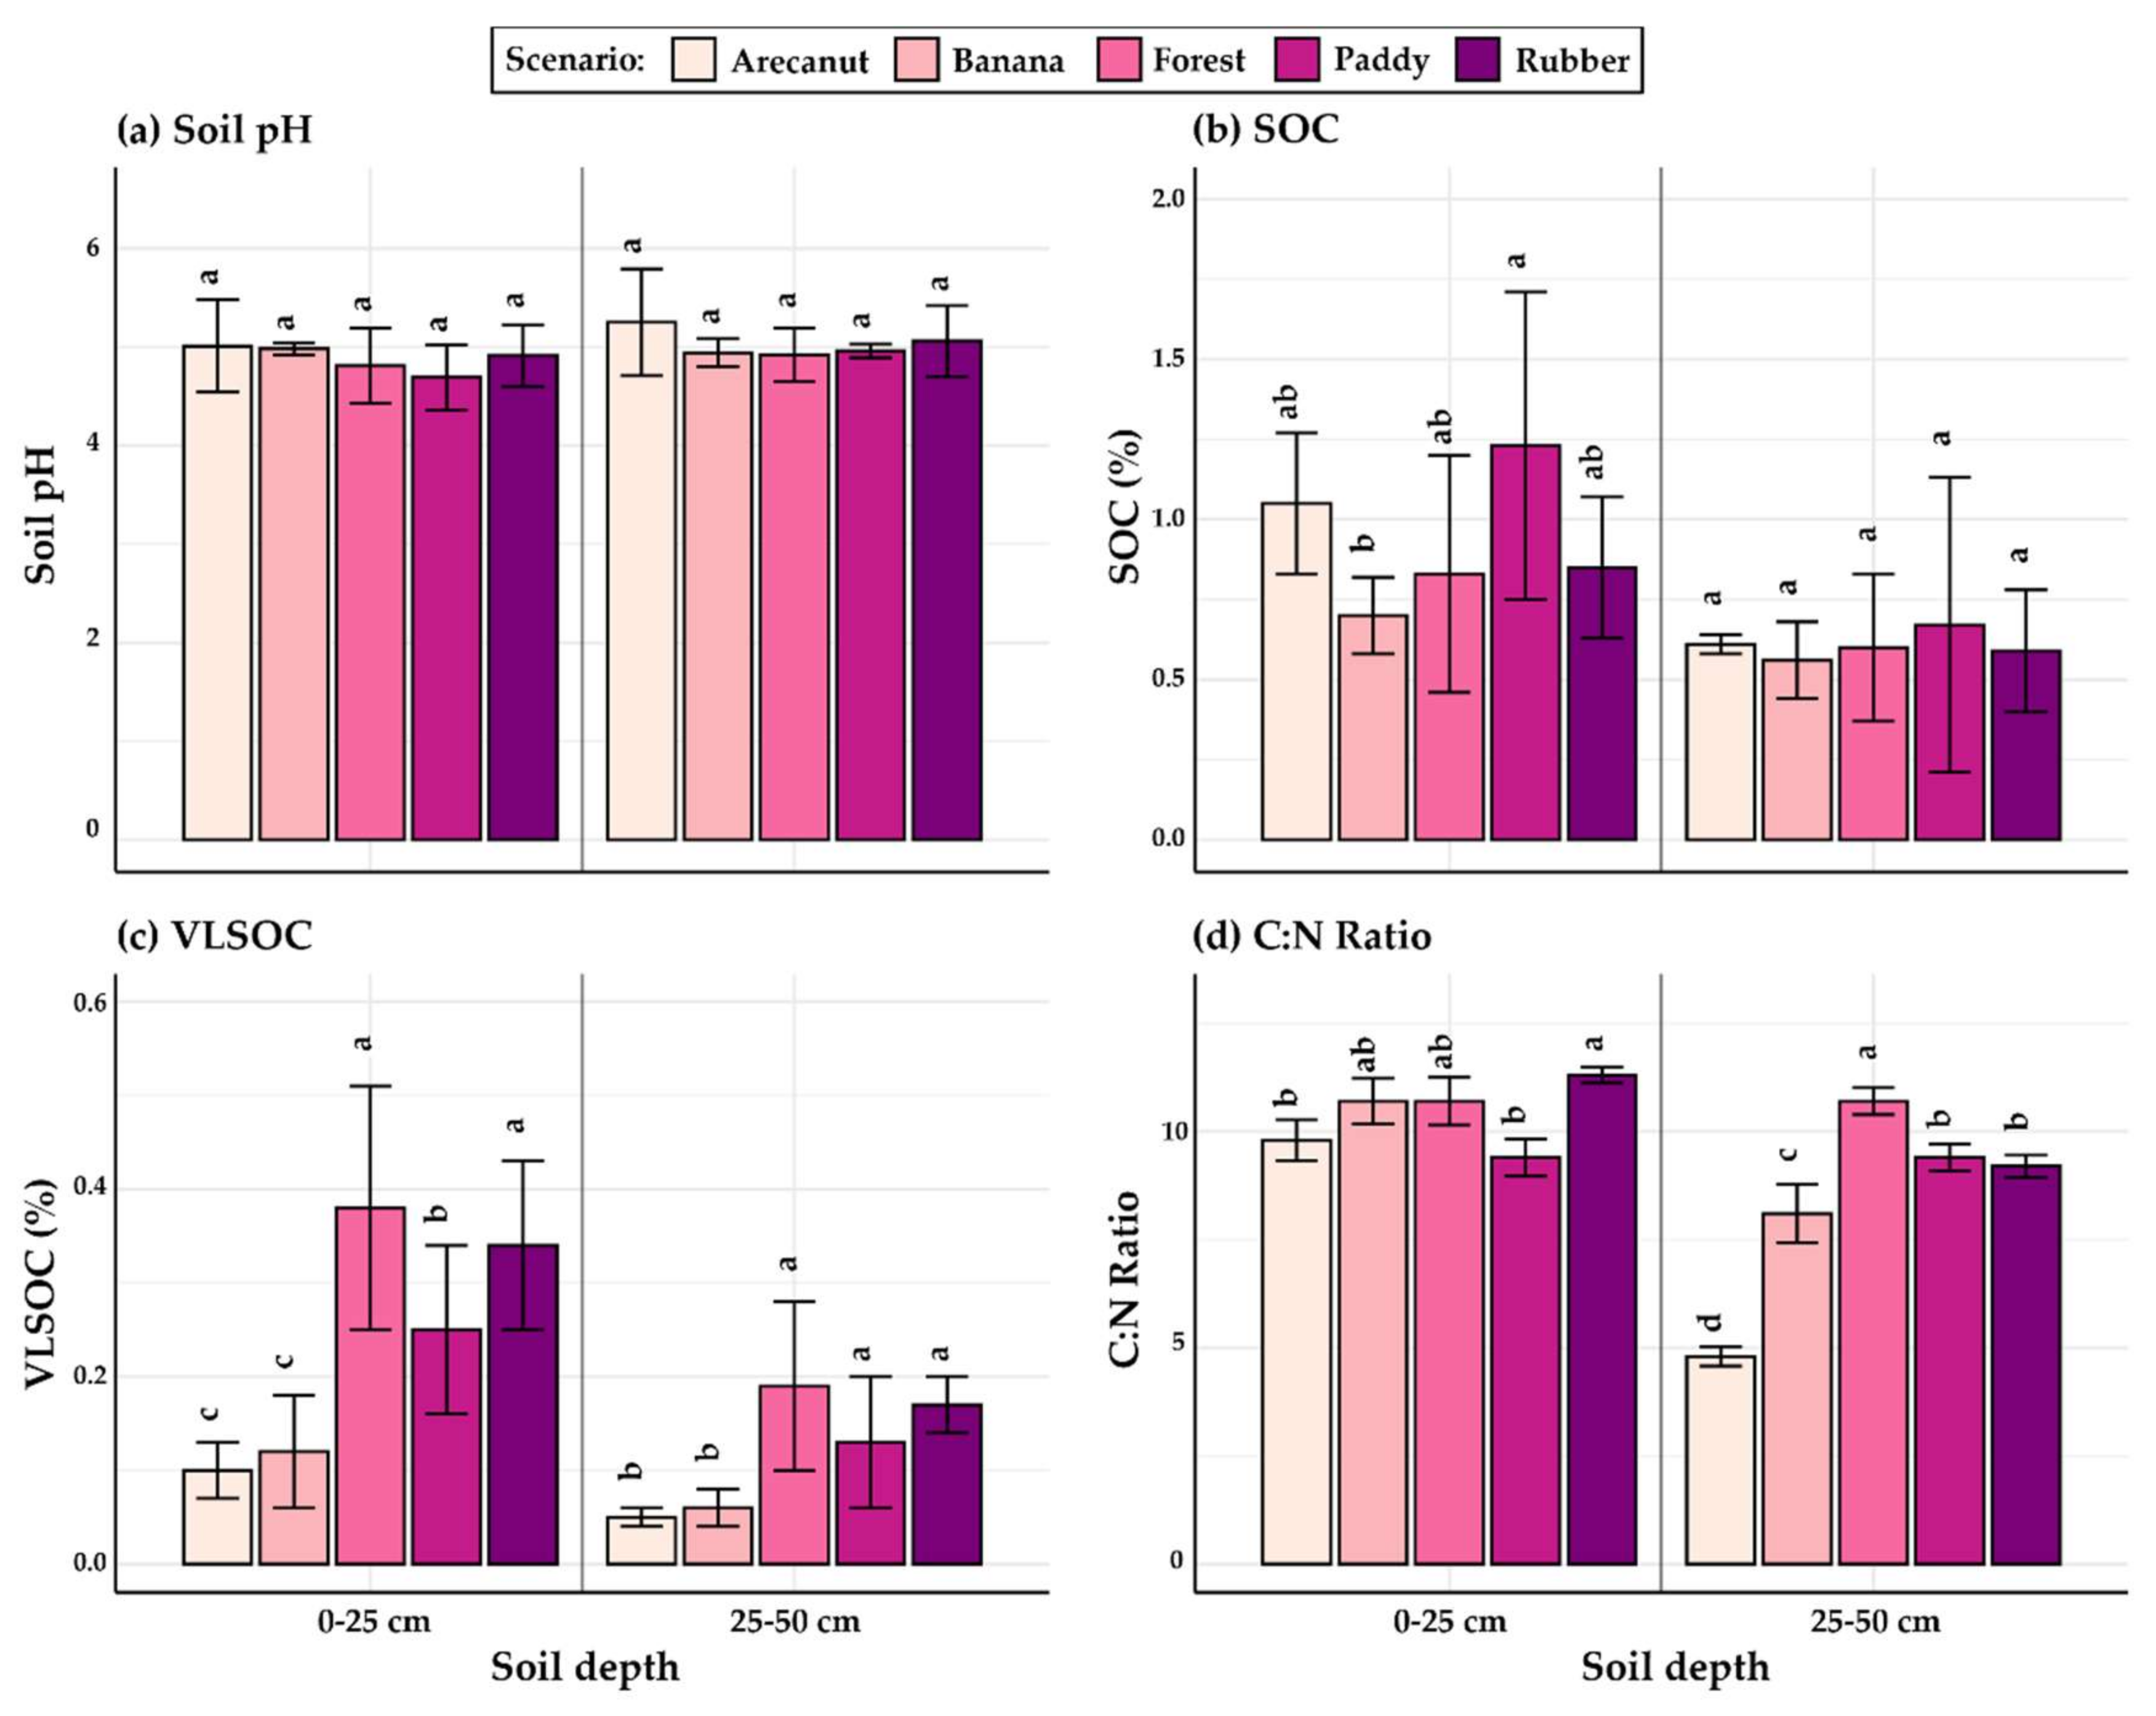
3.1. Soil Physicochemical Properties

3.1.1. 0 to 25 cm Depth

The soil pH was in the acidic range for all the scenarios, varying from 4.69 for paddy fields to 5.01 in arecanut cultivations. However, no significant difference (95% confidence level) was recorded in the soil pH among the scenarios (Figure 2). The pattern of variation of soil pH was paddy fields < sal forest < rubber plantations < banana systems < arecanut cultivations. All the soils had SOC values of > 0.5%. The highest SOC was recorded for paddy fields (1.23%) in the surface layer, followed by arecanut cultivations (1.05%). The lowest SOC was recorded for banana systems (0.7%). SOC in paddy fields was significantly different from banana systems only (p < 0.05); other land uses were at par with paddy fields and banana systems. The VLSOC, in contrast, was highest in sal forests (0.38%), followed by rubber plantations (0.34%). The C:N ratio of the surface soils showed a significant difference (Figure 2) and ranged from 9.4:1 for paddy fields to 11.3:1 for rubber plantations.
The available N (Table 2) was found to be the highest in paddy fields (378.9 kg ha−1), followed by banana systems, and was lowest for sal forests (309.5 kg ha−1). However, no significant difference was noted among the scenarios. Similarly, for available P, no significant difference was noted among the scenarios. The highest value was observed in banana systems (55.1 kg ha−1). Available K ranged from 153 kg ha−1 for paddy fields to 380.4 kg ha−1 for arecanut cultivations, which was significantly higher than in other scenarios. The available S was the highest in paddy fields (15 ppm) and all the scenarios were at par with paddy fields. Hot water-soluble B ranged from 0.37 ppm in sal forests to 0.21 ppm in banana systems. The rubber plantation and paddy fields were at par with sal forests in terms of B, while arecanut cultivations and banana systems showed significantly lower values. The highest DTPA-extractable Fe was recorded for banana systems (103.6 ppm), which was at par with arecanut cultivations, paddy fields, and sal forests, and significantly different from rubber plantations (69.4 ppm). DTPA-extractable Mn was the highest for paddy fields (21.14 ppm), followed by arecanut cultivations and banana systems, while rubber plantations (8.52 ppm) and sal forests (6.29 ppm) showed significantly lower values. DTPA-extractable Zn was recorded as the highest in arecanut cultivations (1.61 ppm) and the lowest for sal forests (0.52 ppm). DTPA-extractable Cu was recorded as the highest in banana systems, whereas the lowest value was recorded in sal forests (0.42 ppm). The soil moisture content varied from 12.9% (banana systems) to 23.16% (paddy fields). Even if the results were insignificant, the variation among the different scenarios in terms of SMC was wide.

3.1.2. 25 to 50 cm Depth

The soil pH was in the acidic range for all the scenarios, varying from 4.92 for sal forests to 5.25 in arecanut cultivations. However, no significant difference (95% confidence level) was recorded in the soil pH among the scenarios (Figure 2). The pattern of variation of soil pH was sal forests < banana systems < paddy fields < rubber plantations < arecanut cultivations. All the soils had SOC > 0.5%. The highest SOC was recorded for paddy fields (0.67%) in the surface layer, followed by arecanut cultivations. The lowest SOC was recorded for banana systems (0.56%). No significant difference was noted in the SOC among the land uses. The VLSOC varied significantly across scenarios, with the highest value for sal forests (0.19%), followed by rubber plantations (0.17%). A significant difference was noted for the C:N ratio (Figure 2), with the highest value for forest (10.7:1) and the lowest for arecanut cultivations (4.8:1). The available N (Table 3) was highest in sal forests (235.5 kg ha−1) and was lowest for rubber plantations (309.5 kg ha−1). However, no significant difference was noted among the scenarios. Similarly, for available P, no significant difference was noted among the scenarios. The highest value was observed in banana systems (47.89 kg ha−1). The available K ranged from 90.38 kg ha−1 for paddy fields to 359.2 kg ha−1 for arecanut cultivations, which was significantly higher than those in other land uses. The available S was recorded as the highest in arecanut cultivations (13.5 ppm) and all the land uses were at par with arecanut cultivations for the available S. The hot water-soluble B ranged from 0.27 ppm in sal forests to 0.17 ppm in banana systems. No significant difference was noted among scenarios in terms of B content. Highest DTPA-extractable Fe was recorded for arecanut cultivations (63.6 ppm) and no significant difference was noted among scenarios. DTPA-extractable Mn was the highest for paddy fields (17.44 ppm) followed by arecanut cultivations and banana systems, while rubber plantations (4.93 ppm) and sal forests (1.61 ppm) showed significantly lower values. The DTPA-extractable Zn was recorded as the highest in arecanut cultivations (0.83 ppm) and the lowest for sal forests (0.52 ppm). The DTPA-extractable Cu was recorded as the highest in banana systems, while the lowest value was recorded in sal forests (0.28 ppm). The soil moisture content varied from 17.64% (arecanut cultivations) to 28.14% (paddy fields).
The soil pH increased with the depth of the sample across all scenarios. The SOC was also higher for the surface layer compared to the sub-surface layer. The VLSOC showed a similar pattern across the depth (Figure 2). All the major and micronutrients showed a decreasing pattern across the depth. The SMC was noted to be higher at a lower depth. The soil texture was found to be finer at the lower depths across all the scenarios (Table 2 and Table 3). The paddy cultivation scenario, however, showed the finest texture of all.

3.2. Microbial Population

The active bacterial population count at the 0–25 cm depth (Table 4) varied from 135 × 106 CFU/g soil for banana systems to 784.3 × 10⁶ CFU/g soil for rubber plantations, which was at par with sal forests (760 × 106 CFU/g soil). The bacterial population in paddy fields, arecanut cultivations, and banana systems were significantly lower than in sal forests and rubber plantations. The bacterial population count decreased at the 25–50 cm soil depth, compared to 0–25 cm, across all the land uses. At the lower depth, the population varied from 135 × 106 CFU/g soil for banana systems to 654 × 106 CFU/g soil for sal forests, which was at par with rubber plantations, while for other scenarios, the bacterial population was significantly lower.
The active fungal population count was found to decrease with the depth of the samples across all the scenarios. It was highest in sal forests (586.6 × 10⁴ CFU/g soil), which was at par with arecanut cultivations, while rubber plantations, paddy fields, and banana systems showed significantly lower values at the 0–25 cm depth. At the 25–50 cm depth, the count varied from 32.5 × 10⁴ CFU/g soil for paddy fields to 80 × 104 CFU/g soil for arecanut cultivations. However, no significant difference was recorded at the lower depth for the different land use scenarios.
The active actinomycetes population count varied from 195 × 104 CFU/g soil in banana systems to 2006 × 104 CFU/g soil in arecanut cultivations at the 0–25 cm depth. The actinomycetes population was found to decrease across the soil depth in all the land uses, except for sal forests and rubber plantations, where it was found to increase. At the 25–50 cm depth, it varied from 157 × 104 CFU/g soil in banana systems to 2766 × 104 CFU/g soil in sal forests. A significant difference was noted among different land uses at both soil depths (Table 4).

3.3. Correlation Analysis

The Pearson multiple correlation method was carried out among all the soil physicochemical parameters, along with their correlation with the bacteria, fungi, and actinomycetes count (Table 5). The soil pH showed a significant negative correlation with SOC, N, B, and VLSOC. A non-significant but positive correlation was noted with P, K, Fe, Mn, Zn, and bacteria, while a non-significant but negative correlation was noted with S, Cu, SMC, fungi, and actinomycetes population for the soil pH. The SOC was significantly positively correlated with N, Fe, Zn, SMC, and VLSOC. A non-significant but positive correlation was noted for the SOC with bacteria, fungi, and the actinomycetes population, as well as for P, Mn, and Cu. The available N showed a significant positive correlation with Fe, VLSOC, and the fungi population and a non-significant positive correlation with Zn, Mn, Cu, B, and K, with almost no correlation with other soil parameters and the microbial count.
The available P showed a significant positive correlation with the available S and a significant negative correlation with the actinomycetes population count. The available K showed a significant positive correlation with Zn, while a significant negative correlation was noted with Cu. The available S showed a significant positive correlation with B and VLSOC, while a significant negative correlation was noted with SMC. However, the available K and S did not show any significant correlation with the microbial population count. B showed a significant positive correlation with VLSOC, bacteria, and the fungi population. Fe showed a significant positive correlation with Zn, Mn, and Cu and a positive (but non-significant) correlation with the fungi population and a negative correlation with the actinomycetes population. Mn showed a significant positive correlation with Cu and a negative correlation with the actinomycetes population count. Cu showed a significant negative correlation with the actinomycetes population and a non-significant but negative correlation with fungi and the bacterial population count. The SMC showed a significant negative correlation with fungi count. The VLSOC showed a significant positive correlation with the bacteria and fungi count and a non-significant positive correlation with actinomycetes. The bacteria and fungi population were significantly positively correlated, and the bacteria and actinomycetes population showed a positive but non-significant correlation. Similarly, fungi and actinomycetes were positively but non-significantly correlated.

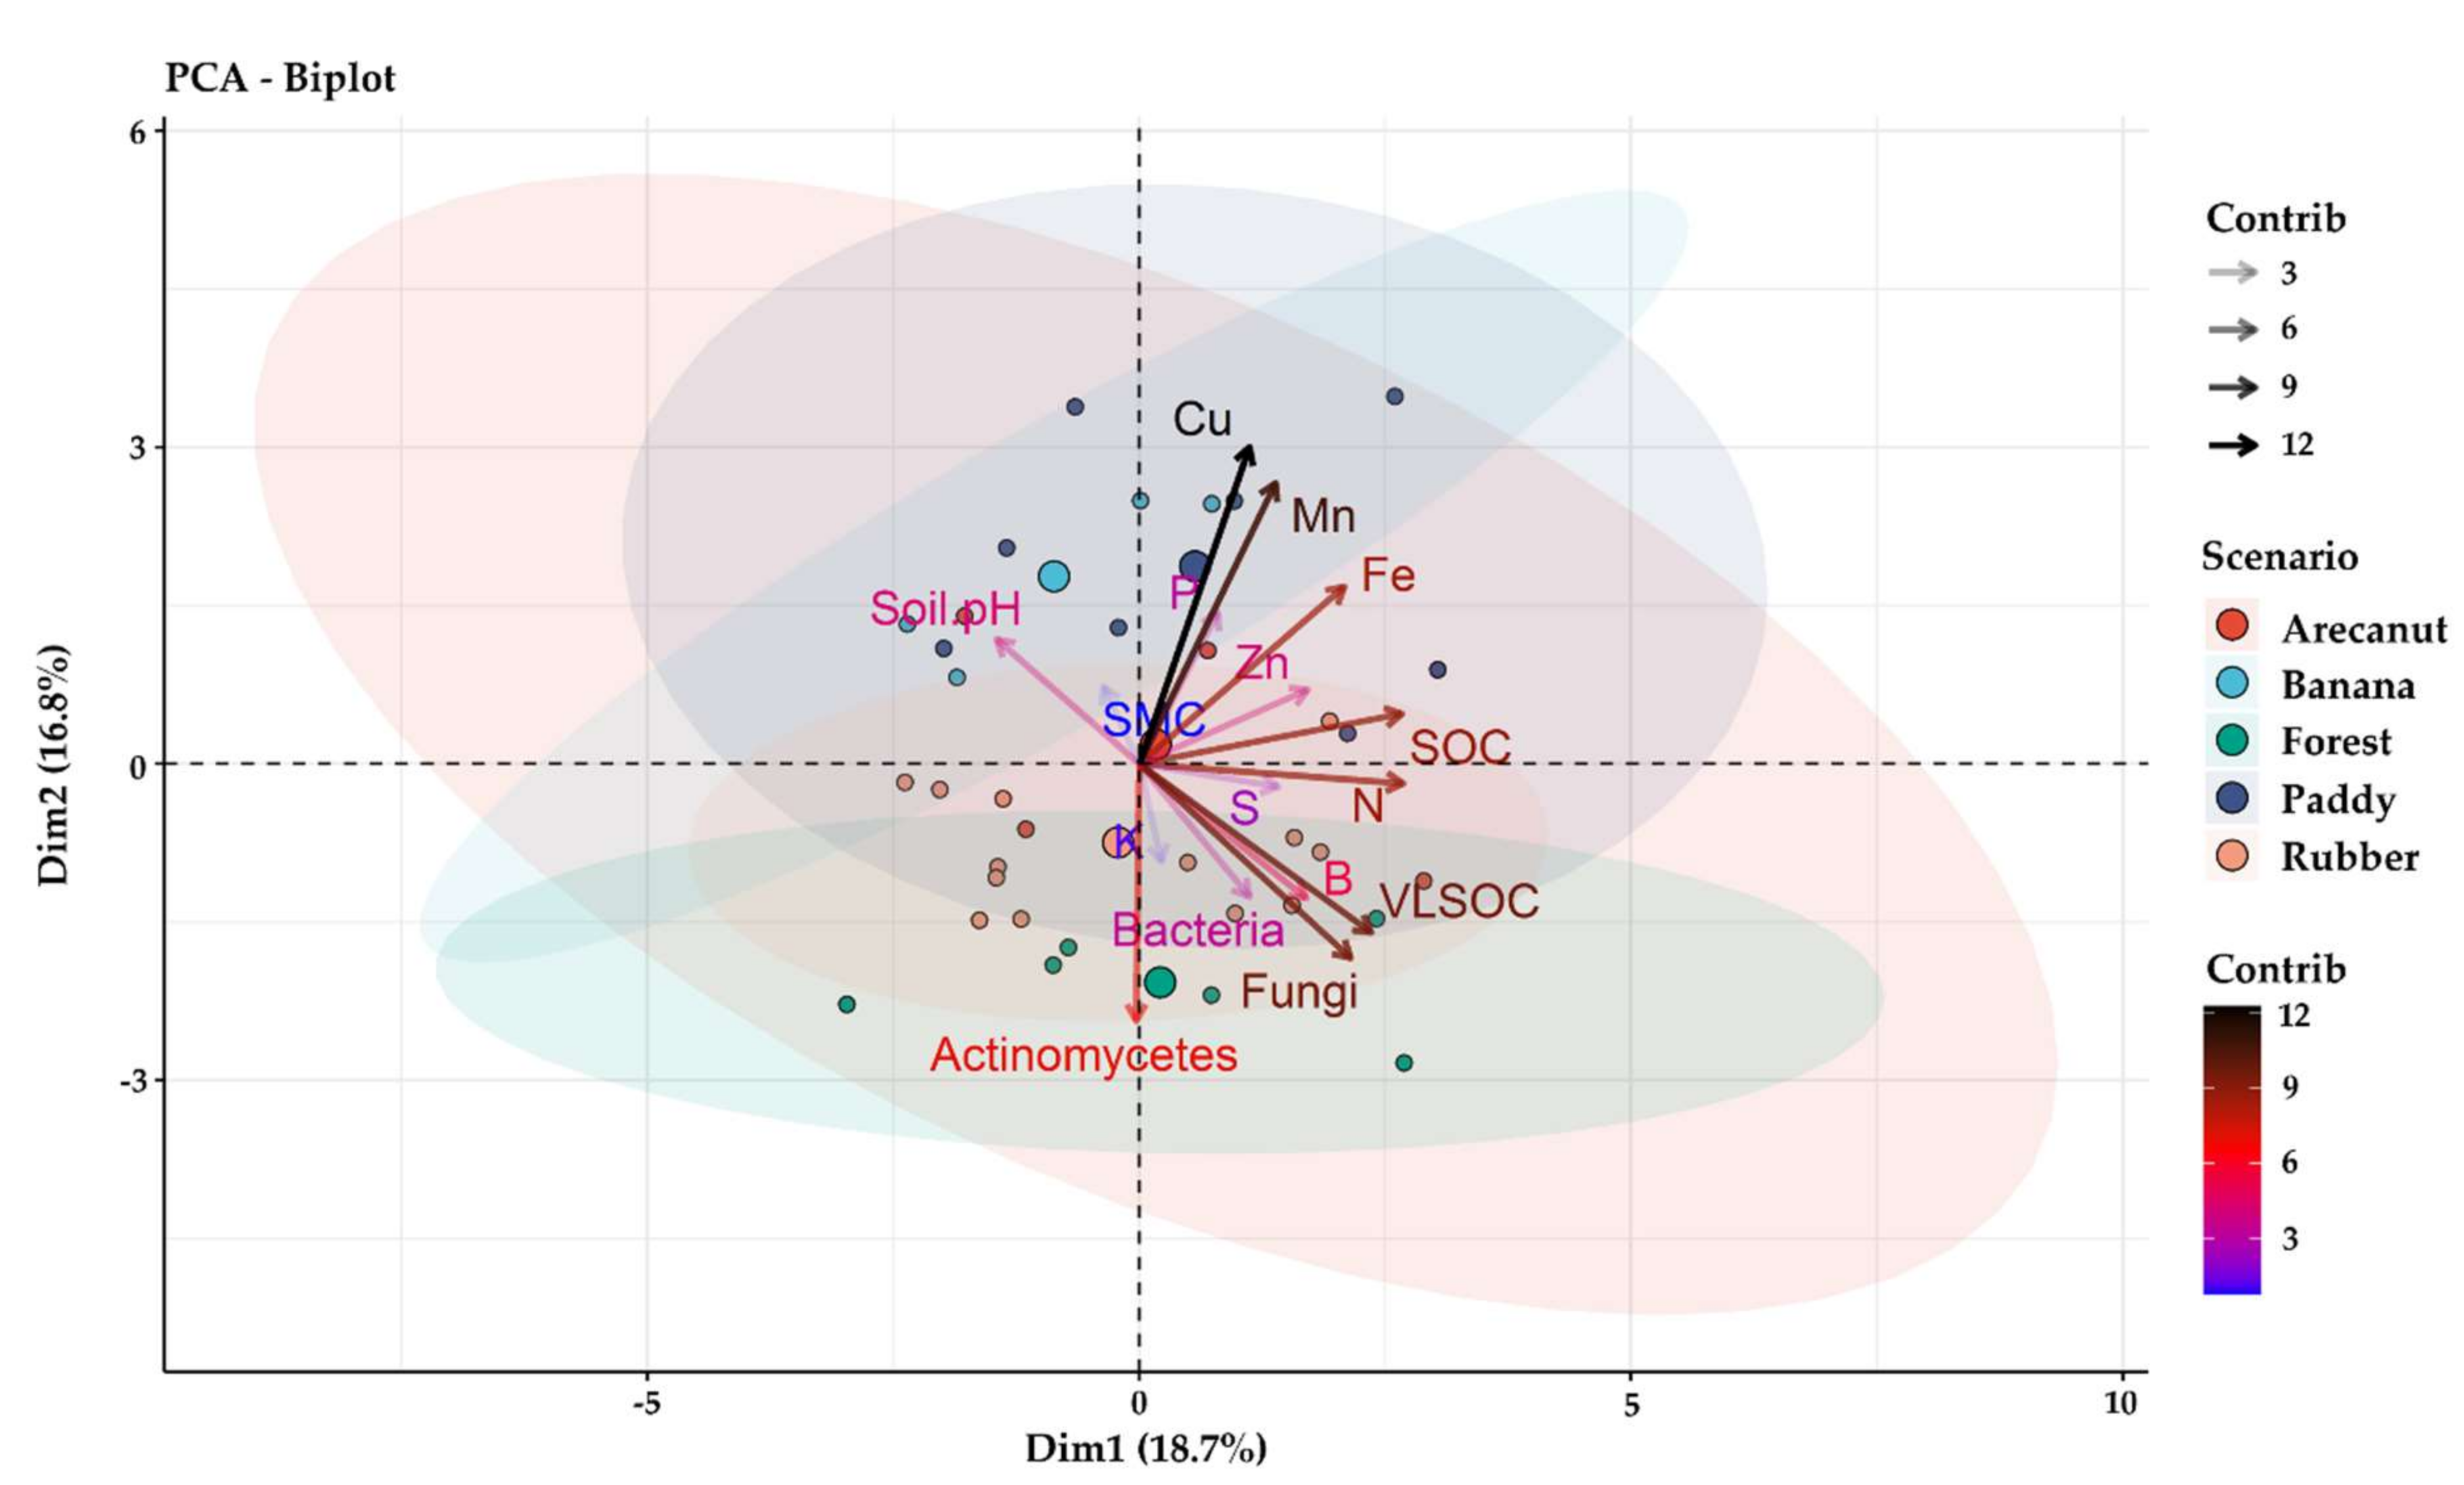
3.4. Principal Component Analysis (PCA) of Variables

The PCA of the variables was carried out for all of the samples from the different scenarios and soil depths in order to identify the variables causing the maximum variation (Table 6). The results showed that six principal components (PCs) had an Eigenvalue >1. These six PCs accounted for a total of 77.5% variation. The correlation of the variables with the six PCs was studied (Table 7). For PC1, the highest correlation values were noted for SOC (0.696), N (0.698), VLSOC (0.614), fungi count (0.559) and Fe (0.543). PC2 showed the highest correlation with Cu (0.781), followed by Mn (0.692), and the actinomycetes count (−0.634). PC3 showed the highest correlation with K (0.629), SMC (−0.612), P (0.538), and S (0.598). PC4 showed the highest correlation with B (−0.628) and K (0.514). PC5 showed the highest correlation with P (0.515). PC6 showed the highest correlation with the bacteria count (0.781). The PCA biplot of the individual scenarios is shown in Figure 3.

4. Discussion

The five scenarios in the present study were different in terms of topography, slope, texture, and land use, resulting in the variation in soil physical, chemical, and biological properties due to the addition of different quantities (% SOC) and qualities (C:N ratio) of organic matter (Figure 2) [38], runoff, erosion, and the redistribution of soil particles and nutrients [39,40]. The topography also controls the soil properties by affecting vegetation, microbial processes, weathering, and soil development [41,42]. Several studies have shown the effect of land use and soil management practices on soil properties in different ecosystems [43,44,45]. The soil pH and SOC varied among the five scenarios in the present research (Table 2), but the difference was not significant (p < 0.05), indicating a greater influence of the climate and parent materials in the variability of pH and SOC. The acidic range of pH is due to the heavy leaching of bases from the surface soil because of the persistent heavy rainfall in the study area. The surface soil showed the lowest pH for the cultivated paddy system resulting from a waterlogging of soils as part of the puddling process during rice production, as well as its location in the level slope (0 to 1%). This leads to a more acidic soil, while the presence of lower acidic soils for other land uses is attributed to the slope and topography that cannot not retain water or moisture for a long period of time, leading to an increase in the pH of the soil. Similar findings have been reported for the Eastern Himalayas [7] and for the Upper Brahmaputra Valley [18]. However, the value of the soil pH was found to invariably increase with the depth of the soil (Figure 2) for all the land use scenarios. This might be because the soil pH of the study area is governed by soil organic matter, and with decreasing soil organic matter across the depth, the soil pH increases. Within the given soil microclimate and moisture regime of the study area, it can be argued that the soil pH is governed by the breakdown of soil organic matter and the release of organic acids, lowering the pH of the surface soil [46]. The significant negative correlation between pH and SOC in our study is the supporting evidence for this phenomenon. Similar findings have been reported in the Mun River Basin of Thailand [47], and in forest soils of the Upper Brahmaputra Valley [18]. However, contradictory findings have also been reported by various studies, where soil pH decreases across the depth [7] in heavy rainfall areas, due to the leaching of the bases down the profile. The SOC was found to be the highest in the paddy cultivated system compared to other land uses, including sal forests and rubber plantations (Figure 2). There may be various reasons underlying this observed trend, one of which may be the topography of the respective land uses. Due to higher slope gradient of the sal forests and rubber plantations plantations, the runoff and related surface soil erosion, evident from the coarser texture of the surface soils (sandy clay loam), might have caused the loss of the SOC [48]. The VLSOC were also found to be the highest in sal forests and rubber plantation, indicating the higher risk of the erosion of the SOC, as observed in another study [49]. Another reason for the low value of the SOC in sal forests might be the secondary nature of the sal plantation, which has not yet reached the organic C buildup and stabilization stage due to young age of plantations. Similar results have been reported by [50], where cultivated lands showed a higher value of total C compared to secondary forests. The higher value of the SOC in paddy soils might be due to their location in the adjacent narrow valleys of the uplands, where there is a deposit of the eroded topsoil from the uplands and occasional flooding of the streams from the Garo Hills of Meghalaya, adjacent to the southern part of the study area, as well as stubble incorporation every year before transplanting. Depositional landscape positions have been reported to accumulate SOC because of the burial of surface soils and the protection from further decomposition [51,52,53,54]. The lower value of the active microbial populations (bacteria, fungi, and actinomycetes) and the VLSOC in paddy soils compared to the sal forests and rubber systems also indicate the slow rate of the decomposition of soil organic matter, and the resultant accumulation of SOC, under the moisture-saturated conditions of the paddy fields. Another reason for the lower values might be the application of cow dung manure and the non-application of inorganic fertilizers. The use of cow dung in paddy soils increased the average CO2 sequestration by 155 to 181% over that found with the inorganic fertilization of the soils of Bangladesh, due to a positive net ecosystem carbon balance [55]. The higher value of SOC in arecanut cultivations, compared to sal forests and rubber plantations, might be due to the stabilization of SOC due to a lack of soil disturbance and the level to nearly level slope gradient, making it safe from erosion of the topsoil. However, the lower SOC values in the paddy fields might be due to a reduced addition of organic matter, via litter fall or manuring. The low value of VLSOC compared to sal forests, rubber plantations, and paddy fields is an indicator of a more stable form of organic C in this scenario. The lowest value of SOC in banana systems might be due to a lack of additional organic matter from litter, as well as the loss due to soil disturbances arising from various intercultural operations, such as earthing up. The lowest VLSOC was also found in banana systems, which might be due to the stabilization of organic C into more recalcitrant forms.
The available N showed no significant difference among the different scenarios at either of the soil depths (Table 1 and Table 2), which might be due to the narrow variation in the SOC level, evident from the very high positive correlation between SOC and available N (Table 5). However, the scenarios with the application of urea, or cow dung, showed a slightly higher value for available N. The available N decreased with the depth of the sample in all the scenario, obviously due to the reception of organic matter and fertilizer in the surface layers of the soil. Similarly, there was no significant variation of the available P among different scenarios, but a very high value was recorded for banana systems, which might be due to the regular application of SSP. The available P also decreased with the depth of the soil samples for all the scenarios. The available K showed significant differences among scenarios, with the highest value for arecanut cultivations. This might have been the result of the interaction of the soil texture and the topography. The finer soil texture (clay loam) of the surface soils compared to the other scenario and the reduced moisture saturation prevented the loss of K from the soil. Despite having similar soil textural characteristics to the arecanut scenario, paddy fields showed the lowest available K, perhaps due to the leaching loss of K from the profile because of moisture saturation during most of the year. The available K also showed a decreasing trend with an increase in the soil depth, except for in the sal forest soil, perhaps due to the finer texture of the subsoil, as well as the deeper root system of the sal trees, which would help in the accumulation of the K leached down from the upper layers. Similar results have been reported by [56] for eucalyptus plantations, where the subsurface soil showed higher available K, and for cultivated soils, the levels were reduced in the subsurface soils. Banana systems also showed higher values (Table 1) in the surface soils compared to sal forest and rubber plantations, possibly due to the regular application of MOP. The available K showed a very low non-significant negative correlation with SOC and a non-significant positive correlation with soil pH. Similar results have been reported by [57] for the relationship of the available K with pH and SOC.
The sulphur content in all the soils was sufficient (>10 ppm) in the surface soils and decreased with the depth of the sample. Approximately 95% of total S exits in organic matter in the soils [58] and its variation was similar to that of SOC under different scenarios. Our findings are in corroboration with [59]. All the soils under study were found to be deficient in the available B, considering 0.5 ppm as the critical limit of deficiency for hot water extractable B. The deficiency of B in the study area might be due to its low concentration in the parent material, leaching losses, and runoff. Boron deficiency in the soils of the north-eastern region of India were reported [60,61]. It is advisable to supplement B for the optimum yield of agricultural and plantation crops in the studied soils. The estimated value of Fe and Mn were very high in the surface and subsurface soils, possibly attributed to the low pH (≤5.0) and SOC levels [17,62]. Relatively higher Zn levels in arecanut plantations might be due to the reduced mining of Zn by arecanut crops as compared to other systems. According to the critical limits suggested by [63] for Zn (0.6 ppm), low values for sal forest soils on steep slopes (3–8%) might be due to loss by leaching and runoff [64]. A widespread deficiency of Zn was reported in the soils of north-eastern India [65]. Copper values above 0.2 ppm using the DTPA extraction method are sufficient [24]. The deficiency of Cu is usually uncommon in the soils with low pH [17]. Similar findings were also reported by [65] and [62]. Soil moisture retention in the soils depends on the clay and organic matter content that govern the soil structure and porosity [66]. Relatively higher SMC values under paddy cultivation might be attributed to the finer texture (clay loam to clay) and the high SOC content. Another reason for high SMC levels is that the use of puddling for rice cultivation destroys the soil structure and forms an impervious layer below the plough layer [67].
The bacteria population count was found to be significantly higher for rubber plantations and forests at both the soil depths compared to other scenarios (Table 4). This may be attributed to the availability of fresh organic matter from litter fall and optimum soil moisture conditions for the proliferation of the aerobes. Studies have reported the concentration of C to be the primary factor controlling the bacterial communities [68,69,70]. In this study, the VLSOC appears to be controlling the higher bacterial count, as evident from the significant positive correlation (0.373). The SOC also showed a positive correlation with the bacteria count, but was insignificant at p < 0.05. The paddy growing soils, despite having high SOC, showed a lower population count of bacteria, which might be due to the wet condition of the soil during most of the year. As per the study by [71], bacteria are deprived of substrate under continuously moist conditions due to the utilization of the labile C sources. This condition is evident from the lower value of the VLSOC in the paddy soils compared to rubber plantations and sal forest systems. Excess water in the soil environment is also unfavorable to aerobic bacteria [72]. The population count method used for the study is particularly sensitive to the active aerobes and facultative anaerobes in the soils, which might be another reason for the lower population count. The lowest value for banana systems can be contributed to the absence of any fresh surface residue and a very low value of VLSOC. The fungal population count also showed significant variations among the scenarios for the surface soil layer but no significant variation for the subsurface soil. The difference in the fungal population in the rubber, arecanut and sal forest scenarios were higher between the surface and subsurface layers, while for paddy and banana systems, it was almost constant. This might be because fungi are more important decomposers of surface residues under non-tilled soils [73,74] where the residues are not incorporated into the soil, while they are less important in the decomposition of incorporated residues [75]. However, the fungal population decreased across the depth for all scenarios, possibly due to the higher value of SOC and VLSOC in the surface layer compared to the subsurface. Similar results have been reported by [76]. The increase in soil moisture content at increased depths may also be another factor, resulting in the reduced fungal and bacterial population levels at increased depths. Excessive soil moisture has been reported to lower the biomass of microorganisms [77,78], due to the formation of anoxic conditions that are unfavorable to aerobic bacteria and mycorrhizal fungi [77]. The actinomycetes population count varied significantly among the scenarios for both the surface and subsurface soils. The population count decreased across the depth for the paddy, banana, and arecanut scenarios, while for rubber plantations and sal forests, it showed an increase across the depth. In the present study, the actinomycetes population did not show any significant correlation with pH, SOC, VLSOC, or SMC, indicating that soil type might be the most important factor governing the actinomycetes count in the study area. For example, paddy, arecanut, and banana systems belong to similar topographical locations and showed similar trends in variation, while sal forests and rubber plantations, possessing similar topographical condition, showed similar trends in variation. As per reports, the soils of the older alluvial plains of the Brahmaputra Valley are considered inceptisols, whereas the soils of the uplands and hills cultivated with rubber plantations and forests are characterized as alfisols and ultisols [79] A study by [80] showed that the actinomycetes population is significantly affected by the soil type. The acidic range of the soil pH in the study area is also an indicator of the presence of acidophilic actinomycetes species, and neutro-tolerant acidophilic species show optimum growth between pH 5.0 and 5.55 [81], while typical acidophiles show optimum growth at pH 4 [82]. However, to confirm the species of actinomycetes in a particular scenario, further research must be done to reach any certain conclusions. The actinomycetes population showed a significant negative correlation with the available P. Actinomycetes are reported to be dominant degraders of organic phosphorus forms leading to solubilization [83]. Under lower soil available P, there is a possibility that actinomycetes exhibit more rapid growth to mineralize the organic P [83]. Moreover, tree-based perennial systems tend to promote the growth of actinomycetes when compared to cultivated soils.
The PCA biplot of the individual scenarios (Figure 3) revealed that a change in the scenario also changed the characterization capacity of the soil parameters. For sal forests and rubber plantations, actinomycetes, fungi, and VLSOC were the highest contributors to variability. For banana systems, the variable parameters were for Mn, Cu, and soil pH, whereas for paddy fields, the variables were Cu, Mn, Fe, and SOC. For arecanut cultivations, actinomycetes, fungi, VLSOC, N, and soil pH were major the contributing variables. However, considering the cumulative loadings and the correlation matrix of the variables and the PCs, the variables found to be the deciding parameters for the soil quality of the study area, evident from their high correlation values in the six PCs (showing Eigenvalue > 1) were SOC, VLSOC, Cu, K, B, P, and the bacteria count. The population of fungi and actinomycetes also proved to be significant variables contributing to the soil quality.

5. Conclusions

Our study revealed that land use, topography, and management practices collectively cause significant variation in the physical and chemical properties, as well as the microbial population count, in the soil. The perennial land use systems of arecanut, forest and rubber cultivation were shown to support a higher microbial population. Among the soil physicochemical properties, VLSOC was found to be the major factor affecting the bacterial and fungal abundance in soils. SMC was found to be an important factor for fungal population. The actinomycetes population was found to significantly affected by soil type, acting as important drivers for the P availability for plants. Paddy cultivation on a depositional surface under monocropping with stubble incorporation was found to be suitable for maintaining a high SOC level. Forest and rubber systems, despite being located on erosional surfaces, could maintain a high SOC level, the highest VLSOC, and a higher population of microorganisms, depicting the restoration of these variable through the litter layer. The lower SOC, VLSOC, and microbial population count in the older alluvial plains under banana crop land use suggests the inclusion of organic matter as part of a nutrient management system. The study also revealed that soil micronutrients are important soil quality parameters in all the scenarios, and these cannot be ignored in maintaining the health and sustainability of the soil. The soil system under natural environment is very much heterogenous and maintaining its viability requires the understanding of soil as a complex system of interactions between topography, land use, management, soil depth, and soil properties. Additional research should concentrate on the large-scale investigation and classification of the soil in this area for the speciation of microorganisms and the determination of different pools of organic carbon. Further researches in this study area should also focus on monitoring the temporal changes in the soil physicochemical and biological properties to confirm the long-term effects of soil management practices.

Author Contributions

Conceptualization, S.H. and S.K.R.; writing—original draft preparation, S.H., K.G., K.K.M. and D.K.; supervision, V.M.; writing—review and editing, U.S.S., P.K.J. and P.V.V.P.; visualization, S.K.R., P.K.J. and P.V.V.P. All authors have read and agreed to the published version of the manuscript.

Funding

The study was not funded by any external sources.

Institutional Review Board Statement

Not applicable.

Informed Consent Statement

Not applicable.

Data Availability Statement

All data are included in the manuscript, and additional data are available with the corresponding author and will be available upon request.

Acknowledgments

The authors are thankful to the Indian Council of Agricultural Research–National Bureau of Soil Survey and Land Use Planning, Nagpur, Maharashtra, India, for approval of the project. The authors are also thankful to the Rain Forest Research Institute, Jorhat, Assam, India, for facilitating the microbial analysis.

Conflicts of Interest

The authors declare that they do not have any competing or conflict of interests.

References

  1. Van Leeuwen, J.P.; Djukic, I.; Bloem, J.; Lehtinen, T.; Hemerik, L. Effects of land use on soil microbial biomass, activity, and community structure at different soil depths in Danube floodplain. Eur. J. Soil. Biol. 2017, 79, 14–20. [Google Scholar] [CrossRef]
  2. Bini, D.; dos Santos, C.A.; do Carmo, K.B.; Kishino, N.; Andrade, G.; Zangaro, W.; Nogueira, M.A. Effects of land use on soil organic carbon and microbial process associated with soil health in Southern Brazil. Eur. J. Soil. Biol. 2013, 55, 117–123. [Google Scholar] [CrossRef]
  3. Cheng, X.; Yang, Y.; Li, M.; Dou, X.; Zhang, Q. The impact of agricultural land use changes on soil organic carbon dynamics in the Danjiangkou Reservoir area of China. Plant. Soil 2013, 366, 415–424. [Google Scholar] [CrossRef]
  4. García-Palacios, P.; Maestre, F.T.; Kattge, J.; Wall, D.H. Climate and litter quality differently modulate the effects of soil fauna on litter decomposition across biomes. Ecol. Lett. 2013, 16, 1045–1053. [Google Scholar] [CrossRef] [Green Version]
  5. Wardle, D.A.; Bardgett, R.D.; Klironomos, J.N.; Setcalca, H.; van der Putten, W.H.; Wall, D.H. Ecological linkages between aboveground and belowground biota. Science 2003, 304, 1629–1633. [Google Scholar] [CrossRef]
  6. Kardol, P.; Wardle, D.A. How understanding aboveground-belowground linkages can assist restoration ecology. Trends Ecol. Evol. 2010, 25, 670–679. [Google Scholar] [CrossRef]
  7. Lepcha, N.T.; Devi, N.B. Effect of land use, season, and soil depth on soil microbial biomass carbon of Eastern Himalayas. Ecol. Process. 2020, 9, 65. [Google Scholar] [CrossRef]
  8. Pennanen, T.; Fritze, H.; Vanhala, P.; Kiikkila, O.; Neuvonen, S.; Baath, E. Structure of a microbial community in soil after prolonged addition of low levels of simulated acid rain. Appl. Environ. Microbiol. 1998, 64, 2173–2180. [Google Scholar] [CrossRef] [PubMed] [Green Version]
  9. Singh, J.S.; Gupta, V.K. Soil microbial biomass: A key soil driver in management of ecosystem functioning. Sci. Total Environ. 2018, 634, 497–500. [Google Scholar] [CrossRef]
  10. Mahato, M.K.; Jana, N.C. Impact of landform on agricultural land use pattern: A case study of Salda River Basin in Purulia District, West Bengal. J. Geogr. Environ. Earth Sci. Internat. 2019, 21, 1–19. [Google Scholar] [CrossRef] [Green Version]
  11. Zackary, G.; Mainuri, J.O. Linking landforms and land use to land degradation in the Middle River Njoro Watershed. Internat. Soil Water Conservat. Res. 2014, 2, 1–10. [Google Scholar] [CrossRef] [Green Version]
  12. Tischer, A.; Potthast, K.; Hamer, U. Land-use and soil depth affect resource and microbial stoichiometry in a tropical mountain rainforest region of southern Ecuador. Oecologia 2014, 175, 375–393. [Google Scholar] [CrossRef] [PubMed]
  13. Spohn, M.; Chodak, M. Microbial respiration per unit biomass increases with carbon-to-nutrient ratios in forest soils. Soil Biol. Biochem. 2015, 81, 128–133. [Google Scholar] [CrossRef]
  14. Saikia, L.; Mahanta, C.; Mukherjee, A. Erosion–deposition and land use/land cover of the Brahmaputra River in Assam. India. J. Earth Syst. Sci. 2011, 128, 211. [Google Scholar] [CrossRef] [Green Version]
  15. Hazarika, N.; Das, A.K.; Borah, S.B. Assessing land-use changes driven by river dynamics in chronically flood affected Upper Brahmaputra plains, India, using RS-GIS techniques. Egypt. J. Remote Sens. Space Sci. 2015, 18, 107–118. [Google Scholar] [CrossRef] [Green Version]
  16. Sinha, R.; Tandon, S.K. Indus-Ganga-Brahmaputra plains: The alluvial landscape. Landsc. Lanforms India 2014, 53–63. [Google Scholar] [CrossRef]
  17. Baruah, B.K.; Das, B.; Medhi, C.; Mishra, A.K. Fertility status of soil in the tea garden belts of Golaghat district, Assam, India. J. Chem. 2013, 2013, 983297. [Google Scholar] [CrossRef] [Green Version]
  18. Reza, S.K.; Baruah, U.; Nayak, D.C.; Dutta, D.; Singh, S.K. Effects of land-use on soil physical, chemical and microbial properties in humid subtropical Northeastern India. Natl. Acad. Sci Lett. 2018, 41, 141–145. [Google Scholar] [CrossRef]
  19. Choudhury, B.U.; Ansari, M.A.; Chakraborty, M. Effect of land-use change along altitudinal gradients on soil micronutrients in the mountain ecosystem of Indian (Eastern) Himalaya. Sci. Rep. 2021, 11, 14279. [Google Scholar] [CrossRef]
  20. Gangopadhyay, S.; Ray, S.K. Soil chemical and mineralogical characteristics under major land use systems on upper Brahmaputra valley of Assam. Clay. Res. 2020, 39, 56–66. [Google Scholar] [CrossRef]
  21. Das Gupta, A.B.; Biswas, A.K. Geology of Assam; Geological Society of India, Bangalore: Bengaluru, India, 2002; pp. 45–83. [Google Scholar]
  22. Velayutham, M.; Mandal, D.K.; Mandal, C.; Sehgal, J. Agro-ecological sub-regions of India for planning and development. NBSS & LUP Publ. 1999, 35, 372. [Google Scholar]
  23. Keys to Soil Taxonomy. By Soil Survey Staff. United States Department of Agriculture. Natural Resources Conservation Service. Available online: https://www.nrcs.usda.gov/wps/PA_NRCSConsumption/download?cid=stelprdb1252094&ext=pdf (accessed on 15 July 2021).
  24. Lindsay, W.L.; Norvell, W.A. Development of a DTPA soil test for zinc, iron, manganese, and copper. Soil Sci. Soc. Am. J. 1978, 42, 421–428. [Google Scholar] [CrossRef]
  25. Jackson, M.L. Soil Chemical Analysis; Prentice-Hall: Englewood Cliffs, NJ, USA, 1958; p. 498. [Google Scholar]
  26. Subbiah, B.W.; Asijia, G.L. A rapid procedure for the estimation of available nitrogen in soil. Curr. Sci. 1965, 25, 259–260. [Google Scholar]
  27. Bray, R.H.; Kurtz, L.T. Determination of total organic and available forms of phosphorus in soils. Soil Sci. 1945, 59, 39–45. [Google Scholar] [CrossRef]
  28. Jackson, M.L. Soil Chemical Analysis; Prentice Hall India Pvt. Ltd.: India, New Delhi, 1967. [Google Scholar]
  29. Chesnin, L.; Yein, C.H. Turbidimetric determinations of available sulphates. Soil Sci. Soc. Am. Proc. 1951, 15, 149–151. [Google Scholar] [CrossRef]
  30. Berger, K.C.; Truog, E. Boron determination in soils and plants. Ind. Eng. Chem. Anal. Ed. 1939, 11, 540–545. [Google Scholar] [CrossRef]
  31. Walkley, A.; Black, I.A. An examination of the Degterett method for determining soil organic matter and proposal modification of the chromic acid titration method. Soil Sci. 1934, 37, 29–38. [Google Scholar] [CrossRef]
  32. Chan, K.Y.; Bowman, A.; Oates, A. Oxidizible organic carbon fractions and soil quality changes in an oxic paleustalf under different pasture leys. Soil Sci. 2001, 166, 61–67. [Google Scholar] [CrossRef]
  33. Gardner, W.H. Water content. In. Methods of Soil Analysis, Part I. ed. CA Black et al., (Monograph No. 9) Agronomy Series. Amer. Soc. Agron. 1965, 1, 82–127. [Google Scholar]
  34. Robinson, G.W. Note on the mechanical analysis of humus soils. Agr. Sci. 1922, 12, 287–291. [Google Scholar] [CrossRef]
  35. Gomez, K.A.; Gomez, A.A. Statistical Procedures for Agricultural Research; John Wiley and Sons: New York, NY, USA, 1984; p. 680. [Google Scholar]
  36. Duncan, D.B. Multiple range and multiple F tests. Biometrics 1955, 11, 1–42. [Google Scholar] [CrossRef]
  37. Pearson, K. Notes on regression and inheritance in the case of two parents. Proc. R. Soc. 1895, 58, 240–242. [Google Scholar] [CrossRef] [Green Version]
  38. Doetterl, S.; Six, J.; Van Wesemael, B.; Van Oost, K. Carbon cycling in eroding landscapes: Geomorphic controls on soil organic C pool composition and C stabilization. Glob. Chang. Biol. 2012, 18, 2218–2232. [Google Scholar] [CrossRef]
  39. Fissore, C.; Dalzell, B.J.; Berhe, A.A.; Voegtle, M.; Evans, M.; Wu, A. Influence of topography on soil organic carbon dynamics in a Southern California grassland. Catena 2017, 149, 140–149. [Google Scholar] [CrossRef]
  40. Burst, M.; Chauchard, S.; Dambrine, E.; Dupouey, J.L.; Amiaud, B. Distribution of soil properties along forest-grassland interfaces: Influence of permanent environmental factors or land-use aftereffects? Agric. Ecosyst. Environ. 2020, 289, 106739. [Google Scholar] [CrossRef]
  41. Paudel, S.; Sah, J.P. Physicochemical characters of soil in tropical sal (Shorea robusta Gaertn.) forests in eastern Nepal. Himal. J. Sci. 2003, 1, 107–110. [Google Scholar] [CrossRef] [Green Version]
  42. Liu, Y.; Zhang, L.; Lu, J.; Chen, W.; Wei, G.; Lin, Y. Topography affects the soil conditions and bacterial communities along a restoration gradient on Loess-Plateau. Appl. Soil Ecol. 2020, 150, 103471. [Google Scholar] [CrossRef]
  43. Gonnety, J.T.; Assémien, E.F.; Guéi, A.M.; Aya, A.N.; Djina, Y.; Koné, A.W.; Tondoh, J.E. Effect of land-use types on soil enzymatic activities and chemical properties in semi-deciduous forest areas of Central-West Côte d’Ivoire. Biotechnol. Agron. Soc. Environ. 2013, 4, 478–485. [Google Scholar]
  44. George, N.; Killur, R.R.B.; Cornelio, D.L. Land use conversion and soil properties in a lowland tropical landscape of Papua New Guinea. J. Manajemen. Hutan Trop. 2013, 1, 39. [Google Scholar] [CrossRef]
  45. Malik, A.A.; Puissant, J.; Buckeridge, K.M.; Goodall, T.; Jehmlich, N.; Chowdhury, S.; Gweon, H.S.; Peyton, J.M.; Mason, K.E.; van Agtmaal, M.; et al. Land use driven change in soil pH affects microbial carbon cycling processes. Nat. Commun. 2018, 9, 3591. [Google Scholar] [CrossRef] [PubMed]
  46. Hong, S.; Gan, P.; Chen, A. Environmental controls on soil pH in planted forest and its response to nitrogen deposition. Environ. Res. 2019, 172, 159–165. [Google Scholar] [CrossRef] [PubMed]
  47. Zhou, W.; Han, G.; Liu, M.; Li, X. Effects of soil pH and texture on soil carbon and nitrogen in soil profiles under different land uses in Mun River Basin, Northeast Thailand. Peer J. 2019, 7, e7880. [Google Scholar] [CrossRef] [PubMed] [Green Version]
  48. Assefa, F.; Elias, E.; Soromessa, T.; Ayele, G.T. Effect of Changes in Land-Use Management Practices on Soil Physicochemical Properties in Kabe Watershed, Ethiopia. Air Soil Water Res. 2020, 13, 1–16. [Google Scholar] [CrossRef]
  49. Singh, P.; Benbi, D.K. Soil organic carbon pool changes in relation to slope position and land-use in Indian lower Himalayas. Catena 2018, 166, 171–180. [Google Scholar] [CrossRef]
  50. McGrath, D.; Smith, C.; Gholz, H.; Oliveira, F.d.A. Effects of land-use change on soil nutrient dynamics in Amazônia. Ecosystems 2001, 4, 625–645. Available online: http://0-www-jstor-org.brum.beds.ac.uk/stable/3658623 (accessed on 18 September 2021). [CrossRef]
  51. Fontaine, S.; Barot, S.; Barré, P. Stability of organic carbon in deep soil layers controlled by fresh carbon supply. Nature 2007, 450, 277–280. [Google Scholar] [CrossRef]
  52. Smith, S.V.; Renwick, W.H.; Buddemeier, R.W.; Crossland, C.J. Budgets of soil erosion and deposition for sediments and sedimentary organic carbon across the conterminous United States. Glob. Biogeochem. Cycles 2001, 15, 697–707. [Google Scholar] [CrossRef] [Green Version]
  53. Berhe, A.A.; Kleber, M. Erosion, deposition, and the persistence of soil organic matter: Mechanistic considerations and problems with terminology. Earth Surf. Process. Landf. 2013, 38, 908–912. [Google Scholar] [CrossRef]
  54. Doetterl, S.; Berhe, A.A.; Nadeu, E.; Wang, Z.; Sommer, M.; Fiener, P. Erosion, deposition, and soil carbon: A review of process-level controls, experimental tools, and models to address C cycling in dynamic landscapes. Earth Sci. Rev. 2016, 154, 102–122. [Google Scholar] [CrossRef]
  55. Haque, M.M.; Biswas, J.C.; Maniruzaman, M.; Akhter, S.; Kabir, M.S. Carbon sequestration in paddy soil as influenced by organic and inorganic amendments. Carbon Manag. 2020, 11, 231–239. [Google Scholar] [CrossRef]
  56. Negasa, D.J. Effects of land use types on selected soil properties in Central Highlands of Ethiopia. App. Environ. Soil Sci. 2020, 6, 1–9. [Google Scholar] [CrossRef]
  57. Uzoho, B.U.; Ekeh, C. Potassium status of soils in relation to land use types in Ngor-Okpala, Southeastern Nigeria. J. Nat. Sci. Res. 2014, 4, 2224–3186. [Google Scholar]
  58. Erickson, G.; Klopfenstein, T.; Walters, D.; Lesoing, G. Nutrient Balance of Nitrogen, Organic Matter, Phosphorous and Sulfur the Feedlot. Neb. Beef Cattle Rep. 1998, 69, 86–87. [Google Scholar]
  59. Sharma, Y.K.; Sharma, A.; Sharma, S.K. An appraisal of physico-chemical characteristics and soil fertility status of forest and rice land use systems in Mokokchung district of Nagaland. J. Indian Soc. Soil Sci. 2013, 61, 38–43. [Google Scholar]
  60. Takkar, P.N. Micronutrient research and sustainable agricultural productivity in India. J. Indian Society Soil Sci. 1996, 44, 562–581. [Google Scholar]
  61. Ray, P.; Gogoi, S.N.; Bandyopadhyay, S.; Jena, R.K.; Ramachandran, S.; Sharma, G.K.; Sah, K.D.; Singh, S.K.; Ray, S.K. Soil-cum-nutrient management package for achieving high yield and quality of mulberry (Morus indica L.) leaf in acid soil of Northeastern India. J. Plant. Nutr. 2021, 44, 2501–2513. [Google Scholar] [CrossRef]
  62. Ray, P.; Gogoi, S.N.; Bandyopadhyay, S.; Padua, S.; Jena, R.K.; Roy, P.D.; Ramachandran, S.; Sharma, G.K.; Sah, K.D.; Trivedy, K.; et al. Fertility status of mulberry (Morus indica L.) growing soils of upper Brahmaputra valley region of northeastern India. Range Manag. Agroforest. 2018, 39, 147–155. [Google Scholar] [CrossRef]
  63. Bansal, R.L.; Takkar, P.N. Micronutrient status of soils in Amritsar district. Indian J. Ecol. 1986, 13, 158–160. [Google Scholar]
  64. Bhuyan, N.; Barua, N.G.; Borah, D.K.; Bhattacharyya, D.; Basumatari, A. Georeferenced micronutrient status in soils of Lakhimpur district of Assam. J. Indian Soc. Soil Sci. 2014, 62, 102–107. [Google Scholar] [CrossRef]
  65. Bandyopadhyay, S.; Ray, P.; Padua, S.; Ramachandran, S.; Jena, R.K.; Roy, P.D.; Dutta, D.P.; Singh, S.K.; Ray, S.K. Priority zoning of available micronutrients in the soils of agro-ecological sub-regions of North-East India using geospatial techniques. Agric. Res. 2018, 7, 200–214. [Google Scholar] [CrossRef]
  66. Dai, L.; Guo, X.; Ke, X.; Du, Y.; Zhang, F.; Cao, G. The variation in soil water retention of alpine shrub meadow under different degrees of degradation on northeastern Qinghai-Tibetan plateau. Plant. Soil 2021, 458, 231–244. [Google Scholar] [CrossRef]
  67. Kumar, V.; Gathala, M.K.; Saharawat, Y.S.; Parihar, C.M.; Kumar, R.; Kumar, R.; Jat, M.L.; Jat, A.S.; Mahala, D.M.; Kumar, L.; et al. Impact of tillage and crop establishment methods on crop yields, profitability, and soil physical properties in rice–wheat system of Indo-Gangetic Plains of India. Soil Use Manag. 2019, 35, 303–313. [Google Scholar] [CrossRef]
  68. Fierer, N.; Bradford, M.A.; Jackson, R.B. Toward an ecological classification of soil bacteria. Ecology 2007, 88, 1354–1364. [Google Scholar] [CrossRef] [PubMed]
  69. LaMontagne, M.G.; Schimel, J.P.; Holden, P.A. Comparison of subsurface and surface soil bacterial communities in California grassland as assessed by terminal restriction fragment length polymorphisms of PCR amplified 16S rRNA genes. Microb. Ecol. 2003, 46, 216–227. [Google Scholar] [CrossRef] [PubMed]
  70. Zhou, J.; Xia, B.; Treves, D.S.; Wu, L.Y.; Marsh, T.L.; O’Neill, R.V.; Palumbo, A.V.; Tiedje, J.M. Spatial and resource factors influencing high microbial diversity in soil. Appl. Environ. Microbiol. 2002, 68, 326–333. [Google Scholar] [CrossRef] [PubMed] [Green Version]
  71. SchnuÈrer, J.; Clarholm, M.; Bastrom, S.; Rosswall, T. 1986. Effects of moisture on soil microorganisms and nematodes: A field experiment. Microb. Ecol. 1986, 12, 217–230. [Google Scholar] [CrossRef] [PubMed]
  72. Walker, T.S.; Bais, H.P.; Grotewold, E.; Vivanco, J.M. Root exudation and rhizosphere biology. Plant. Physiol. 2003, 132, 44–51. [Google Scholar] [CrossRef] [PubMed] [Green Version]
  73. Beare, M.H.; Parmelee, R.W.; Hendrix, P.F.; Cheng, W.; Coleman, D.C.; Grossley, D.A., Jr. Microbial and faunal interactions and effects on litter nitrogen and decomposition in agroecosystems. Ecol. Monogr. 1992, 62, 569–591. [Google Scholar] [CrossRef] [Green Version]
  74. Neely, C.L.; Beare, M.H.; Hargrove, W.H.; Coleman, D.C. Relationships between fungal and bacterial substrate-induced respiration, biomass, and plant residue decomposition. Soil Biol. Biochem. 1991, 23, 947–954. [Google Scholar] [CrossRef]
  75. Holland, E.A.; Coleman, D.C. Litter placement effects on microbial and organic matter dynamics in an agroecosystem. Ecology 1987, 68, 425–433. [Google Scholar] [CrossRef]
  76. Frey, S.D.; Elliott, E.T.; Paustian, K. Bacterial and fungal abundance and biomass in conventional and no-tillage agroecosystems along two climatic gradients. Soil Biol. Biochem. 1999, 31, 573–585. [Google Scholar] [CrossRef]
  77. Unger, I.M.; Kennedy, A.C.; Muzika, R.M. Flooding effects on soil microbial communities. App. Soil Ecol. 2009, 42, 1–8. [Google Scholar] [CrossRef]
  78. Silva, C.C.; Guido, M.L.; Ceballos, J.M.; Marsch, R.; Dendooven, L. Production of carbon dioxide and nitrous oxide in alkaline saline soil of Texcoco at different water contents amended with urea: A laboratory study. Soil Biol. Biochem. 2008, 40, 1813–1822. [Google Scholar] [CrossRef]
  79. Hota, S.; Jena, R.K.; Ray, P.; Ramachandran, S.; Mourya, K.K.; Sharma, G.K.; Ray, S.K. Fertility capability classification of soils under dominant land uses of North-Eastern India. In Proceedings of the conference: Soil-Plant-Animal and Human Health Continumm, 5th International Agronomy Congress, Hyderabad, India, 23–27 November 2021. [Google Scholar]
  80. Zakalyukina, Y.V.; Zenova, G.M.; Zvyagintsev, D.G. Acidophilic Soil Actinomycetes. Microbiology 2002, 71, 342–345. [Google Scholar] [CrossRef]
  81. Poomthongdee, N.; Duangmal, K.; Pathom-aree, W. Acidophilic actinomycetes from rhizosphere soil: Diversity and properties beneficial to plants. J. Antibiot. 2015, 68, 106–114. [Google Scholar] [CrossRef] [PubMed]
  82. Xu, C.; Wang, L.; Cui, Q.; Huang, Y.; Liu, Z.; Zheng, G.; Goodfellow, M. Neutrotolerant acidophilic Streptomyces species isolated from acidic soils in China: Streptomyces guanduensis sp. nov., Streptomyces paucisporeus sp. nov., Streptomyces rubidus sp. nov. and Streptomyces yanglinensis sp. nov. Int. J. Syst. Evol. Microbiol. 2006, 56, 1109–1115. [Google Scholar] [CrossRef] [PubMed]
  83. Ghorbani-Nasrabadi, R.; Greiner, R.; Alikhani, H.A.; Hamedi, J.; Yakhchali, B. Distribution of actinomycetes in different soil ecosystems and effect of media composition on extracellular phosphatase activity. J. Soil Sci. Plant. Nutr. 2013, 13, 223–236. [Google Scholar] [CrossRef] [Green Version]
Figure 1. The locations of the study area and the soil sampling and analysis points in the Rangjuli block of the Goalpara District of the lower Brahmaputra Valley of Assam, India.
Sustainability 14 02241 g001
Figure 2. The variations in the soil pH, SOC, and VLSOC at two soil depths across different scenarios.
Sustainability 14 02241 g002
Figure 3. The principal component analysis (PCA) biplot of the soil physicochemical and microbial population count for an individual scenario.
Sustainability 14 02241 g003
Table 1. The details of land use, topography, and management scenarios.
ScenarioLand Use (Name of Scenario)LandformSlope Gradient (%)DrainageFertilization and ManagementCropping SystemOther Management Practices
1PaddyYounger and older alluvial plain0–1% and 1–3%PoorCow dung manure application @ 15 to 20 q/ha before transplanting.Kharif monocroppingIncorporation of stubble, puddling, conventional tillage
2BananaOlder alluvial plain and Char land1–5%Moderately wellBasal application SSP @ 100 g/plant.
Urea @ 100 g/plant 45 days after planting (DAP) and
MOP @ 250 g/plant starting from 90 DAP. All are repeated at 45-day intervals.
Perennial monocropping Earthing-up operations during planting and fertilizer application
3ArecanutOlder alluvial plain and Char land1–5%Moderately wellOccasional application of SSP. Cow dung manure @ 5 kg/plant every 5 to 6 months.Perennial monocroppingNo other operations
4RubberUpland3–8%WellUrea @ 350 kg/ha and SSP @ 200 to 250 kg during initial plantation.Perennial monocroppingLeaf litter left on surface
5Sal forestUpland3–8%WellNo fertilizer management.Recently planted forestLeaf litter left on surface
Table 2. The distribution of the soil physicochemical properties in 0 to 25 cm depth.
ScenarioSand
(%)
Silt
(%)
Clay
(%)
Soil
Texture
N
(Kg ha−1)
P
(Kg ha−1)
K
(Kg ha−1)
S
(ppm)
B
(ppm)
Fe
(ppm)
Mn
(ppm)
Zn
(ppm)
Cu
(ppm)
SMC
(%)
Paddy
(n = 8)
21.6 ± 2.131.2 ± 2.447.2 ± 3.6Clay loam to Clay378.9 ± 11.18 a49.4 ± 9.28 a153.1 ± 33.2 b15.1 ± 4.3 a0.32 ± 0.03 ab71.5 ± 5.30 ab21.14 ± 1.8 a0.65 ± 0.15 b0.74 ± 0.06 a23.16 ± 2.5 a
Banana
(n = 4)
14.0 ± 3.351.3 ± 4.134.7 ± 4.8Silty clay loam353.1 ± 72.74 a55.1 ± 7.50 a254.7 ± 85.5 b11.4 ± 4.94 a0.21 ± 0.04 b103.6 ± 4.12 a14.45 ± 4.1 ab0.60 ± 0.02 b2.25 ± 0.05 ab12.9 ± 2.87 a
Rubber
(n = 12)
68.5 ± 5.10.8 ± 2.630.7 ± 3.7Sandy clay loam338.9 ± 70.03 a34.7 ± 9.08 a186.6 ± 78.2 b13.8 ± 4.18 a0.31 ± 0.08 ab69.4 ± 8.28 b8.52 ± 1.13 b0.66 ± 0.21 b1.69 ± 0.06 bc19.81 ± 2.16 a
Arecanut
(n = 4)
27.4 ± 6.238.1 ± 1.534.5 ± 11.2Clay loam333.4 ± 44.9 a34.7 ± 2.36 a380.4 ± 42.8 a13.5 ± 1.8 a0.24 ± 0.08 b92.8 ± 8.28 ab15.46 ± 2.6 ab1.61 ± 0.19 a0.56 ± 0.06 bc11.76 ± 1.81 a
Sal forest
(n = 6)
56.8 ± 8.917.2 ± 3.226.0 ± 2.5Sandy clay loam309.5 ± 20.99 a30.7 ± 9.57 a211.5 ± 35.1 b14.8 ± 2.59 a0.37 ± 0.08 a73.5 ± 9.94 ab6.29 ± 1.17 b0.52 ± 0.11 b0.42 ± 0.06 c14.83 ± 1.08 a
(A superscript letter on the data number indicates a significant difference at p < 0.05, where a denotes the highest mean value, followed by b, and c, ‘n’ represents the total number of samples taken from each land use scenario).
Table 3. The distribution of the soil physicochemical properties in 25 to 50 cm depth.
ScenarioSand
(%)
Silt
(%)
Clay
(%)
Soil
Texture
N
(Kg ha−1)
P
(Kg ha−1)
K
(Kg ha−1)
S
(ppm)
B
(ppm)
Fe
(ppm)
Mn
(ppm)
Zn
(ppm)
Cu
(ppm)
SMC
(%)
Paddy
(n = 8)
28.0 ± 4.319.9 ± 1.252.1 ± 5.2Clay228.2 ± 13.34 a40.9 ± 4.14 a90.38 ± 11.8 c10.5 ± 1.6 a0.23 ± 0.05 a57.9 ± 3.16 a17.44 ± 2.2 a0.40 ± 0.05 b0.64 ± 0.06 a28.14 ± 1.9 a
Banana
(n = 4)
25.0 ± 5.7 38.0 ± 1.137.0 ± 6.2Clay loam231.75 ± 22.74 a47.89 ± 5.27 a229.3 ± 16.2 abc8.3 ± 1.1 a0.17 ± 0.03 a57.8 ± 4.76 a6.15 ± 2.7 bc0.32 ± 0.18 b0.84 ± 0.07 a20.7 ± 2.73 ab
Rubber
(n = 12)
9.0 ± 5.649.5 ± 4.841.5 ± 3.9Silty clay217.62 ± 25.5 a26.9 ± 7.43 a173.8 ± 12.4 bc10.7 ± 1.75 a0.26 ± 0.09 a41.5 ± 6.2 a4.93 ± 1.23 bc0.37 ± 0.17 b0.27 ± 0.24 b23.08 ± 2.24 ab
Arecanut
(n = 4)
13.9 ± 1.237.7 ± 3.348.4 ± 4.5Clay222.23 ± 11.2 a30.7 ± 2.17 a359.2 ± 13.2 a13.5 ± 1.5 a0.19 ± 0.08 a63.6 ± 8.28 a10.89 ± 2.1 ab0.83 ± 0.18 a0.31 ± 0.08 b17.64 ± 3.12 b
Sal forest
(n = 6)
15.4 ± 2.642.3 ± 3.442.3 ± 4.6Silty clay235.5 ± 10.12 a25.1 ± 6.78 a268.2 ± 20.3 ab10.5 ± 1.62 a0.27 ± 0.07 a51.5 ± 7.87 a1.61 ± 0.4 c0.28 ± 0.09 b0.20 ± 0.03 b20.13 ± 2.37 ab
(A superscript letter on the data number indicates a significant difference at p < 0.05, where a denotes the highest mean value, followed by b, and c; ‘n’ represents the total number of samples taken from each land use scenario).
Table 4. The soil active microbial count across depth (0–25 cm and 25–50 cm).
ScenarioBacteria (10 6 CFU/g Soil)Fungi (10 4 CFU/g Soil)Actinomycetes (10 4 CFU/g Soil)
0–25 cm25–50 cm0–25 cm25–50 cm0–25 cm25–50 cm
Paddy
(n = 8)
362.5 ± 17.4 b297.4 ± 21.0 b80 ± 6.1 b32.5 ± 3.04 a1129.6 ± 93.4 b722.5 ± 74.34 b
Banana
(n = 4)
135 ± 14.5 b135 ± 14.5 b75 ± 6.6 b65.0 ± 3.6 a195 ± 35.4 c157 ± 4.24 c
Rubber
(n = 12)
784.3 ± 31.7 a485.6 ± 40.9 ab142.5 ± 9.8 b71.2 ± 7.7 a1216.7 ± 109.7 b1292.5 ± 86.2 b
Arecanut
(n = 4)
400 ± 19.7 b290 ± 42.4 b510.6 ± 21.1 a80.0 ± 2.4 a2006 ± 71.6 a1566 ± 51.6 b
Sal forest
(n = 6)
760 ± 47.6 a654 ± 32.5 a586.6 ± 25.1 a70.0 ± 6.05 a1399.3 ± 98.3 b2766.3 ± 42.9 a
(A superscript letter on the data number indicates a significant difference at p < 0.05, where a denotes the highest mean value, followed by b, and c; ‘n’ represents the total number of samples taken from each land use scenario).
Table 5. The correlation analysis of the physical, chemical, and biological variables of the soil.
Soil pHSOCNPKSBFeMnZnCuSMCVLSOCBacteriaFungi
Soil pH1.000
SOC−0.355 *1.000
N−0.340 *0.608 **1.000
P0.0950.0130.0641.000
K0.274−0.0230.1440.2491.000
S−0.103−0.0800.0310.450 **0.1721.000
B−0.411 **−0.0480.1660.018−0.2670.350 *1.000
Fe0.1830.430 **0.317 *0.1370.049−0.074−0.0061.000
Mn0.1840.2710.1670.100−0.2050.1170.0390.332 *1.000
Zn0.1290.314 *0.1250.2030.336 *0.249−0.0940.484 **0.2421.000
Cu−0.0920.2370.1210.211−0.435 **0.0420.0580.365 *0.739 **0.0211.000
SMC−0.0930.407 **−0.085−0.032−0.248−0.373 *−0.227−0.0150.031−0.0780.0881.000
VLSOC−0.344 *0.330 *0.376 *0.1480.1640.350 *0.371 *0.001−0.0440.014−0.1170.0161.000
Bacteria0.1990.114−0.002−0.021−0.0070.1110.299 *0.124−0.044−0.027−0.1400.1050.373 *1.000
Fungi−0.2430.2360.297 *−0.2620.0790.1000.360 *0.245−0.0950.263−0.213−0.397 **0.344 *0.340 *1.000
Actinomycetes−0.1580.1460.065−0.470 **0.161−0.1730.086−0.245−0.2660.048−0.430 **0.1030.1490.2010.154
* Correlation is significant at the p < 0.05 level; ** Correlation is significant at the p < 0.01 level.
Table 6. The principal component analysis (PCA) of the variables.
Total Variance Explained
ComponentInitial EigenvaluesExtraction Sums of Squared Loadings
Total% of VarianceCumulative %Total% of VarianceCumulative %
12.98618.66018.6602.98618.66018.660
22.68416.77335.4332.68416.77335.433
32.15313.45848.8912.15313.45848.891
41.90711.92060.8111.90711.92060.811
51.4018.75769.5681.4018.75769.568
61.2797.99177.5591.2797.99177.559
Table 7. The component matrix of the variables.
Component Matrix
Component
123456
pH−0.3770.3090.4660.383−0.3440.384
SOC0.6960.122−0.4360.3830.2450.021
N0.698−0.049−0.1640.1530.203−0.303
P0.2090.3740.538−0.1880.5150.211
K0.057−0.2400.6290.5140.288−0.077
S0.367−0.0560.598−0.4530.1900.077
B0.441−0.332−0.033−0.628−0.2260.080
Fe0.5430.4360.0720.379−0.3200.016
Mn0.3630.692−0.069−0.084−0.2370.064
Zn0.4460.1830.3830.481−0.076−0.105
Cu0.2940.781−0.239−0.314−0.109−0.020
SMC−0.0930.191−0.6120.2550.3940.483
VLSOC0.614−0.4140.026−0.1540.2980.289
Bacteria0.292−0.3280.0290.028−0.3140.781
Fungi0.559−0.4800.0750.070−0.475−0.179
Actinomycetes−0.009−0.634−0.2830.341−0.0280.034
Publisher’s Note: MDPI stays neutral with regard to jurisdictional claims in published maps and institutional affiliations.

