Article

Comparative Study on the Evaluation of Healthy City Construction in Typical Chinese Cities Based on Statistical Data and Land Use Data

1
Key Laboratory of Digital Earth Science, Aerospace Information Research Institute, Chinese Academy of Sciences, Beijing 100094, China
2
International Research Center of Big Data for Sustainable Development Goals, Beijing 100094, China
3
University of Chinese Academy of Sciences, Chinese Academy of Sciences, Beijing 100049, China
*
Author to whom correspondence should be addressed.
Sustainability 2022, 14(5), 2519; https://0-doi-org.brum.beds.ac.uk/10.3390/su14052519
Submission received: 26 January 2022 / Revised: 18 February 2022 / Accepted: 20 February 2022 / Published: 22 February 2022

Abstract

:
The 17 Sustainable Development Goals of the United Nations propose to “ensure healthy lives and promote well-being for all at all ages”, and to achieve this goal requires that countries strengthen their capacity to manage health risks. As a concept to describe urban construction, advocated by the World Health Organization, healthy cities can effectively solve the contradictions existing along the current urban development path at a macro level. A healthy city is a sustainable city that interacts with its environment, economy, population, services, and space, and realizes the well-being of its population from all perspectives. The construction of a healthy city is an important part of the transformation of Chinese urbanization. This article refers to the index systems of domestic and foreign government agencies, along with a literature research, to construct a healthy city evaluation index that takes into account the five aspects of environment, economy, population, service, and space, and selects Beijing (a policy-oriented city), Shanghai (an economy-oriented city), Nanchang (an industry-oriented city), Guiyang (a tourism-oriented city), Datong (resource-oriented city) as five cities according to type of urban development, using the entire-array-polygon method to analyze the construction level of these cities in terms of environment, economy, population, service, space and overall state of health from 2014 to 2018 based on statistical and land use data. The results of the study found that, in general, the construction of healthy cities in China currently experiences large year-to-year fluctuations and significant differences between cities. The construction and development of healthy cities are also closely related to factors such as urban economic strength, social welfare, and policy support.

1. Introduction

According to the health determinant model proposed by Barton, the lifestyle of the population is largely affected by the built environment [1]. Based on the above model, the World Health Organization proposed the concept of a healthy city in 1994, i.e., a city that continuously develops its natural and social environment, and continuously expands social resources, so that people can support each other in enjoying life and fully realizing their potential [2]. At the same time, among the 17 sustainable development goals (SDGs) proposed by the United Nations, “Ensure healthy lives and promote well-being for all at all ages” is listed as one, for which regulation 3.d requires strengthening the capacity of all countries, in particular developing countries, for early warning, risk reduction and management of national and global health risks [3]. Therefore, the sustainable development of cities has an important positive correlation with the healthy and active lifestyles of their residents. It is very important to judge and evaluate the health of cities in order to ensure the healthy development of these urban residents.
As the world’s largest developing country, China is currently in a critical stage of urbanization transformation, and has entered a new stage of urbanization, with “people’s urbanization as the core”. Therefore, improving the quality of urbanization and building a healthy city are particularly important for optimizing and controlling the current trend of urban development. In July 2016, the National Patriotic Health Campaign Committee issued its “Guiding Opinions on the Development of Healthy Cities and Healthy Villages and Towns” [4], which launched the construction of healthy cities and healthy villages and towns across the country to address the major health problems and issues involved in China’s urban development at this stage. Health influencing factors emphasize the role of government departments, society and individuals in jointly responding to health problems in the development of urbanization, and use these as the starting point to promote the construction of a Healthy China, and to promote planning in depth [5]. Building a healthy city in an all-round way is an important measure for the achievement of residents’ health and sustainable urban development [6]. In order to achieve this goal, the establishment of a sound health index system is required in order to evaluate urban health across multiple dimensions, improve the shortcomings caused by high-speed urbanization from multiple perspectives, and build a “people-oriented” healthy city in an all-round way.
At present, the construction of a healthy city index construction system is mainly based on the concept and the index system of the WHO’s “healthy city” [7].The American County Health Ranking Index (CHR) proposed by the United States only involves the evaluation of the environment, society and the population, and lacks evaluation of the urban economy [8]; the scientific evaluation standards for livable cities formulated by the Chinese Society for Urban Studies lack evaluation of the population [9]. The existing Chinese healthy city evaluation index structure [10], including its derived local healthy city evaluation index system [11,12], highlights the importance of the city’s public health attributes, ignoring whether the urban economy is developing steadily in the process of building a healthy city. On this basis, the healthy city evaluation index system established by Du Wei draws on regional sustainable development theory and its indicators and evaluation methods, and establishes a comprehensive evaluation index for healthy city development [13]. Based on existing academic achievements and combined with the connotations and characteristics of healthy cities, Xia Lianhua evaluated the national health city from three aspects: environment, economy and society. Regarding the current status of healthy city construction in each provincial capital [6], Liu Wen used the Delphi expert consultation method to establish a healthy city evaluation index system in Gansu Province, including five aspects: environment, society, service, crowding and culture [14]. At present, China’s healthy city construction evaluation system still needs to be improved:
(1)
There is a lack of comparison between urban health construction in different types of city. The construction of healthy cities in China mainly focuses on promoting the construction of sustainable cities and safe cities, while the existing evaluations of healthy city development mainly focus on the analysis of single cities or urban agglomerations, failing to reflect the differences between different types of city. There are, therefore, differences in the construction of healthy cities.
(2)
The current evaluation index system is not closely related to, and cannot meet the needs of, contemporary sustainable development. In the current system, there is still a lack of a comprehensive evaluation of sustainable development, including evaluation of the economy and of space.
The healthy city construction index reflects domestic construction goals and concepts. Its construction requires not only the cooperation of the health, environmental protection, transportation, education, and civil affairs departments, but also corresponding support from the planning department. Therefore, it is necessary to establish a healthy city evaluation index system that is closely related to sustainable development, evaluate the construction of different types of healthy city, and put forward suggestions for the construction of healthy cities based on evaluation status.
Based on the SDGs and previous literature research, this paper introduces the concept of sustainable development into the evaluation of healthy cities, and builds a set of evaluation index systems for healthy cities that takes into account urban development trends and sustainable development, and selects a number of different scales and types of typical city, collecting statistical data and land use data, and using the entire-array-polygon (EAP) method to evaluate and compare the healthy development level of each typical city. The research results can effectively show the current manifestations of China’s urbanization transformation in different types of city and have positive practical significance for the government’s development of targeted governance.

2. Study Area and Data
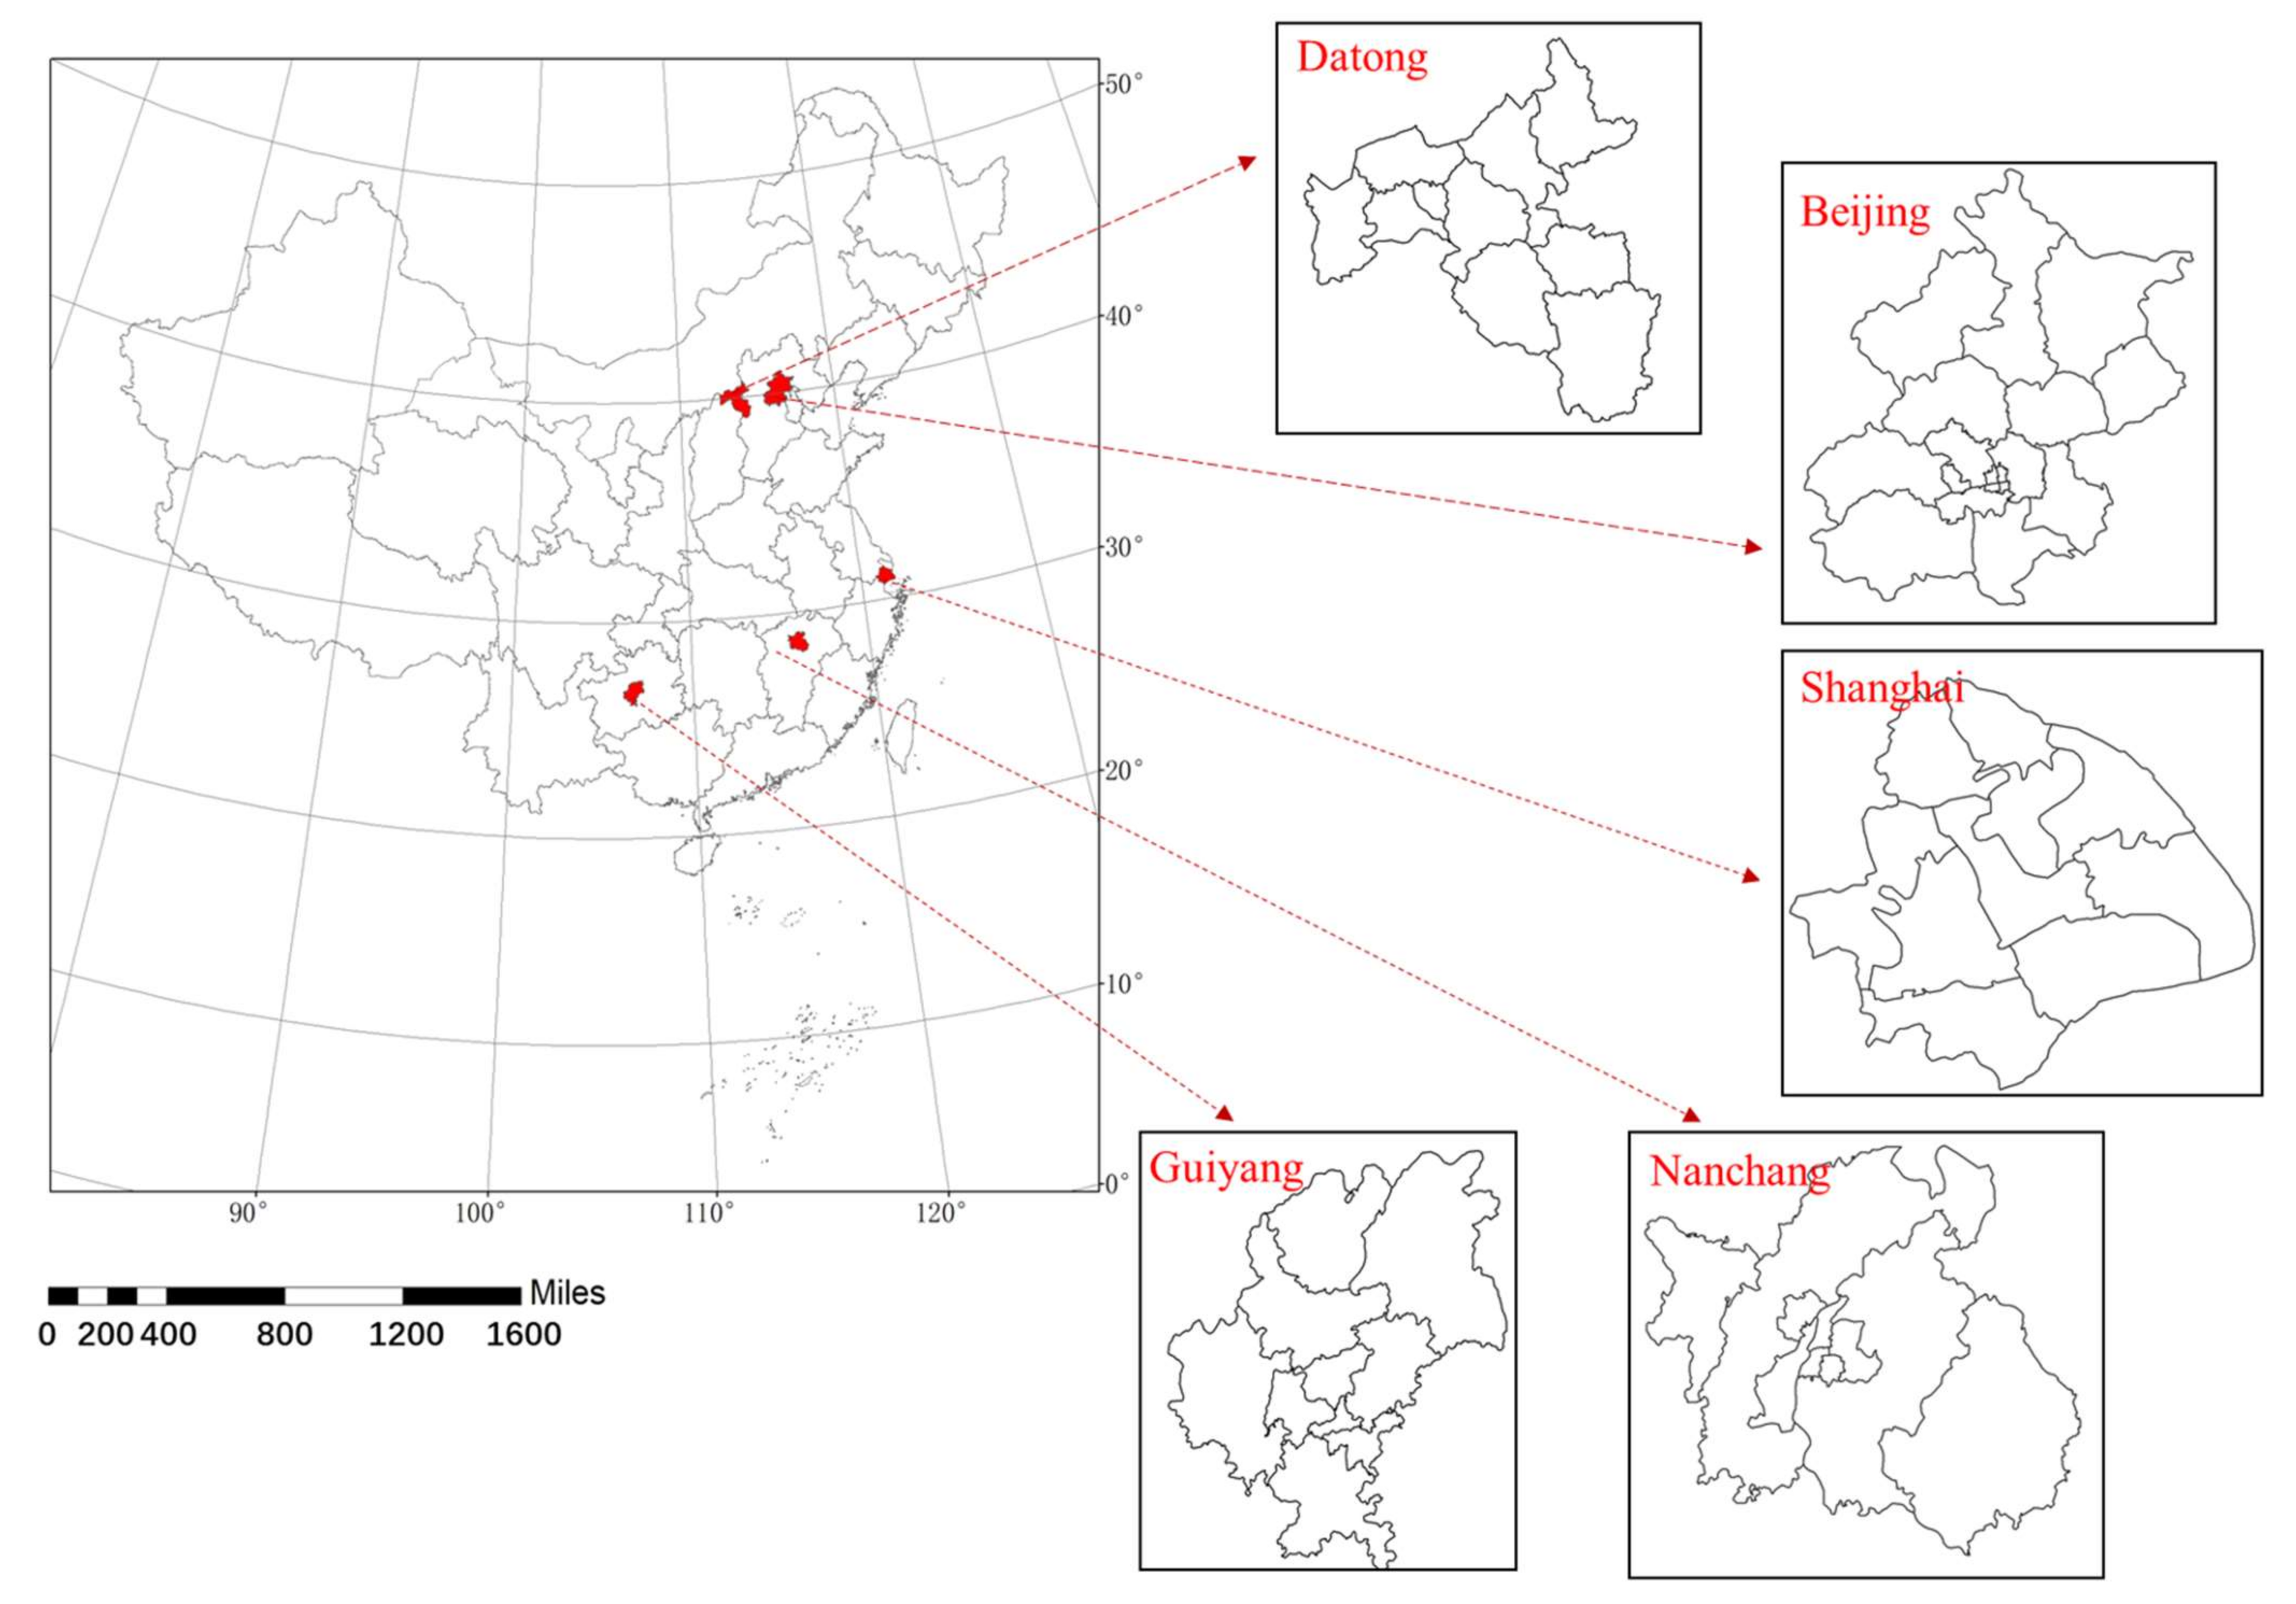
2.1. Study Area

Figure 1 shows the geographic location of the study area. As a country with a socialist market economy system, China’s economic development is affected by the dual deployment of a planned economy and a market economy. Therefore, when selecting typical research cities, considering the influence of the leading role of urban economic development, this study selects policy-oriented cities, economic-oriented cities, industry-oriented cities, tourism-oriented cities, and resource-oriented cities for its research, based on the city’s development history, industrial structure, policy response, and market economic forces.
A policy-oriented city is a developing city with government policies as the leading force. As the capital of China, Beijing is of high concern to central and local government, and its policy support is strong. Its political resource advantages play an important role in its urban development process [15]. Therefore, Beijing is selected as a typical policy-oriented city for research. Shanghai, as China’s financial center, exerts strong market forces and has strong urban economic functions [16], so Shanghai is selected as an economy-oriented city. According to the “China City Yearbook”, the provincial capital city with the largest proportion of secondary industry, namely Nanchang City (accounting for 50.45% of industrial output value), is selected as a typical representative city for industrial orientation and the selection takes into account the influence of the degree of data acquisition. Guizhou Province has vigorously developed its tourism in recent years; according to the “China City Yearbook” data, its tourism GDP accounts for 7.9%, which makes it the province with the highest proportion of China’s tourism GDP, so its capital city Guiyang is selected as a tourism-oriented city. Datong is rich in coal resources and is responsible for a high proportion of the output value of extractive industry. It has been recognized as a typical resource-based city in China by the Macro Research Institute of the State Planning Commission of China [17].

2.2. Data Source and Preprocessing

Since the evaluation of a healthy city involves comprehensive considerations of social health, land use, economic development, and other urban aspects, the data search involves many data sources such as statistical yearbooks, statistical bulletins, and remote sensing data. Table 1 shows the data sources for each indicator. Given availability, the socio-economic data mainly comes from “China City Statistical Yearbook (2015–2019)” [18,19,20,21,22], “China Health Statistics Yearbook (2015–2019)” [23,24,25,26,27], and the 2015–2019 Annual statistical yearbooks of stprovinces and cities [28,29,30,31,32,33,34,35,36,37,38,39,40,41,42,43,44,45,46,47,48,49,50,51,52]; administrative division data and land use remote sensing data come from the Resources and Environment Science and Data Center of the Chinese Academy of Sciences [53]; road information data comes from the National Geographic Resources Catalog Service System [54] and the air quality data comes from the China Air Quality Online Monitoring and Analysis Platform [55]. Some index data need to be calculated using relevant formulas. For example, the “number of doctors per 10,000 people” index needs to be calculated by dividing the number of urban medical staff by the urban permanent population. Table 2 shows the indicator calculation formula. Due to missing data for individual indicators, the average data of adjacent years is used to replace or calculate this missing data, based on the average annual change rate of adjacent years. For the specific index construction method, please refer to Section 3.1.

3. Evaluation Model Construction

3.1. Construction of Healthy City Index System

This article is based on the National Healthy City Evaluation Index System (2018 Edition), combined with the China SDG Index Construction and Progress Evaluation Report: 2018 and previous literature. Following the four basic principles, green development, people-oriented, importance, and operability [56], a healthy city indicator evaluation system was constructed from the five perspectives of environment, economy, service, population, and space. The five first-level indicators have a certain mutual relationship. Population is the driving factor for the healthy development of the city. Space is the result of the interaction between people and the external manifestation of social development. The environment is the necessary material and environmental basis for sustainable urban development [57]. At the same time, under the mechanism of the government’s purchasing of service support from social forces through financial funds, the level of social services is an important outward manifestation of urban economic development and government management [58].
On the basis of reviewing and summarizing the currently available literature on the construction of a healthy city index system [6,12,13,14,59,60,61], the evaluation system for healthy cities constructed in this paper strictly follows policy orientation, the construction principles for an index system and the characteristics of city development, and on the basis of first level indicators uses the “China SDG Index Construction and Progress Evaluation Report: 2018” to select maternal mortality rate, infant mortality rate, railroad density, per capita urban road area, urban PM2.5 annual average level, harmless disposal rate of domestic waste, and many other secondary indicators reflecting the sustainable development of cities; along with this, a total of 25 level indicators were selected to evaluate urban health in combination with the existing healthy city evaluation index system. The detailed healthy city index system is shown in Table 3 [10,62].

3.2. Method

At present, the EAP method is mostly used in the evaluation of eco-cities, land-intensive use, and green space ecological service efficiency [63]. It selects multiple evaluation indicators based on the principle of reasonableness and performs hyperbolic standardization on the selected multiple indicators. The standardized value participates in the calculation of the entire array polygon comprehensive index. The larger the comprehensive index, the better the evaluation result [64]. This method includes both geometrical visual graphics and algebraic analytical values. The core principle of polygon area ratio is used to comprehensively calculate the constructed index system [65], which overcomes subjective intervention, and the calculation results also reflect the critical value of each index. The effect of zooming in and out of comprehensive indicators not only reflects the principle of system integration but also enables independent quantitative evaluation of urban health [66].
The specific definition of the EAP method is as follows: taking the upper limit value of n evaluation indicators (standardized) to form a central regular N-gon with radius, the index value connection forms an irregular central N-gon, with n vertices, an entire array of indicators end to end [65].
The index value standardization adopts the hyperbolic standardization function Q(x):
Q x = ( U L ) ( U T ) U + L 2 T x + UT + LT 2 LU
Q(x) satisfies the following conditions:
Q x | x = L = 1 , Q x | x = T = 0 , Q x | x = U = 1
In the formula, L, U, T are the lower limit, upper limit, and critical threshold of the index. In this paper, U, L, and T are the maximum (small) value, minimum (large) value, and average value of the positive (negative) index.
For the i-th index, the standardized value Si is:
S i = ( U i L i ) ( x T i ) U i + L i 2 T i x + U i T i + L i T i 2 U i L i
N indicators can make a equilateral N-sided shape. Si = 1 is the value of N vertices, Si = −1 is the value of the center point, and the distance from the vertex to the center point is the interval of the standardized value of the index (−1,+1); the critical area of the indicator is a polygon formed when Si = 0. The inside of the critical area indicates that the normalized value of each indicator is negative. Below the critical value, the outside indicates that the normalized value of each indicator is positive, above the critical value [65].
The comprehensive index value is calculated based on the relationship between the standardized value of each index and the maximum and minimum values after standardization, that is, the comprehensive index value is calculated by the area of n ( n 1 )   2 triangles composed of each index. The calculation formula [67] of the comprehensive index of the entire array polygon is:
S = i j i , j ( S i + 1 ) ( S j + 1 ) 2 n ( n 1 )
In the formula, Si and Sj are the standardized values of the i-th and j-th sub-indices, n is the number of indicators, and S is the comprehensive index.

4. Results and Analysis

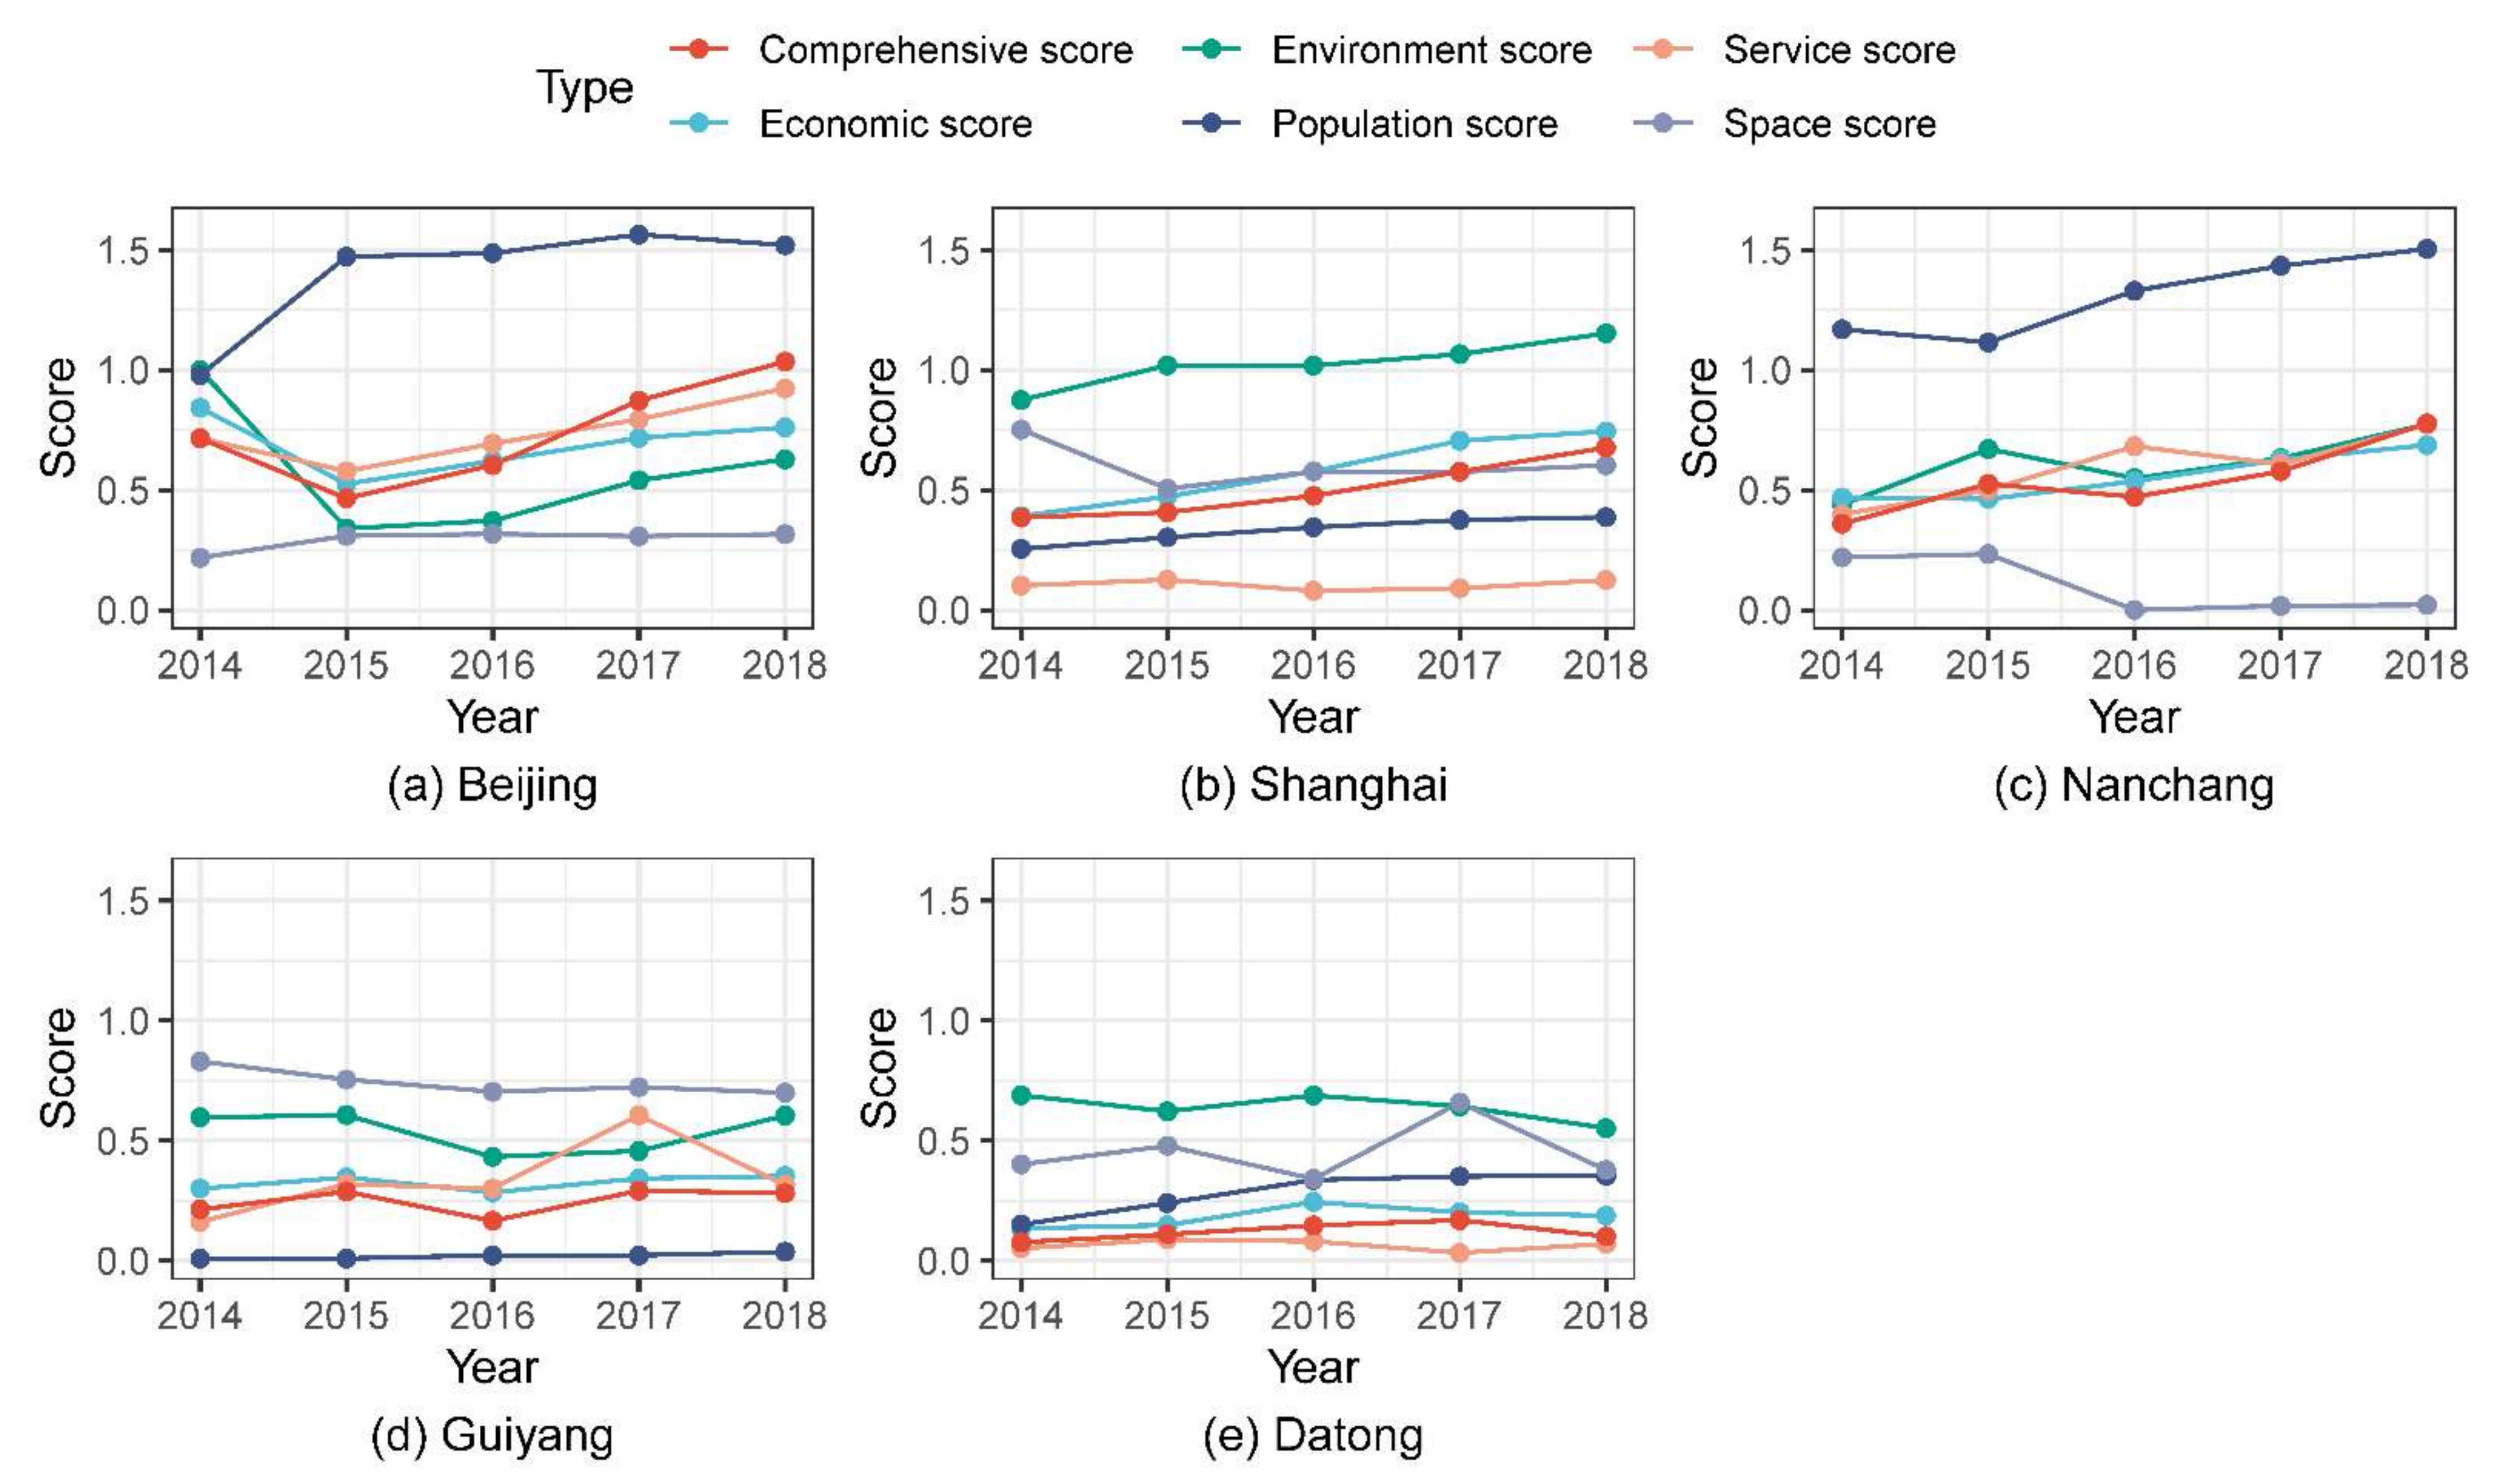
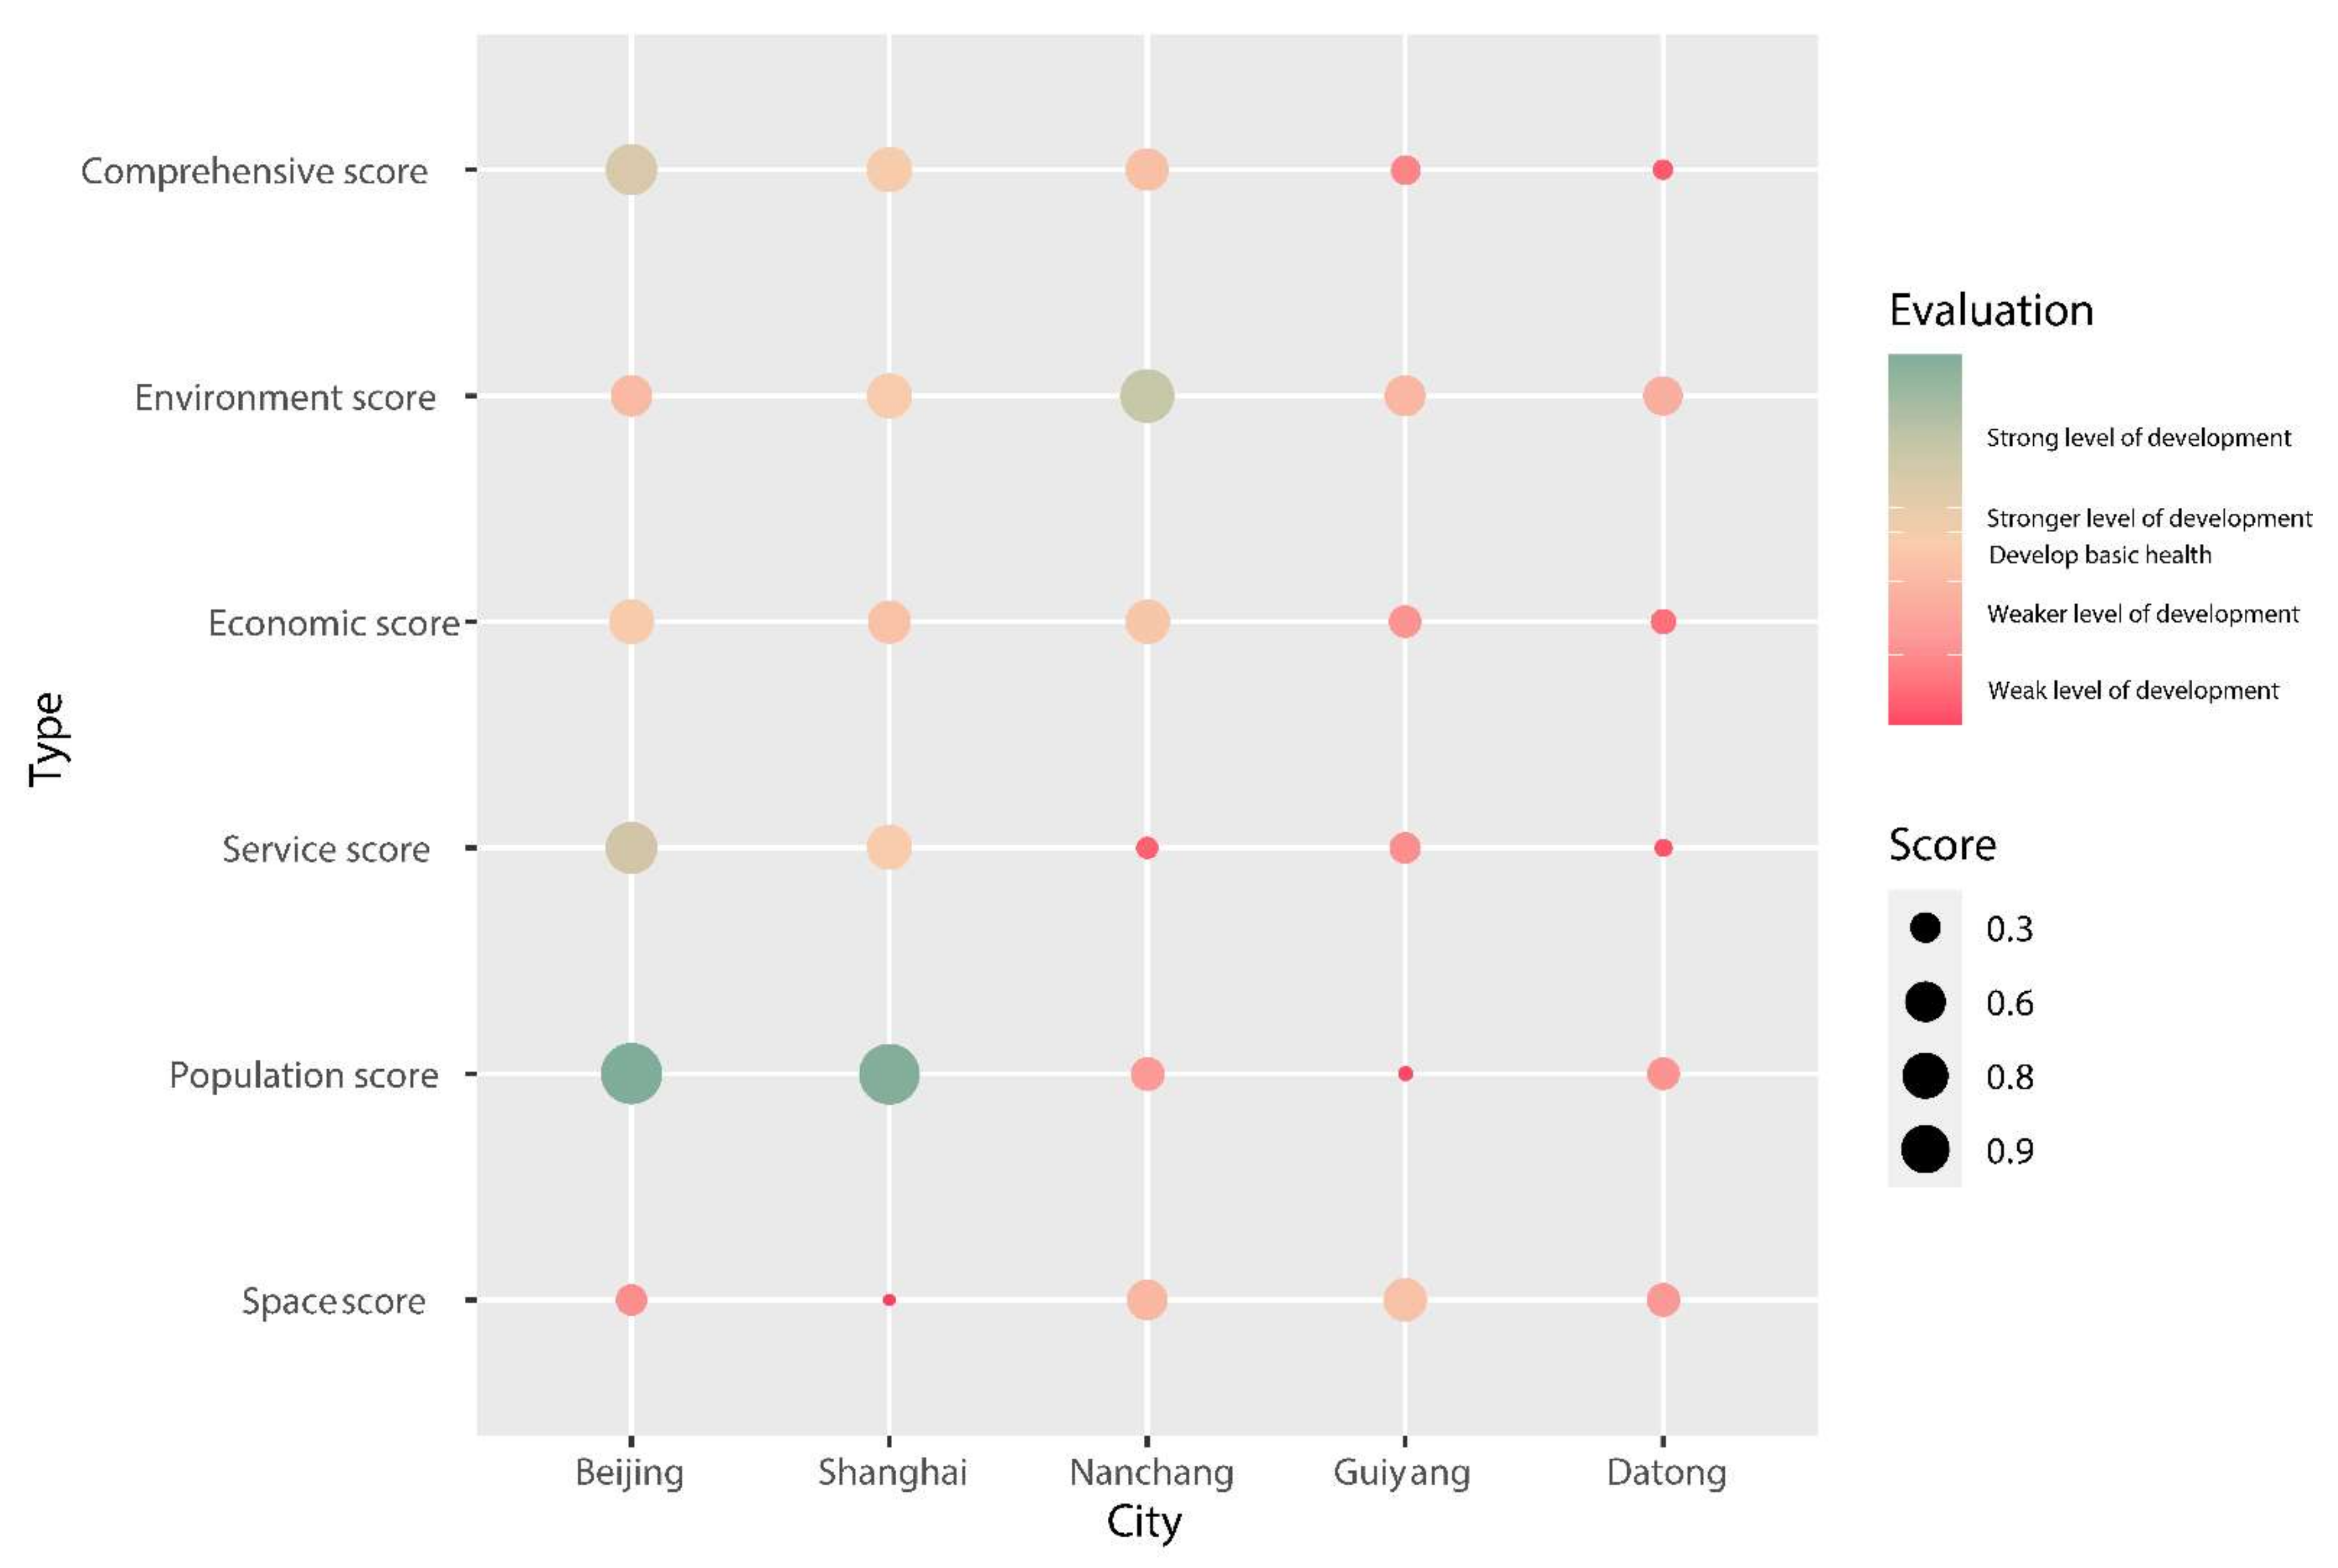
4.1. Typical Urban Health Evaluation Results

According to the constructed indicator system, the relevant data for the construction of healthy cities in various cities from 2014 to 2018 are selected for empirical analysis. The quantitative calculation of the comprehensive evaluation index of the typical city’s health can solve the problem of how to measure and evaluate the development of a healthy city in a region, that is, whether it is developing towards a healthy city. At the same time, it can better identify whether the development of urban construction is in a healthy and sustainable direction, and is conducive to future government departments objectively formulating environmental objectives and policies according to the current urban situation and reasonably evaluating their implementation effects [13]. Figure 2 shows the construction of healthy cities in various cities from 2014 to 2018.
The current grading method of the comprehensive evaluation index of sustainable development is referred to, in order to classify the healthy city evaluation index to qualitatively describe the healthy development of the city, as shown in Table 4 [66,68].

4.2. The Status Quo of Healthy Construction in Typical Cities

4.2.1. Healthy City Construction in Beijing

Figure 2a shows the urban health scores for Beijing from 2014 to 2018. It can be seen from Figure 2a that, from 2014 to 2015, the comprehensive health index of Beijing showed a downward trend, and then from 2015 to 2018 the comprehensive health index continued to rise, which was consistent with the trend for environment, economy, and service scores. The population score increased from 2014 to 2017, and decreased slightly in 2018 compared with 2017. The spatial score is opposite to the overall score trend, showing firstly a rising development trend from 2014 to 2015, and then a continued decline from 2015 to 2018.
From 2015 to 2016, although comprehensive utilization is still the main way to deal with general industrial solid waste, this has shown a downward trend year by year [69]. Historical data show that, from 2014 to 2018, the general industrial solid waste treatment methods in large and medium-sized cities have mostly changed from comprehensive utilization to storage, and the amount of historical industrial solid waste stored has increased. However, in general, from the proportion of good air quality, the harmless treatment rate of domestic waste, the annual average PM2.5 content, the forest coverage rate, and the changes in water area, it can be seen that environmental quality continues to improve under the control of the Beijing Municipal Government.
As the capital of China, Beijing’s medical and public service conditions have always been among the first in China, and with the development of social productivity and medical technology the infant mortality rate, maternal mortality rate, and the incidence of Class A and B infectious diseases as population evaluation items are all declining because of ever-improving living conditions. At the same time, due to the needs of urban development, Beijing continues to build urban roads, the per capita urban road area continues to increase, and the rate of increase is higher than that of population density. Therefore, the overall space score has increased. However, with the continuous maturity of urban development, the rate of urban construction has gradually fallen below the rate of population growth, and the increase in population density has led to a decrease in Beijing’s spatial score.

4.2.2. Healthy City Construction in Shanghai

Similar to the situation in Beijing, the changing trend in the final score of Shanghai’s urban health is the same for environment, service, and economy. These all show volatile changes, though the range of change is limited to 0.3–0.8. The change in Shanghai’s population score showed a declining trend from 2014 to 2015 and a steady increase from 2015 to 2018.
From 2015 to 2016, according to the “China Social Statistical Yearbook (2017)”, the urban road area per capita in Shanghai dropped from 7.96 m2 to 4.27 m2, a decrease of 46.4%. Secondly, due to the strong urban development momentum of Shanghai, there are more job opportunities than in other cities. The influx of a large number of migrants has caused population density to increase year by year, and the city is overcrowded. As a result, the urban space score has increased too slowly compared with other dimensions. At the same time, due to the rapid population growth in 2017, the rate of setting up medical and health service facilities such as hospital beds in Shanghai was slower than the rate of population growth, resulting in a slight decrease in Shanghai’s service scores in 2017.
According to the data from the “Shanghai Statistical Yearbook” and “China City Statistical Yearbook”, from 2014 to 2015, under the guidance of the “Twelfth Five-Year Plan for Environmental Protection and Ecological Construction in Shanghai”, Shanghai comprehensively promoted sewage treatment plants and pipeline networks. In key projects such as construction, electric field dust removal, and renovation, Shanghai’s regional environmental noise has dropped from 55.6 dB to 52.02 dB, and the harmless treatment rate of domestic waste has risen from 95% to 100%, forming a relatively complete risk source control system, a supervision system for abandoned radiation hazard and an emergency system for sudden pollution accidents [70]. From 2016 to 2018, Shanghai vigorously promoted pollution control, reform, and innovation, and did a good job in environmental protection for the first China International Import Expo. With the efforts of the municipal government, Shanghai’s PM2.5 content has been greatly reduced, with an average annual PM2.5 content decrease from 53.611 ug to 34.047 ug, the proportion of good air days was also more than 80%, and the environment score continued to increase.

4.2.3. Healthy City Construction in Nanchang

Figure 2c shows the urban health scores for Nanchang from 2014 to 2018. In general, the urban health score curve continued to grow steadily from 2014 to 2018. In addition to the spatial score growth curve, the environment score, economic score, service score, and population score curve also showed a steady extension and a small but steady growth in 2018, indicating that the construction of a healthy city in Nanchang is generally developing well.
Compared with Beijing and Shanghai, Nanchang’s environment score is stable at above 0.8 and shows a continuous growth trend, indicating that the urban environment of Nanchang is developing well. At the same time, with the continuous development of urban productivity, Nanchang’s economy, services, and population are all in a period of continuous growth. The economic, service and population score curves continue to rise. However, compared with the economically developed Beijing and Shanghai, the service score of Nanchang has always been between 0.05 and 0.20, which proves that the social welfare system in Nanchang is not perfect and there is still much room for improvement.
The spatial score of Nanchang is in a state of fluctuating change. As the capital city of Jiangxi Province, the population density has been continuously increasing, but at the same time Nanchang’s urban development speed is relatively slow, and the speed of the urban road transportation network is unstable, which leads to fluctuating changes in the urban road area per capita. The superposition of multiple factors together leads to a fluctuating change in the overall spatial score for Nanchang.

4.2.4. Healthy City Construction in Guiyang

The urban health of Guiyang shows obvious developmental instability and large inter-annual fluctuations. From 2014 to 2018, the overall spatial health evaluation curve for Guiyang showed a relatively gentle downward trend. The downward trend in 2014 was relatively significant, but after two years of a downward trend in the spatial health evaluation, the 2016 score trend started to rise slowly, though the speed was unstable. These phenomena all indicate that Guiyang has good basic conditions for urban space construction, but the development trend is not yet stable, and the government still needs macro-control.
The changing trend in the economic score and service score change curve is consistent with the change range for the comprehensive health score curve of Guizhou, indicating that this is the key system factor that affects and restricts the urban construction of Guiyang at this stage. At the same time, there is a correlation between the two, and the service score change curve is generally linked to social welfare and economic development. As a city with tourism as its pillar industry, Guiyang’s economic development is relatively backward compared with other cities, so its score in urban services is relatively low. However, the urban service score in 2017 has shown a positive trend, which proves that Guiyang’s urban services still occupy a promising development space.
In terms of population scores, as one of China’s economically backward southwestern cities, Guiyang’s medical and health standards, disease prevention, and physical care systems are relatively backward, and the population’s average life expectancy, infant mortality, maternal mortality, and other population scoring indicators are not satisfactory. Therefore, compared with the population scores of other cities, the population score of Guiyang has been maintained at around 0.2, which still requires effective targeting by urban decision-makers.
On the whole, in the development process of Guiyang, environmental development and spatial development are relatively coordinated, but the development of population is not coordinated with other systems, which is an important factor affecting the development of a healthy city. Guiyang municipal government should formulate timely and corresponding policies to improve population development.

4.2.5. Healthy City Construction in Datong

Datong is an important resource-oriented city in China, as well as a key coal resource base. In general, the urban health score curve for Datong has been maintained between 0.1 and 0.2, the urban health level is poor compared with other cities, and there is still a clear downward trend.
Although Datong is an important resource-oriented city in China, in terms of environmental development Datong’s score remains above 0.5, and its environmental development is in a basically healthy state. However, since 2016, the environment score for Datong has shown a downward trend. This is mainly due to the continuous decrease of the forest and water area in Datong, a phenomenon of “deforestation and prospecting”.
The service score changes in Datong are also relatively flat and the score continues to be low. That the current level of urban infrastructure construction in Datong cannot meet the needs of the urban population is one of the difficulties facing its infrastructure construction.
In recent years, Datong has actively adjusted its industrial orientation. The proportion of tertiary industry has increased year by year. At the same time, the ratio of residents’ income and expenditure, per capita GDP, and total per capita social consumption are also steadily increasing. It proves that, under the guidance of the Datong government, Datong has gradually transformed from a resource-oriented city to a tertiary industry city. The development has been fruitful, and the economic score has been relatively stable and reached a small peak in 2016.

4.3. Dimensional Analysis of Health Differences

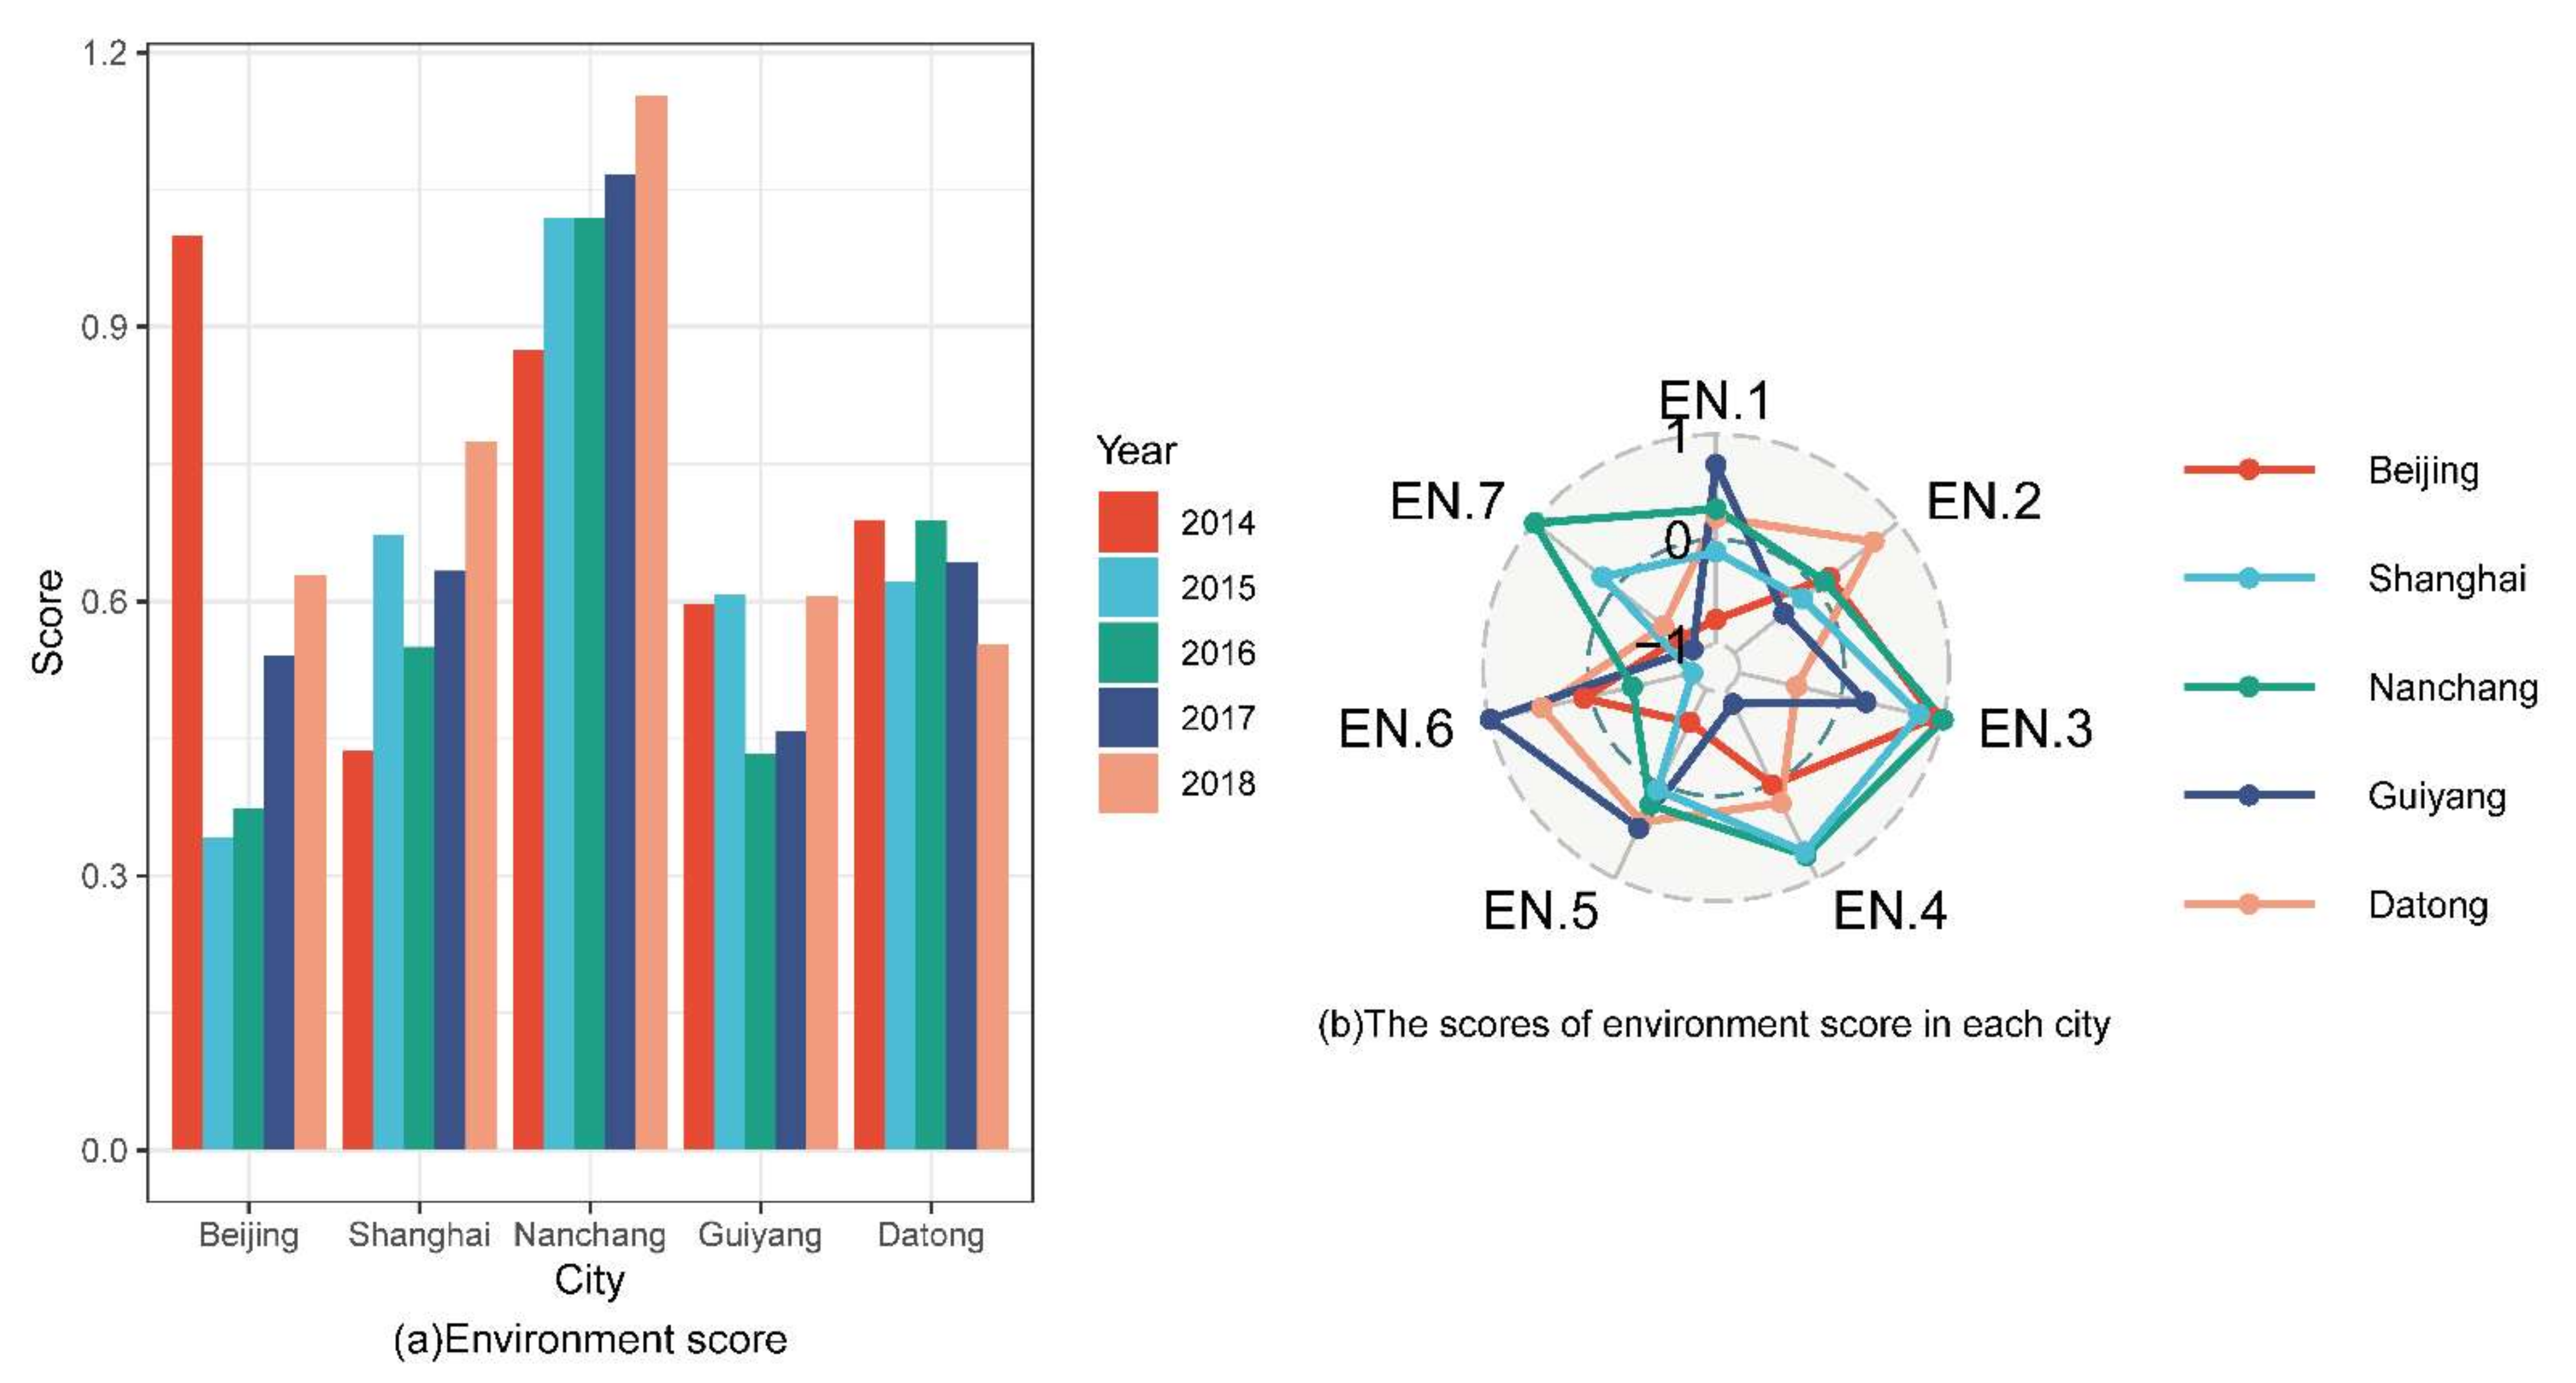
4.3.1. Environmental Dimension

The environment scores for various cities from 2014 to 2018 are shown in Figure 3a. From Figure 3a, it can be seen that the overall environment scores of various regions have shown an increasing trend year by year, indicating that the current environmental protection policies implemented by various provinces and cities in China are effective. Environmental construction is generally progressing well. Figure 3b shows the average scores of the sub-indices of each typical urban environment dimension. Combining with Figure 3a, it can be seen that the environment dimension scores for various regions are closely related to the local geographic location, development type, and resource advantages. As a city dominated by tourism industry, Guiyang has more than 90% of days with good air quality, and about 48% of the total area is covered by forests. However, due to its geographical location in the southwest, the proportion covered by water is relatively high, but only accounts for about 1% of the area. At the same time, the scale of the city and the level of urban construction also affect the health of the urban environment to a certain extent. Beijing, Shanghai, Nanchang and Guiyang, as municipalities or provincial capitals, have a relatively high degree of urban construction development, and their harmless treatment rate of domestic waste scores above 90%. In contrast, Datong, as a coal-based economic city that relies on coal resources for development, is relatively backward. The average annual domestic waste treatment rate score is about 85%, which is relatively low.

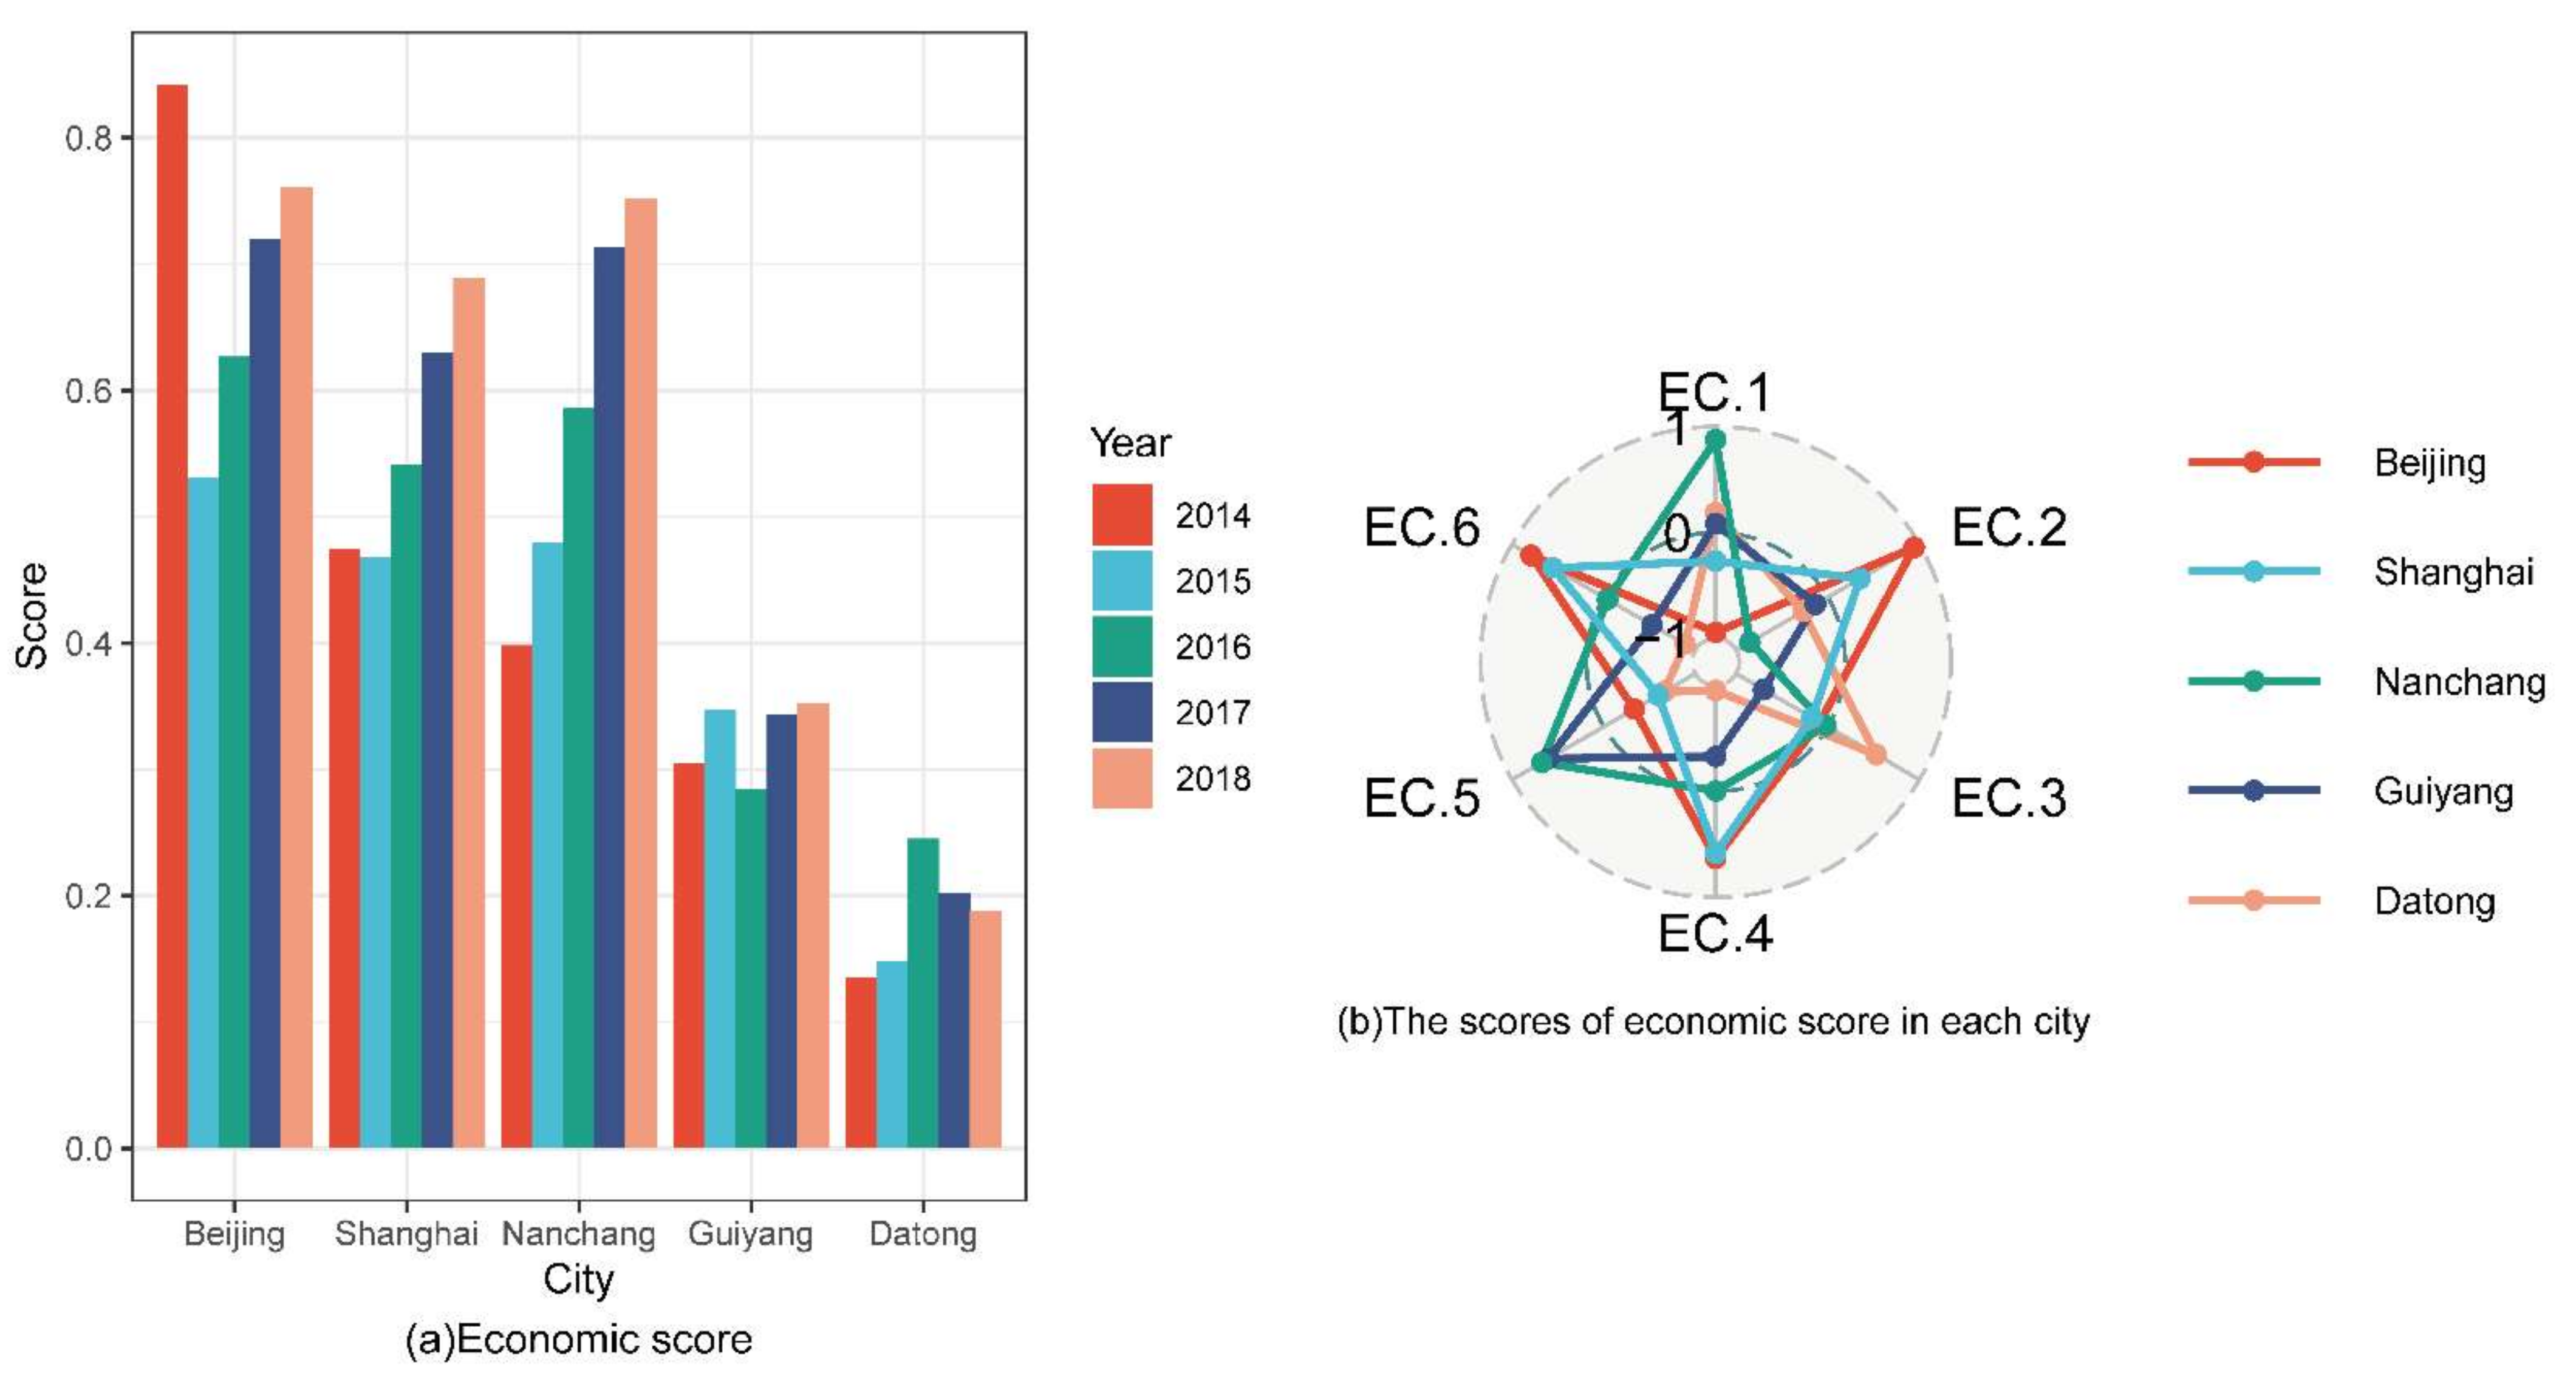
4.3.2. Economic Dimension

The economic scores for each city from 2014 to 2018 are shown in Figure 4a. It can be seen from Figure 4a that, with the exception of Datong, the economic scores of Beijing, Shanghai, Nanchang, and Guiyang tend to increase as a whole. As a resource-oriented city, Datong is economically weak in terms of its subsequent development compared with other cities, indicating that the economic transformation problem in this region needs to be solved urgently. Figure 4b shows that the type and level of economic development play an important role in the economic dimension score. Beijing, Shanghai and Nanchang, as cities with relatively good economic development, have a per capita total of more than 30,000 yuan for social consumer goods, and by 2018, their per capita GDP was higher than 90,000 yuan. As a city that has vigorously developed emerging industries in recent years, Guiyang has seen rapid growth in its emerging industries, high fixed asset investment scores, and per capita fixed asset investment of more than 80,000 yuan.

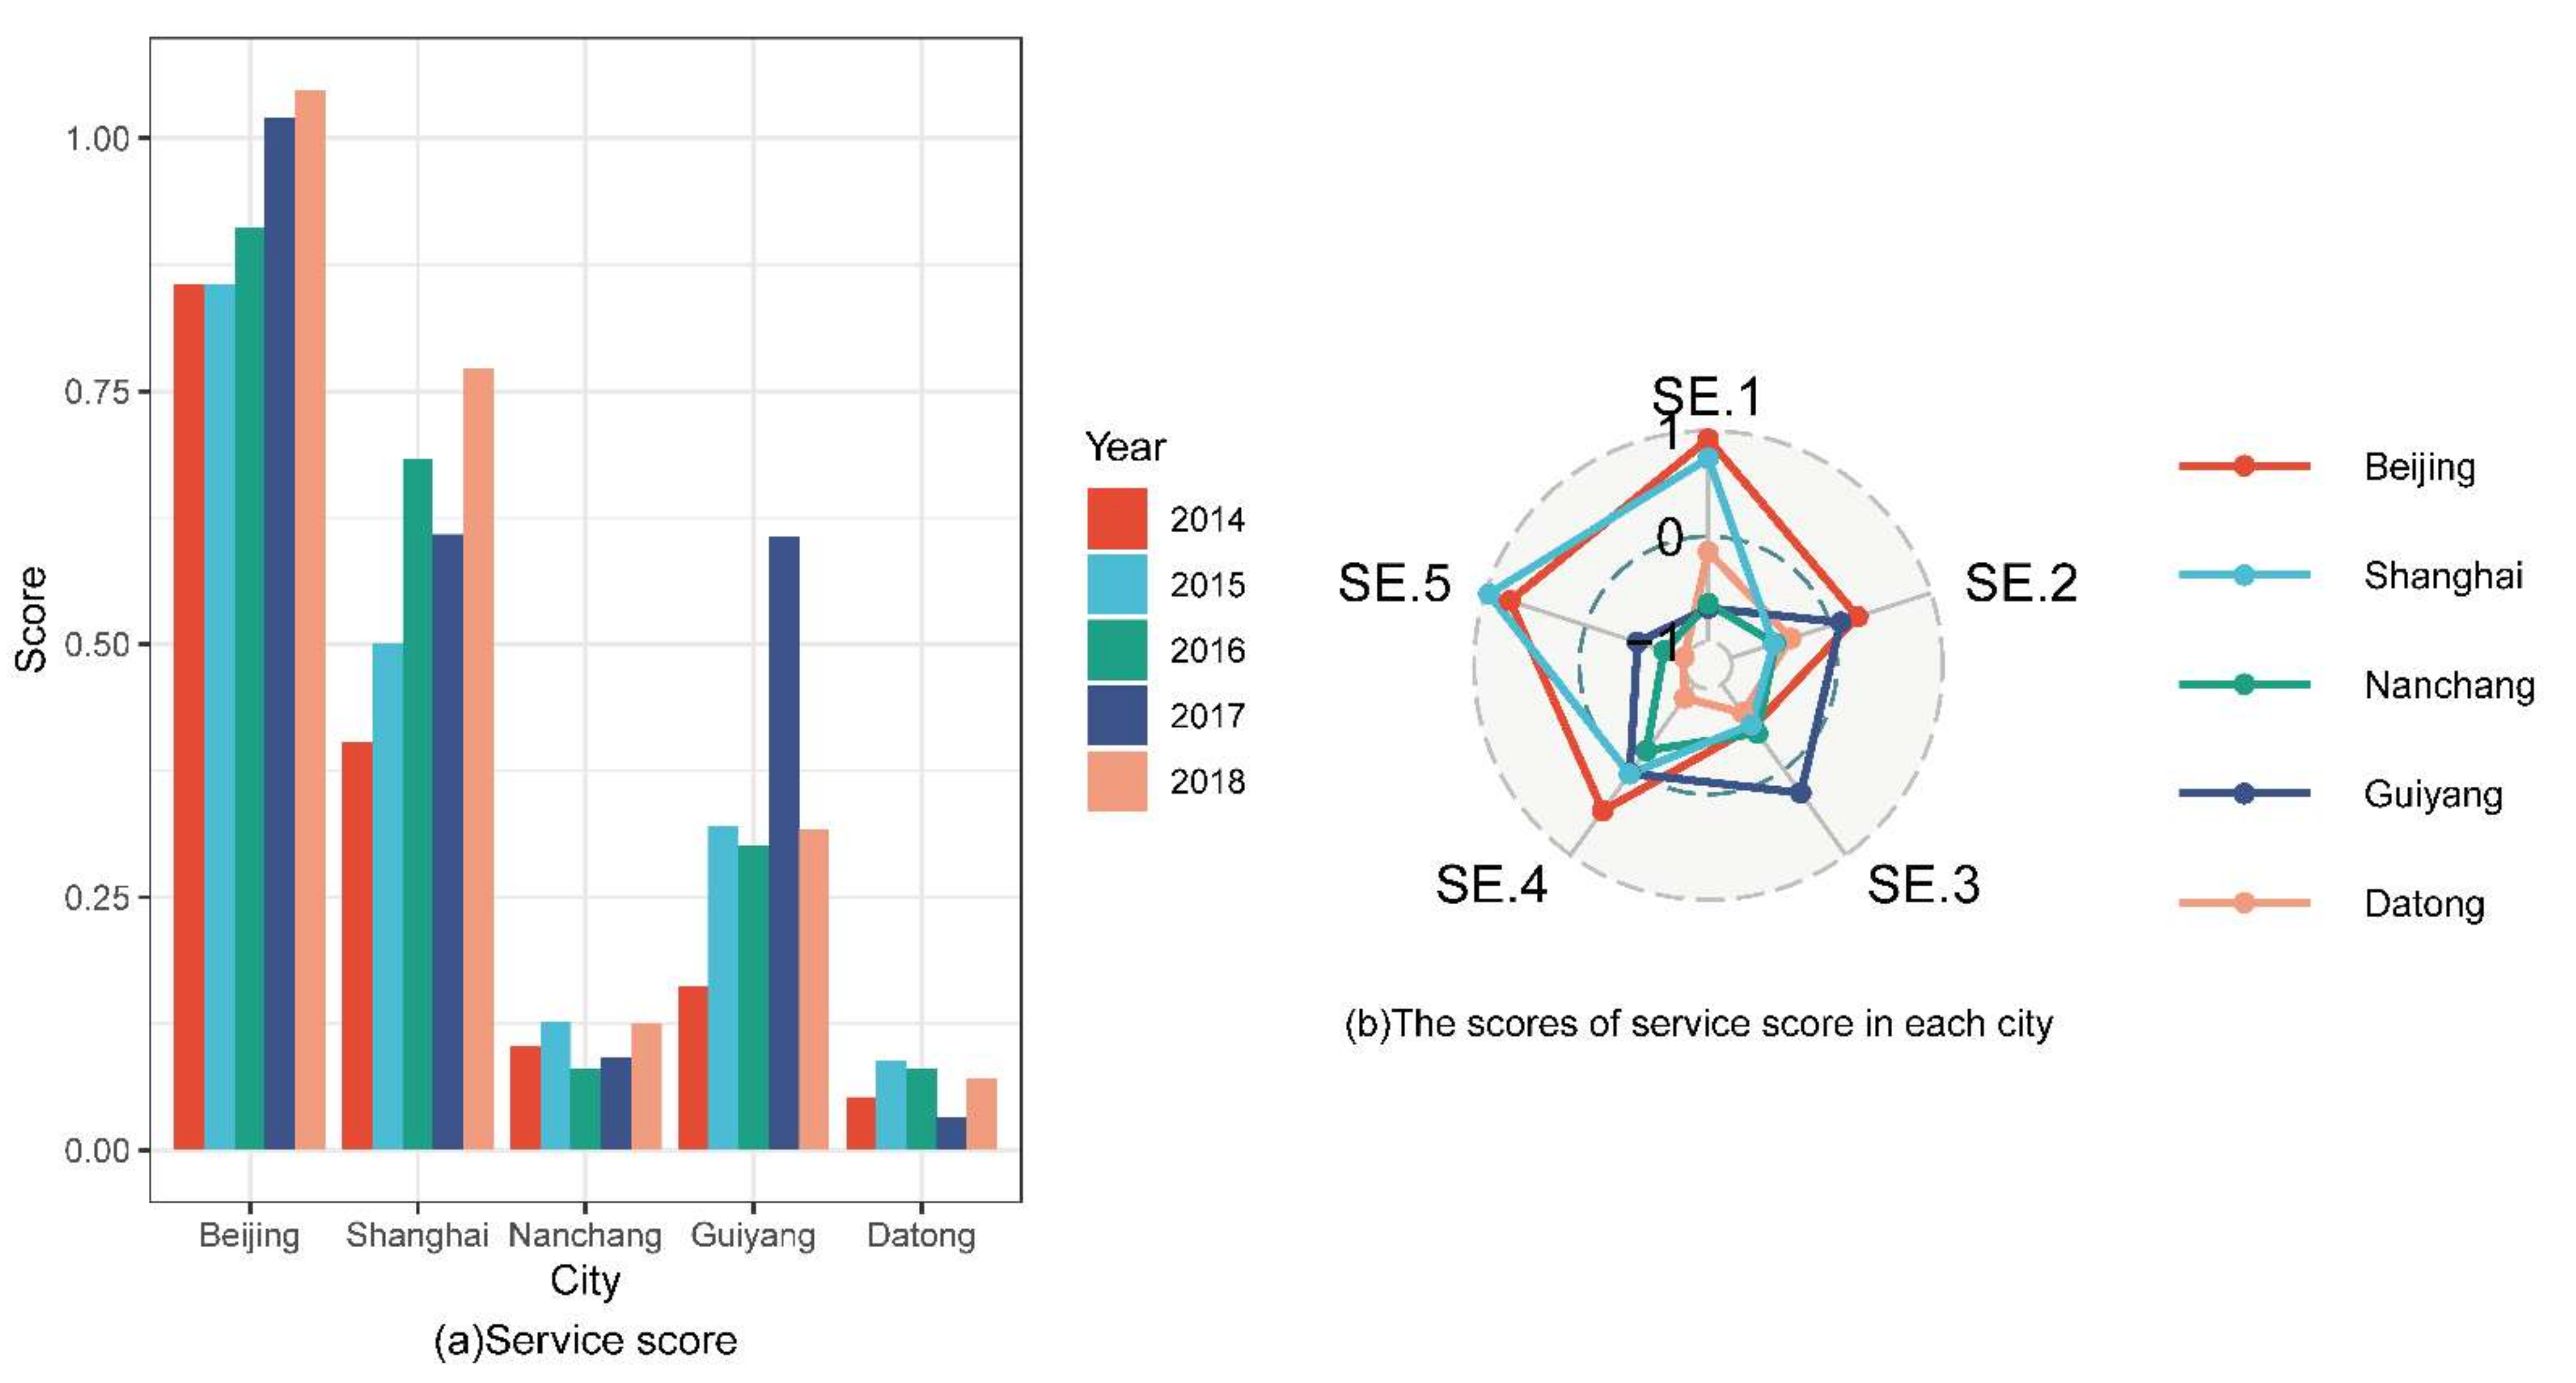
4.3.3. Service Dimension

The service scores for Guiyang, Nanchang, and Datong have been relatively stable, except for Beijing and Shanghai, which have been increasing year by year. It can be seen from Figure 5b that the service score is related to the city’s scale and economic strength. The municipalities directly under the central government have many job opportunities and strong urban construction and development capabilities, which have attracted a large influx of young people, therefore the quality of the population tends to be younger, and the city’s Internet development level is high. At the same time, as a municipality directly under the Central Government, the city has a strong economic strength, and its social welfare provision such as library collections and the number of public vehicles are significantly higher than other cities. The population size determines whether urban construction can meet the needs of population development. In contrast, Guiyang has an average of 98.6 hospital beds per 10,000 people, 40 more than in Beijing.

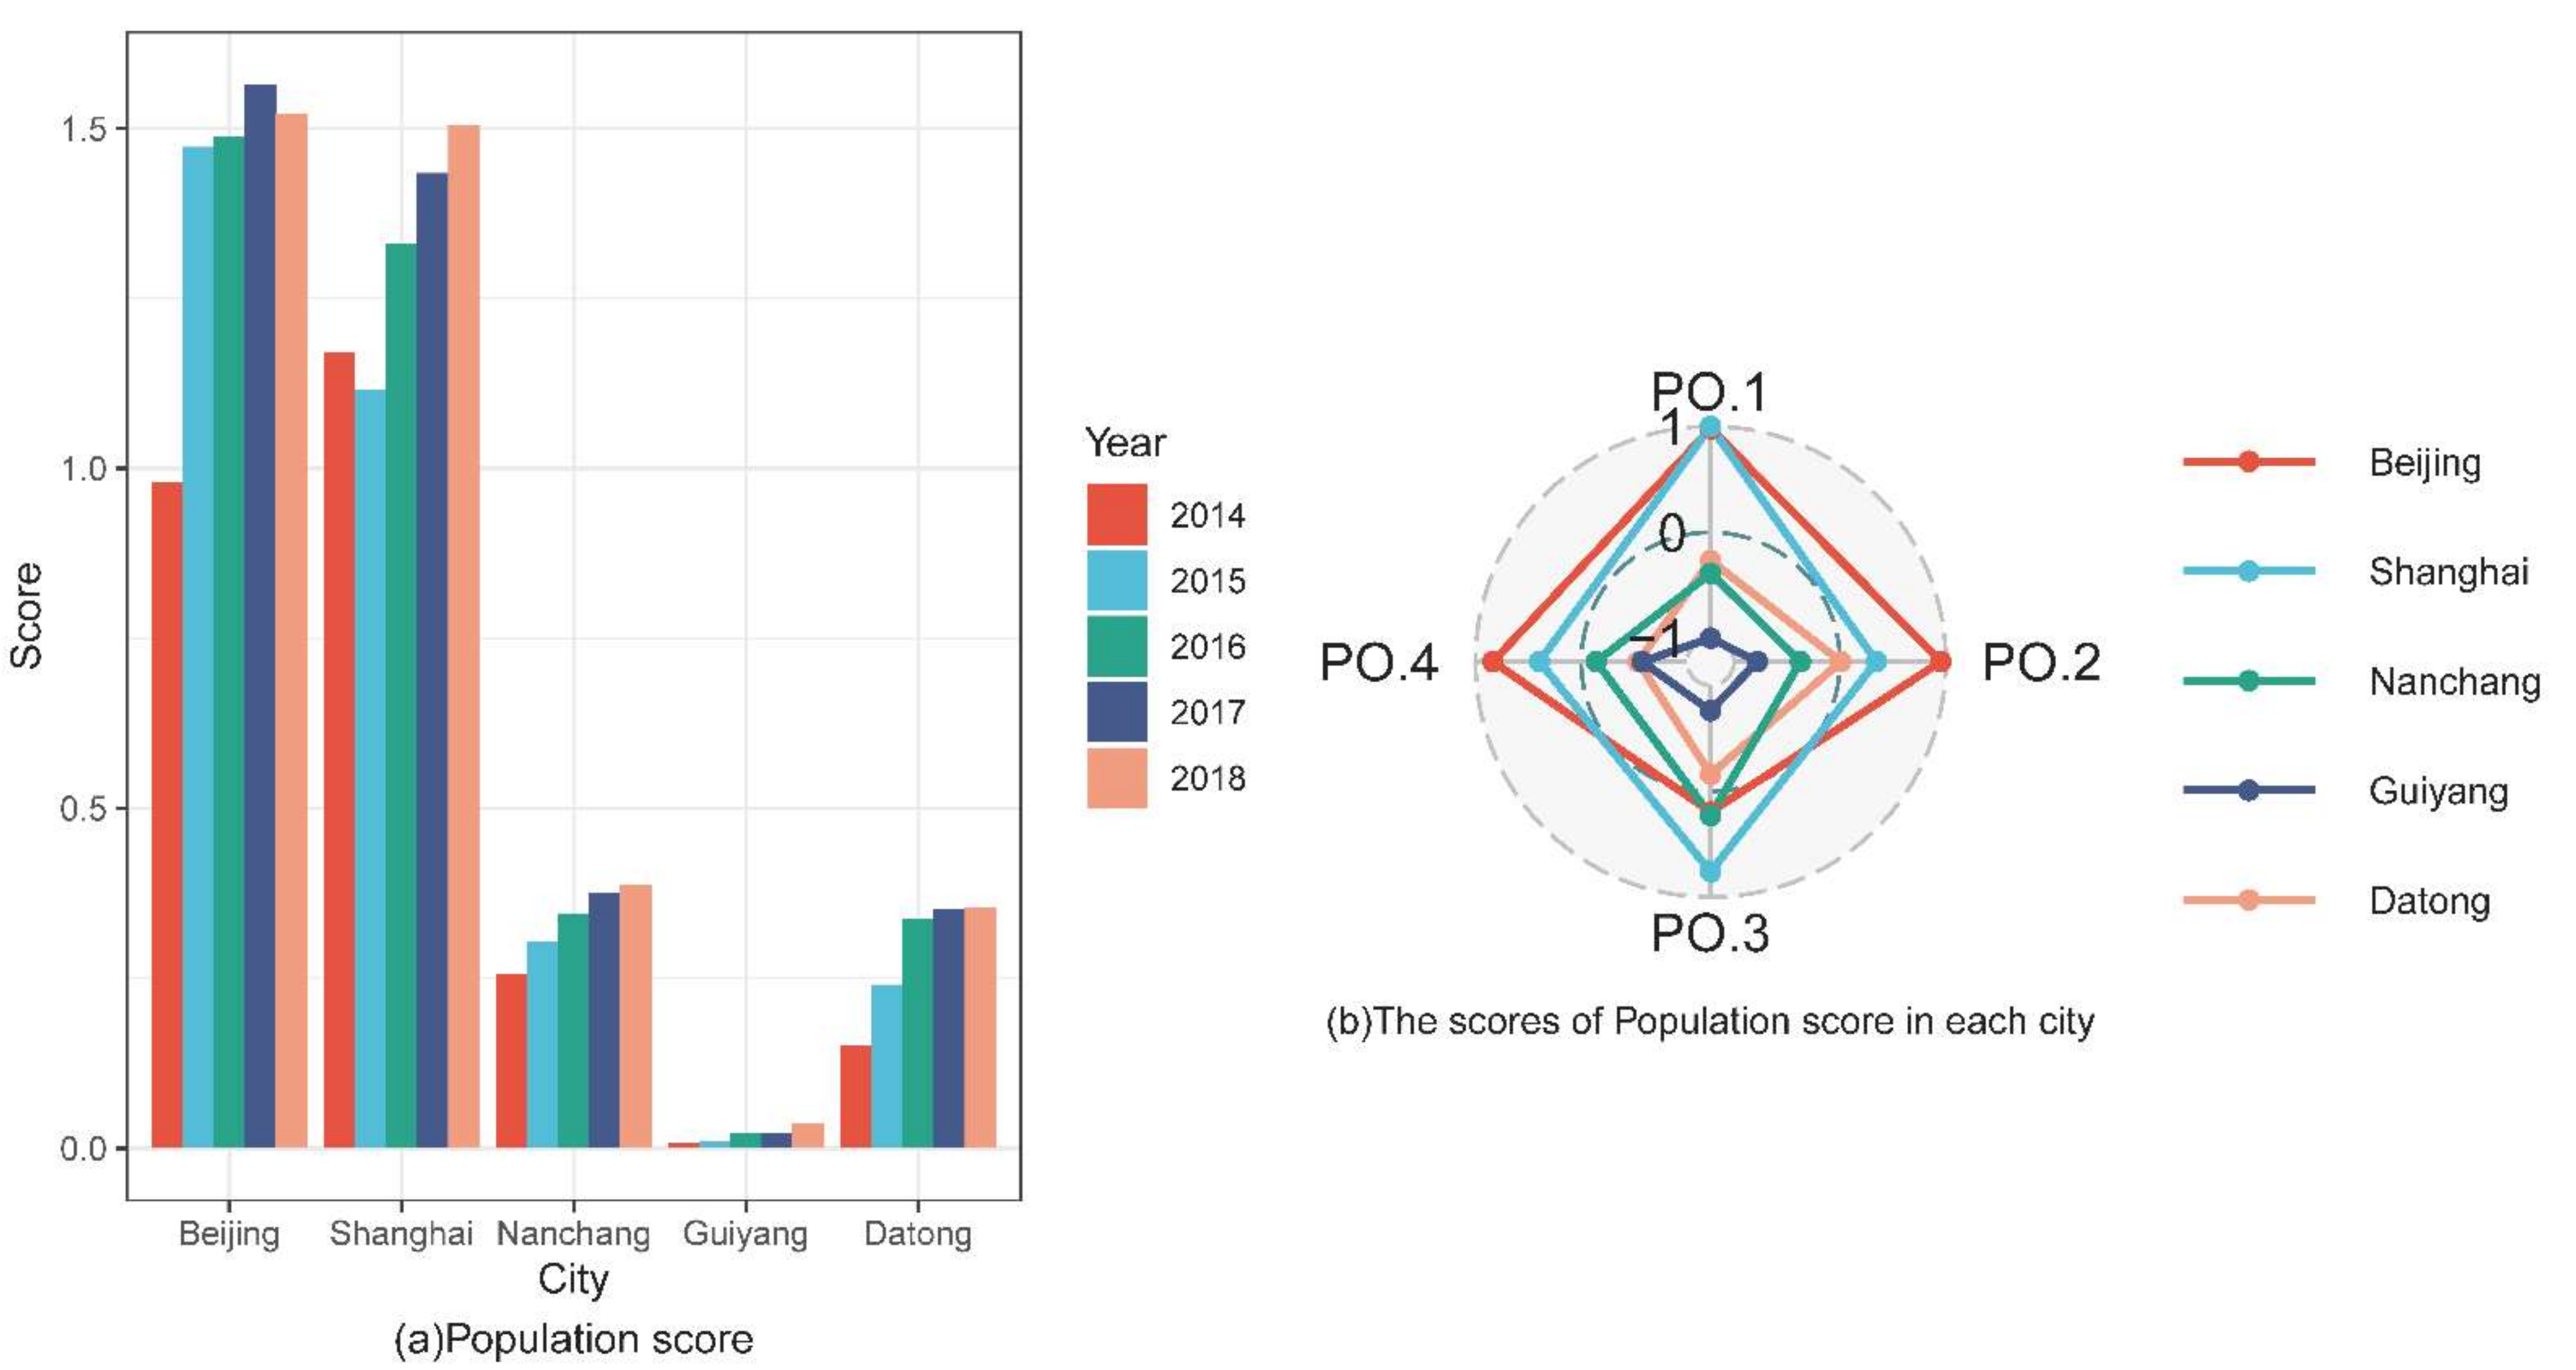
4.3.4. Population Dimension

Figure 6 reflects the population health scores of typical cities. On the whole, from 2014 to 2018, the population health scores of cities have been increasing year by year, but compared with Beijing and Shanghai the population development degree of other cities is relatively weak. The population health score mainly reflects the quality of local medical and health standards. It can be seen from Figure 6b that the average life expectancy, the incidence of Class A and B infectious diseases, the infant mortality rate and the maternal mortality rate in Beijing and Shanghai are relatively low. At the same time, the type of economic development may also be an important factor affecting the population dimension. As cities both dominated by industry, Nanchang and Datong have similar population health levels. On the other hand, Guiyang City, as a city mainly focusing on tourism and emerging high-tech industries, is relatively backward in medical and health provision, and its infant mortality rate, maternal mortality rate and the incidence of Class A and B infectious diseases are higher than that of other cities.

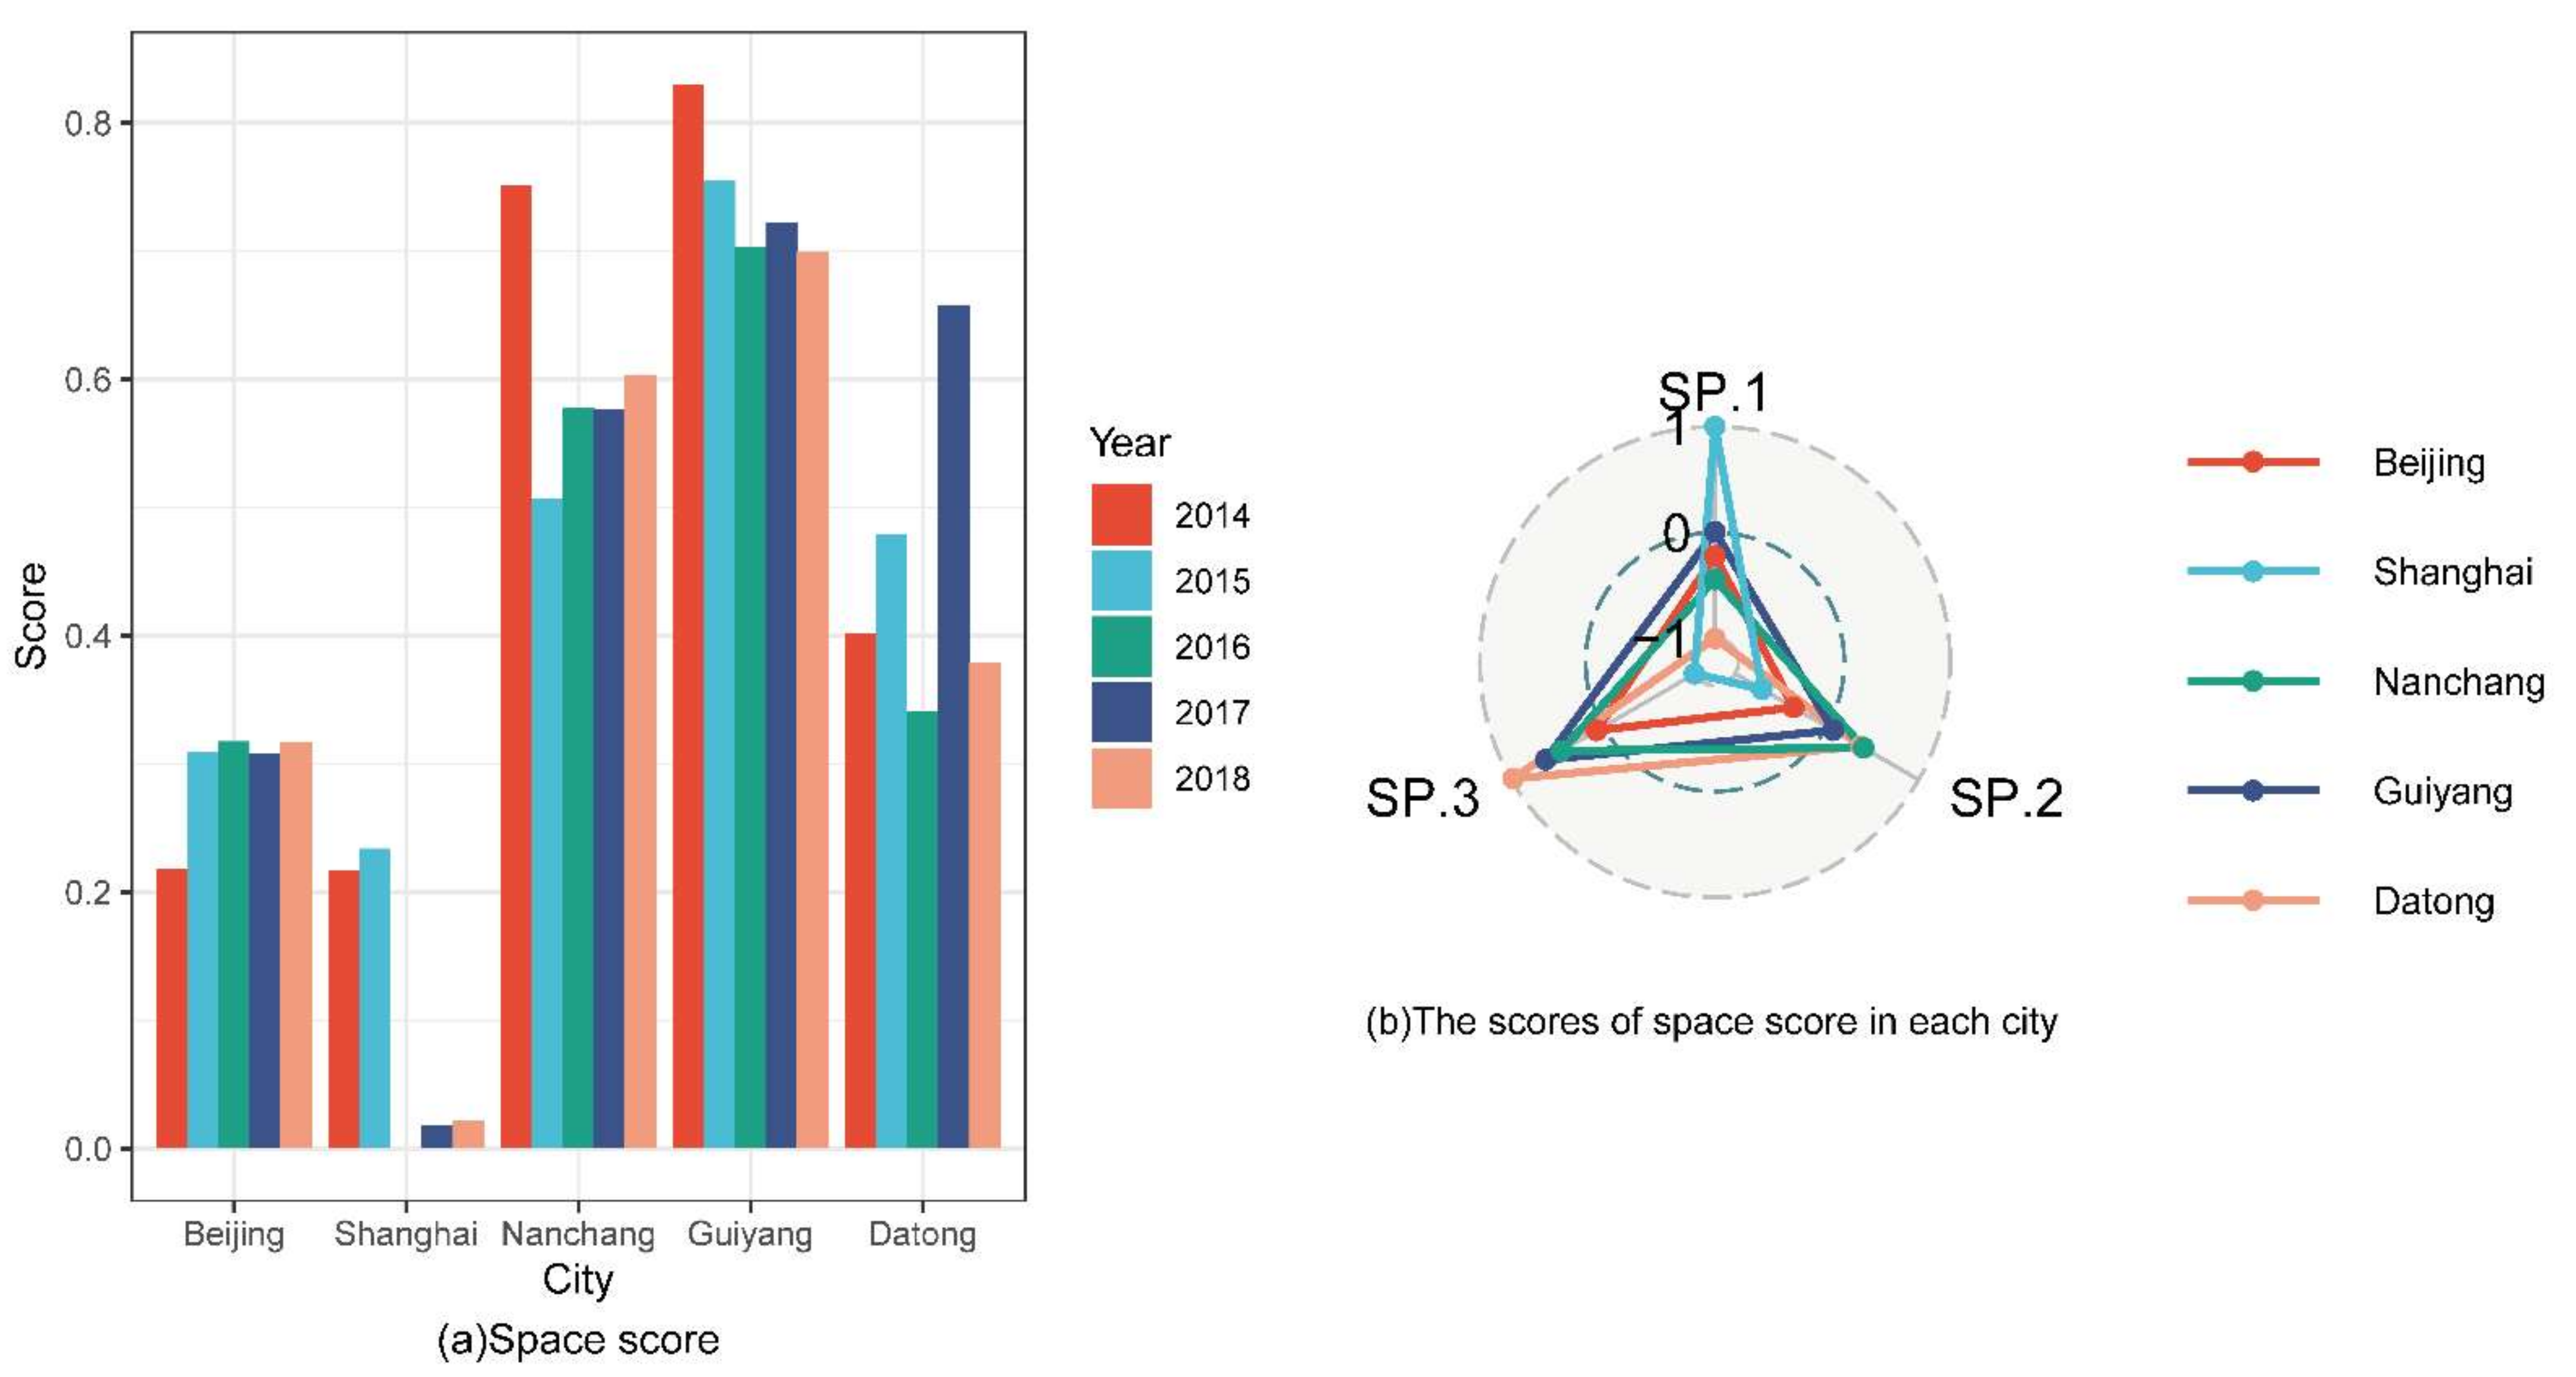
4.3.5. Space Dimension

The spatial health score selects three indicators: railway density, population density, and urban road area per capita. Figure 7 reflects the development of the spatial health scores of typical cities from 2014 to 2018. As can be seen, this is different from previous indicators; because the spatial health score index is related to the population and the area of administrative division, Nanchang, Guiyang, and Datong scored higher, while Beijing and Shanghai scored lower. In addition, spatial health is related to many factors such as policy, population, economic development, etc., so there is also an irregular phenomenon in the changes in score. The population density score is closely related to the city level. Due to its low level as a city, the policy and resource slope for Datong is relatively low, so the population density is relatively small compared to other cities. By 2018, the overall population density was only 243 persons per square kilometer. Beijing and Shanghai are the political and financial centers of China. Their population density is extremely high, and their score is low. Railway density is related to local development requirements. In addition to China’s two important population hub cities, Beijing and Shanghai, Guiyang is an important hub for the intersection of key national railway lines such as the Guiyang–Guizhou Railway, Shanghai–Kunming Railway, and Sichuan–Guizhou Railway. Similarly relatively high scoring, Datong, as an important hub for coal transportation in China, connects five main railway lines and several branch lines including Beijing–Baotou, Fengsha, Daqin, Beitongpu and Dahuai lines.

5. Discussion

The comprehensive score is an urban health score calculated by using the EAP on the basis of the environmental, economic, service, population and space index scores to comprehensively reflect the intensity of urban health construction. Figure 8 reflects the health indicator scores for each city and their comparison. From the perspective of score trends, under the combined effects of policies, economy, urban development opportunities and other factors, the comprehensive health scores for municipalities and provincial capital cities have generally shown an increase year by year. However, the overall urban health score for Datong in 2018 was slightly lower than that in 2017. This phenomenon shows that, compared with ordinary cities that still regard economic construction as the core task of urban construction, municipalities and provincial capitals pay more attention to the construction of urban health under the premise of sustained economic development.
If we divide the comprehensive health index of the selected cities according to the classification method mentioned in Table 4, by 2018, as the political center of China, Beijing has a comprehensive health score of 1.04, and the development of a healthy city is strong here; second and third are Shanghai as a financial center and Nanchang as a representative of an industrial city, with a comprehensive health score of 0.78 and 0.68, and where urban development is basically healthy; fourth is Guiyang, as a representative tourist city, with a comprehensive health score of 0.28, and the city’s health development is weaker; the last is Datong, a representative of resource-based cities, with a comprehensive health score of 0.1. The degree of healthy development is weak here compared with other cities.
This paper defines factors below the level of basic health in each typical city field as restrictive factors. By 2018, the results of the consolidation of restrictive factors for healthy city construction in each city are shown in Figure 8. It can be seen from this figure that the construction of healthy cities suffers from health constraints in different dimensions. As the political center of China, Beijing had an environment score of 0.63 and a spatial score of only 0.32 by 2018. The environmental and spatial dimensions are the main factors restricting its healthy urban development. As the financial center of China, Shanghai had a spatial score of only 0.02, which is the main factor restricting the construction of a healthy city. As a representative of an industrial city, Nanchang City has a service score of 0.13 and a population score of 0.39. Health construction in both areas needs to be strengthened urgently. Guiyang City, a representative tourist city, has an economic score of 0.35, and its development is relatively weak. At the same time, its service and population dimensions still need to be continually developed. However, as a resource-based city with coal resources as the driving force for development in China, Datong’s economic score as the basis for development is only 0.19, and the construction of a healthy city in terms of environment, service and population is still relatively backward.
The overall health of the city is the result of the joint action of all dimensions. As the foundation of urban development, the development of the economic foundation has a very important impact on the construction of a healthy city. A sound and sustained economic development can deeply promote the progress of the city in terms of social welfare and medical construction. In general, the scores for healthy city construction in each city are positively correlated with the scores for economic conditions. Sustained economic development has led to the gradual improvement of urban infrastructure and medical and health conditions [71]. At the same time, with the gradual transformation of the economy to tertiary industry, industrial emissions and pollution are also continuously reduced, thereby further improving the urban environment.
In view of the above phenomena, this study believes that cities such as Beijing and Shanghai, which have achieved certain advantages in economic construction, need to rationally optimize the development relationship between cities and their surrounding areas, and take the lead in all functional areas being reasonably allocated. Cities need to regulate their population distribution, form an urban population distribution pattern with a “combination of density and good development”, and provide a sufficient development driving force for the healthy development of each city. For cities with relatively weak services and population in Nanchang, it is necessary to strengthen social welfare construction and improve people’s well-being [60]. For cities such as Guiyang that lack strong economic support, it is necessary to use a guiding role to provide cities with corresponding policies and resource preferences. For resource-oriented cities similar to Datong, it is still necessary to actively explore advantageous industries, to quickly eliminate backward industries, to promote the transformation of the economy to tertiary industry and low-consumption industries, and realize the efficient use of urban resources. At the same time, in response to the problem of environmental damage in development, the government should strengthen environmental management and improve residents’ awareness of environmental protection [14].

6. Conclusions

The research contents of this paper include: construction of a healthy city evaluation index system; index data processing and evaluation model construction; and a long-term series of typical urban health evaluation and comparative research. By referring to the index system of domestic and foreign government agencies and to literature research, this paper constructs healthy city evaluation indicators that take into account the five aspects of environment, economy, population, service and space; Beijing (policy-oriented city), Shanghai (economy-oriented city), Nanchang (industry-oriented city), Guiyang (tourism-oriented city), Datong (resource-oriented city) are five cities for which, using the EAP method to analyze the years from 2014 to 2018, a healthy city construction level was calculated in terms of environment, economy, population, service, space and overall status. The results of the study found that, in general, the construction of healthy cities in China currently has the characteristics of large year-to-year fluctuations and significant differences between cities. The construction and development of healthy cities are also closely related to factors such as urban economic strength, social welfare, and policy support. The main conclusions of this paper are as follows: (1) On the basis of the existing healthy city evaluation index model, this paper combines the sustainable development theory and the existing process of China’s sustainable development index construction, and constructs a model of a healthy city from the five levels of a city’s environment, economy, population, service and space, in order to evaluate the current situation of healthy city construction more comprehensively. On the basis of the constructed evaluation index system, a healthy city evaluation index model is built by using the EAP method, typical cities are selected for analysis, and a relatively accurate healthy city evaluation result is obtained. (2) Through the empirical analysis of the health level of typical cities from 2014 to 2018, it can be found that, in general, the construction of healthy cities in China currently has the characteristics of large fluctuations in years and significant differences between cities. In addition, the health scores of selected typical cities show that healthy city construction of policy-oriented cities and economy-oriented cities is significantly higher than that of industry-oriented cities, tourism-oriented cities, and resource-oriented cities. (3) The construction and development of a healthy city are closely related to factors such as the city’s economic strength, social welfare, and policy support.
In summary, as an objective method, the EAP method avoids the influence of subjective factors on the evaluation of healthy cities, and displays characteristics both of geometric imagery and algebraic numerical evaluation, which can easily reflect the general trend in urban health construction and the development status of each dimension. However, at the same time, it only analyzes the current situation of healthy city construction in terms of data indicators, ignoring the influence of objective laws among other factors, and still has corresponding shortcomings in the evaluation of cities. Therefore, the selection of multiple evaluation methods and the combination of subjective and objective construction of evaluation models must still be the focus of future research.

Author Contributions

Z.L.: Formal analysis, Investigation, Methodology, Software, Writing—Original Draft, Visualization. H.G.: Conceptualization, Supervision. L.Z.: Conceptualization, Writing—Review & Editing, Project administration, Validation. D.L.: Writing-Review & Editing. All authors have read and agreed to the published version of the manuscript.

Funding

This research was funded by the National Natural Science Foundation of China, grant number 41876226; Chinese Academy of Sciences Strategic Priority Research Program of the Big Earth Data Science Engineering Program (CASEarth), grant numbers XDA19090000, XDA19030000; Capacity Building Project of Big Earth Data Science Data Center of the Chinese Academy of Sciences, grant number WX145XQ07-13.

Institutional Review Board Statement

Not applicable.

Informed Consent Statement

Not applicable.

Data Availability Statement

Restrictions apply to the availability of these data. The statistical data used in this study is provided by CNKI (https://data.cnki.net/Yearbook/Navi?type=type&code=A, accessed on 13 April 2021). The road information data used in this study is provided by the National Basic Geographic Information Center (https://www.webmap.cn/commres.do?method=result25W, accessed on 13 April 2021). The land use data used in this study is provided by the the Institute of Geographical Sciences and the Institute of Natural Resources Research, Chinese Academy of Sciences (https://www.resdc.cn/, accessed on 13 April 2021). The air quality data used in this study is provided by the China Air Quality Online Monitoring and Analysis Platform (https://www.aqistudy.cn/historydata/, accessed on 13 April 2021).

Acknowledgments

The authors thank the Data Center for Resources and Environment Science of the Chinese Academy of Sciences, the National Basic Geographic Information Center and the China Air Quality Online Monitoring and Analysis Platform for their data support.

Conflicts of Interest

The authors declare no conflict of interest.

References

  1. Barton, H.; Grant, M.; Mitcham, C.; Tsourou, C. Healthy urban planning in European cities. Health Promot. Int. 2009, 24, i91–i99. [Google Scholar] [CrossRef] [PubMed]
  2. World Health Organization. Basic Documents, 49th ed.; World Health Organization: Geneva, Switzerland, 2020. [Google Scholar]
  3. World Health Organization. Sustainable Development Goals. Available online: https://www.un.org/sustainabledevelopment/zh/ (accessed on 30 October 2020).
  4. National Health and Family Planning Commission of the People’s Republic of China. Guiding opinions on developing healthy cities and healthy villages and towns. Chin. Pract. J. Rural Dr. 2016, 23, 4–7. (In Chinese) [Google Scholar]
  5. Zhou, X. Experience and Practices Around Europe: Briefly on the Development Threads of Healthy City Project and Its Basic Rules. Int. City Plan. 2007, 22, 65–70. (In Chinese) [Google Scholar]
  6. Xia, L. Study on Healthy City Evaluation Index System. Master’s Thesis, Chongqing University, Chongqing, China, 2019. [Google Scholar]
  7. Ten standards for a healthy city. China’s Health Leg. Syst. 1996, 4, 11. (In Chinese)
  8. Remington, P.L.; Catlin, B.B.; Gennuso, K.P. The County Health Rankings: Rationale and methods. Popul. Health Metr. 2015, 13, 11. [Google Scholar] [CrossRef] [PubMed] [Green Version]
  9. Scientific Evaluation Criteria for Livable Cities. Environmental Protection; China Urban Science Research Association: Beijing, China, 2007. (In Chinese) [Google Scholar]
  10. National Patriotic Health Campaign Committee. National Healthy City Evaluation Index System (2018 Edition); National Patriotic Health Campaign Committee: Beijing, China, 2018. (In Chinese) [Google Scholar]
  11. Shanghai Health Promotion Committee. Three-Year Action Plan for Building a Healthy City in Shanghai (2018–2020); Shanghai Health Promotion Committee: Shanghai, China, 2018. (In Chinese) [Google Scholar]
  12. Xie, J. The Study on the Indicator System of Healthy City in Suzhou. Master’s Thesis, Suzhou University, Suzhou, China, 2005. (In Chinese). [Google Scholar]
  13. Du, W. On the Construction and Application of Assessment System of Healthy Urban Construction. The Example of Minhou County. Ph.D. Thesis, Fujian Agriculture and Forestry University, Fuzhou, China, 2012. (In Chinese). [Google Scholar]
  14. Liu, W. Evaluation and Countermeasures of urban health in Gansu Province. Master’s Thesis, Northwest Normal University, Lanzhou, China, 2020. (In Chinese). [Google Scholar]
  15. Zhang, L.; Wang, G. Comparision of Economy Development for Eastern Three Metropolitan in China. Urban Stud. 2012, 19, 1–6. (In Chinese) [Google Scholar]
  16. Ma, Z. Metropolis and Administrative Region: Theory, Experience and Field Study—Taking Shanghai Metropolis as an Example. Ph.D. Thesis, East China Normal University, Shanghai, China, 2004. (In Chinese). [Google Scholar]
  17. Research Group of the Macroeconomic Research Institute of the State Planning Commission. Definition and classification of re-source-based cities in my country. Macroecon. Res. 2002, 11, 37–39. [Google Scholar]
  18. National Bureau of Statistics of China. China City Statistical Yearbook; National Bureau of Statistics of China: Beijing, China, 2015.
  19. National Bureau of Statistics of China. China City Statistical Yearbook; National Bureau of Statistics of China: Beijing, China, 2016.
  20. National Bureau of Statistics of China. China City Statistical Yearbook; National Bureau of Statistics of China: Beijing, China, 2017.
  21. National Bureau of Statistics of China. China City Statistical Yearbook; National Bureau of Statistics of China: Beijing, China, 2018.
  22. National Bureau of Statistics of China. China City Statistical Yearbook; National Bureau of Statistics of China: Beijing, China, 2019.
  23. Ministry of Health. China Health Statistics Yearbook; Ministry of Health: Beijing, China, 2015.
  24. Ministry of Health. China Health Statistics Yearbook; Ministry of Health: Beijing, China, 2016.
  25. Ministry of Health. China Health Statistics Yearbook; Ministry of Health: Beijing, China, 2017.
  26. Ministry of Health. China Health Statistics Yearbook; Ministry of Health: Beijing, China, 2018.
  27. Ministry of Health. China Health Statistics Yearbook; Ministry of Health: Beijing, China, 2019.
  28. Beijing Municipal Bureau of Statistics. Beijing Statistical Yearbook; Beijing Municipal Bureau of Statistics: Beijing, China, 2015.
  29. Beijing Municipal Bureau of Statistics. Beijing Statistical Yearbook; Beijing Municipal Bureau of Statistics: Beijing, China, 2016.
  30. Beijing Municipal Bureau of Statistics. Beijing Statistical Yearbook; Beijing Municipal Bureau of Statistics: Beijing, China, 2017.
  31. Beijing Municipal Bureau of Statistics. Beijing Statistical Yearbook; Beijing Municipal Bureau of Statistics: Beijing, China, 2018.
  32. Beijing Municipal Bureau of Statistics. Beijing Statistical Yearbook; Beijing Municipal Bureau of Statistics: Beijing, China, 2019.
  33. Shanghai Municipal People’s Government. Shanghai Statistical Yearbook; Shanghai Municipal People’s Government: Shanghai, China, 2015.
  34. Shanghai Municipal People’s Government. Shanghai Statistical Yearbook; Shanghai Municipal People’s Government: Shanghai, China, 2016.
  35. Shanghai Municipal People’s Government. Shanghai Statistical Yearbook; Shanghai Municipal People’s Government: Shanghai, China, 2017.
  36. Shanghai Municipal People’s Government. Shanghai Statistical Yearbook; Shanghai Municipal People’s Government: Shanghai, China, 2018.
  37. Shanghai Municipal People’s Government. Shanghai Statistical Yearbook; Shanghai Municipal People’s Government: Shanghai, China, 2019.
  38. Guizhou Provincial Bureau of Statistics. Guizhou Statistical Yearbook; Guizhou Provincial Bureau of Statistics: Guiyang, China, 2015.
  39. Guizhou Provincial Bureau of Statistics. Guizhou Statistical Yearbook; Guizhou Provincial Bureau of Statistics: Guiyang, China, 2016.
  40. Guizhou Provincial Bureau of Statistics. Guizhou Statistical Yearbook; Guizhou Provincial Bureau of Statistics: Guiyang, China, 2017.
  41. Guizhou Provincial Bureau of Statistics. Guizhou Statistical Yearbook; Guizhou Provincial Bureau of Statistics: Guiyang, China, 2018.
  42. Guizhou Provincial Bureau of Statistics. Guizhou Statistical Yearbook; Guizhou Provincial Bureau of Statistics: Guiyang, China, 2019.
  43. Shaanxi Provincial Bureau of Statistics. Shaanxi Statistical Yearbook; Shaanxi Provincial Bureau of Statistics: Xi’an, China, 2015.
  44. Shaanxi Provincial Bureau of Statistics. Shaanxi Statistical Yearbook; Shaanxi Provincial Bureau of Statistics: Xi’an, China, 2016.
  45. Shaanxi Provincial Bureau of Statistics. Shaanxi Statistical Yearbook; Shaanxi Provincial Bureau of Statistics: Xi’an, China, 2017.
  46. Shaanxi Provincial Bureau of Statistics. Shaanxi Statistical Yearbook; Shaanxi Provincial Bureau of Statistics: Xi’an, China, 2018.
  47. Shaanxi Provincial Bureau of Statistics. Shaanxi Statistical Yearbook; Shaanxi Provincial Bureau of Statistics: Xi’an, China, 2019.
  48. Jiangxi Provincial Bureau of Statistics. Jiangxi Statistical Yearbook; Jiangxi Provincial Bureau of Statistics: Nanchang, China, 2015.
  49. Jiangxi Provincial Bureau of Statistics. Jiangxi Statistical Yearbook; Jiangxi Provincial Bureau of Statistics: Nanchang, China, 2016.
  50. Jiangxi Provincial Bureau of Statistics. Jiangxi Statistical Yearbook; Jiangxi Provincial Bureau of Statistics: Nanchang, China, 2017.
  51. Jiangxi Provincial Bureau of Statistics. Jiangxi Statistical Yearbook; Jiangxi Provincial Bureau of Statistics: Nanchang, China, 2018.
  52. Jiangxi Provincial Bureau of Statistics. Jiangxi Statistical Yearbook; Jiangxi Provincial Bureau of Statistics: Nanchang, China, 2019.
  53. Institute of Geographical Sciences and Natural Resources Research, Chinese Academy of Sciences. Resource and Environmental Science Data Center of Chinese Academy of Sciences. Available online: https://www.resdc.cn/ (accessed on 11 March 2021).
  54. National Basic Geographic Information Center. 1:250,000 National Basic Geographical Database. Available online: https://www.webmap.cn/commres.do?method=result25W (accessed on 11 March 2021).
  55. China Air Quality Online Monitoring and Analysis Platform. Air Quality Historical Data Query. Available online: https://www.aqistudy.cn/historydata/ (accessed on 11 March 2021).
  56. Li, X.; Shi, X.; Wang, C.; Yang, J.; Ouyang, Z. Evaluation and management for eco-city construction indicator system in Yantai. Ecol. Sci. 2012, 31, 206–213. (In Chinese) [Google Scholar]
  57. Lu, M. GIS Supporting for Urban Agglomeration Health Monitoring Index Research and Application Demonstration. Master’s Thesis, Liaoning University of Engineering and Technology, Jinzhou, China, 2017. (In Chinese). [Google Scholar]
  58. He, Q. Research on Government Purchasing Public Service. Ph.D. Thesis, Institute of Fiscal Science, Beijing, China, 2014. (In Chinese). [Google Scholar]
  59. Fang, W. Study on the Calculation of Healthy City Index and Its Influencing Factors. Master’s Thesis, China University of Mining and Technology, Xuzhou, China, 2019. (In Chinese). [Google Scholar]
  60. Liu, Y. The Research about Evaluation Index System of Healthy Cities in Xinjiang. Master’s Thesis, Xinjiang University, Urumqi, China, 2012. (In Chinese). [Google Scholar]
  61. Wu, Q.; Wang, R.; Li, H.; Xu, X. The indices and the evaluation method of eco-city. Acta Ecol. Sin. 2005, 25, 2090–2095. (In Chinese) [Google Scholar]
  62. Environmental Planning Institute, Ministry of Ecology and Environment; World Wildlife Fund. China SDGS Indicator Construction and Progress Evaluation Report: 2018; Chinese Academy of Environmental Planning: Beijing, China; World Wide Fund for Nature: Gran, Switzerland, 2018. (In Chinese) [Google Scholar]
  63. Jin, Y. Study on the Multi-function Intension and Coordination Typical Model of Farmland. Master’s Thesis, Huazhong Agricultural University, Wuhan, China, 2019. (In Chinese). [Google Scholar]
  64. Weng, L.; Zhang, C.; Li, W. Assessment of Eco-City Based on Entire-Array-Polygon Evaluation Method—A Case Study of Shanghai City. Earth Environ. 2017, 45, 356–362. (In Chinese) [Google Scholar]
  65. Cheng, L.; Dong, J. Evaluation on Intensive Land Use of Wuhan Metropolitan Agglomeration Based on Entire-Array-Polygon Evalution Model. In Proceedings of the Second International Conference on Agro-Geoinformatics (Agro-geoinformatics 2013), Fairfax, VA, USA, 12–16 August 2013; p. 6. (In Chinese). [Google Scholar]
  66. Liu, Y. Assessment of Urban Ecosystem Health of Kunming Based on DPSIR Model. Master’s Thesis, Yunnan University, Kunming, China, 2018. (In Chinese). [Google Scholar]
  67. Zhang, L.; Zheng, X.; Cai, Y.; Lyu, Y. Assessment on Multi-functionality of Land Use Based on the Entire-Array-Polygon Indictor Method in Hu’nan Provice. Res. Soil Water Conserv. 2016, 23, 298–303. (In Chinese) [Google Scholar]
  68. Li, Y. Research on Land Location Based on Full Arrangement Polygon Graphic Index Method-A Case Study of Hunan Province. Master’s Thesis, Hunan Agricultural University, Changsha, China, 2018. (In Chinese). [Google Scholar]
  69. Ministry of Ecology and Environment of the People’s Republic of China. 2014 Annual Report on the Prevention and Control of Environmental Pollution by Solid Waste in Large and Medium-Sized Cities in China. 2015. Available online: https://www.mee.gov.cn/hjzl/sthjzk/gtfwwrfz/201912/P020191220697793463589.pdf (accessed on 13 April 2021). (In Chinese)
  70. Shao, Y. Study on the Formulation of the “Thirteenth Five-Year” Plan for Environmental Protection and Ecological Construction in Shanghai; Shanghai Institute of Environmental Sciences: Shanghai, China, 2017. [Google Scholar]
  71. Wang, X. Urbanization Path and City Scale in China: An Economic Analysis. Econ. Res. 2010, 45, 20–32. (In Chinese) [Google Scholar]
Figure 1. Schematic diagram of the geographical location of the study area.
Sustainability 14 02519 g001
Figure 2. Health scores of cities from 2014 to 2018: (a) Beijing; (b) Shanghai; (c) Nanchang; (d) Guiyang; (e) Datong.
Sustainability 14 02519 g002
Figure 3. Scores for environment indicators in each city from 2014 to 2018: (a) Environment score; (b) The scores of environment score in each city.
Sustainability 14 02519 g003
Figure 4. Scores for economic indicators in each city from 2014 to 2018: (a) Economic score; (b) The scores of economic score in each city.
Sustainability 14 02519 g004
Figure 5. The scores of service indicators in each city from 2014 to 2018: (a) Service score; (b) The scores of service score in each city.
Sustainability 14 02519 g005
Figure 6. Scores for population indicators in each city from 2014 to 2018: (a) Population score; (b) The scores of population score in each city.
Sustainability 14 02519 g006
Figure 7. Scores for space indicators in each city from 2014 to 2018: (a) Space score; (b) The scores of space in each city.
Sustainability 14 02519 g007
Figure 8. Healthy city construction scores and restrictive factors in each city in 2018.
Sustainability 14 02519 g008
Table 1. Data sources for each indicator.
First Level IndicatorNumberSecond Level IndicatorData SourcesTemporal Interval
EnvironmentEN-1Ratio of days with good air qualityChina Air Quality Online Monitoring and Analysis Platform2014–2018
EN-2Average value of regional
environmental noise
China City Statistical Yearbook2015–2019
EN-3Domestic Garbage Harmless
Treatment rate
China City Statistical Yearbook2015–2019
EN-4Comprehensive utilization rate of general industrial solid wasteChina City Statistical Yearbook2015–2019
EN-5PM2.5China Air Quality Online Monitoring and Analysis Platform2014–2018
EN-6Forest cover rateChinese Academy of Sciences Resource Environmental Science and Data
Center
2015, 2018
EN-7Percentage of water areaChinese Academy of Sciences Resource Environmental Science and Data
Center
2015, 2018
EconomicEC-1Percentage of secondary industry in GDPChina City Statistical Yearbook2015–2019
EC-2Ratio of tertiary industry to GDPChina City Statistical Yearbook2015–2019
EC-3Resident income and expenditure ratioStatistical Yearbooks of Provinces and Cities2015–2019
EC-4GDP per capitaChina City Statistical Yearbook2015–2019
EC-5Per capita investment in fixed
assets
Statistical Yearbooks of Provinces and Cities2015–2019
EC-6Total retail sales of consumer goods per capitaStatistical Yearbooks of Provinces and Cities2015–2019
ServiceSE-1Resident Internet penetration rateStatistical Report on the Development of China’s Internet2015–2019
SE-2Number of doctors per 10,000
people
China City Statistical Yearbook2015–2019
SE-3Number of hospital beds per 10,000 peopleChina City Statistical Yearbook2015–2019
SE-4Public transportation vehicles per 10,000 peopleChina City Statistical Yearbook2015–2019
SE-5The amount of library books per 10,000 peopleChina City Statistical Yearbook2015–2019
PopulationPO-1Average life expectancy of the populationChina Health Statistics Yearbook2010
PO-2Infant mortalityChina Health Statistics Yearbook2015–2019
PO-3Maternal mortalityChina Health Statistics Yearbook2015–2019
PO-4Incidence of Class A and B
Infectious Diseases
China Health Statistics Yearbook2015–2019
SpaceSP-1Railway densityNational Geographic Resource
Directory Service System
2015
SP-2Urban road area per capitaChina City Statistical Yearbook2015–2019
SP-3The population densityStatistical Yearbooks of Provinces and Cities2015–2019
Table 2. Indicator calculation formula.
First Level IndicatorNumberSecond Level IndicatorCalculation Formula
EnvironmentEN-6Forest cover rateForest land area/total land area
EN-7Percentage of water areaWater area/total land area
EconomicEC-3Resident income and
expenditure ratio
Per capita disposable income of urban and rural residents/per capita consumption expenditure
EC-5Per capita investment in fixed assetsFixed asset investment/population
EC-6Total retail sales of
consumer goods per capita
Total retail sales of consumer goods/population
ServiceSE-2Number of doctors per 10,000 peopleNumber of practicing (assistant) physicians/population
SE-3Number of hospital beds per 10,000 peopleNumber of hospital beds/population
SE-4Public transportation
vehicles per 10,000 people
The actual number of public bus (tram) operating vehicles/population at the end of the year
SE-5The amount of library books per 10,000 peoplePublic library collections/population
SpaceSP-1Railway densityRailway length/land area
SP-2Urban road area per capitaCity road length/population
Table 3. Healthy City Evaluation Index System.
First Level IndicatorNumberSecond Level IndicatorDescriptor
EnvironmentEN-1Ratio of days with good air qualityRefers to the ratio of the number of days with good air quality to the total number of days in a year
EN-2Average value of regional environmental noiseRefers to the arithmetical; mean value of the equivalent sound level from certified environmental noise grid
monitoring in the urban built-up area
EN-3Domestic Garbage Harmless Treatment rateRefers to the ratio of harmlessly treated household
garbage to domestic garbage output
EN-4Comprehensive utilization rate of general industrial solid wasteRefers to the percentage ratio of general industrial solid waste, comprehensively utilized, to the sum of the
production amount of general solid waste and previous storage capacity
EN-5PM2.5Refers to the monitoring of the concentration of dust or fly dust in the ambient air with an air equivalent diameter of less than or equal to 2.5 μm.
EN-6Forest cover rateRefers to the ratio of forest area to total land area
EN-7Percentage of water areaRefers to the percentage of the total area of a city that is covered by various flowing or impactful water surfaces such as rivers, lakes, ponds, weirs, and reservoirs.
EconomicEC-1Percentage of secondary industry in GDPRefers to the ratio of GDP created by secondary industry to the city’s total GDP
EC-2Ratio of tertiary industry to GDPRefers to the ratio of GDP created by tertiary industry to the city’s total GDP
EC-3Resident income and expenditure ratioRefers to the ratio of residents’ average income to
residents’ average expenditure
EC-4GDP per capitaCalculation of the city’s GDP realized during the
accounting period (usually one year) regarding the city’s permanent population (or registered population) to obtain the per capita GDP
EC-5Per capita investment in fixed assetsCalculation of the amount of investment in fixed assets
realized in a city during the accounting period (usually one year) regarding the permanent population (or
registered population) of the city to obtain the amount of investment in fixed assets per capita
EC-6Total retail sales of consumer goods per capitaCalculation of the total retail sales of consumer goods
realized in a city during the accounting period (usually one year) regarding the city’s permanent population (or registered population) to obtain the total retail sales of consumer goods per capita
ServiceSE-1Resident Internet penetration rateRefers to the ratio of the number of Internet users in the city to the total permanent population of the city
SE-2Number of doctors per 10,000 peopleRefers to the number of medical staff per 10,000
permanent residents of the city
SE-3Number of hospital beds per 10,000 peopleRefers to the number of hospital beds per 10,000
permanent residents of the city
SE-4Public transportation vehicles per 10,000 peopleRefers to the amount of public transportation utilized by every 10,000 permanent residents of the city
SE-5The amount of library books per 10,000 peopleRefers to the number of library collections per 10,000
permanent residents of the city
PopulationPO-1Average life expectancy of the populationRefers to the average number of years that people born in the same period can expect to survive if the current age-specific mortality rate remains unchanged.
PO-2Infant mortalityRefers to the ratio of the number of infants who died under one year of age to the number of births.
PO-3Maternal mortalityThe maternal mortality rate is per 10,000 live births or the number of maternal deaths per 100,000 live births.
PO-4Incidence of Class A and B Infectious DiseasesRefers to the number of statutory reported incidents of infectious diseases of Class A and B per 100,000 population in a certain area in a certain year
SpaceSP-1Railway densityRefers to the proportional relationship between railway operating mileage and urban land area
SP-2Urban road area per capitaCalculation of the road area of a city regarding permanent population (or registered population) of the city to obtain the total retail sales of consumer goods per capita
SP-3The population densityThe number of people per unit of land area.
Table 4. Healthy Cities Score Classification.
Indicator ScoreEvaluation
>0.90Strong level of development
0.80–0.90Stronger level of development
0.60–0.79Develop basic health
0.30–0.59Weaker level of development
<0.30Weak level of development
Publisher’s Note: MDPI stays neutral with regard to jurisdictional claims in published maps and institutional affiliations.

