
Accessing the Impact of Floating Houses on Water Quality in Tonle Sap Lake, Cambodia
by
 , and
, and
May Phue Wai
1,2, 
Vibol Chem
1,2,
Khy Eam Eang
2,3,
Rattana Chhin
2,3,
Sokly Siev
4 and
Rina Heu
2,3,* 1
Graduate School of Water and Environmental Engineering, Institute of Technology of Cambodia, Russian Federation Blvd., Phnom Penh 12156, Cambodia
2
Faculty of Hydrology and Water Resources Engineering, Institute of Technology of Cambodia, Russian Federation Blvd., P.O. Box 86, Phnom Penh 12156, Cambodia
3
Water and Environmental Research Unit, Research and Innovation Center, Institute of Technology of Cambodia, Russian Federation Blvd., Phnom Penh 12156, Cambodia
4
General Department of Science, Technology & Innovation, Ministry of Industry, Science, Technology & Innovation, 45 Preah Norodom Boulevard, Sangkat Phsar They III, Khan Daun Penh, Phnom Penh 120203, Cambodia
*
Author to whom correspondence should be addressed.
Sustainability 2022, 14(5), 2747; https://0-doi-org.brum.beds.ac.uk/10.3390/su14052747
Submission received: 13 December 2021
/
Revised: 14 February 2022
/
Accepted: 16 February 2022
/
Published: 26 February 2022
(This article belongs to the Special Issue Water Quality: Current State and Future Trends)
Abstract
:The floating houses in Tonle Sap Lake might be one of the main factors for degradation of water quality since the people in floating houses discharge sewage and waste from their households into the lake. Therefore, the government of Cambodia has decided to move the floating houses in Chhnok Tru to the upland regions, and more than 90% of the floating houses in Chhnok Tru have already been moved in accordance with the government’s plan. However, the scientific information on water quality before and after moving the floating houses in Tonle Sap Lake is limited. Thus, this paper aimed to evaluate differences in basic water quality such as temperature, pH, dissolved oxygen (DO), oxidation–reduction potential (ORP), conductivity (Cond), and nitrate (NO3−) before and after the floating houses were moved and to reveal the relationships between the floating houses and basic water quality. The water quality parameters were measured at 18 sampling sites in Chhnok Tru using an EXO sensor and NO3− was analyzed by ion chromatography (IC). Statistical analyses such as t-tests, correlation analysis, principal component analysis (PCA), and structural equation modeling (SEM) were used. The results show that the water quality was better after moving the floating houses; however, some parts of the study area were still polluted. In addition, the percentage of floating house distribution was significantly correlated with the temperature and ORP in the study area during dry and wet seasons. The obtained results are useful for making management decisions to sustainably manage the water quality in the area.
1. Introduction
The ecosystems of the lakes, the health of the livelihoods of communities, and the impacts on the economy depend on the water quality of lakes [1,2]. When evaluating the sustainable development of a region, water quality is one of the most important factors to consider [3]. Given the importance of water quality, the assessment of water quality in lakes has become important [4,5,6].
Tonle Sap Lake (TSL), the largest freshwater lake in Southeast Asia, is critical for the socioeconomic conditions of Cambodian communities [7,8]. The area of the lake is approximately 2500 km2, with the depth of the lake less than 1 m during dry season. However, in the wet reason, the lake becomes about 15,000 km2, with a depth of 7–9 m [9]. There are six provinces and 1037 villages with approximately 1.7 million people in the area surrounding TSL. Among them, the water-based villages, called floating villages, are mainly in Chhnok Tru village. The communities in Chhnok Tru village use lake water in their daily activities, such as cooking, drinking, washing clothes, and bathing. As one of the most crowded floating villages, with 1960 floating houses, the disposal of waste from the community is one of the sources of the degradation of the water quality of the lake [3]. Eutrophication and algal blooms occur in TSL, mainly in the dry season. The phytoplankton include green algae (61%), cyanobacteria (35%), and few diatoms (4%) per the measurement from August 2003 to May 2004. In the dry season, nitrogen-fixing species Anabaena spp. and blue-green algae Microcystis dominate throughout the lake. However, diatoms, with the main species being Aulacoseria, dominate in the period of October–December, the wet season in the lake [9,10,11]. Besides, between 1998 and 2008, the dry season monthly average temperature of TSL increased by 0.03 °C/year [12]. The maximum water temperature increased 0.17 °C annually [13]. The surface water temperature of TSL follows the trend of local air temperature. Recent studies state that the recent warming of surface water temperature may be influenced by deforestation, agriculture development, dam development, and local climate in TSL. Water temperature in TSL is also correlated with water level fluctuations [13,14]. In addition, surface water temperature and precipitation are factors that regulate the fish species across the lake. Consequently, the recent warming of surface water temperature can impact the fish species in the lake [14].
The existence of floating houses has potential effects on water quality due to blocking sunlight and causing shadows, reducing the air–water interface area, influencing wind stress, and changing water flow and sedimentation [15,16]. These effects from floating houses can directly impact basic water quality, mainly temperature and dissolved oxygen [17]. There are 1960 floating houses, including the 1180 in the Khmer family and 780 in the Vietnamese family, in Chhnok Tru village. In 2020, approximately 96% of the floating houses had already been moved to upland areas [18]. However, scientific information on the differences in water quality before and after moving the floating houses is limited. In addition, the effect of the floating houses on water quality changes before and after moving the floating houses remains unknown. Therefore, this study aimed to evaluate the water quality after moving the floating houses in Chhnok Tru village by comparing them with the water quality before moving the floating houses in Chhnok Tru village in terms of both spatial and temporal variations. Specifically, evaluations of the significant differences of water quality among two conditions—before and after moving the floating houses—were studied. In addition, the relationships between the floating houses and water quality were also investigated.
2. Materials and Methods
2.1. Study Area
This study was conducted in Chhnok Tru floating village, TSL. The climate in the study area is characterized by wet and dry seasons. The long rainy season of the southwest monsoon lasts from May to October, and the dry season of the northeast monsoon lasts from November to April [19]. Water samples were collected at 18 sites in Chhnok Tru village in the dry and wet seasons under different conditions: before moving the floating houses and after moving the floating houses. Before moving the floating houses, sampling and water quality monitoring was performed on 7 June 2017 for the wet season. On the sampling day, the rainfall was 6.693 mm, and the minimum, average, and maximum air temperatures were 26.78 °C, 29.55 °C, and 32.50 °C, respectively. Sampling was performed again on 6 April 2018 for the dry season. The rainfall was 4.93 mm, and the minimum, average, and maximum air temperatures were 26.07 °C, 29.71 °C, and 34.37 °C on the sampling day, respectively. After moving the floating houses, sampling and water quality monitoring were carried out on 15 October 2020 for the wet season. On the sampling day, the rainfall was 6.696 mm and the minimum, average, and maximum air temperatures were 24.76 °C, 25.69 °C, and 27.83 °C, respectively. On 5 March 2020, sampling and water quality monitoring were performed for the dry season. The rainfall was 0 mm and the minimum, average, and maximum air temperatures were 26.19 °C, 30.01 °C, and 34.20 °C on the sampling day, respectively. Note that the rainfall data were based on the Integrated Multi-satellitE Retrievals for GPM (IMERG) [20], and the temperature data were based on the ERA5 reanalysis dataset [21].
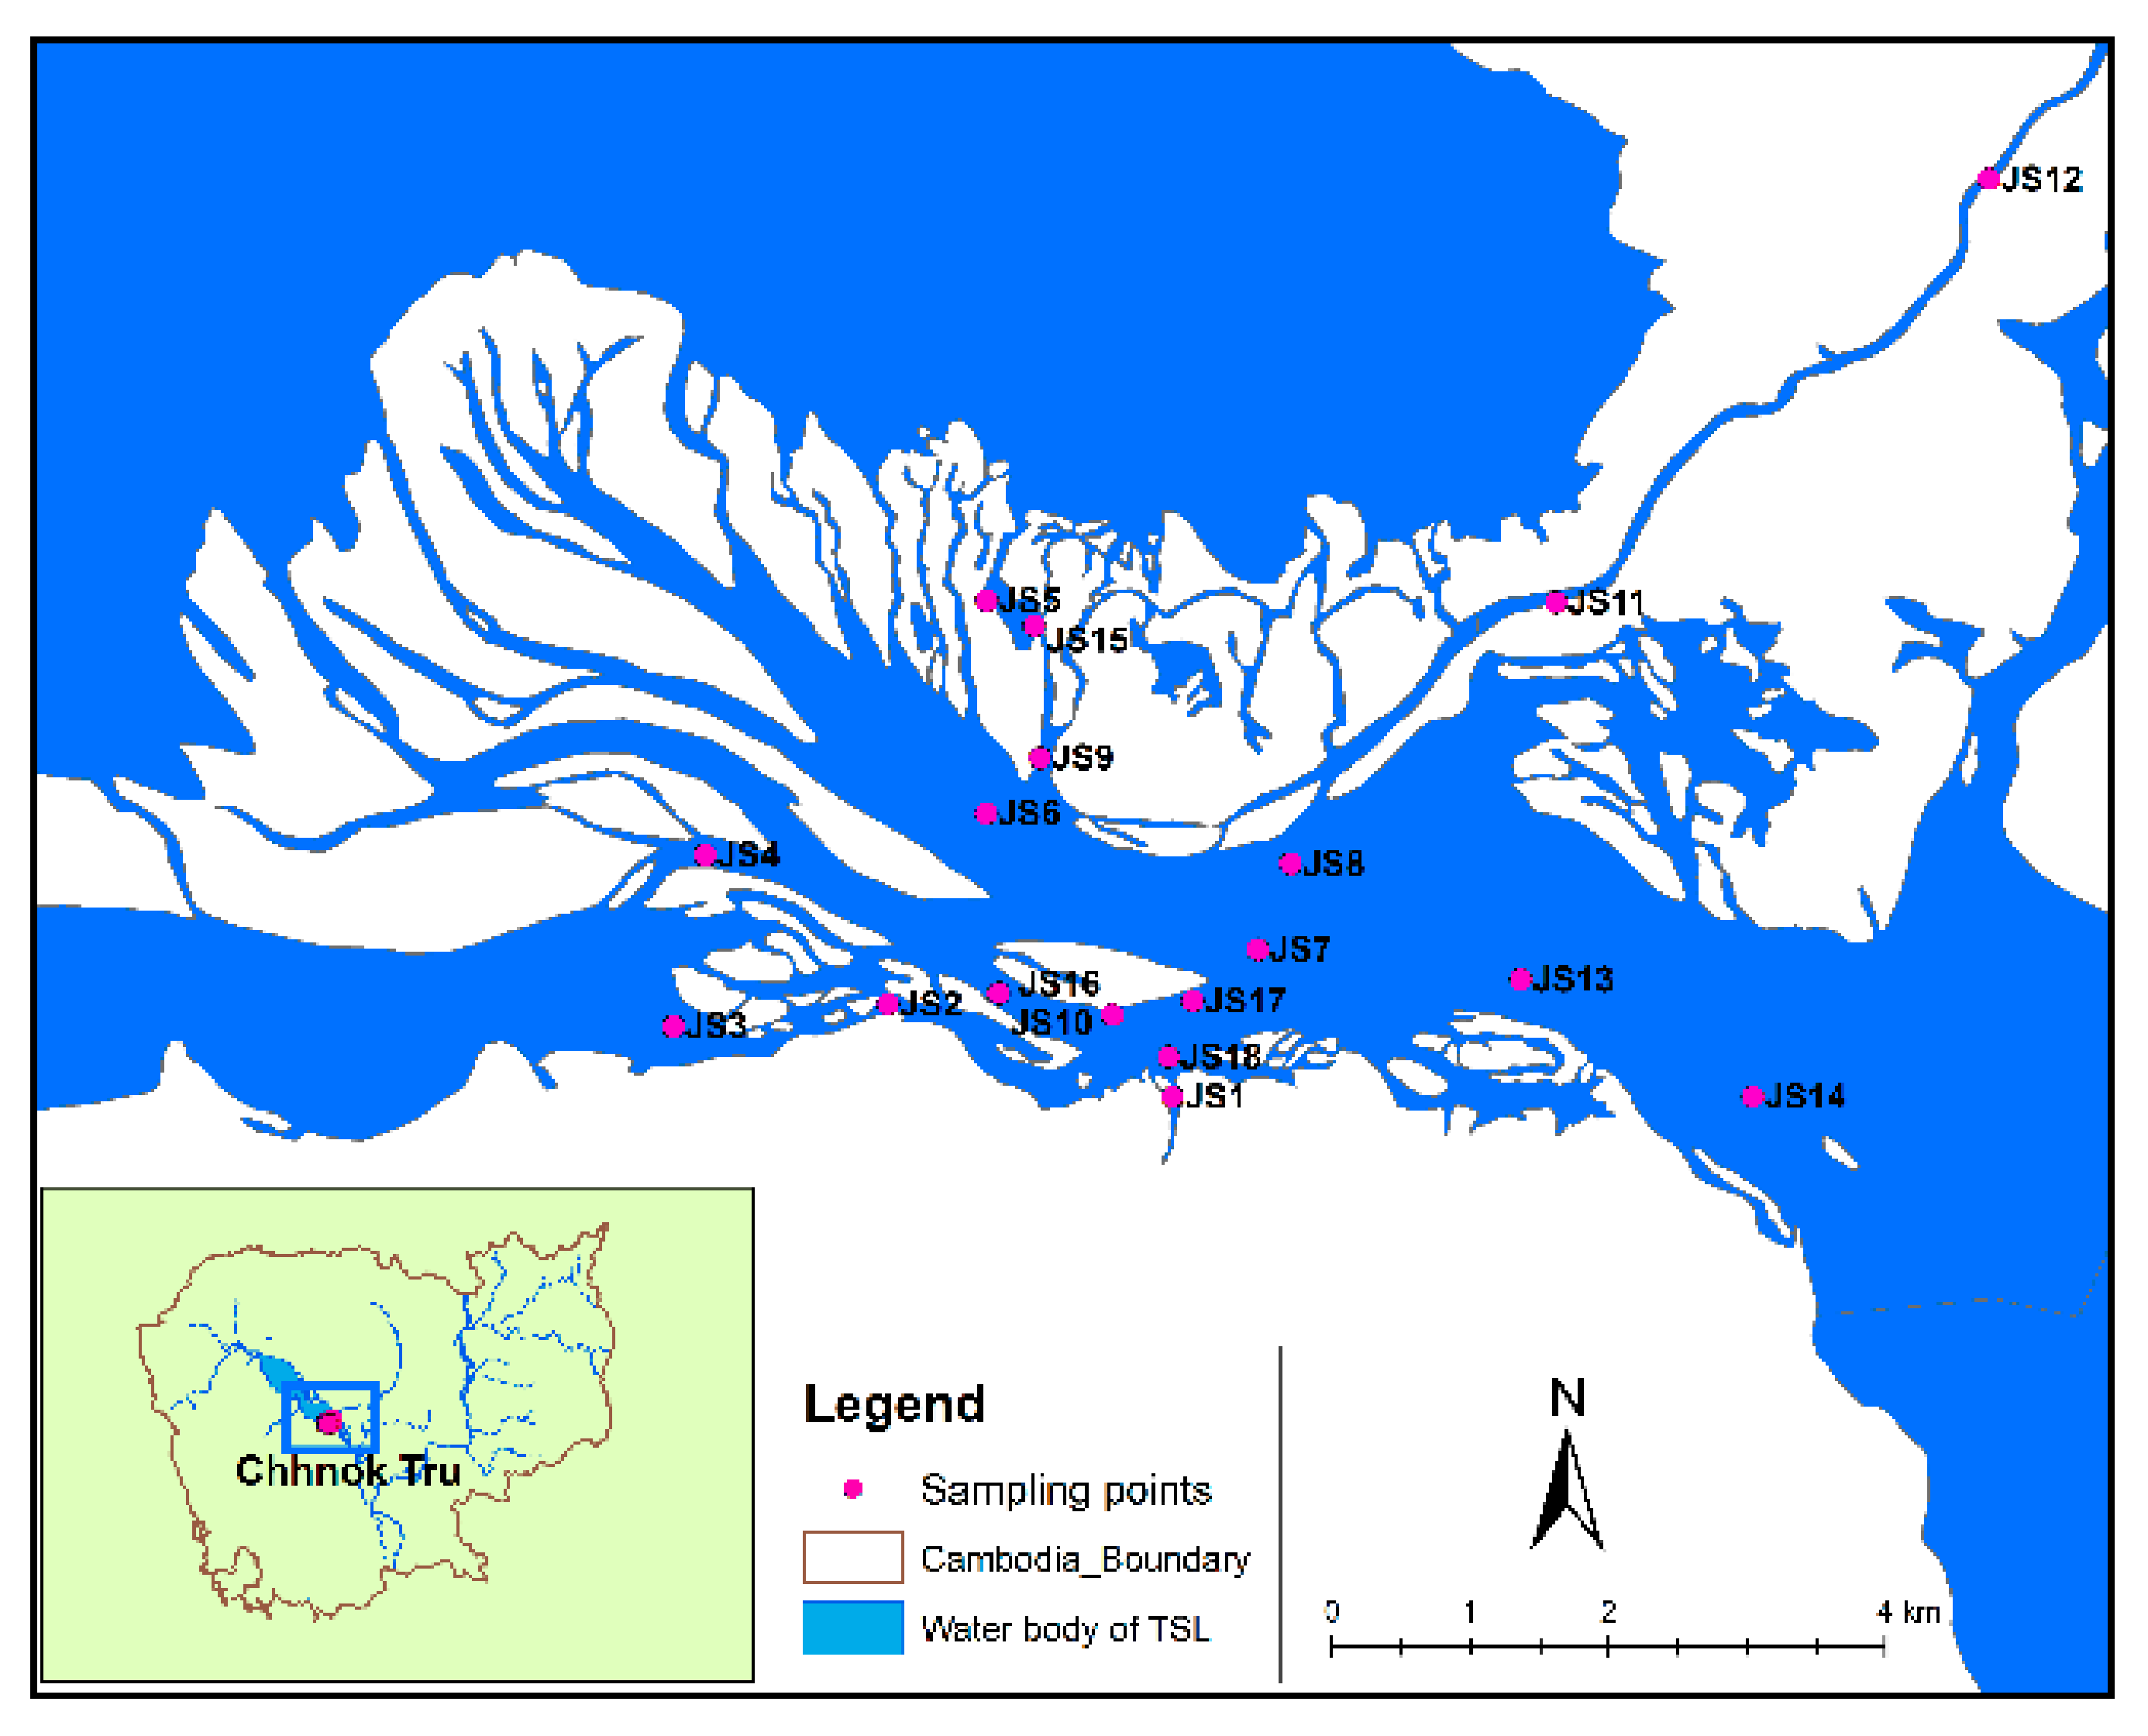
The sampling points were chosen to understand the overall water quality of Chhnok Tru village. In these sampling sites, JS1 is the location of floating area, whereas JS2, JS3, JS4, JS6, JS10, JS17, and JS19 are the locations of the river area; JS5, JS9, JS12, and JS15 are the wetland areas, and JS7, JS8, JS13, and JS14 are the areas of main river (Kramam River). JS6 is the area of the floating village and JS11 is the area of wetland along the Stung Sen River. The sample location map is shown in Figure 1. The specific expression of sampling locations and coordinates is shown in Table 1.
2.2. Water Quality Measurements
2.2.1. In-Situ Measurements
Water quality parameters such as temperature, pH, dissolved oxygen (DO), oxidation–reduction potential (ORP), and conductivity (Cond) were measured using Multi-Exo Sondes (YSI Incorporated, Yellow Springs, OH, USA) at a depth 0.1 m from the surface of the water. The Multi-EXO Sondes was set to 5 min and repeated at least 10 times for every measurement, and it was washed with sampled water before running to prevent contamination from one sample to another.
2.2.2. NO3− Analysis
NO3− was analyzed using ion chromatography (IC, LC-20AD sp, Shimazu Corporation, Kyoto, Japan) [22]. The raw samples were filtered using 0.45 µm Whatman® membrane filter paper (Global Life Sciences Solutions Operations UK Ltd., Little Chalfont, Buckinghamshire, UK). Filtrated samples were prepared in a 50 mL vial. The anion mobile phase was prepared using 8 mM p-hydroxybenzoic acid (C7H6O3), 3.2 mM Bis-Tris (C8H19NO5), and 50 mM boric acid (H3BO3). The anion column (Shim-pack IC-A3), flow rate (1.2 mL/min), column temperature (40 °C, pressure (6.4 M pa), detection wavelength (254 nm), detector (conductivity), and injection of sample volume (50 µL) were used as the analytical conditions of the NO3− measurement by IC.
2.3. Comparison of the Mean Values of Water Quality
A t-test was performed with the R program (4.0.3) to compare the mean values of water quality by testing for significant differences between the two different groups: before and after moving the floating houses.
2.4. Statistical Relationship of Water Quality
Pearson correlation analysis was used to check the statistical correlation between water quality parameters before and after moving the floating houses and to reveal differences in correlations before and after moving the floating houses. Before using correlation analysis, the Shapiro–Wilk normality test was used to check the normality of the data and after that, the data were transformed to log form and Pearson correlation analysis was performed with the R program (4.0.3).
2.5. Temporal Shifts in Water Quality Parameters
Principal component analysis was used to examine the temporal shifts in water quality parameters between two different conditions: before and after moving the floating houses. First, data were transformed to log form, and then PCA was performed by Origin 2019Pro.
2.6. Evaluation of Floating Houses’ Effects on Water Qualtiy
Structural equation modeling was performed to evaluate the effects of the floating houses on water quality using the lavaan package in the R program (4.0.3). Before moving the floating houses, 91% of the floating houses were considered, and 4% of the floating houses were considered to affect water quality based on the announcement by authorities. Moreover, we examined the statistical significance of the effect of the floating houses on water quality using the critical ratio (C.R).
2.7. Flow Chart
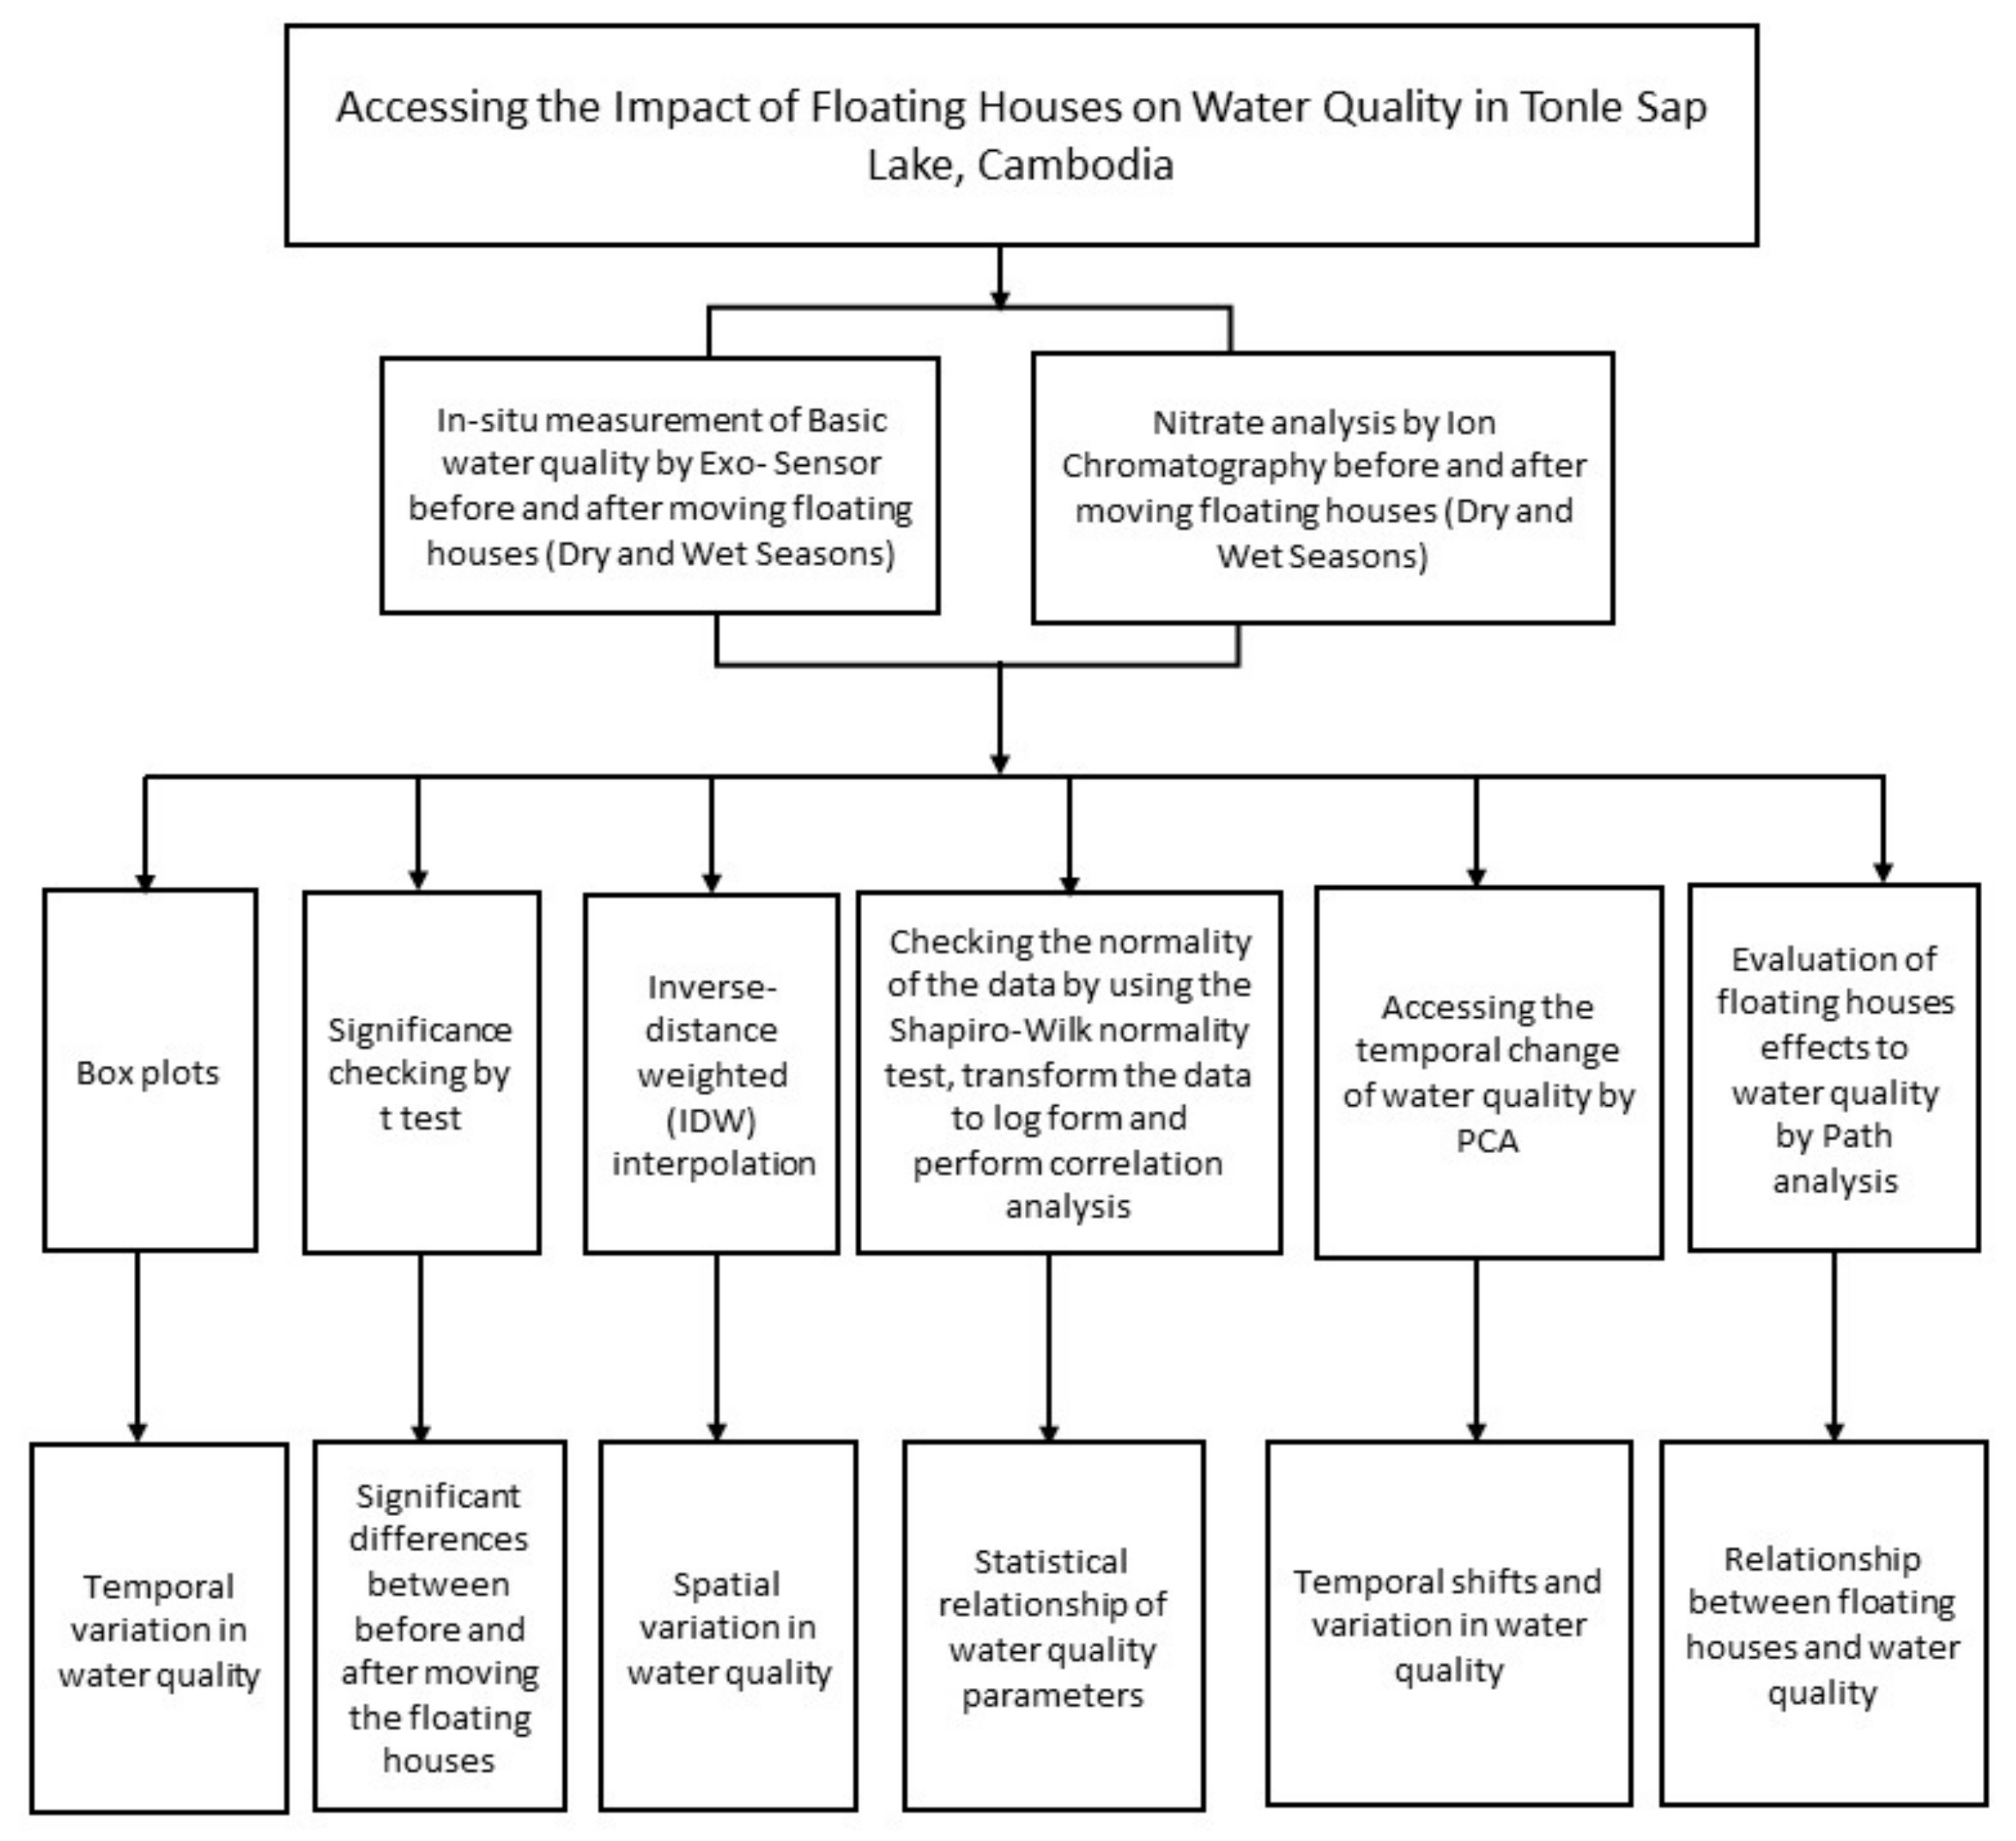
The study consisted of the two conditions, before and after moving the floating houses in both dry and wet seasons. This study was based on in-situ measurements, laboratory analysis, and statistical analysis. The methodology in this study is summarized in Figure 2.
3. Results and Discussion
3.1. Temporal Variation in Water Quality before and after Moving the Floaing Houses
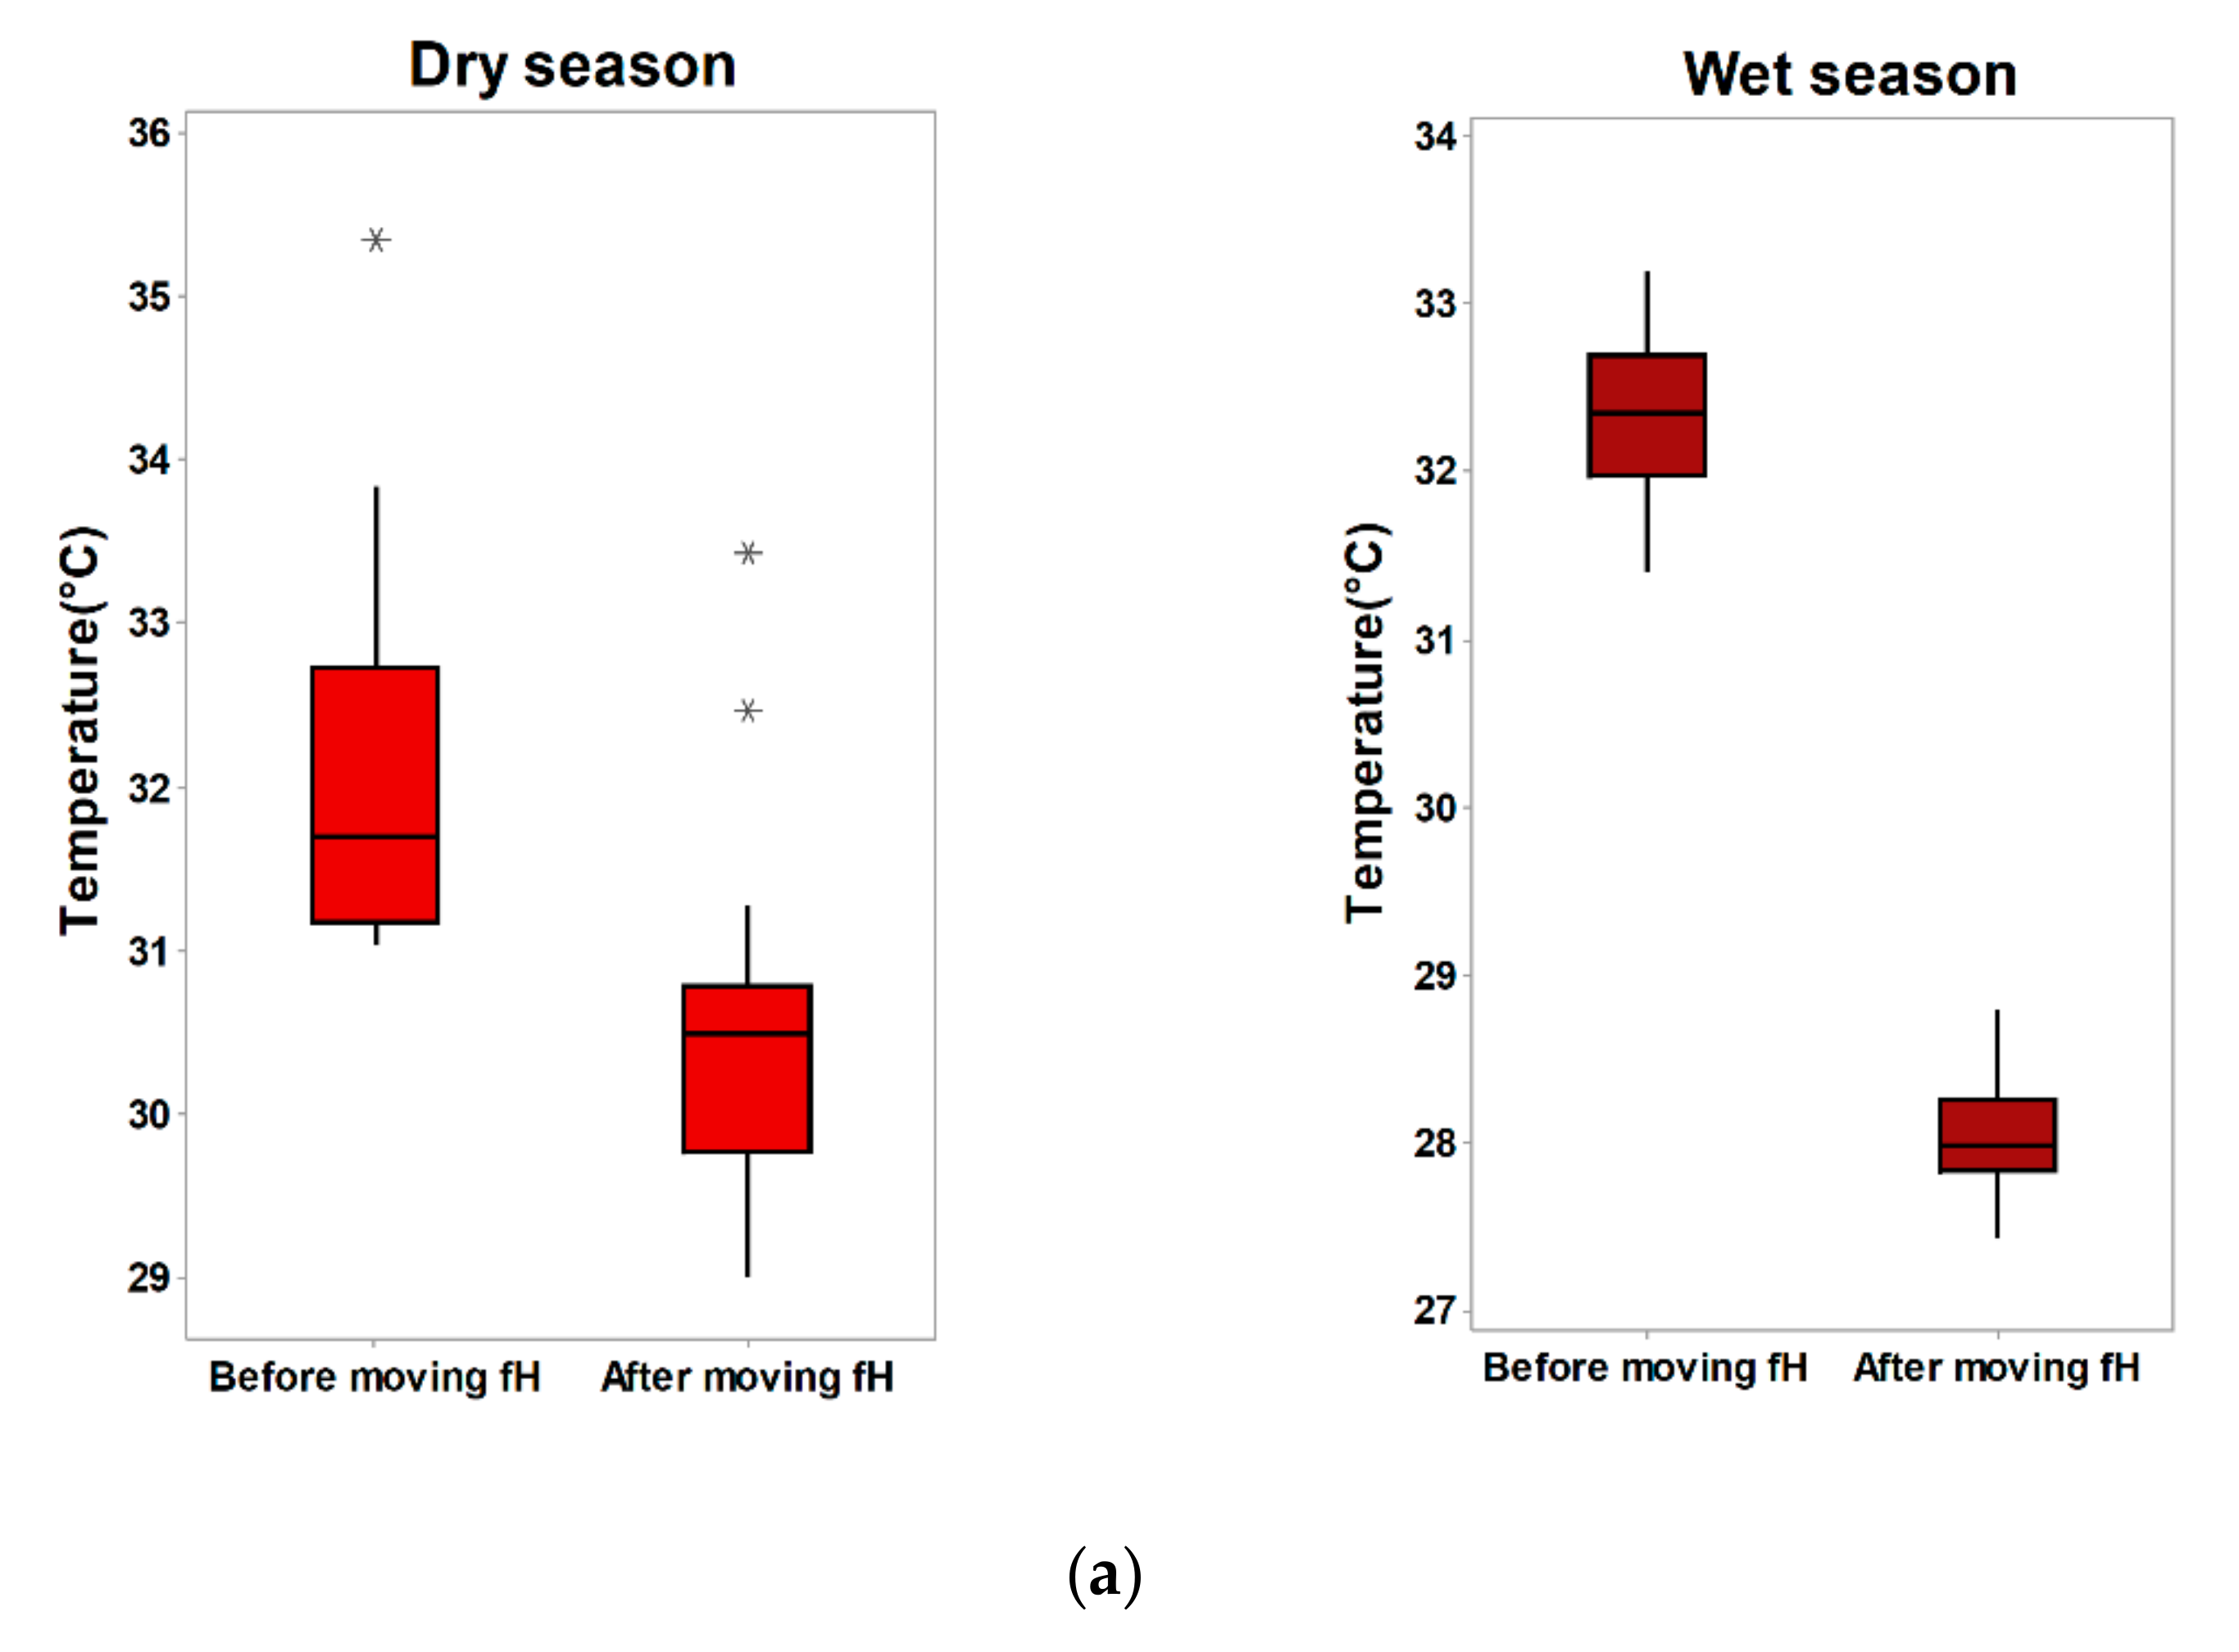
The temporal variations in water quality parameters such as pH, temperature, DO conductivity, and nitrate are shown by the box plots in Figure 3. According to the results of the box plots in Figure 3a, in the dry season, the temperature range before moving the floating houses was from 35.34 to 31.03 °C, with a mean value of 32.1 ± 1.16 °C, whereas after moving the floating houses, the temperature range was 33.44 to 29.01 °C, with a mean value of 30.5 ± 1.07 °C. Meanwhile, in the wet season, the temperature ranged from 33.2 °C to 31.4 °C, with a mean value of 32.34 ± 0.48 °C before moving the floating houses. After moving the floating houses, the temperature ranged from 28.8 °C to 27.43 °C, with a mean value of 28.04 ± 0.37 °C. The temperature significantly decreased after moving the floating houses (p < 0.05). The box plots show that the temperature trend before moving the floating houses in both the dry and the wet seasons was increasing. An increase in temperature leads to an increase in the reaction rate of chemicals in water, and dissolved oxygen decreases in water [23]. In warm water, the respiration rate of aquatic organisms increases, causing a higher consumption of oxygen; therefore, the growth of phytoplankton and bacteria doubles in the population as a result of macrophyte growth and algal blooms with the availability of nutrients [24]. Fifty-six genera of phytoplankton were identified in Tonle Sap Lake [25]. In the dry season, the nitrogen-fixing species Anabaena spp. and blue-green algae Microcystis dominated, whereas diatom species, mainly Aulacoseira granulate, dominated in the wet season. When comparing the box plots for the two conditions, it was revealed that the temperature significantly decreased after moving the floating houses. When there is a low temperature, the solubility of oxygen in water increases considerably [26]. Therefore, the temperature condition after moving the floating houses was favorable for oxygen solubility. Moreover, the increasing temperature can cause an increase in suspended solids [27]. The suspended solid concentration is strongly correlated with the turbidity of water [28]. This point clearly shows that the water was more polluted before moving the floating houses than after moving the floating houses.
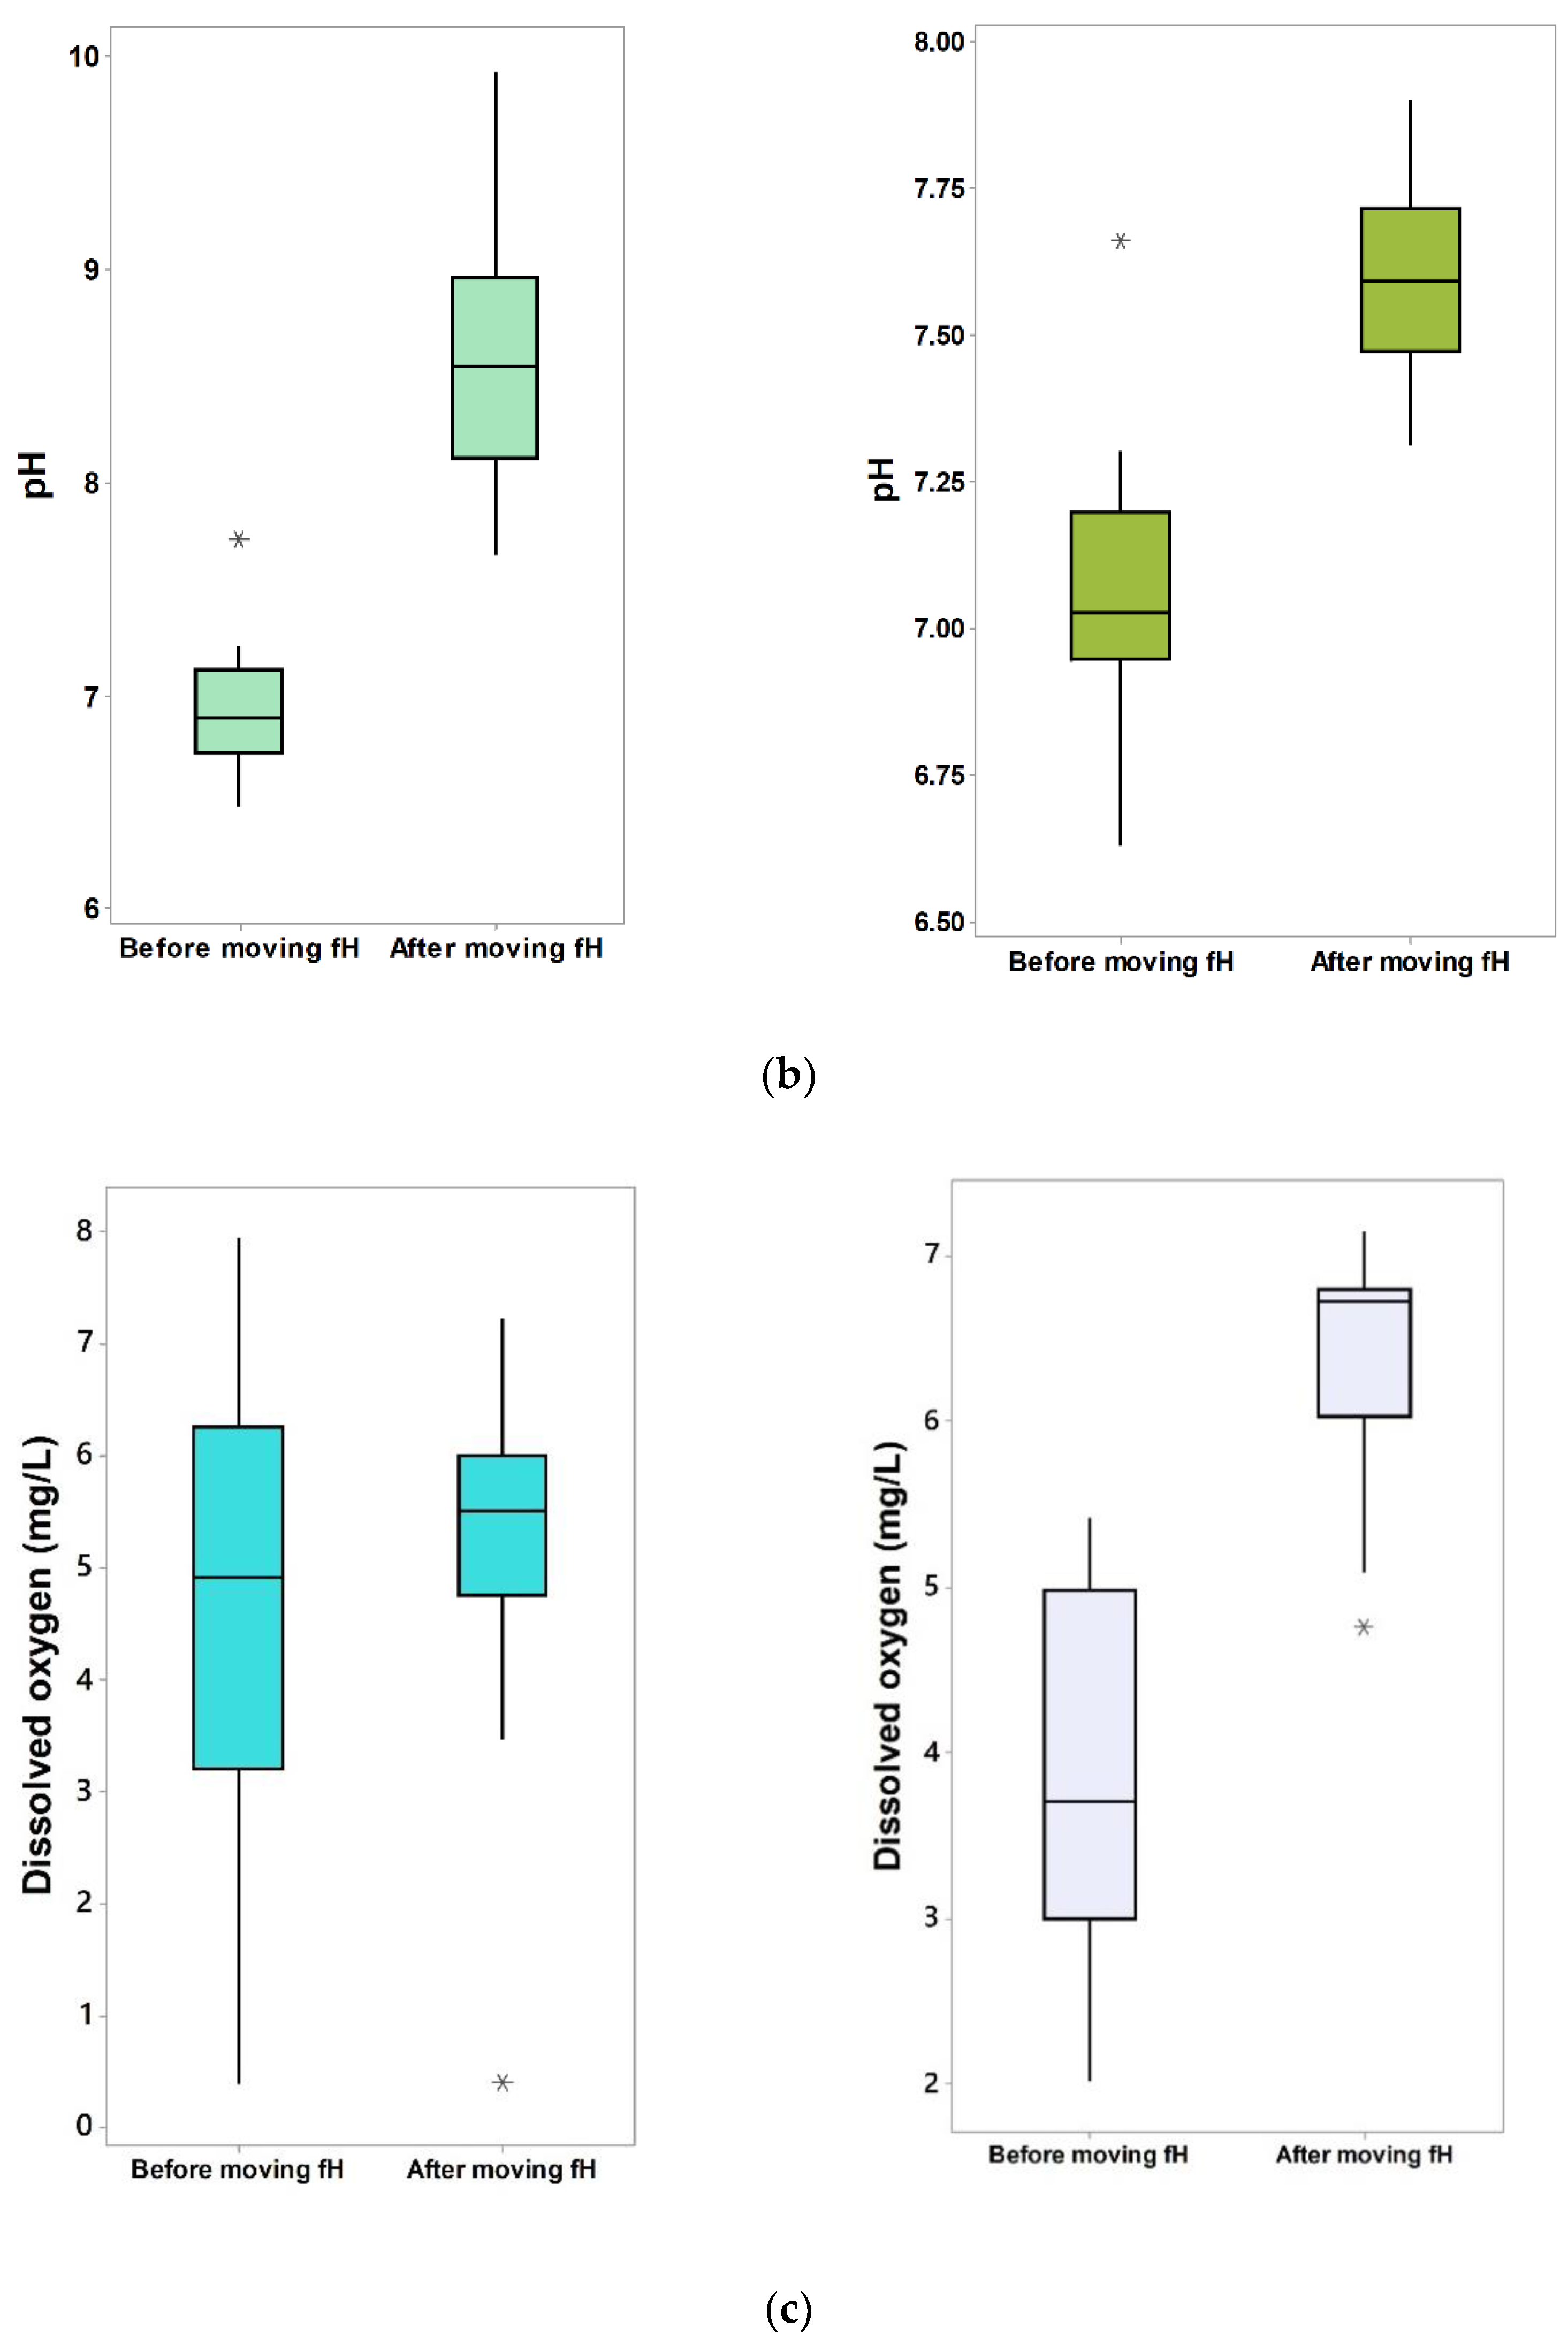
As a result of the box plots in Figure 3b, before moving the floating houses, the pH range was 7.7 to 6.48, with a mean value of 6.94 ± 0.28. After moving the floating houses, the pH ranged from 9.93 to 7.665, with a mean value of 8.585 ± 0.59, which was higher than that before moving the floating houses in the dry season. Additionally, the pH was significantly higher after moving the floating houses (p < 0.05). In the wet season, before moving the floating houses, the pH ranged from 7.66 to 6.63, with a mean value of 7.05 ± 0.23, whereas the pH in the wet season showed slightly alkaline conditions ranging from 7.31 to 7.9, with a mean value of 7.6 ± 0.16. Moreover, the pH significantly increased after moving the floating houses in the wet season (p < 0.05). In both the dry and the wet seasons, after moving the floating houses, the pH showed an increasing trend. After moving the floating houses, the pH significantly increased in both dry and wet seasons with the decreasing temperature. Phytoplankton growth, water temperature, and water depth were also contributing factors to the pH values.
The results of the dissolved oxygen concentration before moving the floating houses were largely spread out and highly variable compared to those obtained after moving the floating houses in both the dry and the wet seasons, as shown in Figure 3c. The range of dissolved oxygen before moving the floating houses was from 7.95 to 0.38 mg/L with a mean value of 4.7 ± 0.4 mg/L, whereas after moving the floating houses, the range of dissolved oxygen was from 7.23 to 0.4 mg/L with a mean value of 5.16 ± 0.4 mg/L. However, in the dry season, there was no significant difference between the two conditions. In the case of DO, the low water depth in the dry season could have been one of the contributing factors. In the wet season, the range of dissolved oxygen before moving the floating houses was from 5.42 to 2.02 mg/L, with a mean value of 3.84 ± 0.99 mg/L, whereas the dissolved oxygen ranged from 7.1 to 4.75 mg/L, with a mean value of 6.4 ± 0.68 mg/L after moving the floating houses. In the wet season, the DO concentration was significantly increased after moving the floating houses (p < 0.05). The box plot before moving the floating houses had a large spread, and the underlying distribution was skewed to the decreasing trend, indicating that there was a high amount of discharged waste from human activity and high water contamination. The dissolved oxygen concentration in both the dry and the wet seasons increased after moving the floating houses. These DO box plots show that the dissolved oxygen concentration after moving the floating houses became better than that before moving the floating houses.
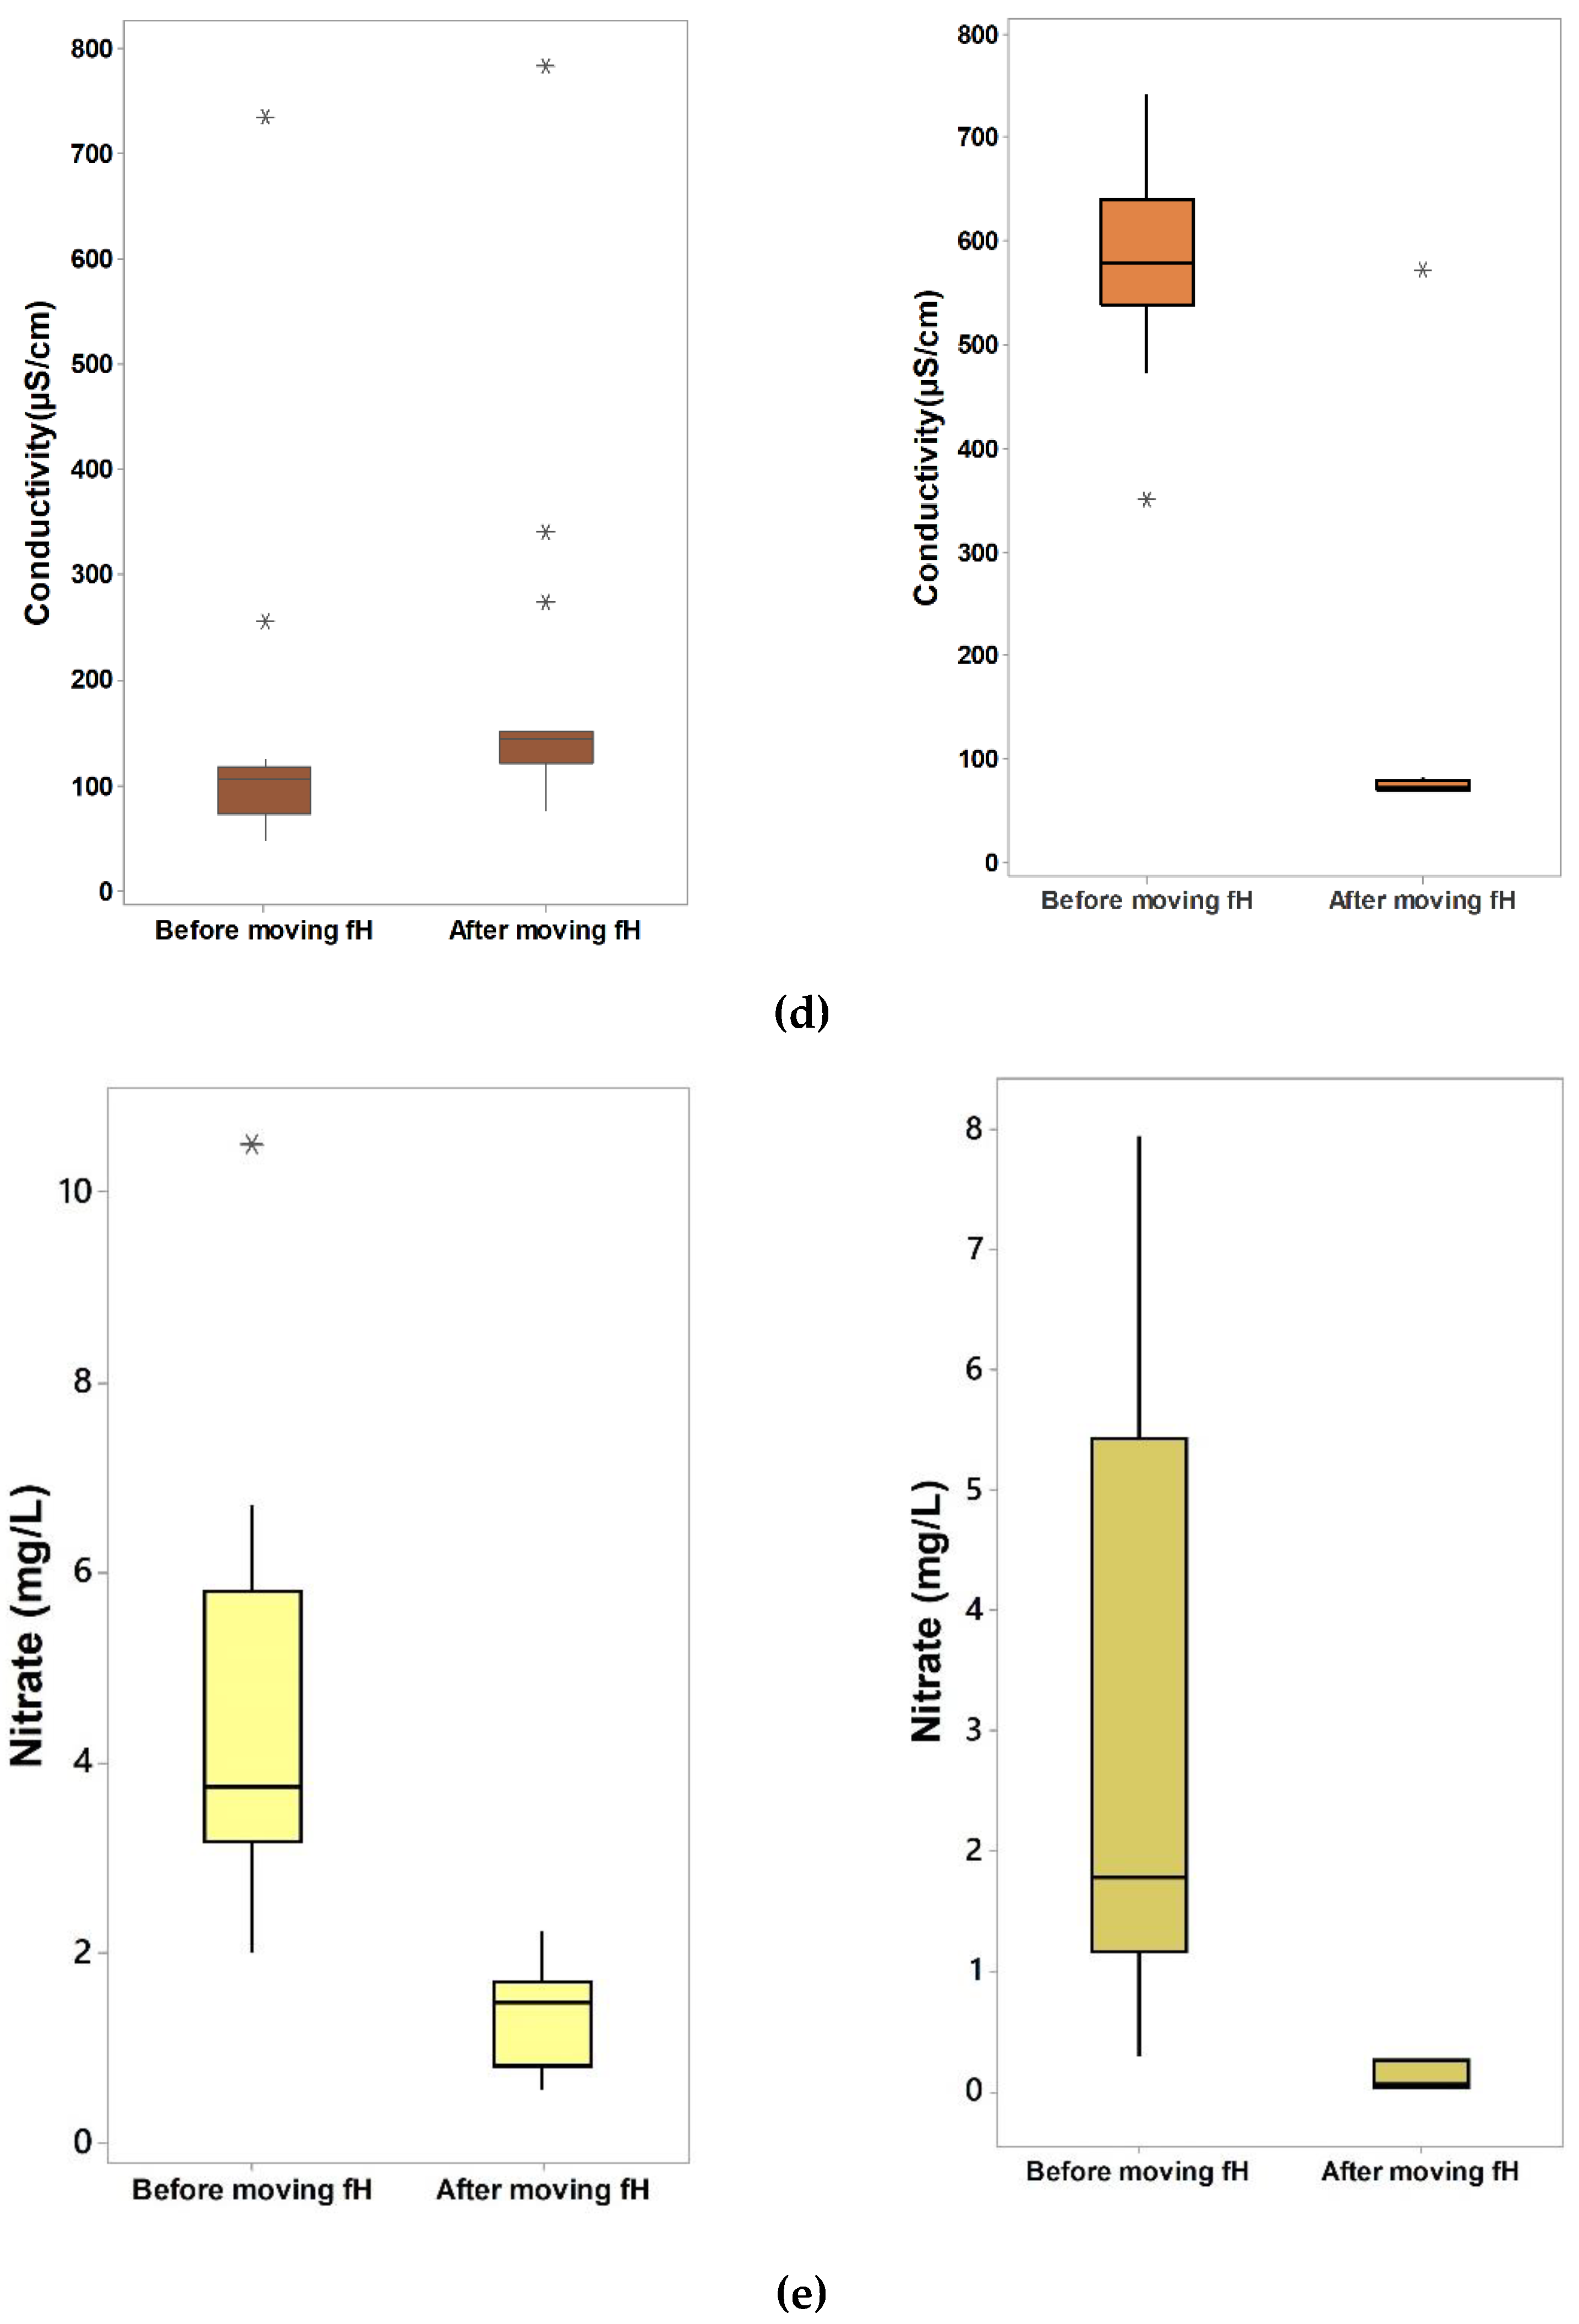
According to the box plot results shown in Figure 3d, the range of conductivity before moving the floating houses was from 735 to 47 µS/cm, with a mean value of "135 ± 156 µS/cm but the range after moving the floating houses was from 783 to 76.1 µS/cm, with a mean value of 187 ± 160.4 µS/cm in the dry season. In the wet season, the conductivity ranged from 742 to 350 µS/cm, with a mean value of 581 ± 89 µS/cm before moving the floating houses, whereas after moving the floating houses, the range of conductivity was from 572.6 to 68.7 µS/cm, with a mean value of 102 ± 118 µS/cm. These box plots show that in the dry season, even after moving the floating houses, the conductivity was slightly higher. Agricultural runoff and a failing sewage system that releases chloride, phosphate, and nitrate can increase conductivity [29]. Therefore, there was a contribution of a large amount of agricultural runoff into the water after moving the floating houses in the dry season. Moreover, the conductivity box plots show that the data before moving the floating houses had a larger spread than those after moving the floating houses. However, the conductivity was significantly decreased after moving the floating houses, which reveals that there was less water contamination after moving the floating houses in the wet season.
According to the results of the box plots as shown in Figure 3e, in the dry season, before moving the floating houses, the nitrate concentration range was 10.5 to 2 mg/L, with a mean value of 4.42 ± 12.08 mg/L, whereas after moving floating houses, the range became 2.23 to 0.57 mg/L, a the mean value of 1.38 ± 0.55 mg/L. In the wet season, before moving the floating houses, the range was from 7.95 to 0.29 mg/L, with the mean value of 3.022 ± 2.5 mg/L, whereas after moving floating houses, the range became 0.266 to 0.021 mg/L, with a mean value of 0.13 ± 0.11 mg/L. The nitrate concentration box plots before moving the floating houses in both the dry and wet seasons were largely spread out and showed an increasing trend. Meanwhile, after moving the floating houses in both the dry and wet seasons, the nitrate concentration was significantly reduced (p < 0.05). The factors contributing to the high concentration of nitrate may have been sourced from human activity in the Chhnok Tru floating community, such as fertilizer, fish farming, direct discharge of domestic waste, business activities, or direct input of feces from free septic toilets. However, after moving the floating houses, these kinds of activities were also reduced in the study area. Therefore, the significant reduction of nitrate concentration was recorded in both the dry and wet seasons.
3.2. Spatial Variability of Water Quality before and after Moving the Floating Houses
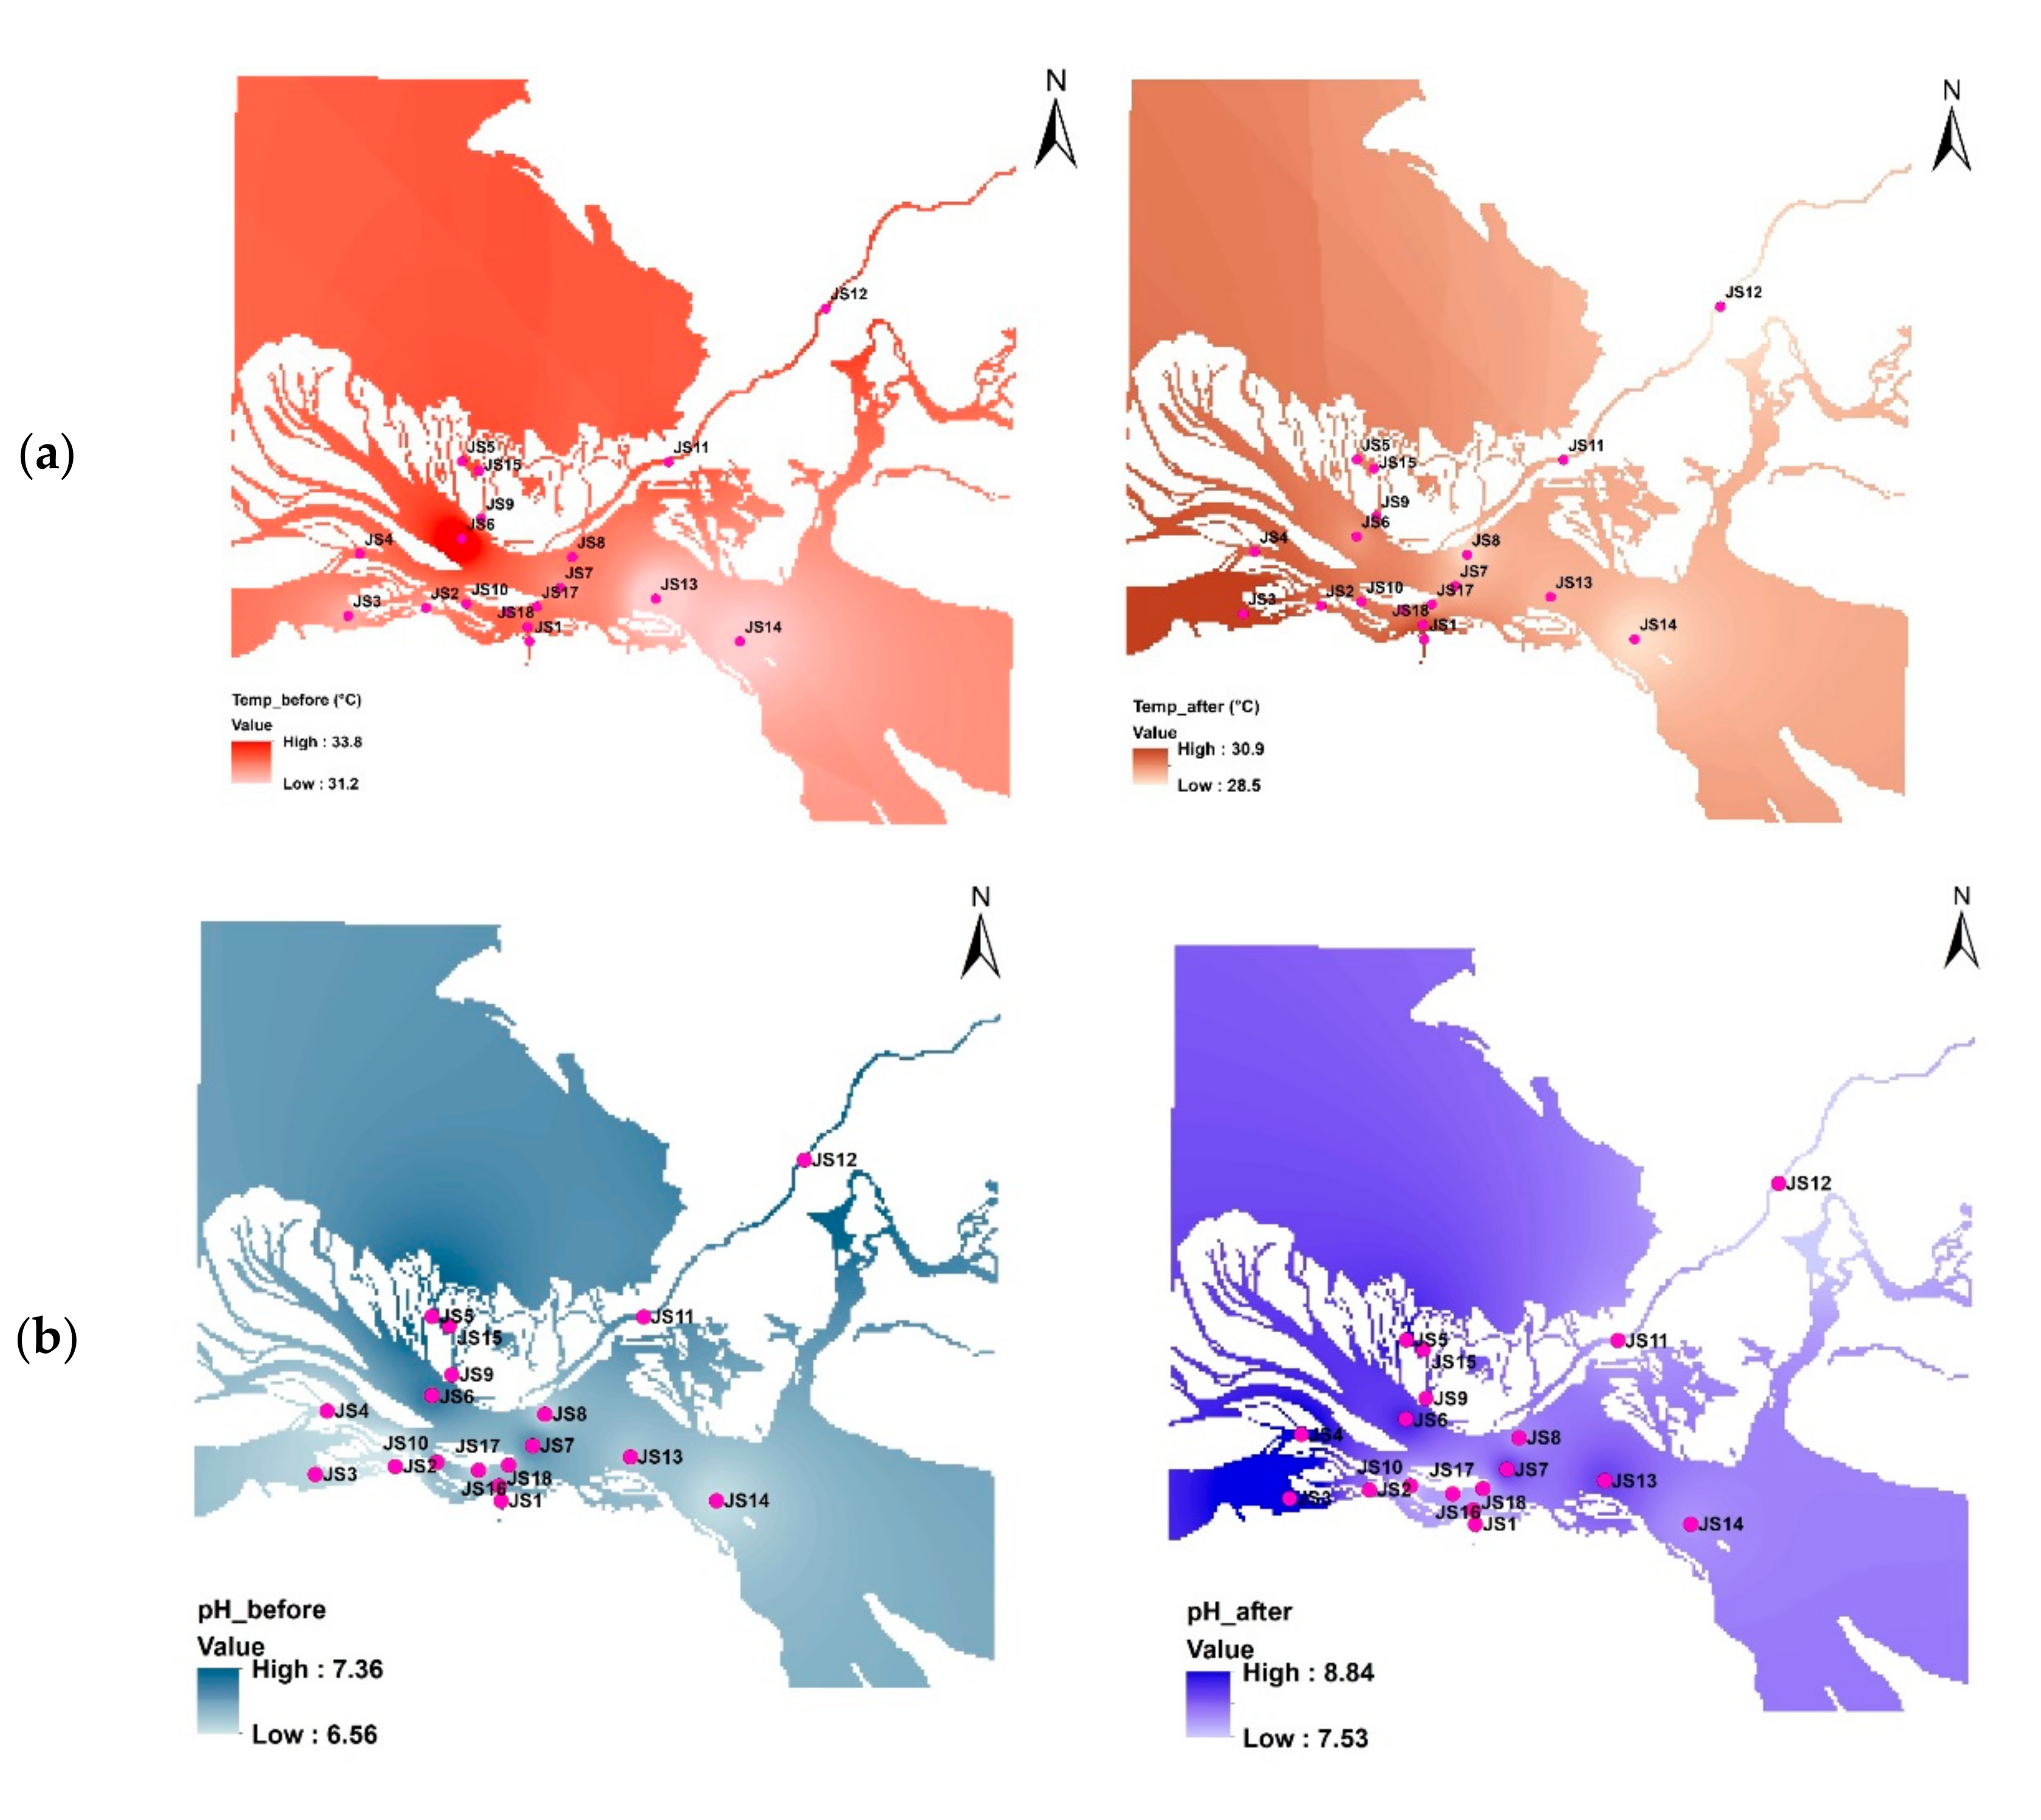
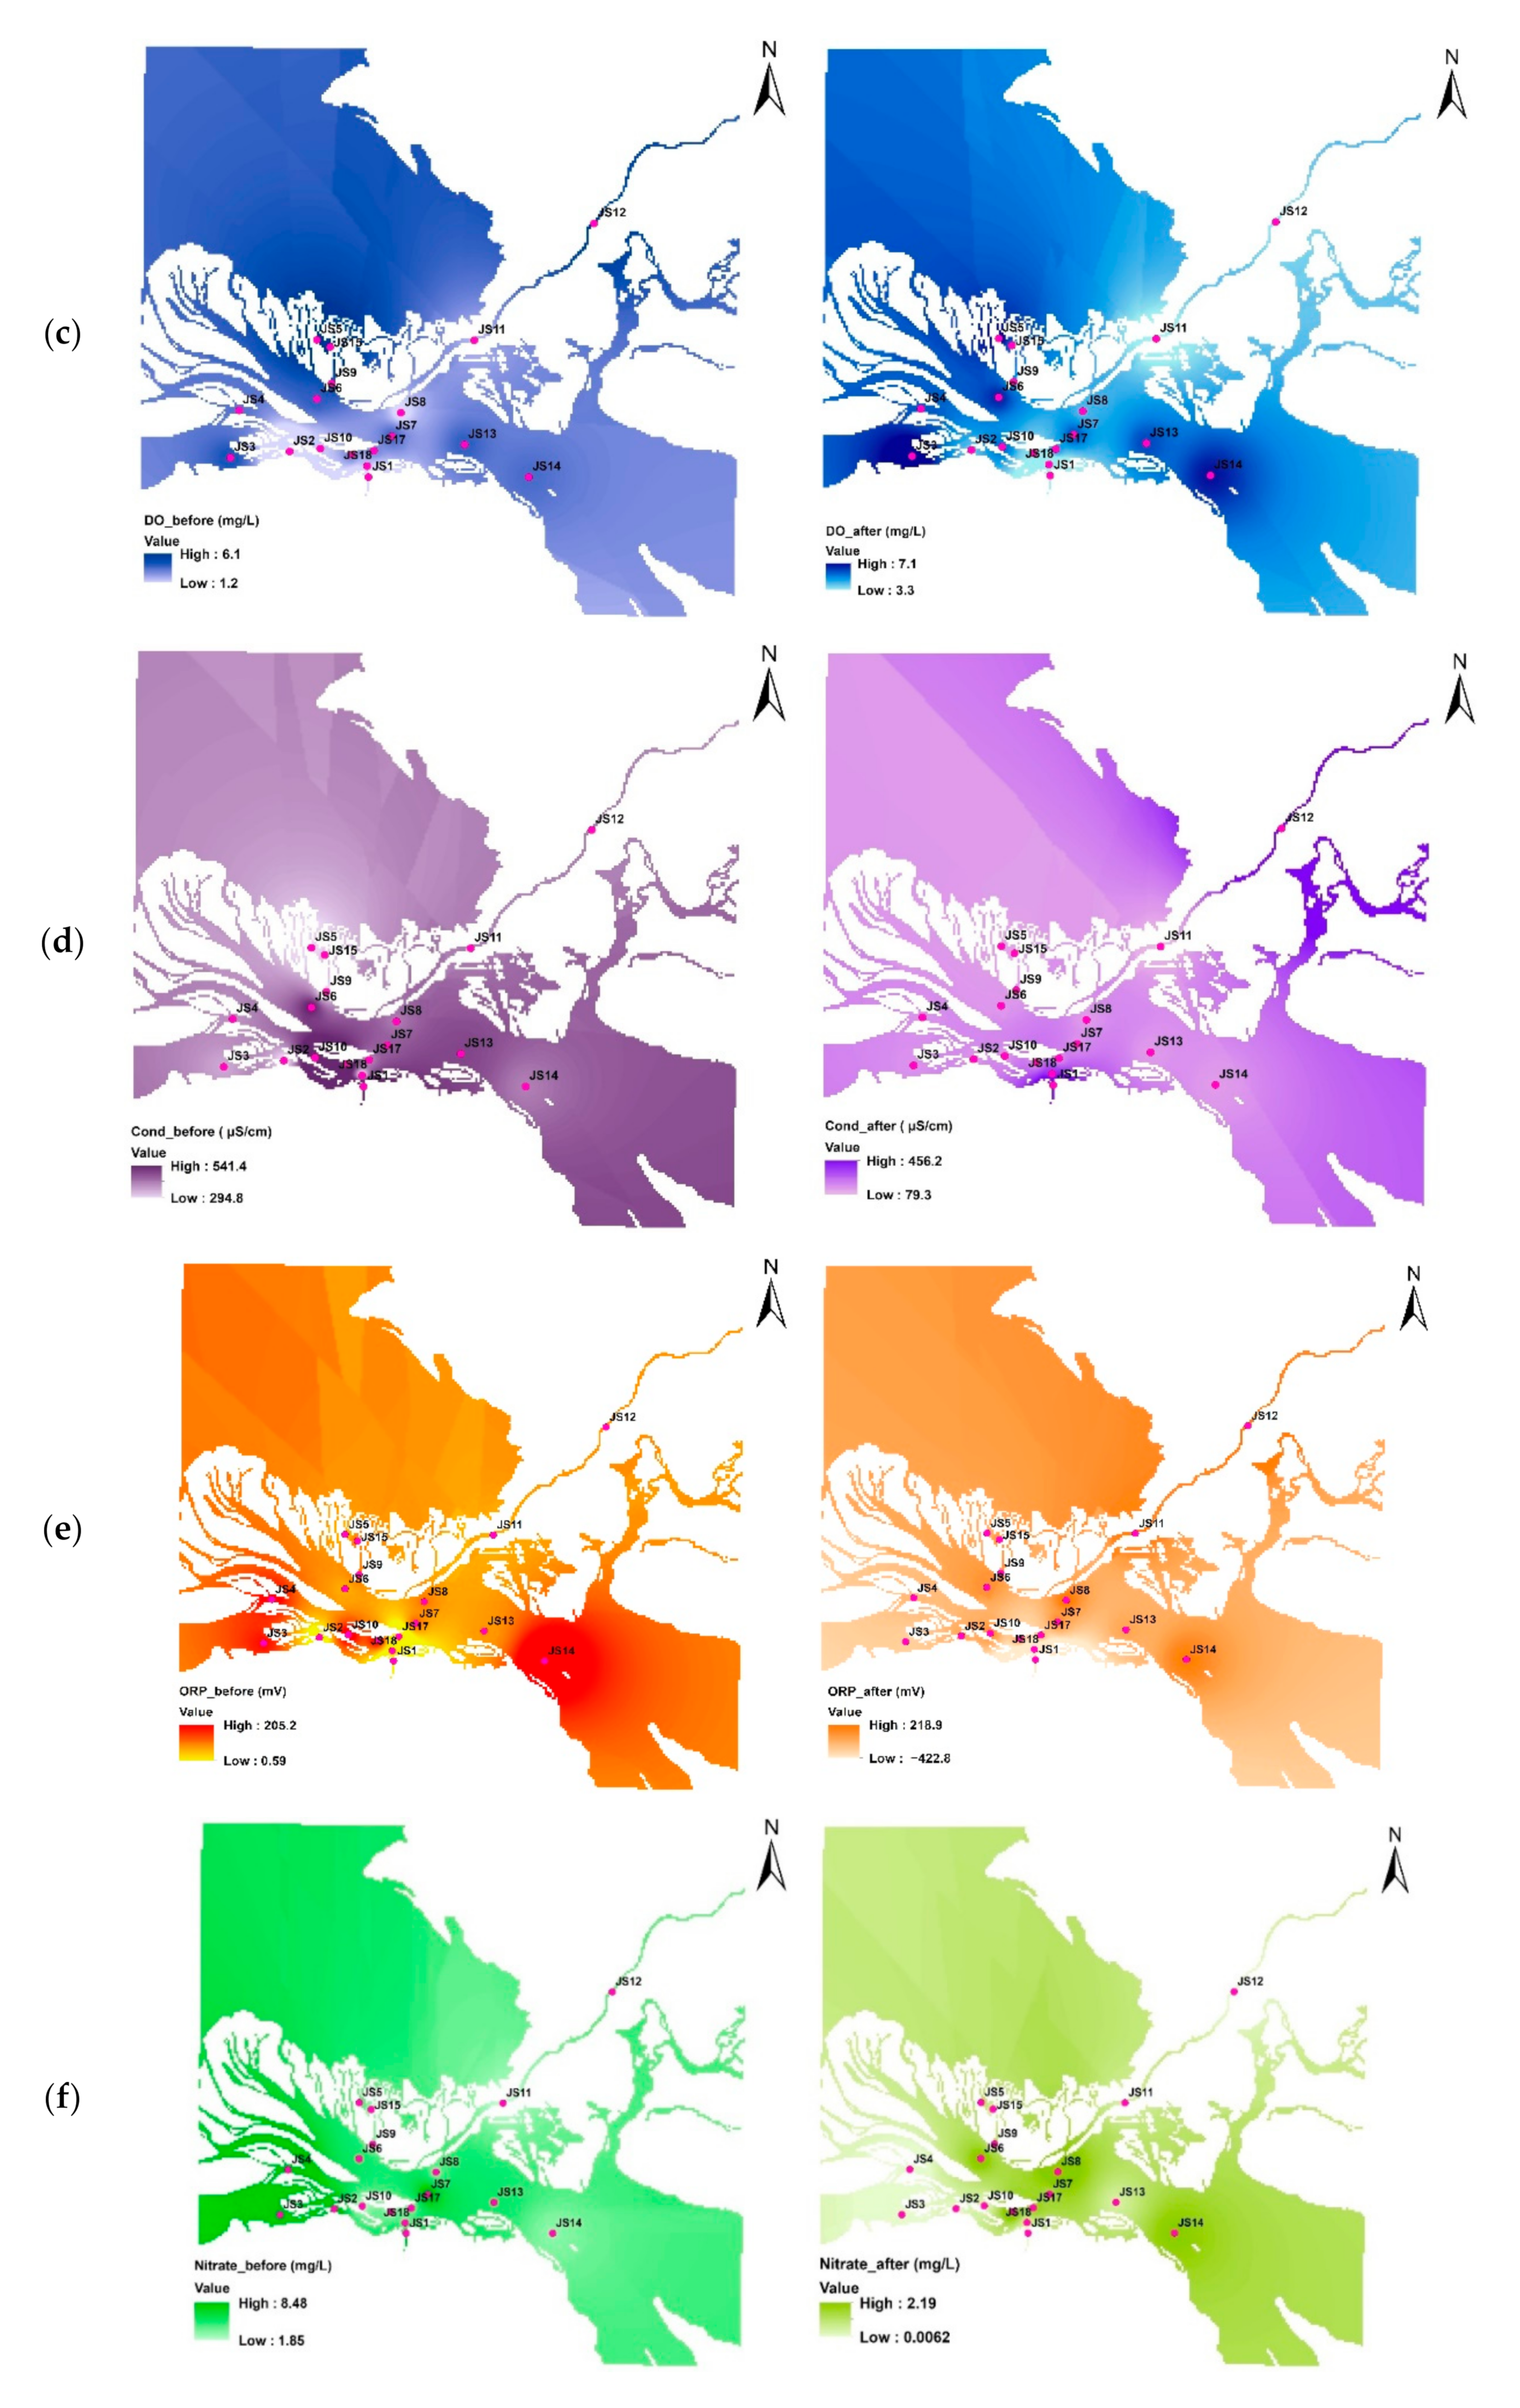
The spatial variation in the water quality parameters is shown in Figure 4. The results of the pH reveal that the pH slightly decreased at floating house sites JS6 and JS9 after moving the floating houses, as shown in Figure 4a. However, the sampling site JS3 in the condition after moving the floating houses showed the highest pH among the sites since JS3 is close to the agricultural land and the discharge from the agricultural land contributed to that site, leading to the highest pH value [30,31,32]. Moreover, from the temperature interpolation sites, only sampling site JS3, which is near agricultural land, had a high temperature after moving the floating houses, as shown in Figure 4b. The temperature variations in the other floating house sites of JS6 and JS9 and the wetland area of JS12 resulted in decreasing temperature values. After moving the floating houses, the dissolved oxygen concentrations in the study area improved, as shown in Figure 4c. However, some floating house sites, such as JS1, JS18, and JS16, which are near Chhnok Tru Port, still had low dissolved oxygen concentrations. According to the conductivity maps shown in Figure 4d, the conductivity of the study area decreased after moving the floating houses. The ORP spatial contributions, as shown in Figure 4e, also show that the study area became less contaminated after moving the floating houses. However, a negative ORP value was also found near Chhnok Tru Port. These ORP results indicate that there was high water contamination even after moving the floating houses, showing that there was still discharge from other point sources and nonpoint sources. Moreover, nitrate concentrations in the study area were reduced after moving the floating houses, as shown in Figure 4f.
3.3. Statistical Relationship of Water Quality Parameters before and after Moving the Floating Houses
Correlation analysis was performed to understand the statistical relationship of water quality parameters before and after moving the floating houses. The correlation matrix of the water quality parameters before and after moving the floating houses is shown in Table 2. From this correlation matrix, before moving the floating houses, conductivity was significantly negatively correlated with DO (p < 0.01). Additionally, after moving the floating houses, conductivity was significantly negatively correlated (p < 0.01) with DO. These results reveal that in both conditions, before and after moving the floating houses, decreasing or increasing conductivity could have affected the dissolved oxygen concentration. In addition, before moving the floating houses, the pH was significantly positively correlated with temperature (p < 0.05). Meanwhile, after moving the floating houses, the ORP was significantly negatively correlated with temperature (p < 0.01) and pH (p < 0.05). DO was significantly positively correlated with pH (p < 0.01), and conductivity was significantly negatively correlated with pH (p < 0.05). Moreover, NO3− was significantly negatively correlated with temperature (p < 0.05). Thus, increasing or decreasing the temperature affected the ORP, DO, pH, and NO3− of the water after moving the floating houses. Based on the correlation matrix from both conditions, before moving the floating houses, temperature affected pH, and conductivity affected DO. After moving the floating houses, temperature affected NO3− and ORP, and consequently affected pH, DO, and conductivity. These results also coincided with the study [17]. It was mentioned that in open spaces with no floating houses, water could receive sunlight effectively because there was no shadow from the houses, and effective photosynthesis could lead to better dissolved oxygen concentrations.
3.4. Temporal Shifts and Variation in Water Quality before and after Moving the Floating Houses
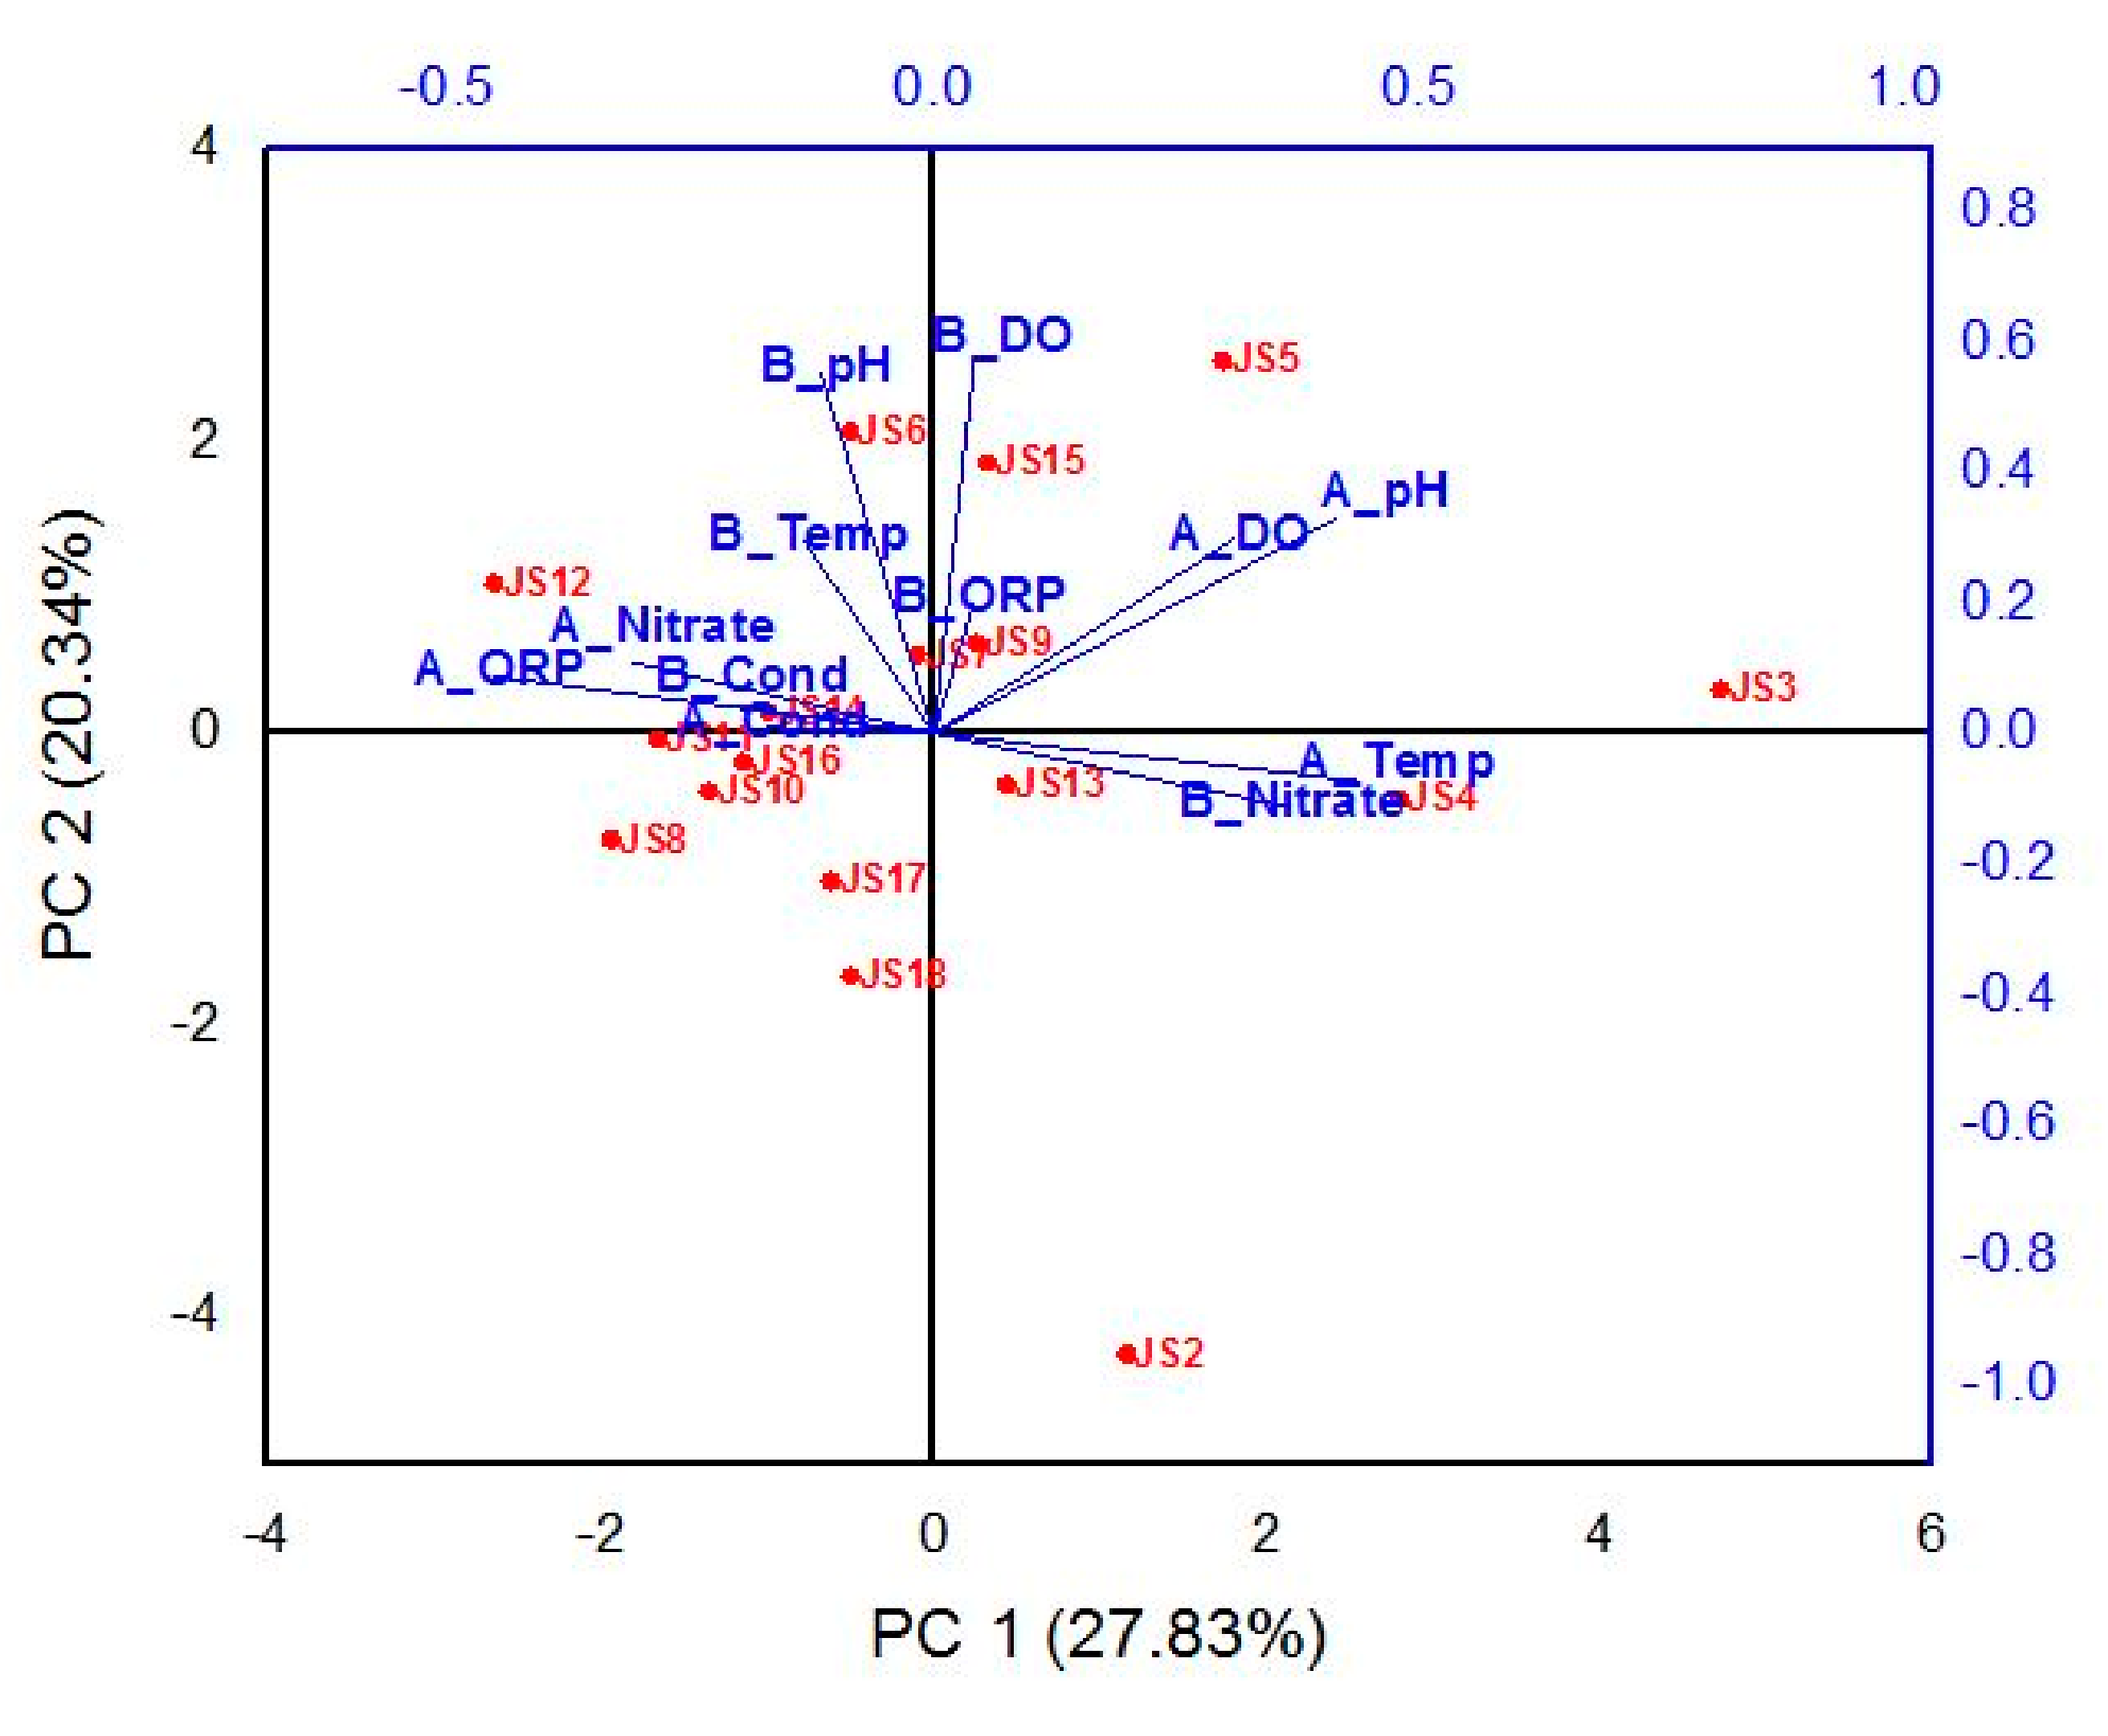
In the biplot results shown in Figure 5, the water quality parameters before moving floating houses are labelled as B_Temp for temperature, B_pH for potential hydrogen, B_DO for dissolved oxygen, B_cond for conductivity, B_ORP for oxidation-reduction potential, and B_Nitrate. Meanwhile, A_Temp, A_pH, A_DO, A_Cond, A_ORP, and A_Nitrate are used as the abbreviations for the respective water quality parameters after moving the floating houses. PC1 explained 27.83% of the variance and PC2 explained 20.34%. PC2 had a strong loading on temperature before moving the floating houses, mainly at JS6 and JS7. After moving the floating houses, PC1 had a strong loading on temperature, mainly at sites JS2 and JS13. This result shows that before and after moving the floating houses, the variation in temperature was mainly contributed to by these respective sites. Moreover, PC2 had a strong loading on pH before moving the floating houses and contributed mainly to sites JS6 and JS7. However, after moving the floating houses, PC1 was strongly loaded on pH and mainly contributed to site JS3. Since the agricultural area is near JS3, the contribution from agricultural land affected the pH after moving the floating houses. PC2 had strong loading on DO before moving the floating houses, mainly at sites JS15 and JS5, whereas after moving the floating houses, PC1 had strong loading on DO, mainly at sites JS4, JS3, JS5, JS9, and JS14. Besides, PC2 had weak loading on conductivity, mainly at sites JS7, JS6, and JS12, whereas after moving the floating houses, PC2 also had a weak loading on conductivity, mainly at sites JS7, JS6, and JS12. From these conductivity results, there was no temporal shifts in conductivity before or after moving the floating houses. This result reveals that agricultural runoff and other nonpoint sources also contributed to the study area. For ORP, PC2 had weak loading on ORP, mainly at sites JS9, JS15, and JS5, whereas PC1 had strong negative loading on ORP after moving the floating houses, mainly at sites JS12, JS6, and JS7. Before moving the floating houses, PC1 had a strong loading on NO3−, mainly at sites JS4, JS13, and JS2, whereas PC2 had a weak loading on NO3−, mainly at sites JS12, JS14, and JS1. Overall, B_temp, B_ pH, and B_DO had strong positive loadings on PC2 and A_Temp, A_pH, and A_DO had strong positive loadings on PC1. Therefore, for these PCA results, the temporal shifts in water quality parameters before and after moving the floating houses were enhanced. Thus, moving the floating houses affected some of the basic water quality parameters studied, whereas some were not affected.
3.5. Evaluation of the Floating Houses’ Effects on Water Quality
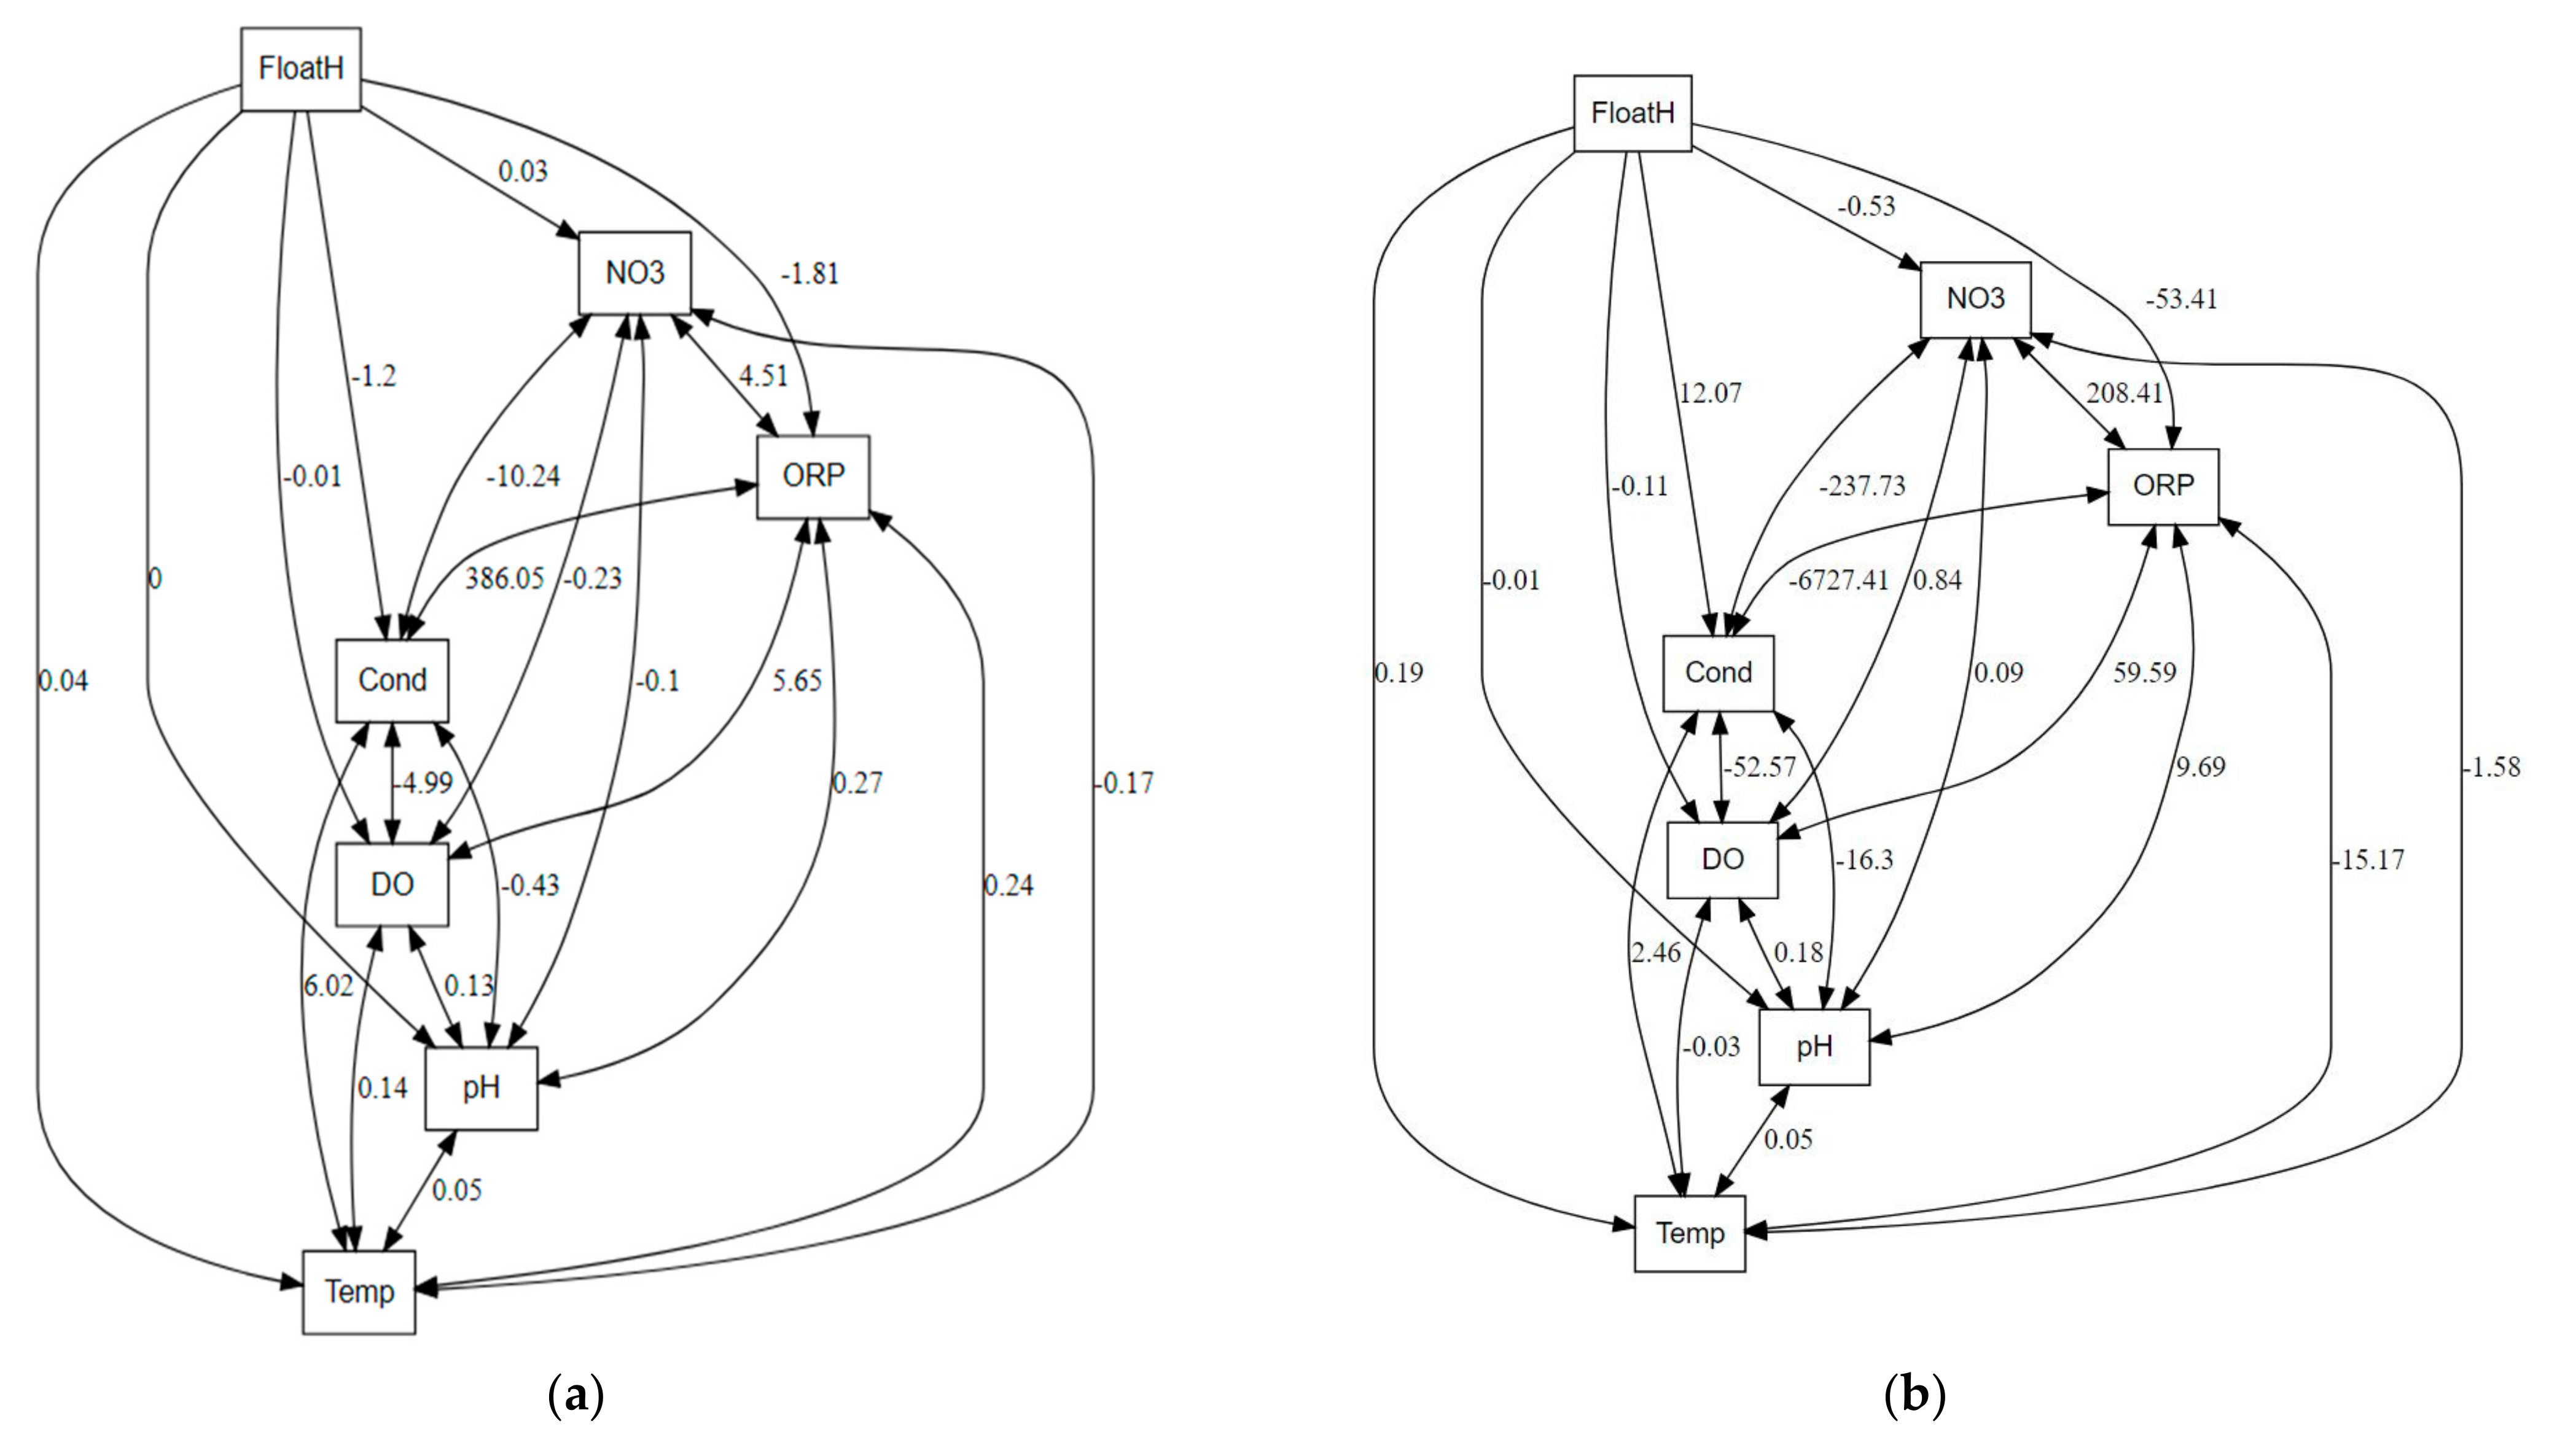
The path diagrams from SEM was evaluated to describe the direct effect of the floating houses on water quality before and after moving the floating houses, as shown in Figure 6a,b. As shown in Table 3, before moving the floating houses, 91% of the floating house distribution had a direct positive effect on pH, and after moving the floating houses, only 4% of the floating houses had a direct positive effect on pH. These results indicate that pH increased under both conditions of floating house distribution. However, there were no statistically significant effects of the percentage of floating houses on pH. Moreover, 91% of the floating house distribution had a statistically significant direct positive effect on temperature (C.R > ±1.96), whereas a 4% floating house distribution also had a statistically significant positive effect on temperature (C.R > ±1.96). These results show that the floating house percentage distribution had a significant effect on the temperature. According to the results of the floating houses’ effect on DO, the 91% floating house distribution had a direct negative effect on DO, and the 4% floating house distribution also had a negative effect on DO. These results show that DO decreased under both conditions of floating house distributions. This result proves that the dissolved oxygen concentration was also impacted by natural factors and other nonpoint sources [17,33]. However, there was no statistically significant effect of floating house percentage on DO. For conductivity, the 91% floating house distribution had a negative effect on conductivity, whereas the 4% floating house distribution had a positive effect on conductivity. Based on these results, other factors such as agricultural runoff also could have affected conductivity [17,28,33,34,35,36]. However, there was no statistically significant effect of the floating house distribution percentage on conductivity. For ORP, the 91% floating house distribution had a negative effect on ORP, and the 4% floating house distribution also had a statistically significant negative effect on ORP. The 91% floating house distribution had positive effect on NO3− before moving the floating houses, whereas the 4% floating house distribution had a negative effect on NO3−. There was no statistically significant effect of the floating house distribution percentage on NO3−.
4. Conclusions
This study assessed the basic water quality of the Chhnok Tru community, TSL, before and after moving the floating houses in both the dry and wet seasons. From the results of this study, there were significant differences in the basic water quality studied, except for DO, before and after moving the floating houses in the dry season, whereas in the wet season, the basic water quality parameters studied before and after moving the floating houses were all significantly different. The spatial and temporal variations revealed that the study area is still polluted by sources such as agricultural runoff, wastewater discharge, and so on. The sampling sites, such as JS3, JS1, and JS18, need to reduce water pollution. Moreover, after moving the floating houses, the temperature was correlated with NO3−, pH, DO, and ORP. Therefore, temperature affected the NO3−, pH, DO, and ORP after moving the floating houses. In addition, before moving the floating houses, the sites near the floating houses were polluted, whereas after moving the floating houses, the sites near the agricultural lands and wetlands were polluted. The results from this study also reveal that the floating houses significantly affected the temperature during the dry and wet seasons (C.R >±1.96). In addition, the floating houses significantly affected the ORP during the dry and wet seasons (C.R >±1.96).
Overall, the results enhance the scientific information about the floating houses and water quality of the study area. They increase the knowledge of water resource management in the study area. In conclusion, moving the floating houses from TSL significantly improved the lake water quality. However, in addition to moving the floating houses, other implementations and considerations, such as reducing the agricultural runoff by monitoring the usage of chemical fertilizer in agricultural activities and reducing the discharging of wastes by implementing rules, are still needed in the study area. Besides, other parameters such as TN, TP, BOD, Secchi Disc measurements, volume of water, bathymetry, and hydrodynamic elements (mode of water movement) should be included in further research.
Author Contributions
Conceptualization, M.P.W., S.S. and R.H.; methodology, M.P.W., V.C. and R.H.; software and validation, M.P.W., K.E.E. and R.H.; formal analysis, M.P.W., R.C. and R.H.; investigation, M.P.W., V.C. and R.H.; writing—original draft preparation, M.P.W.; writing—review and editing, M.P.W., R.H., K.E.E., S.S., R.C. and V.C; supervision, R.H. and S.S. All authors have read and agreed to the published version of the manuscript.
Funding
This work was funded by the French Development Agency (AFD, grant No: CKH 123602P) and the Cambodia Higher Education Improvement Project (credit No.6221-KH).
Institutional Review Board Statement
Not applicable.
Informed Consent Statement
Not applicable.
Data Availability Statement
Not applicable.
Acknowledgments
The authors would like to acknowledge the funders. Additionally, we would like to thank the Platform for Aquatic Ecosystem Research (PAER) laboratory for providing the facilities to conduct the experiment.
Conflicts of Interest
The authors declare no conflict of interest.
References
- Chislock, M.F.; Doster, E.; Zitomer, R.A.; Wilson, A.E. Eutrophication: Causes, Consequences, and Controls in Aquatic Ecosystems | Learn Science at Scitable. Nat. Educ. Knowl. 2013, 4, 10. [Google Scholar]
- Sarkkula, J.; Kiirikki, M.; Koponen, J.; Kummu, M. Ecosystem processes of the Tonle Sap Lake. Full Paper of the 1st Work Ecotone Phase II, 2003 in Phnom Penh and Siem Reap, Cambodia. 2003, pp. 1–14. Available online: http://citeseerx.ist.psu.edu/viewdoc/download?doi=10.1.1.472.3903&rep=rep1&type=pdf (accessed on 15 February 2022).
- Shivakoti, B.R.; Pham, N.B.; Seingheng, H.; Yoshimura, C.; Uk, S.; Khanal, R.; Siev, S.; Yamashita, A.; Fujii, H.; Tanaka, T.; et al. IGES Environmental Changes in Tonle Sap Lake and Its Floodplain: Status andd Policy Recommendations; Institute for Global Environmental Strategies (IGES): Hayama, Japan; Tokyo Institute of Technology (Tokyo Tech): Tokyo, Japan; Institute of Technology of Cambodia (ITC): Phnom Penh, Cambodia, 2020; ISBN 978-4-88788-230-0. [Google Scholar]
- Kuenzer, C. Threatening Tonle Sap: Challenges for Southeast Asia’s largest Freshwater Lake. Pacific Geogr. 2013, 40, 29–31. [Google Scholar]
- Liu, X.; Zhang, G.; Sun, G.; Wu, Y.; Chen, Y. Assessment of Lake water quality and eutrophication risk in an agricultural irrigation area: A case study of the Chagan Lake in Northeast China. Water 2019, 11, 2380. [Google Scholar] [CrossRef] [Green Version]
- Hamil, S.; Arab, S.; Chaffai, A.; Baha, M.; Arab, A. Assessment of surface water quality using multivariate statistical analysis techniques: A case study from Ghrib dam, Algeria. Arab. J. Geosci. 2018, 11, 754. [Google Scholar] [CrossRef]
- Sarkkula, J.; Baran, E.; Chheng, P.; Keskinen, M.; Koponen, J.; Kummu, M. Tonle Sap Lake pulsing system and fisheries productivity. SIL Proc. 2005, 29, 1099–1102. [Google Scholar] [CrossRef]
- Lamberts, D. The Tonle Sap Lake as a productive ecosystem. Int. J. Water Resour. Dev. 2006, 22, 481–495. [Google Scholar] [CrossRef]
- Campbell, I.C.; Say, S.; Beardall, J. Tonle Sap Lake, the heart of the Lower Mekong. In The Mekong; Academic Press: Cambridge, MA, USA, 2009; pp. 251–272. [Google Scholar] [CrossRef]
- Campbell, I.C.; Poole, C.; Giesen, W.; Valbo-Jorgensen, J. Species diversity and ecology of Tonle Sap Great Lake, Cambodia. Aquat. Sci. 2006, 68, 355–373. [Google Scholar] [CrossRef]
- Ohtaka, A.; Watanabe, R.; Im, S.; Chhay, R.; Tsukawaki, S. Spatial and seasonal changes of net plankton and zoobenthos in Lake Tonle Sap, Cambodia. Limnology 2010, 11, 85–94. [Google Scholar] [CrossRef]
- Daly, K.; Ahmad, S.K.; Bonnema, M.; Beveridge, C.; Hossain, F.; Nijssen, B.; Holtgrieve, G. Recent warming of Tonle Sap Lake, Cambodia: Implications for one of the world’s most productive inland fisheries. Lakes Reserv. Res. Manag. 2020, 25, 133–142. [Google Scholar] [CrossRef]
- Fujihara, Y.; Okuyama, K.; Hoshikawa, K.; Fujii, H.; Nakamura, T.; Lun, S.; Siev, S. Characteristics of the annual maximum and minimum water temperatures in tonle sap lake, cambodia from 2000 to 2019. Remote Sens. 2021, 13, 3972. [Google Scholar] [CrossRef]
- Chan, B.; Brosse, S.; Hogan, Z.S.; Ngor, P.B.; Lek, S. Influence of local habitat and climatic factors on the distribution of fish species in the tonle sap lake. Water 2020, 12, 786. [Google Scholar] [CrossRef] [Green Version]
- de Graaf, R.E. Adaptive Urban Development: A Symbiosis between Cities on land and Water in the 21st Century, 1st ed.; Rotterdam University Press of Rotterdam Univerisity of Applied Sciences: Rotterdam, TheNetherlands, 2012; ISBN 978 90 5179 799 2. [Google Scholar]
- Hannah Härtwich, B.S. Preliminary Study for an Environmental Impact Assessment of Floating Cities Deltas in Times of Climate Change II | Rotterdam. Bachelor’s Thesis, University of Potsdam, Potsdam, Germany, 2014. [Google Scholar]
- Foka, E. Water Quality Impact of Floating Houses. Master’s Thesis, Delft University of Technology, Delft, The Netherlands, 2014. Available online: https://www.indymo.nl/wp-content/uploads/2018/07/af3238e6132cbab78bed2afd5030e937.pdf (accessed on 26 April 2021).
- Santepheap, K. កម្ពុជា គួរសម្លឹង ទៅរក វិស័យបច្ចេក វិទ្យា ព័ត៌មាន ដើម្បី កំណើន ការងារ—Koh Santepheap Daily. 2019. Available online: https://kohsantepheapdaily.com.kh/article/744842.html (accessed on 10 June 2021).
- Siev, S.; Suif, Z.; Yoshimura, C.; Paringit, E.C.; Hul, S. Potential Impacts of Climate Change on Inundation and Sediment Dynamics in the Floodplain of Tonle Sap River. In Proceedings of the Seventh Regional Symposium on Infrastructure Development (RSID 7)., Bangkok, Thailand, 5–7 November 2015; pp. 284–289. [Google Scholar]
- Huffman, G.J.; Stocker, E.F.; Bolvin, D.T.; Nelkin, E.J.; Tan, J. GPM IMERG Late Precipitation L3 1 Day 0.1 degree x 0.1degree V06; Savtchenko, A., Ed.; Goddard Earth Sciences Data and Information Services Center (GES DISC): Greenbelt, MA, USA, 2019. [Google Scholar]
- Hersbach, H.; Bell, B.; Berrisford, P.; Hirahara, S.; Horányi, A.; Muñoz-Sabater, J.; Nicolas, J.; Peubey, C.; Radu, R.; Schepers, D.; et al. The ERA5 global reanalysis. Q. J. R. Meteorol. Soc. 2020, 146, 1999–2049. [Google Scholar] [CrossRef]
- Eaton, A. Standard Methods for the Examination of Water and Wastewater, 11th ed.; American Public Health Association (APHA): Washington, DC, USA, 1905; ISBN 978-0-87553-287-5. [Google Scholar]
- Hackerman, N. Effect of Temperature on Corrosion of Metals by Water. Ind. Eng. Chem. 1952, 44, 1752–1755. [Google Scholar] [CrossRef]
- Chapman, D.; Kimstach, V. Chapter 3: Water Quality Assessments—A Guide to Use of Biota, Sediments and Water in Environmental Monitoring, 2nd ed.; World Health Organization: Geneva, Switzerland, 1992; Volume 5. [Google Scholar]
- Tudesque, L.; Pool, T.K.; Chevalier, M. Planktonic diatom community dynamics in a tropical flood-pulse lake: The Tonle Sap (Cambodia). Diatom Res. 2019, 34, 1–22. [Google Scholar] [CrossRef]
- Garg, J.K. Surface Water Quality Assessment of Bhindawas Lake (Haryana, India) Using multivariate statistical techniques. J. Glob. Ecol. Environ. 2015, 2, 34–46. [Google Scholar]
- Paaijmans, K.P.; Takken, W.; Githeko, A.K.; Jacobs, A.F.G. The effect of water turbidity on the near-surface water temperature of larval habitats of the malaria mosquito Anopheles gambiae. Int. J. Biometeorol. 2008, 52, 747–753. [Google Scholar] [CrossRef] [PubMed] [Green Version]
- Irvine, K. Teacher Handbook of Water Quality for the Singapore Geography Curriculum; NIE: Singapore, 2017. [Google Scholar]
- Bhateria, R.; Jain, D. Water quality assessment of lake water: A review. Sustain. Water Resour. Manag. 2016, 2, 161–173. [Google Scholar] [CrossRef] [Green Version]
- Fondriest Envriornmental, Inc. pH of Water—Environmental Measurement Systems. Fundamentals of Environmental Measurements. 2013. Available online: https://fondriest.com/environmental-measurements/parameters/water-quality/pH/ (accessed on 26 April 2021).
- Najar, I.A.; Khan, A.B. Assessment of water quality and identification of pollution sources of three lakes in Kashmir, India, using multivariate analysis. Environ. Earth Sci. 2012, 66, 2367–2378. [Google Scholar] [CrossRef]
- Pericherla, S.; Karnena, M.K.; Vara, S. A review on impacts of agricultural runoff on freshwater resources. Int. J. Emerg. Technol. 2020, 11, 829–833. [Google Scholar]
- Asolekar, S.R.; Kalbar, P.P.; Chaturvedi, M.K.M.; Maillacheruvu, K.Y. Rejuvenation of Rivers and Lakes in India: Balancing Societal Priorities with Technological Possibilities. In Comprehensive Water Quality and Purification; Elsevier Inc.: Amsterdam, The Netherlands, 2014; Volume 4, pp. 181–229. [Google Scholar] [CrossRef]
- Saran, L.M.; Meneghine, A.K.; Célico, A.S.; Pinheiro, D.G.; Alves, L.M.C. Qualidade da àgua de um córrego em àrea agrícola onde é usado composto orgânico de resíduos animais e vegetais. Cienc. Agrotecnologia 2017, 41, 263–278. [Google Scholar] [CrossRef] [Green Version]
- Coops, H.; Beklioglu, M.; Crisman, T.L. The role of water-level fluctuations in shallow lake ecosystems—Workshop conclusions. Hydrobiologia 2003, 506–509, 23–27. [Google Scholar] [CrossRef]
- Ling, T.Y.; Gerunsin, N.; Soo, C.L.; Nyanti, L.; Sim, S.F.; Grinang, J. Seasonal changes and spatial variation in water quality of a large young tropical reservoir and its downstream river. J. Chem. 2017, 2017, 1–16. [Google Scholar] [CrossRef] [Green Version]
Figure 1.
Map of the study area.

Figure 2.
Flow chart showing the methodology in this study.

Figure 3.
Box plots showing the temporal variation in the water quality parameters: (a) temperature, (b) pH, (c) DO, (d) conductivity, and (e) nitrate before and after moving the floating houses during the dry and wet seasons.
Figure 3.
Box plots showing the temporal variation in the water quality parameters: (a) temperature, (b) pH, (c) DO, (d) conductivity, and (e) nitrate before and after moving the floating houses during the dry and wet seasons.


Figure 4.
Spatial distribution of water quality parameters: (a) temperature, (b) pH, (c) DO, (d) conductivity, (e) ORP, and (f) nitrate before and after moving the floating houses.
Figure 4.
Spatial distribution of water quality parameters: (a) temperature, (b) pH, (c) DO, (d) conductivity, (e) ORP, and (f) nitrate before and after moving the floating houses.


Figure 5.
Biplots of water quality parameters before and after moving the floating houses.

Figure 6.
(a) Path analysis showing the effect of the floating houses on water quality before moving the floating houses. (b) Path analysis showing the effect of the floating houses on water quality after moving the floating houses.
Figure 6.
(a) Path analysis showing the effect of the floating houses on water quality before moving the floating houses. (b) Path analysis showing the effect of the floating houses on water quality after moving the floating houses.


Table 1.
Sampling sites and sampling location area.
| Sampling Sites | Coordinates | Sampling Location Area | |
|---|---|---|---|
| Latitude | Longitude | ||
| JS1 | 12°30′32.94″ N | 104°27′17.28″ E | Floating village |
| JS2 | 12°30′54.59″ N | 104°26′09.1″ E | River |
| JS3 | 12°30′49.25″ N | 104°25′17.72″ E | River |
| JS4 | 12°31′29.54″ N | 104°25′25.25″ E | River |
| JS5 | 12°32′29.61″ N | 104°26′32.53″ E | Wetland area |
| JS6 | 12°31′39.53″ N | 104°26′32.53″ E | River |
| JS7 | 12°31′07.72″ N | 104°27′37.62″ E | Main river (Kramam River) |
| JS8 | 12°31′27.79″ N | 104°27′45.43″ E | Main river (Kramam River) |
| JS9 | 12°31′52.63″ N | 104°26′45.35″ E | Wetland area |
| JS10 | 12°30′57.22″ N | 104°26′35.66″ E | River |
| JS11 | 12°32′29.49″ N | 104°28′48.83″ E | Wetland area (along Stung Sen River) |
| JS12 | 12°34′09.16″ N | 104°30′32.29″ E | Wetland area |
| JS13 | 12°31′00.7″ N | 104°28′40.55″ E | Main river (Kramam River) |
| JS14 | 12°30′33.27″ N | 104°29′36.17″ E | Main river (Kramam River) |
| JS15 | 12°32′23.63″ N | 104°26′43.94″ E | Wetland area |
| JS16 | 12°30′52.19″ N | 104°27′02.81″ E | Floating village |
| JS17 | 12°30′55.51″ N | 104°27′22.1″ E | River (near floating village area) |
| JS18 | 12°30′42.36″ N | 104°27′16.24″ E | Floating village |
Table 2.
Correlation matrix of water quality parameters before and after moving the floating houses.
Table 2.
Correlation matrix of water quality parameters before and after moving the floating houses.
| Temp | pH | DO | Cond | ORP | ||
|---|---|---|---|---|---|---|
| Before moving the floating houses | Temp | 1 | ||||
| pH | 0.518 * | 1 | ||||
| DO | −0.056 | 0.318 | 1 | |||
| Cond | 0.277 | 0.092 | −0.580 ** | 1 | ||
| ORP | −0.104 | 0.093 | 0.247 | 0.298 | 1 | |
| NO3− | −0.022 | −0.159 | −0.371 | 0.104 | −0.017 | |
| After moving the floating houses | Temp | 1 | ||||
| pH | 0.208 | 1 | ||||
| DO | −0.278 | 0.682 ** | 1 | |||
| Cond | 0.206 | −0.571 * | −0.671 ** | 1 | ||
| ORP | −0.777 * | −0.493 * | −0.258 | 0.152 | 1 | |
| NO3− | −0.538 * | −0.150 | −0.095 | −0.238 | 0.398 | |
Cell content: Pearson correlation coefficient. Bold value with (*): significant at the 95% confidence level (p < 0.05). Bold value with (**): significant at the 99% confidence level (p < 0.01).
Table 3.
Relationship between the floating houses and water quality.
| Path | Standardized Coefficients | Standard Error | Critical Ratio | p-Value | ||||
|---|---|---|---|---|---|---|---|---|
| Before | After | Before | After | Before | After | Before | After | |
| FloatH → pH | 0.003 | −0.012 | 0.006 | 0.036 | 0.448 | 0.325 | 0.654 | 0.745 |
| FloatH → temp | 0.038 | 0.188 | 0.015 | 0.063 | 2.528 | 2.899 | 0.011 | 0.003 |
| FloatH → DO | −0.009 | −0.109 | 0.028 | 0.099 | −0.335 | −1.098 | 0.737 | 0.272 |
| FloatH → Cond | −1.199 | 12.069 | 1.020 | 12.338 | −1.176 | 0.978 | 0.240 | 0.328 |
| FloatH → ORP | −1.810 | −53.408 | 1.087 | 11.276 | −1.665 | −4.736 | 0.096 | 0.000 |
| FloatH → NO3− | 0.027 | −0.529 | 0.052 | 0.603 | 0.523 | −0.876 | 0.601 | 0.381 |
Publisher’s Note: MDPI stays neutral with regard to jurisdictional claims in published maps and institutional affiliations. |
© 2022 by the authors. Licensee MDPI, Basel, Switzerland. This article is an open access article distributed under the terms and conditions of the Creative Commons Attribution (CC BY) license (https://creativecommons.org/licenses/by/4.0/).
Share and Cite
MDPI and ACS Style
Wai, M.P.; Chem, V.; Eang, K.E.; Chhin, R.; Siev, S.; Heu, R. Accessing the Impact of Floating Houses on Water Quality in Tonle Sap Lake, Cambodia. Sustainability 2022, 14, 2747. https://0-doi-org.brum.beds.ac.uk/10.3390/su14052747
AMA Style
Wai MP, Chem V, Eang KE, Chhin R, Siev S, Heu R. Accessing the Impact of Floating Houses on Water Quality in Tonle Sap Lake, Cambodia. Sustainability. 2022; 14(5):2747. https://0-doi-org.brum.beds.ac.uk/10.3390/su14052747
Chicago/Turabian StyleWai, May Phue, Vibol Chem, Khy Eam Eang, Rattana Chhin, Sokly Siev, and Rina Heu. 2022. "Accessing the Impact of Floating Houses on Water Quality in Tonle Sap Lake, Cambodia" Sustainability 14, no. 5: 2747. https://0-doi-org.brum.beds.ac.uk/10.3390/su14052747
Note that from the first issue of 2016, this journal uses article numbers instead of page numbers. See further details here.