Article

Heavy Metal(loid)s Pollution of Agricultural Soils and Health Risk Assessment of Consuming Soybean and Wheat in a Typical Non-Ferrous Metal Mine Area in Northeast China

1
MNR Key Laboratory of Metallogeny and Mineral Assessment, Institute of Mineral Resources, Chinese Academy of Geological Sciences, Beijing 100037, China
2
Institute of Energy and Environmental Protection, Chinese Academy of Agricultural Engineering, Beijing 100125, China
3
Key Laboratory of Energy Resource Utilization from Agriculture Residue, Ministry of Agriculture, Beijing 100125, China
*
Author to whom correspondence should be addressed.
Sustainability 2022, 14(5), 2953; https://0-doi-org.brum.beds.ac.uk/10.3390/su14052953
Submission received: 28 January 2022 / Revised: 27 February 2022 / Accepted: 28 February 2022 / Published: 3 March 2022
(This article belongs to the Special Issue Future Directions for Soil Remediation and Environmental Management)

Abstract

:
During mining, some of the essential metal(loid)s for plants or humans are discharged into the environment with non-essential metal(loid)s. Thus, comprehensive investigations of their distribution and the health risk of consuming food crops near mines are significant. A total of 26 soils and 25 food crops (soybean grains and wheat grains) were sampled to investigate arsenic (As), cadmium (Cd), chromium (Cr), copper (Cu), mercury (Hg), lead (Pb), zinc (Zn), selenium (Se), molybdenum (Mo), and manganese (Mn) in soils and crops in a typical non-ferrous metal mine area in Northeast China. The distribution patterns of soil heavy metal(loid)s and principal component analysis (PCA) results indicated that Cd, Cu, Zn, Mo, and Mn in soils were significantly affected by mining activities and were mainly or partly derived from the mines. Moreover, these soil heavy metal(loid)s (except Se) in the Tongshan copper mine area were attenuated with distance in the downstream direction. The BCF (bioconcentration factor) values of non-essential elements (Se, Hg, Cr, As, Cd, Pb) were relatively lower and positively related to soil nutrients. On the contrary, higher BCF values of essential elements (Cu, Zn, and Mo) and a weak relationship between the BCF of essential elements and soil nutrients were found. The mean Igeo values of soil heavy metal(loid)s indicated that As and Cu were at an unpolluted-to-moderately-polluted level (Igeo > 1), while other heavy metal(loid)s all presented an unpolluted level (Igeo < 1). Nevertheless, some soil samples were obviously polluted (Igeo > 1), such as KQ, D1, D3, D5, D6, and T1. The HQ (hazard quotient) and HI (hazard index) values of As and Mn both exceeded 1, indicating the higher potential health risks of consuming soybean grains and wheat grains for all people groups.

1. Introduction

Soil is a major component of the Earth’s ecosystem, supplying essential nutrients for plant growth. With the rapid development of the economy, substantial amounts of heavy metal(loid)s have been discharged into soils through sewage irrigation, fertilization, and mining activities, etc. [1,2,3,4], finally inducing an accumulation of these elements in food crops. Food crops are the main sources of the essential nutrients, minerals, and vitamins required by human beings for maintaining good health [5]. Meanwhile, food consumption is the major pathway of human exposure to heavy metal(loid)s, accounting for >90% compared with other ways of exposure, such as inhalation and dermal contact [6]. Heavy metal(loid)s in food crops can finally be accumulated in the human body through the food chain, posing a potential health risk [7,8,9]. Accordingly, heavy metal(loid)s in food crops create significant health risks to the possible consumers of these crops [3,5,6,10].
Mining development is the most important source of heavy metal(loid)s near the mine area. Sulfides on exposure to oxygen and water may generate significant amounts of acid mine drainage, which in turn results in the leaching of metals towards aquatic bodies. When these heavy metal(loid)s in the acid mine drainage are discharged into the surface water, they can be transported for a distance of a few kilometers by the hydrodynamic forces [11]. In addition, fine-grained mine tailings can be carried away by strong winds and contaminate the surroundings [12]. Heavy metal(loid) pollution near mines has been reported extensively [3,11,13]. However, the ore in mines, especially metal mines, generally contains many associated elements, some of which are the essential elements for the human body or plants, such as Cu, Zn, Mo, and Mn. Cu and Zn are the key elements of some proteins and enzymes in plants and the human body, which play a role in biological electron transport and oxygen transportation [14,15]. Mo and Mn also play an important role in the enzymes production of the human body and plants [16,17]. Although heavy metal(loid) pollution around mine areas has led to enormous concerns in the past few decades, only a few previous studies have been particularly concerned with the essential elements in the soil–plant system in mining areas.
The Duobaoshan ore-concentration area, including the Duobaoshan copper mine and the Tongshan copper mine, is located in Heihe District, Northeast China. Long-term mining activities could lead to the heavy metal(loid) pollution of agricultural soil and threaten the health of residents near the mine area. In this paper, the objectives were: (i) to obtain the distribution patterns of heavy metal(loid)s near the Duobaoshan and Tongshan copper mines; (ii) to investigate the bioaccumulation of heavy metal(loid)s in food crops (soybean and wheat); and (iii) to assess the environmental risk and health risks of consuming crops grown near mines. The results can contribute to the formulation of science-based remediation and protection strategies for the studied area.

2. Materials and Methods

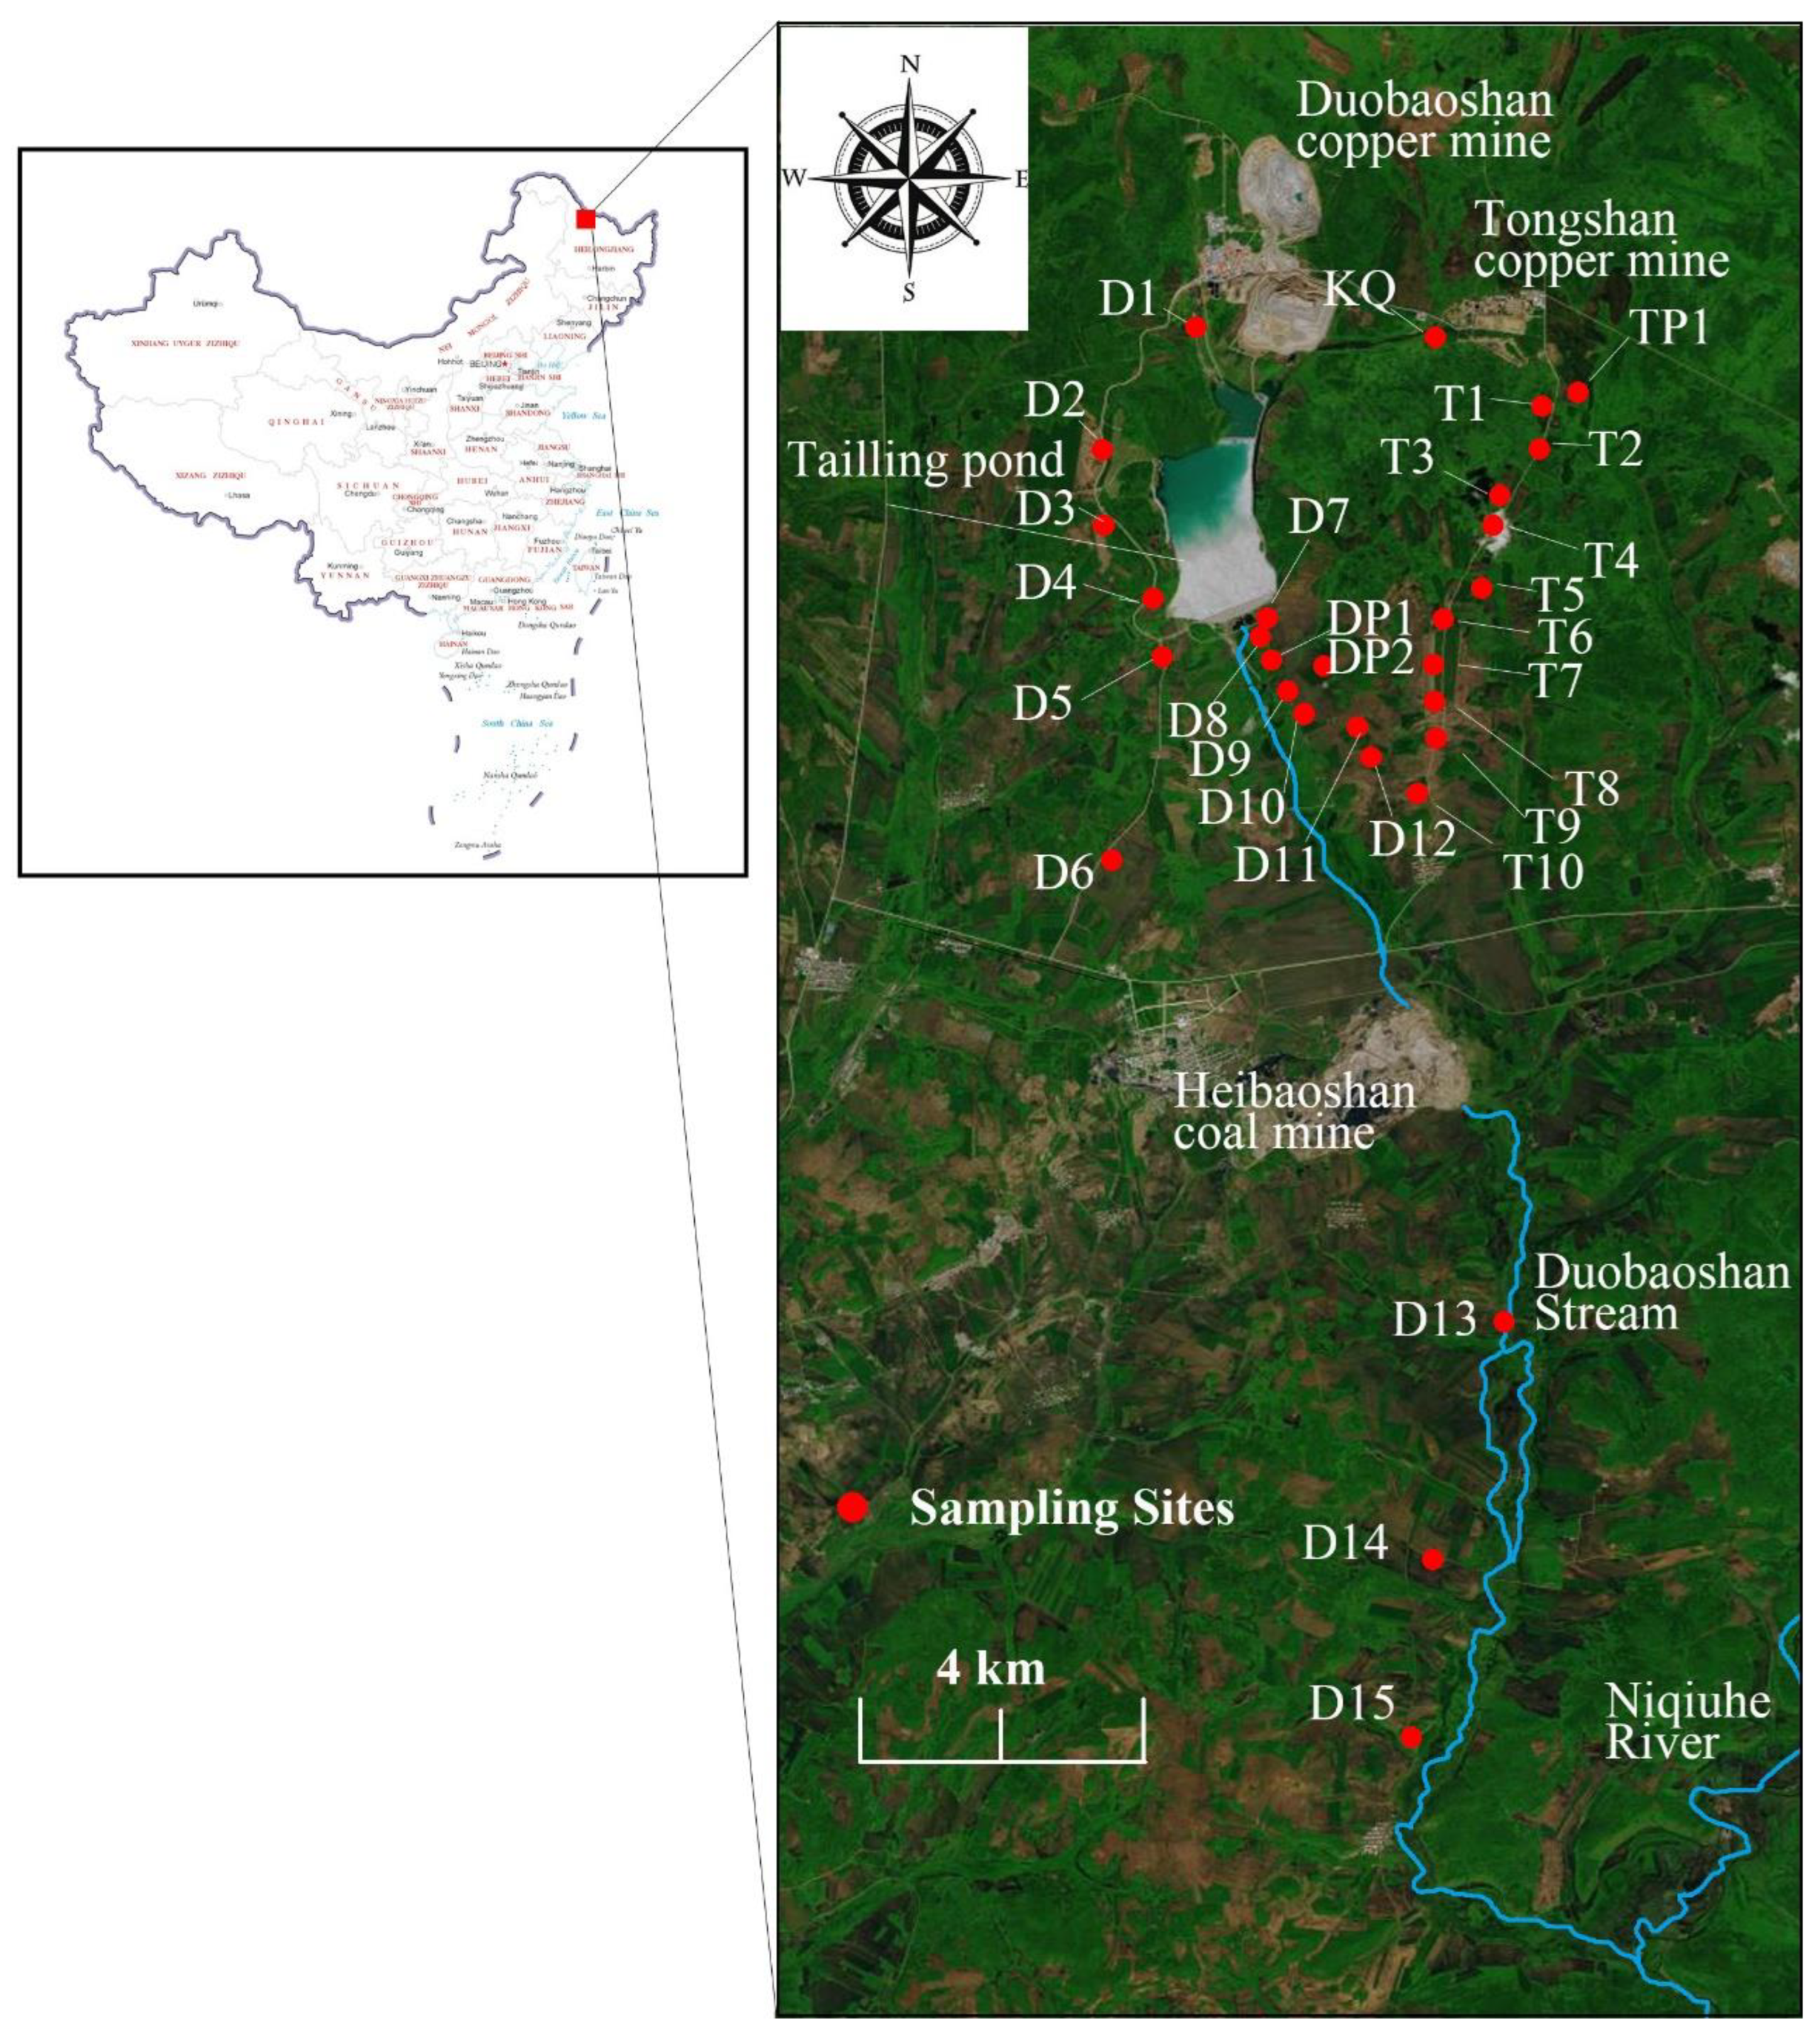
2.1. Study Area and Sampling

Duobaoshan ore-concentration area, located in Heihe district, Northeast China, includes many mines, such as Duobaoshan copper mine (DM) and Tongshan copper mine (TM). The proven reserves of copper, molybdenum, and gold amount to 335 Mt, 15 Mt, and 73 t in Duobaoshan copper mine and Tongshan copper mine, respectively [18]. The major ore minerals are pyrite, chalcopyrite, bornite, molybdenite, sphalerite, and galena. Beneficiation of copper ore through flotation is the general rule for the mines. Tailings generated from Duobaoshan copper mine and Tongshan copper mine are discharged into a tailings pond located about 5 km south of Duobaoshan copper mine. There is a coal mine 10 km southeast of Duobaoshan copper mine. Duobaoshan stream begins in Duobaoshan copper mine and flows from north to south across the tailings pond and Heibaoshan coal mine, finally into Niqiuhe River. The region has a cold temperate monsoon climate, with average annual temperature and rainfall of −1.3–0.4 °C and 500–550 mm. Chernozem is dominant in the studied area. In 2019, the population of the region was over 460,000, and the agricultural production was 1,615,000 t (http://www.nenjiang.gov.cn/system/202006/177342.html, accessed on 1 January 2022) (Figure 1).
The sampling of soils and crops was performed in September 2018, and all soils and crops were collected at the same time. Twelve soil samples (D1–D12, 0–20 cm) were collected from farmland along the downstream of Duobaoshan copper mine. The distances between soil sampling sites of D7, D8, D9, D10, D11, D12, and tailings pond, are 50, 200, 1000, 1600, 2100, and 2600 m, respectively. Ten soil samples (T1–T10, 0–20 cm) were collected 500 m apart from each other along a road of Tongshan copper mine. A soil sample (KQ, 0–20 cm) located in the mining area of Tongshan copper mine was collected. Soil samples of D13, D14, and D15 located downstream of Duobaoshan stream (DDS) were also collected to investigate the impact of Heibaoshan coal mine. The soil samples were air-dried, ground with an agate mortar, and sieved through a 2 mm polyethylene sieve for analysis of physicochemical properties. The subsamples of soils were ground and sieved through a 0.149 mm polyethylene sieve for analysis of metal(loid)s. For assessment of health risk of consuming food crops, food crops (16 soybean-grain samples and 9 wheat-grain samples) were collected at each soil sampling site (except soil of KQ). Soybean grains and wheat grains were washed with deionized water to remove the surface dirt and dried at 105 °C to constant weight. The dried grain samples were ground into a powder for analysis.

2.2. Chemical Analysis

Soil pH was measured with a pH meter (FE20, Mettler-Toledo Inc., Shanghai, China) at a soil-to-water ratio of 1:2.5. Soil organic matter (OM) was measured by K2Cr2O7 oxidation method. Soil cation-exchange capacity (CEC) was determined by the 1 M ammonium acetate methods at pH 7. Particle size distributions were analyzed using a laser particle size analyzer (Microtrac S3500, Microtrac Inc., Montgomery Ville, PA, USA). Total N (TN) was determined using a micro-Kjeldahl digestion method. Total P (TP) was determined using the H2SO4–hydrogen peroxide–hydrofluoric acid method. The soil NH4+-N and NO3-N contents were determined by KCl extraction method. Soil available K (AK) was determined by first extracting with 1.0 mol/L of CH3COONH4 at pH 7.0 followed by using an atomic flame photometer (PinAAcel900H, PerkinElmer, Norwalk, CT, USA). Available phosphorus (Olsen-P) was determined by Olsen method. The methods of soil physicochemical properties were referred to in reference [19].
Weighted soil samples (0.1000 g) were digested with 3 mL HNO3, 1 mL HClO4, and 1 mL HF in closed Teflon vessels for 5 h at 165 °C. After cooling, the vessels were transferred to an electric hot plate (160 °C) to eliminate silicon and any remaining HF. After the white smoke disappeared, samples were removed from the heat, and 1 mL HNO3 was added. Samples were then adjusted to 10 mL with ultrapure water to measure As, Cd, Cr, Cu, Hg, Pb, Zn, Se, Mo, and Mn by inductively coupled plasma mass spectrometry (ICP-MS) (iCAP Qc, Thermo-Fisher Scientific, Bremen, Germany). To ensure analytical quality, geochemical-standard soil samples (GSS-1 and GSS-2) and wheat flour (GBW08503b) provided by National Institute of Standards and Technology, Beijing, China were used to validate the analytical method. The recoveries from the standard samples were acceptable.

2.3. Bioconcentration Factor (BCF)

The BCF of metal(loid)s in the soil to the soybean grains or wheat grains was defined as the ratio of the heavy metal(loid)s concentration in the crops to that in the soil:
BCF = C crop C soil ,

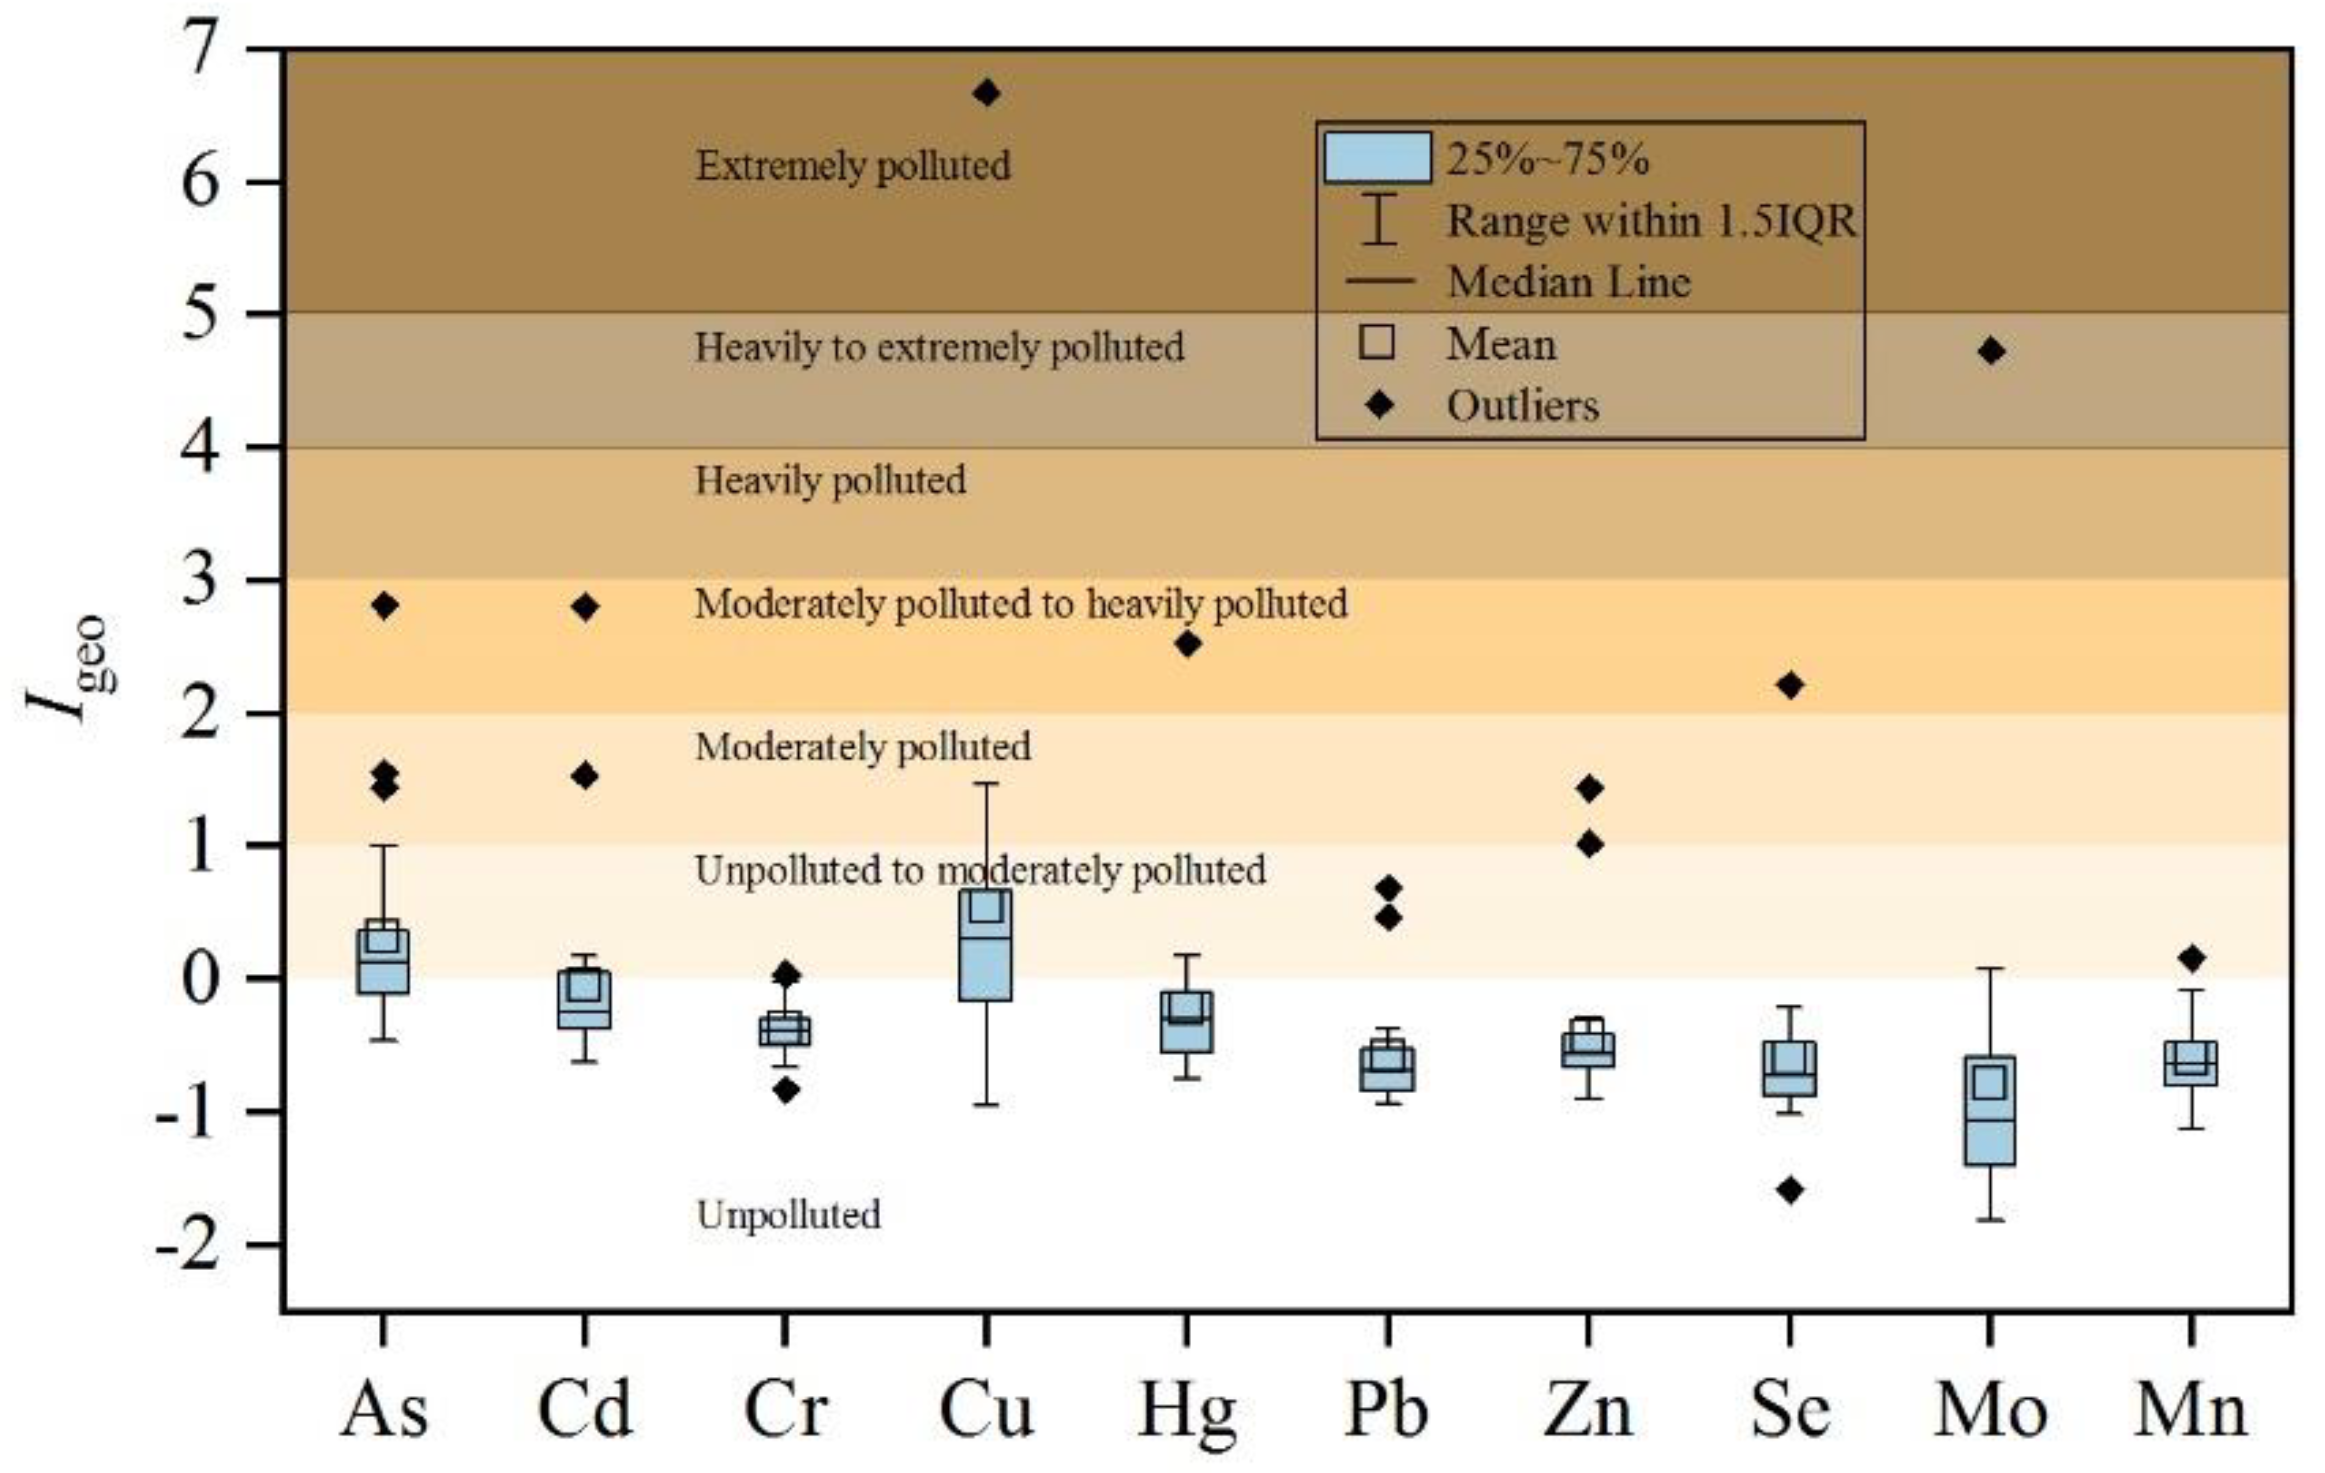
2.4. Environmental Risk Assessment

The geo-accumulation index (Igeo), which compares the heavy metal(loid) contents of soils with background values, was used to quantify heavy metal(loid) pollution using the following equation [20,21]:
I g e o = l o g 2 ( C n 1.5 × B n ) ,
where Cn is the measured concentration of heavy metal(loid) n, Bn is the background value of metal n, and 1.5 is the background matrix correlation factor due to lithogenic variation. The background values of these elements in the soil in Heilongjiang Province used to calculate Igeo were 7.3, 0.086, 58.6, 20.0, 0.037, 24.2, 70.7, 0.195, 1.8, and 1065 mg/kg for As, Cd, Cr, Cu, Hg, Pb, Zn, Se, Mo, and Mn, respectively [22]. Igeo calculations were classified into seven categories: unpolluted, Igeo < 0; unpolluted to moderately polluted, 0 ≤ Igeo < 1; moderately polluted, 1 ≤ Igeo < 2; moderately to heavily polluted, 2 ≤ Igeo < 3; heavily polluted, 3 ≤ Igeo < 4; heavily to extremely polluted, 4 ≤ Igeo < 5; and extremely polluted, Igeo ≥ 5.

2.5. Hazard Quotient (HQ) and Hazard Index (HI)

The HQ was used to express the potential non-cancer risk for individual heavy metal(loid)s [23].
HQ = CDI RfDo
CDI = CF × IR × EF × ED BW × AT
Chronic daily intake (CDI): exposure expressed as the mass of a substance contacted per unit body weight per unit time, averaged over a long period of time; RfDo: safe levels of exposure by oral intake for a lifetime (mg/kg/day); CF: the median concentration of heavy metal(loid)s in soybean grains and wheat grains (mg/kg); IR: the ingestion rate of soybean grains and wheat grains (kg/(person·day)) equal to 470.86 g/(person·day) and 531.53 g/(person·day) for urban and rural adults, respectively, and equal to 46.7 g/(person·day) and 85.4 g/(person·day) for urban and rural children, respectively [24]; EF: exposure frequency (365 days/year); ED: exposure duration (assumed as 70 years for adults and 6 years for children), equivalent to the average lifetime [25]; BW: average body weight (61.6 kg and 18.6 kg for adults and children, respectively [26]); AT: the average exposure time for non-carcinogenic risk (ED × 365 days/year).
If the HQ is less than 1, then there is no obvious non-cancer risk. If HQ is equal to or higher than 1, there may be potential non-cancer risk. The RfDo value represents safe levels of exposure by oral intake for a lifetime. The RfDo values of As, Cd, Cr, Cu, Hg, Pb, Zn, Se, Mo, and Mn were 0.0003, 0.001, 1.5, 0.04, 0.0003, 0.004, 0.3, 0.005, 0.005, and 0.24, respectively [5,6,10,25,27,28].
To assess the overall potential health risk imposed by more than one heavy metal(loid), EPA has proposed an HI based on EPA’s guidelines for health risk assessment of chemical mixtures [29]. This HI is given as:
HI = HQ = CDI 1 RfDo 1 + CDI 2 RfDo 2 + + CDI i RfDo i

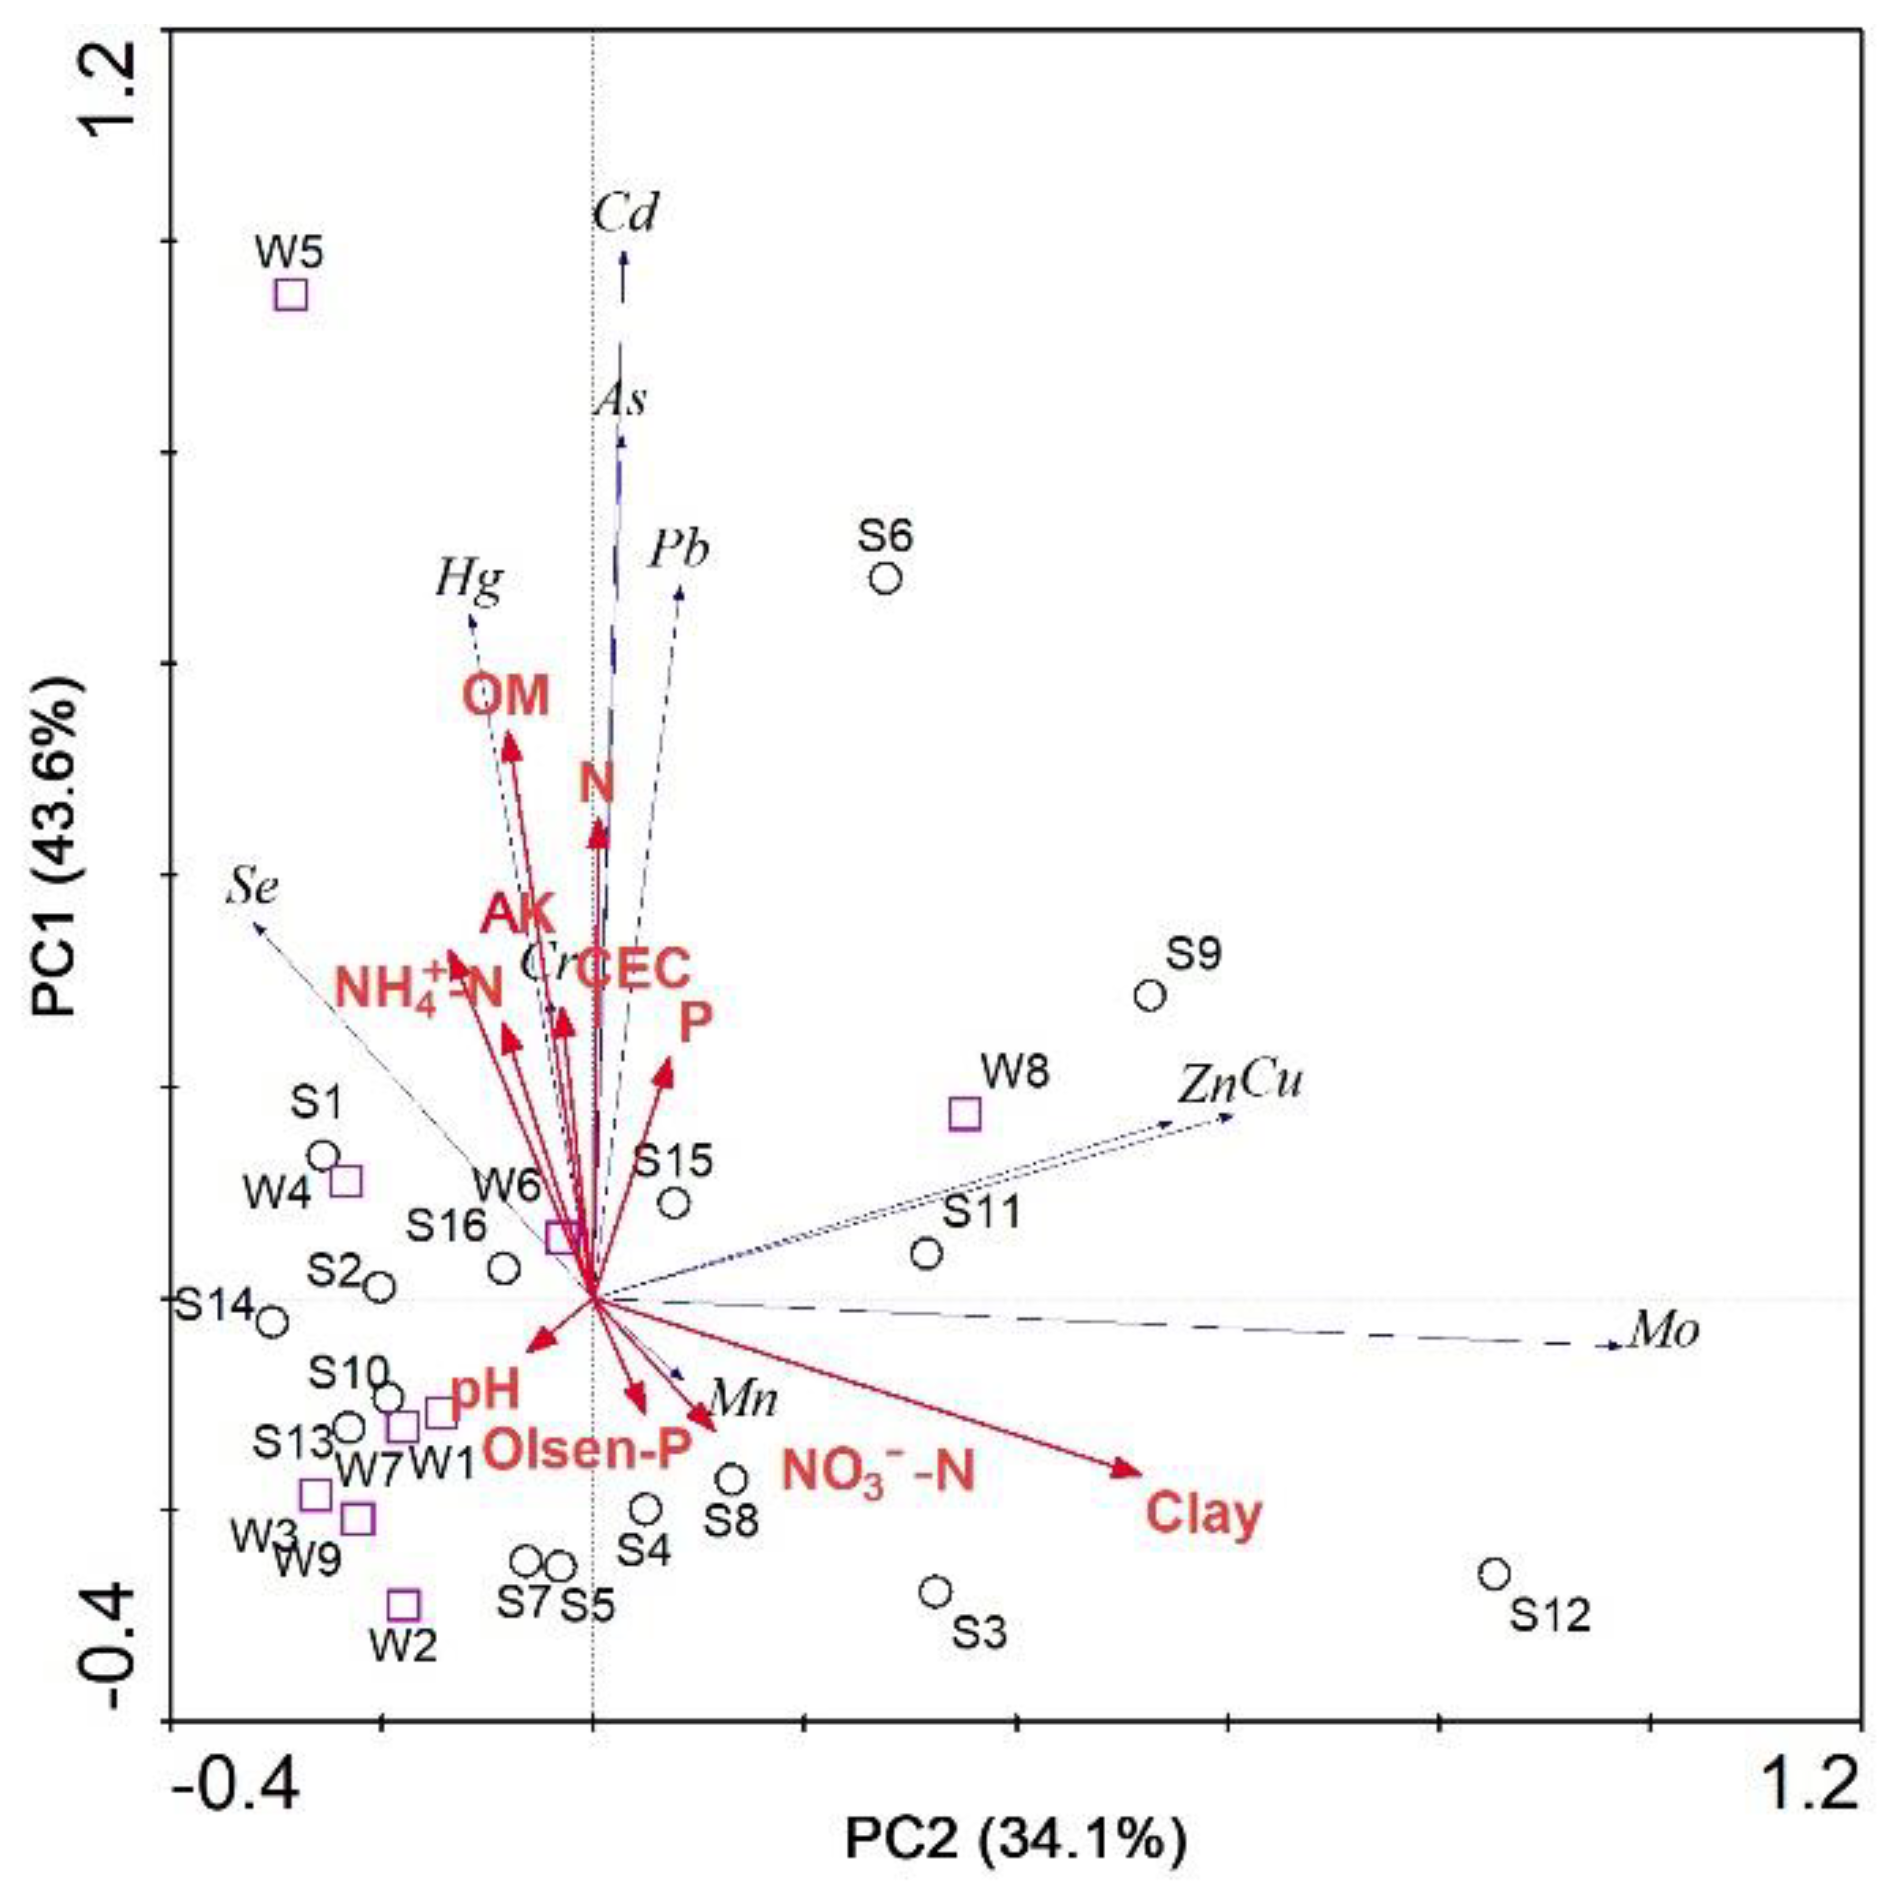
2.6. Multivariate Statistical Analysis

Statistical analyses were performed with the statistical software package SPSS version 20.0 for Windows and CANOCO 4.5. The Kolmogorov–Smirnov (K-S) test was used to evaluate whether the datasets of heavy metal(loid)s in the soil and food crops followed a normal distribution. Datasets of heavy metals in DM soils, TM soils, soybean and wheat grains, and the BCF of soybean and wheat grains were all normal distribution (except Zn of DM soils, Se of soybean BCF, and As of wheat BCF) (Supplementary Materials: Table S1). A Student’s t-test was used to statistically analyze the differences between datasets. PCA was also carried out to identify the source of soil heavy metal(loid)s and find the relationship between BCF and soil physicochemical properties.

3. Results and Discussion

3.1. Physicochemical Properties of Soils

All studied soils were acidic with mean pH values of 5.43 ± 0.16, 5.48 ± 0.21, 5.79 ± 0.41 for DM, TM and DDS, respectively (Table 1). The pH value of soil, collected in Tongshan mining area (KQ), was higher than other soil samples with a value of 6.50. OM contents of soils near the mines (DM, TM and DDS) were higher than that of KQ. Similarly, CEC values of DM, TM and DDS were higher than KQ soil. All soils were silt loam (Supplementary Materials: Figure S1). Soil nutrients were presented in Table S2 (Supplementary Materials). The mean contents of TN in DM, TM and DDS were relatively high with values of 3679 ± 547, 3539 ± 1501 and 4430 ± 1690 mg/kg, respectively. TN of KQ soil was 998 mg/kg and less than other soils. NH4+-N contents in DM, TM, DDS were also slightly higher than that in KQ soil. However, NO3-N contents in the soils of DM, TM, DDS and KQ were comparable. TP in soils of DM, TM, DDS and KQ were 0.17% ± 0.02%, 0.14% ± 0.02%, 0.15% ± 0.03% and 0.14%, respectively. Higher Olsen-P and AK can be found in soils of DM, TM and DDS than that of KQ. Long-term agricultural activities in farmland should be the leading cause of higher OM, TN, NH4+-N, Olsen-P and AK in soils.

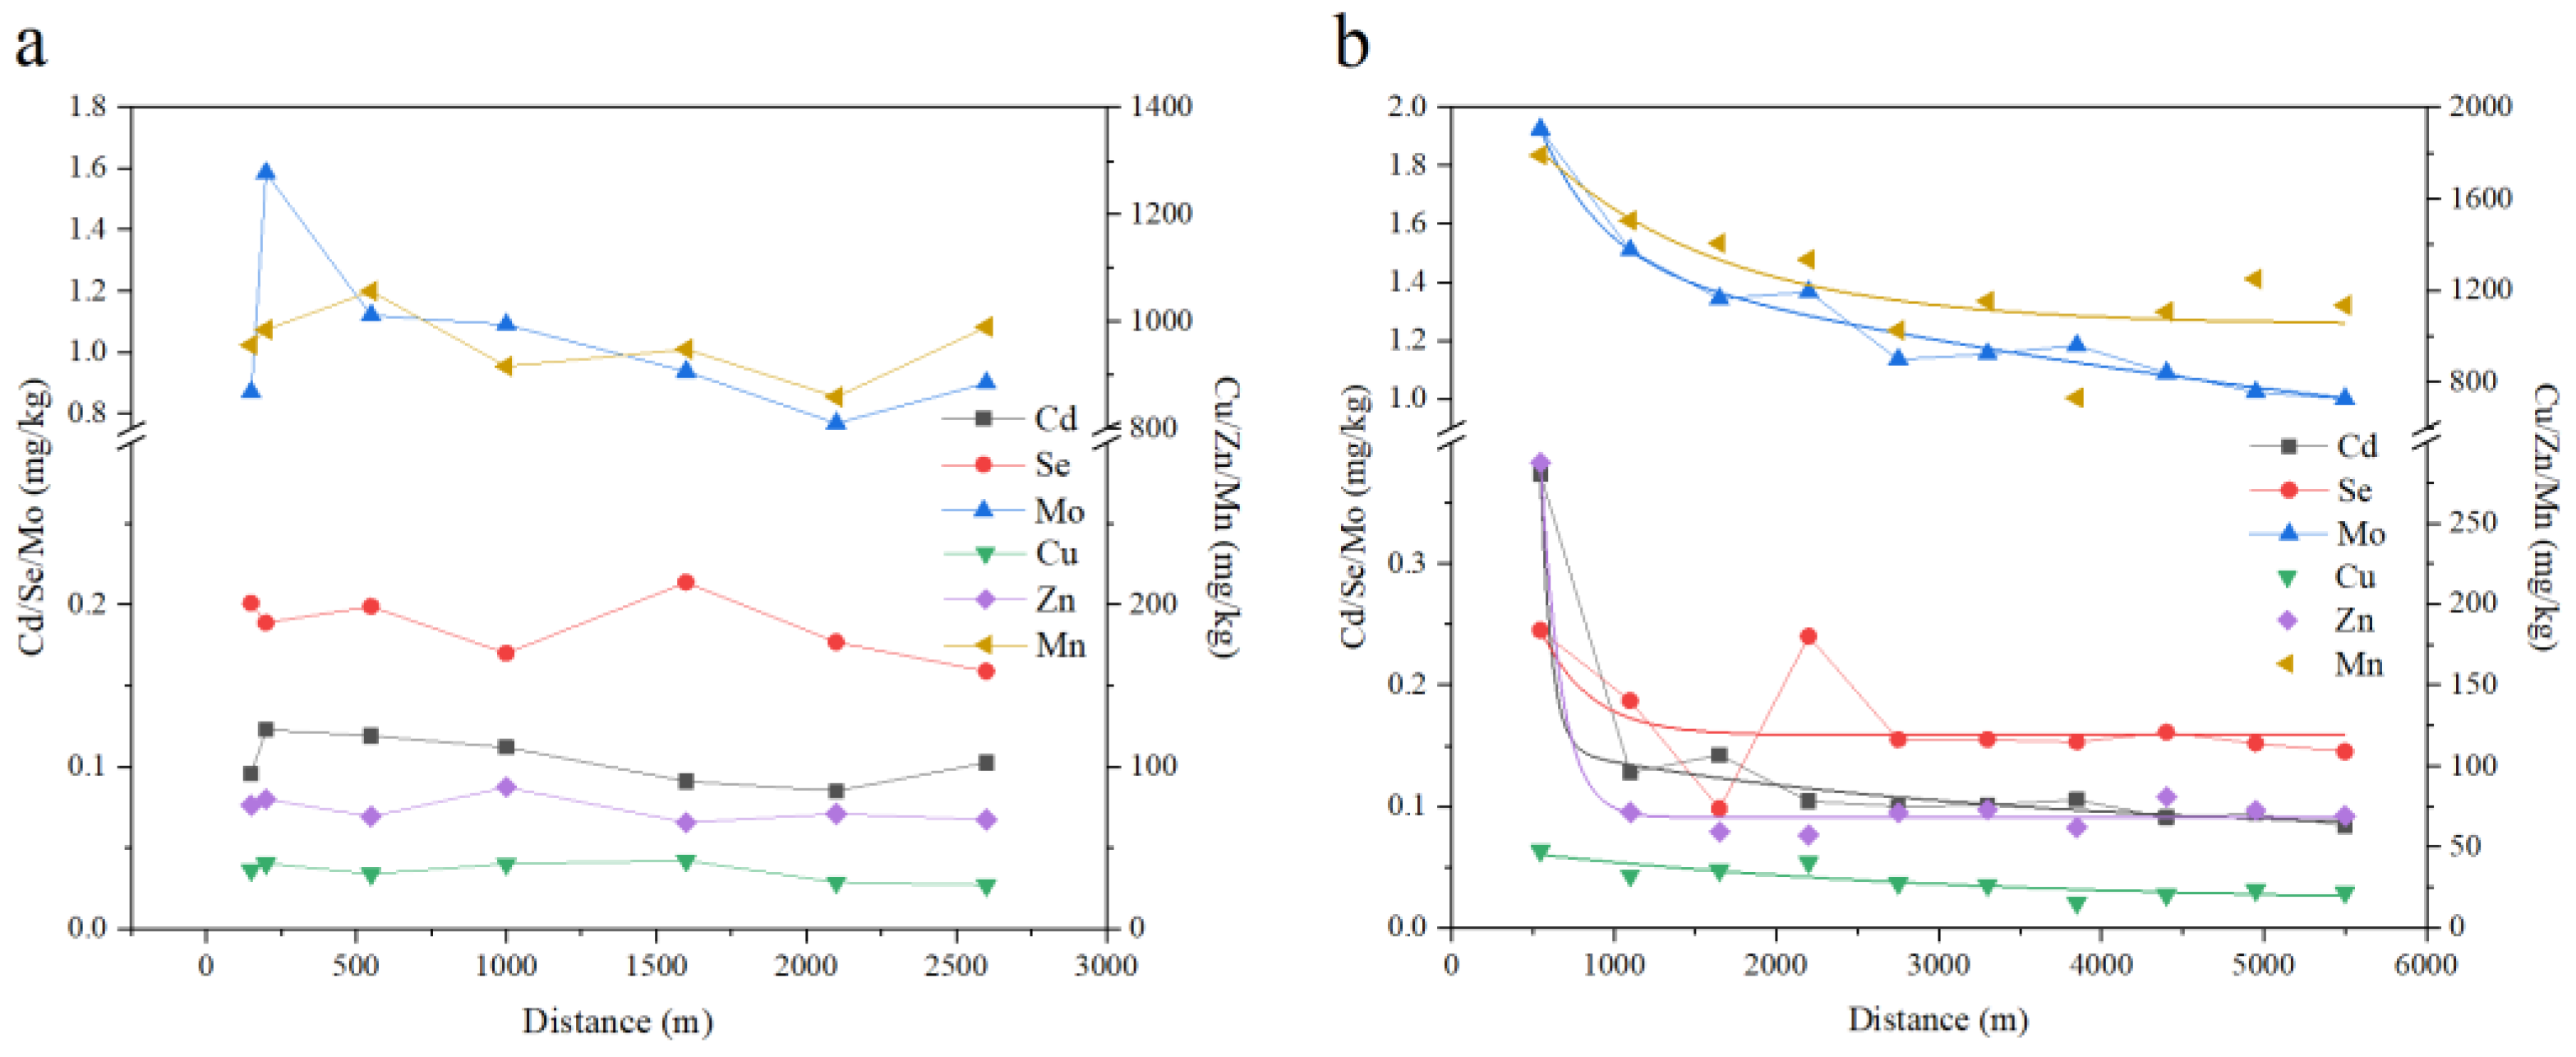
3.2. Heavy Metal(loid)s in Soils

The concentrations of heavy metal(loid)s in soils were presented in Table 2. The mean concentrations of As, Cd, Cr, Hg, Pb, and Zn in the soils of DM were comparable to the background values in the studied area [22] and were all below the risk-screening values of China [30], indicating low environmental risk, with values of 12.08 ± 5.85, 0.11 ± 0.02, 73.70 ± 10.55, 0.045 ± 0.0008, 22.19 ± 3.07, and 74.58 ± 7.34 mg/kg, respectively. However, the coefficient variation (CV) of As was 48.5% and higher than that of other heavy metal(loid)s. The mean concentration of Cu was 53.3 ± 22.1 mg/kg for DM soils. It was worth noting that Cu concentrations in five soil samples were higher than the risk-screening values of China and the CV of Cu was 41.5%. The results indicated that some of the soil samples were polluted. The mean concentrations of Se, Mo, and Mn were 0.190 ± 0.028, 1.59 ± 0.72, and 961.9 ± 101.3 mg/kg, respectively.
Except for Cd and Zn in the TM soils, As, Cr, Cu, Hg, and Pb in all soils of the TM were lower than risk-screening values. Se and Mo concentrations in soils of the TM were comparable with those in soils of the DM (p > 0.05) with mean values of 0.169 ± 0.044 and 1.27 ± 0.28 mg/kg, respectively. However, Mn (1244.4 ± 288.3 mg/kg) in the TM soils was higher than that in the DM soils (p < 0.05). The concentrations of heavy metal(loid)s of three soil samples from DDS were all lower than the risk-screening values, except the As concentration in D14 was 77.42 and higher than the risk-screening value. Se, Mo, and Mn concentrations of soils from DDS were comparable with those of soils from DM (p > 0.05). The result indicated that the agricultural soil downstream of the Heibaoshan coal mine was not subjected to heavy metal pollution by the coal mine. It was noticeable that the soil sample from KQ showed higher Cd, Cu, Hg, Pb, Zn, Se, and Mo. The Cu concentration of KQ soil reached up to 3060.9 mg/kg, indicating that this site soil was extensively affected by mining activities.
As mentioned above, most soil heavy metal(loid)s in the present study were lower than the risk-screening values of China. Nevertheless, a considerable proportion of the soil samples contained higher soil heavy metal(loid)s than the local background values of heavy metals, such as DM soils for Cu, and T1 for As, Cd, Cu, Pb, Zn, and Mn. The results suggested that some soils had been affected by mining activities. Lower soil Cd in the present study than that in Shanxi Province, China and Central Greece can be observed [1], which might result from long-term agricultural activities, such as the application of agrochemicals and fertilizer in Shanxi Province and Central Greece [33]. Cu was more obviously accumulated in some sites (DM soils, T1 soil, and KQ soil) than in other studies [1,32], but concentrations of Pb in DM, TM, and DDS soils were lower than that in Hunan Province (97 mg/kg) [31]. Se, Mo, and Mn are not listed in the soil quality standard of China, but their concentrations were comparable to the background values of soil (except Se in KQ soil), indicating a lower environmental risk.
PCA was performed to identify the sources of soil heavy metal(loid)s (Table 3). Three principal components were obtained, accounting for 74.06% of the total variation. The first principal component PC1 included Cd, Pb, Zn, and Mn, explaining the greatest variance (37.78%). The second principal component PC2 included Cr, Cu, Se, and Mo, accounting for 24.07% of the total variance. The third principal component PC3, explaining 12.20% of the total variance, was significantly related to As and Hg. It was found that soil in the mining area (KQ) contained higher Cd, Cu, Zn, and Mn. Hence, it can be concluded that PC1, i.e., Cd, Pb, Zn, and Mn, were mainly affected by mining activities. Concentrations of As and Hg in the soils were relatively low, indicating that As and Hg were geogenic elements in the studied area. Cu, Se, and Mo concentrations in KQ soil were also extremely high with values of 3060.9, 1.363, and 71.75 mg/kg, respectively. Nevertheless, higher Cr levels were not observed (71.7 mg/kg). The results indicated that mining activities and natural origins both contributed to the accumulation of soil heavy metal(loid)s in PC2.
It has been demonstrated that heavy metal(loid)s from mining activities can be transported with river water or dust, leading to the pollution of soils and sediments by heavy metal(loid)s [11,34,35]. Generally, the concentrations of these heavy metal(loid)s from mines can attenuate with distance. The concentrations of Cd, Cu, Zn, Se, Mo, and Mn, which were affected by mining activities, fluctuated with distance from the tailing pond or mine (Figure 2). However, obviously attenuated patterns of these heavy metal(loid)s were not found. Most soils from DM were mainly collected from the riverbank of the Duobaoshan stream, about 50 m from the stream. More importantly, artificial irrigation is uncommon in the studied area. Thus, some heavy metal(loid)s leaching from the tailings pond in the wet season are difficult to transport to the farmland. The decrease patterns of Cd, Cu, Zn, Mo, and Mn in TM soils with distance can be observed. The attenuated patterns of heavy metal(loid)s were fitted well by the ExpDec2 model and R2 values were 0.990, 0.380, 0.973, 0.746, 0.990, and 0.724 for Cd, Se, Mo, Cu, Zn, and Mn, respectively. In the TM soil, Cd, Cu, Zn, Mo, and Mn ranged from 0.374 to 0.084 mg/kg, 47.6 to 21.8 mg/kg, 287.8 to 69.1 mg/kg, 1.924 to 1.001 mg/kg, and 1789.9 to 1136.0 mg/kg, respectively. Although there is not a river in the TM area, soils from TM were sampled along a road, which is one of the main roads for ore transport. Ore dust generated from ore transport can diffuse to the farmland on both sides of the road [35,36]. It is suggested that the decrease of heavy metal(loid)s in TM soil with distance might result from ore dust diffusion during transport. Mining activities have led to soil pollution by heavy metal(loid)s around the mine area, therefore some works for preventing the diffusion of heavy metal(loid)s, as well as remediation programs, have to be performed.

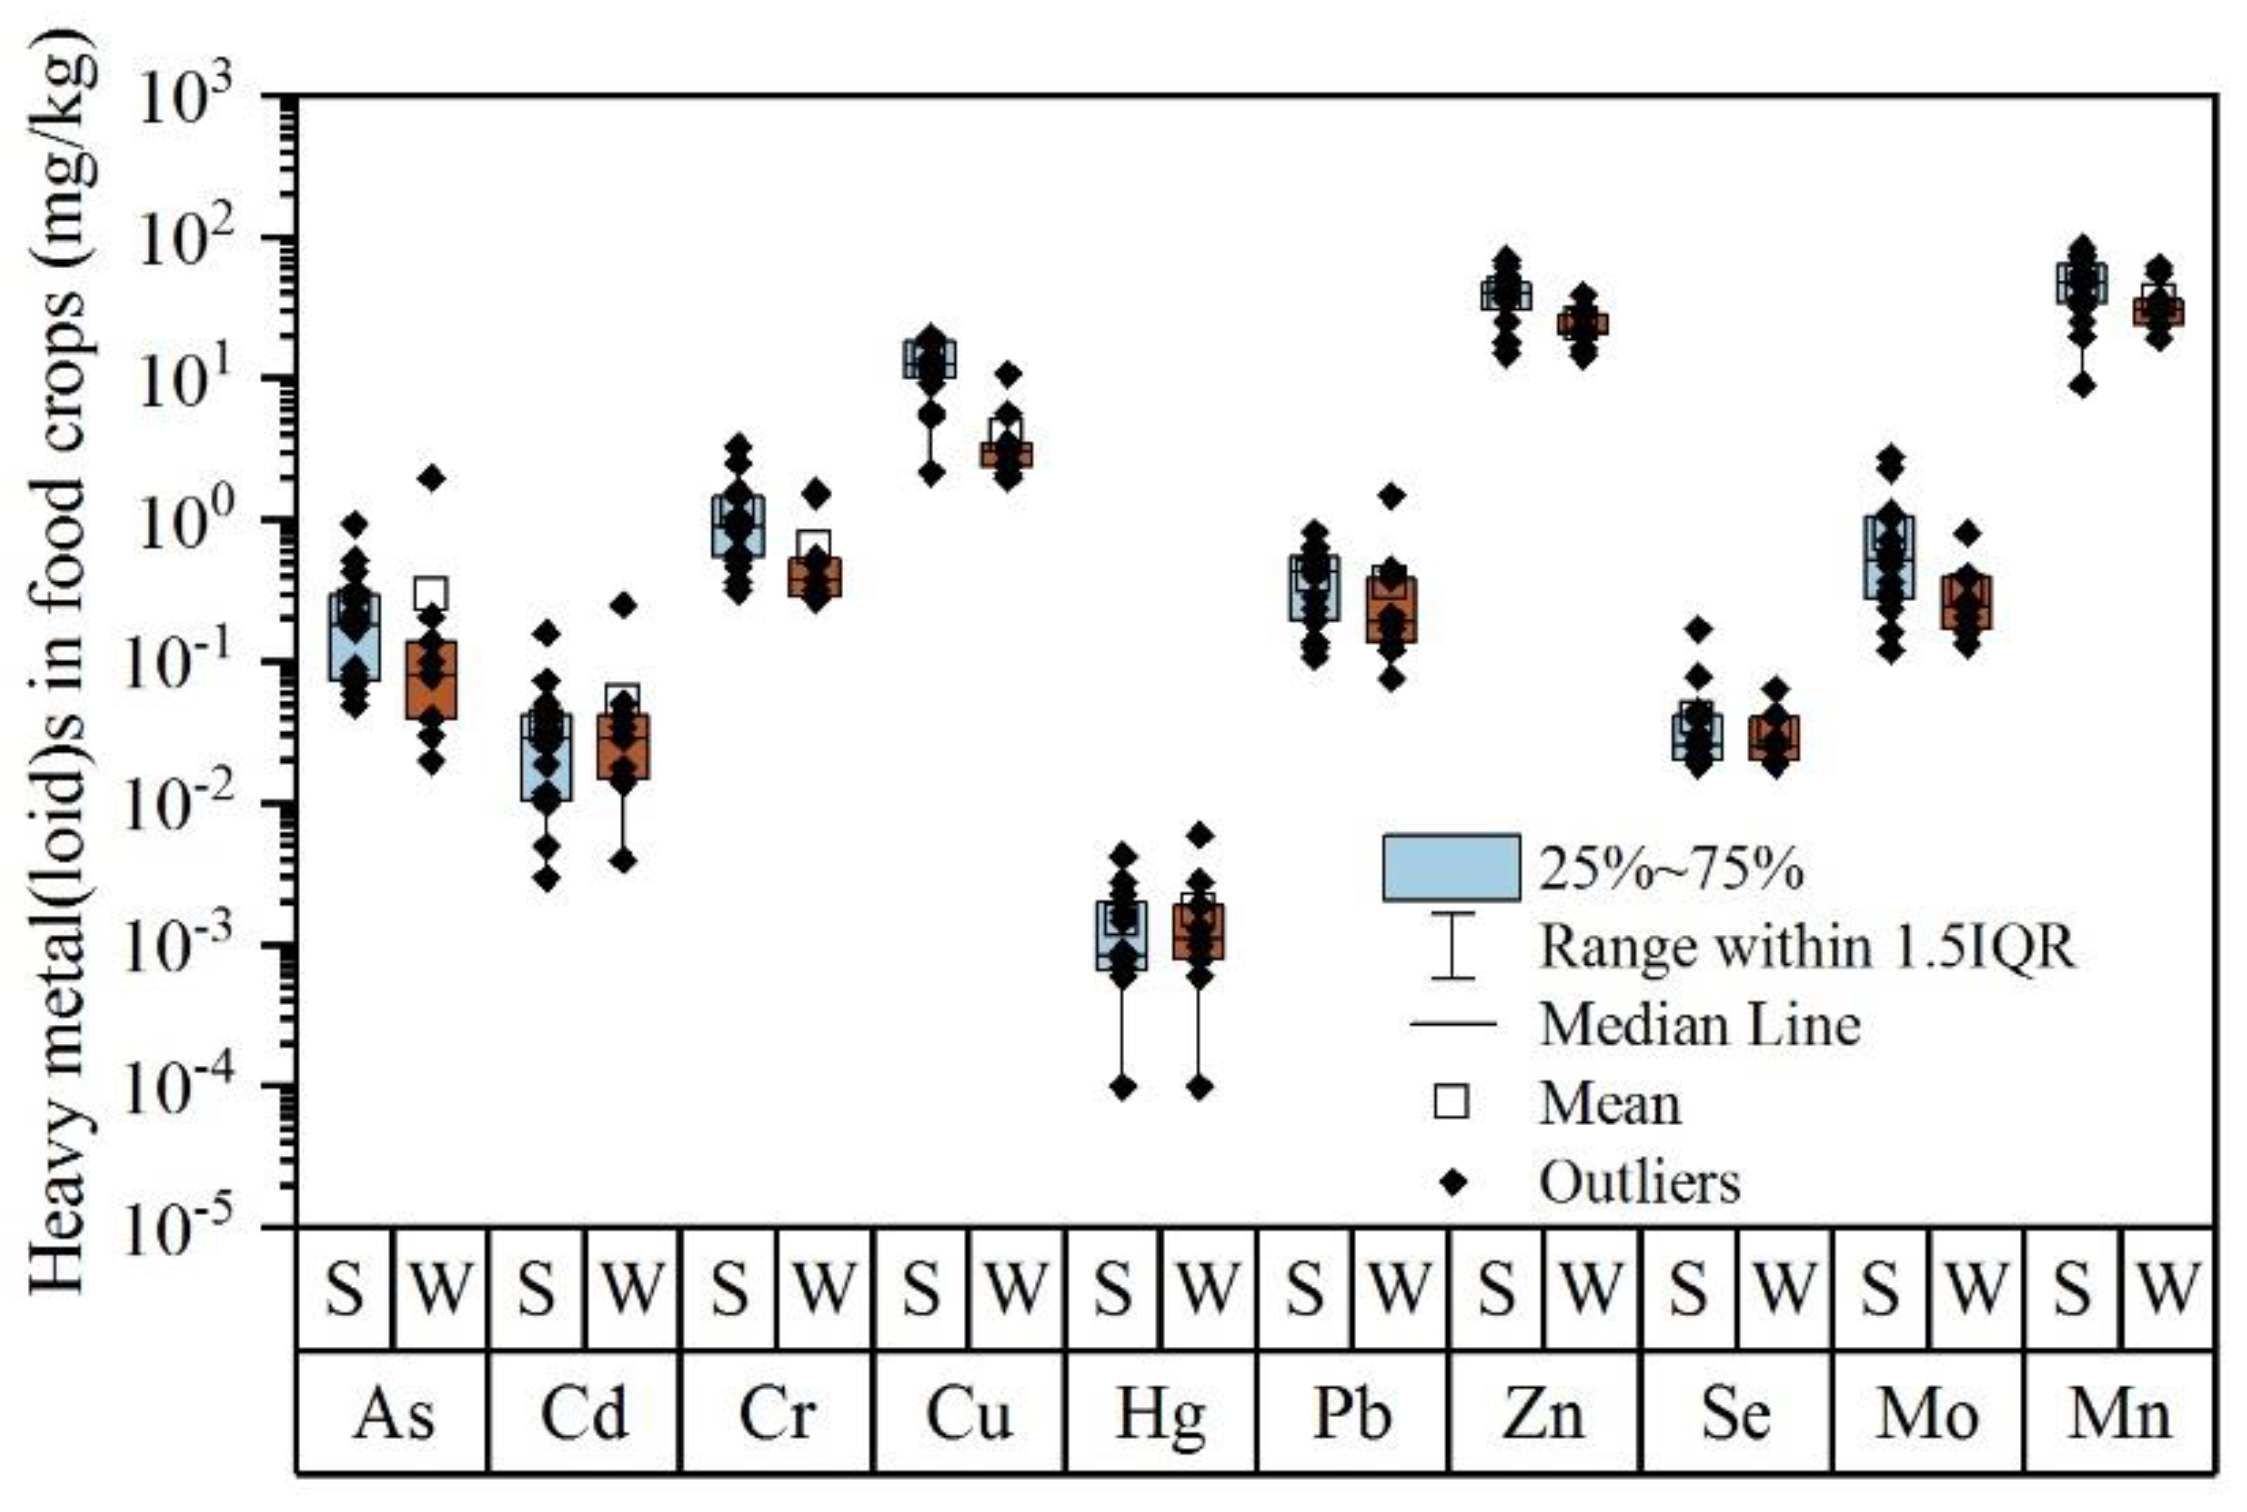
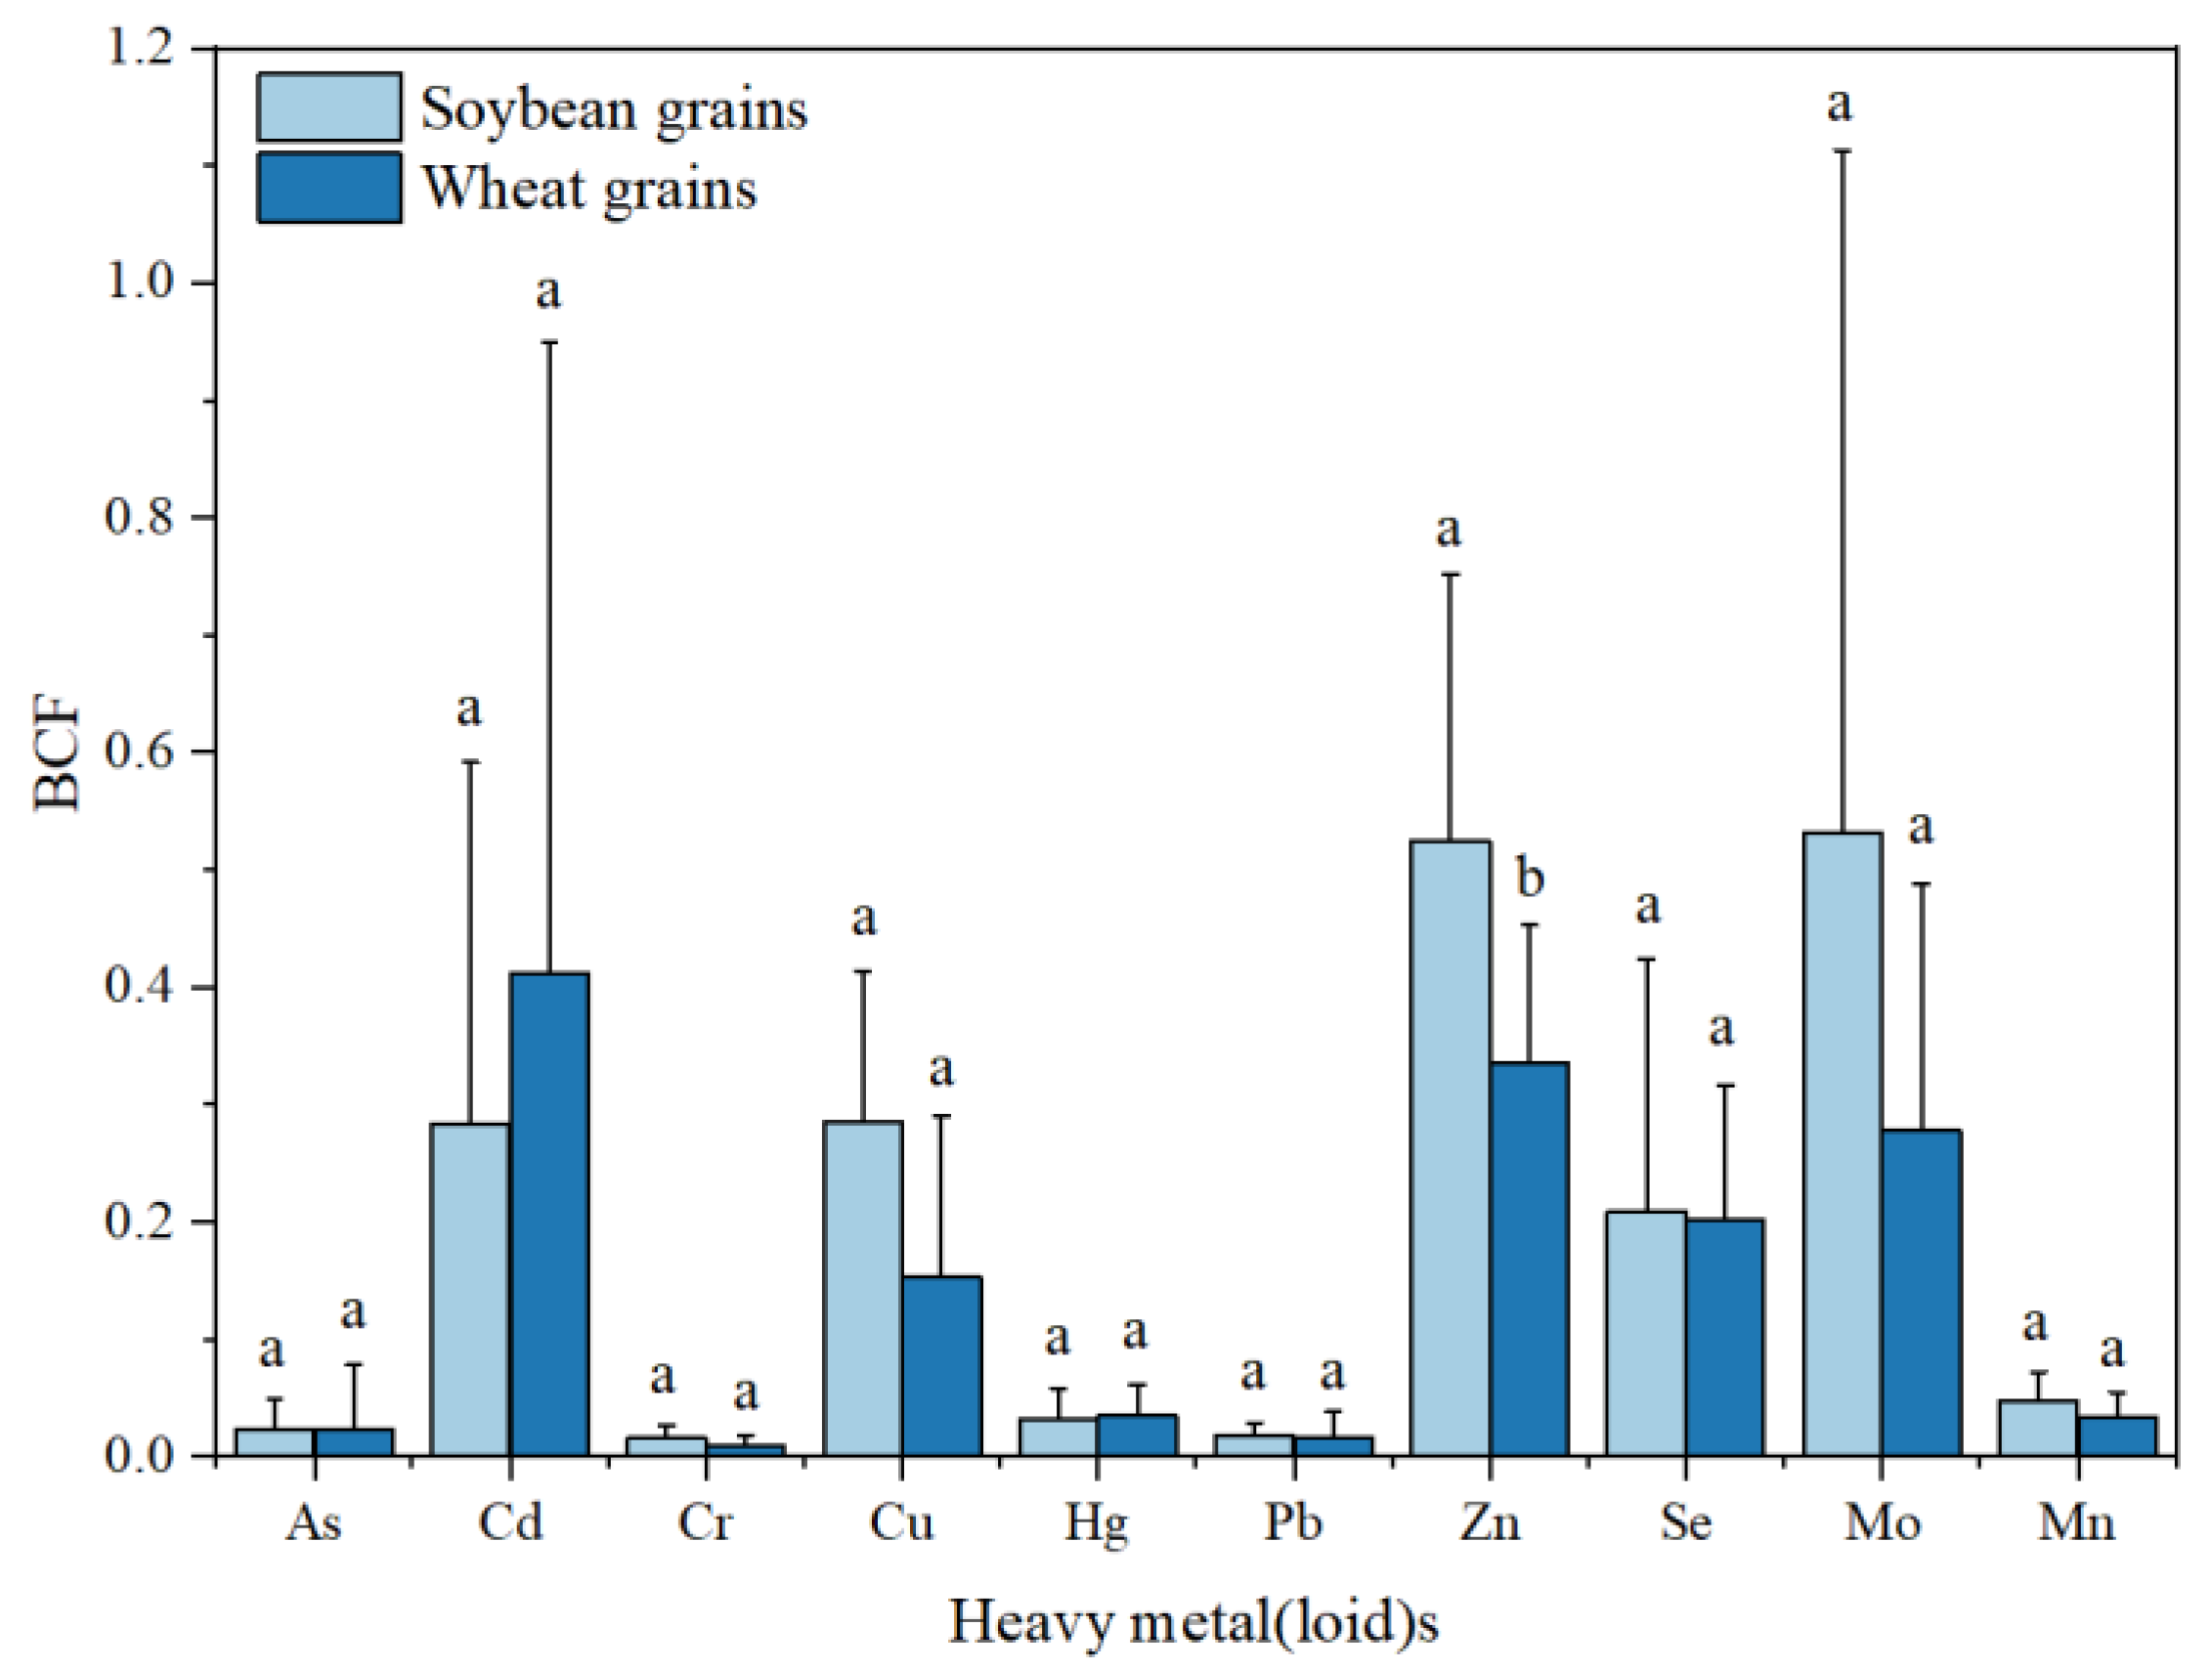
3.3. Heavy Metal(loid)s in Food Crops

Heavy metal(loid)s in food crops w shown in Figure 3. It can be observed that the mean concentrations of heavy metal(loid)s in soybean grains, except As, Cd, and Hg, were higher than in wheat grains (p < 0.05). Cu, Zn, and Mo concentrations in soybean grains were 12.829 ± 5.334, 39.713 ± 15.356, and 0.782 ± 0.768 mg/kg, respectively. Moreover, Cu, Zn, and Mo concentrations in wheat grains were significantly lower than those in soybean grains, with values of 3.952 ± 2.818, 23.906 ± 7.631, and 0.312 ± 0.211 mg/kg, respectively (p < 0.05).
Different heavy metal(loid)s are accumulated in food crops at variable rates depending on various factors, such as the species of plants, the physicochemical features of the soil, and the contents and species of heavy metal(loid)s in the soil, etc., [5]. Most of the BCF values of the crops were lower than 1 except for two BCF values of Cd and one BCF value of Mo (Figure 4). The high standard deviation of BCF values for some heavy metal(loid)s may be caused by the considerable difference of heavy metal(loid)s among soil samples. Although there was no significant difference between soybean grains and wheat grains for most BCF values of heavy metal(loid)s (p > 0.05), the BCF orders of heavy metal(loid)s of soybean grains and wheat grains were different. For soybean, the order of the heavy metal(loid)s on the basis of their BCF mean values was: Mo ≈ Zn > Cu ≈ Cd > Se > Mn > Hg > As > Pb ≈ Cr. All of the BCF mean values of wheat grains were lower than 1 in the order: Cd > Zn > Mo > Se > Cu > Hg ≈ Mn > As > Pb > Cr.
Relatively higher BCF values of external heavy metal(loid)s, i.e., Mo, Zn, Cd, and Cu, can be found, indicating a higher accumulation potential of heavy metal(loid)s in food crops [37]. Mo, Zn, Cu, Cd, Se, and Mn in soils are mainly or partly derived from mining activities. It was reported that higher concentrations of heavy metal(loid)s in soils can lead to more accumulations of them in plants [38,39]. Although some of these external heavy metal(loid)s are essential elements, the excess uptake of them by humans can cause a host of health conditions. Thus, the health risk of Mo, Zn, Cu, Cd, Se, and Mn from consuming food crops should be paid more attention to in the area near Duobaoshan and Tongshan copper mines.
The relationship between BCF and soil nutrients and soil physicochemical properties was shown in Figure 5. The BCF values of non-essential elements, i.e., Se, Hg, Cr, As, Cd, and Pb, were generally grouped together and relatively lower than essential elements (Zn, Cu, Mo, and Mn). More importantly, the same directions of the BCFs of these non-essential elements with some soil nutrients, such as NH4+-N, AK, OM, TN, and TP, can be observed, indicating a stronger positive relationship between the uptake of these heavy metal(loid)s and soil nutrients. Dissolved organic matter in soil, such as humic acid, is an important part of soil, with OM having phenolic and carboxylic functional groups that increase the mobility and availability of heavy metal(loid)s to plants [40]. Chen et al. [41] reported that NH4+-N in the soil can enhance soil acidity, inducing a positive correlation of heavy metals with NH4+-N. The results indicated that soil nutrients are an important factor for the uptake of non-elements by crops.
On the contrary, the BCF values of essential elements (Zn, Cu, Mo, and Mn) were grouped together and showed different directions with soil nutrients and soil physicochemical properties, indicating a weak relationship with them (Figure 5). What is more, the BCF values of these essential elements, except Mn, were relatively higher. Mo, Zn, and Cu are the essential elements for the soybean and wheat [42,43], and their BCF values were therefore relatively higher. Mn is necessary for plant growth as well, and it intervenes in several metabolic processes, mainly in photosynthesis and as an enzyme antioxidant cofactor [44]. However, the BCF values of Mn were not very high, ranging from 0.009 to 0.095 for soybean grains and 0.018 to 0.085 for wheat grains, respectively, which might ascribe to high Mn concentrations in soils (DM: 961.9 ± 101.3 mg/kg; TM: 1244.4 ± 288.3 mg/kg; and DDS: 965.8 ± 158.2 mg/kg). Higher BCF values of the essential elements (Mo, Zn, and Cu) and a weak relationship between their BCF values and soil nutrients may be attributed to the selective uptake of these essential elements by soybean and wheat. The results indicate that the BCF of essential elements was affected less by soil nutrients and soil physicochemical properties than non-essential elements.

3.4. Environmental Risk Assessment and Health Risk of Consuming Soybean Grains and Wheat Grains

The Igeo of soils was shown in Figure 6. Based on the mean values of Igeo, the order of heavy metal pollution from highest to lowest was: Cu (0.54 ± 1.41) > As (0.32 ± 0.71) > Cd (−0.004 ± 0.71) > Hg (−0.22 ± 0.62) > Cr (−0.38 ± 0.21) > Zn (−0.44 ± 0.52) > Pb (−0.59 ± 0.38) ≈ Se (−0.59 ± 0.64) > Mn (−0.60 ± 0.29) > Mo (−0.79 ± 1.23). The mean Igeo values of As and Cu were higher than 1, indicating an unpolluted-to-moderately-polluted level, while other heavy metal(loid)s all presented an unpolluted level. It is worth noting that almost all heavy metal(loid)s in some sites had higher Igeo values. The results indicated that soils in these sampling sites, such as KQ, D1, D3, D5, D6, and T1, were obviously polluted (Igeo > 1). Notably, the Igeo value of Cu in the KQ soil was very high, with a value of 6.67, indicating an extremely polluted level.
The HQs and HIs of individual heavy metal(loid)s for different exposure populations were shown in Table 4. For the soybean grains, except As, the HQ values of heavy metal(loid)s were all lower than 1. The HQ values of As and Mn for consuming wheat grains were both higher than 1. The excess uptake of As in the human body can cause various chronic diseases, such as papillary and cortical necrosis, sink lesions, cirrhosis, melanosis, and black-foot disease [45]. Although Mn as an essential element plays an important role in the enzymes production of the human body, hepatic cirrhosis, polycythemia, hypermagnesemia, dystonia, and parkinsonism-like symptoms have been reported in patients with Mn poisoning [46]. The results suggested that consuming soybean grains and wheat grains can cause an adverse health risk for the residents due to the higher HQs of As and Mn. For different groups of people, the HQs of adults were all lower than that of children. In addition, the HQs of urban people were higher than that of rural people for consuming soybeans, whereas the HQs of urban people were lower for consuming wheat grains. It was due to the difference in dietary structure between urban and rural people.
The HIs for consuming soybean grains were 2.48, 2.74, 2.36, and 2.61 for urban adults, urban children, rural adults, and rural children, respectively. The order of HIs for consuming wheat grains followed: rural children (6.45) > rural adults (5.84) > urban children (5.71) > urban adults (5.17). The HIs were all higher than 1, indicating a high potential health risk from consuming soybean grains and wheat grains from the studied area.

4. Conclusions

Mining activities can generate a significant amount of heavy metal(loid)s, finally leading to severe soil pollution near the mine area and threatening human health. Cd, Cu, Zn, Mo, and Mn in agricultural soil near Duobaoshan and Tongshan copper mines were affected by mining activities, and some sites were polluted heavily. Moreover, these heavy metal(loid)s (except Se) near the Tongshan copper mine were attenuated with distance in the downstream direction. The BCF values of soybean and wheat grains of essential elements, such as Mo, Zn, and Cu, were relatively higher than most non-essential elements. More importantly, the BCF values of non-essential elements were affected more by soil nutrients than those of essential elements. Health risk assessments of consuming food crops suggested that As and Mn can cause a potential adverse health risk for the residents. The HIs values were higher than 1, indicating a high potential health risk from consuming soybean grains and wheat grains for all people groups.

Supplementary Materials

The following supporting information can be downloaded at https://0-www-mdpi-com.brum.beds.ac.uk/article/10.3390/su14052953/s1, Table S1: Kolmogorov–Smirnov (K-S) test of normality for the data sets, Table S2: soil nutrients of soils, Figure S1: ternary diagram for sand–silt–clay distribution of soils.

Author Contributions

D.L. designed the study and drafted the manuscript; G.L. revised and refined the manuscript; X.L., R.L. and Y.Z. contributed to the collection and determination of the samples; J.W. contributed to interpretation of results and refining of manuscript. All authors have read and agreed to the published version of the manuscript.

Funding

This work was financially supported by the National Natural Science Foundation of China (41807134), the Natural Resources Scientific Research Project of the Department of Natural Resources of Henan Province (No. 2019-373), and the Institute of Mineral Resources, CAGS Research Fund (JYYWF20181502).

Institutional Review Board Statement

Not applicable.

Informed Consent Statement

Not applicable.

Data Availability Statement

The data presented in this study are available on request from the corresponding author.

Conflicts of Interest

The authors declare no conflict of interest.

References

  1. Liu, Y.; Ma, Z.; Liu, G.; Jiang, L.; Dong, L.; He, Y.; Shang, Z.; Shi, H. Accumulation risk and source apportionment of heavy metals in different types of farmland in a typical farming area of northern China. Environ. Geochem. Health 2021, 43, 5177–5194. [Google Scholar] [CrossRef] [PubMed]
  2. Shaheen, S.M.; Shams, M.S.; Khalifa, M.R.; El-Dali, M.A.; Rinklebe, J. Various soil amendments and environmental wastes affect the (im)mobilization and phytoavailability of potentially toxic elements in a sewage effluent irrigated sandy soil. Ecotoxicol. Environ. Saf. 2017, 142, 375–387. [Google Scholar] [CrossRef] [PubMed]
  3. Antoniadis, V.; Shaheen, S.M.; Boersch, J.; Frohne, T.; Du Laing, G.; Rinklebe, J. Bioavailability and risk assessment of potentially toxic elements in garden edible vegetables and soils around a highly contaminated former mining area in Germany. J. Environ. Manag. 2017, 186, 192–200. [Google Scholar] [CrossRef] [PubMed]
  4. Giannakis, I.; Emmanouil, C.; Mitrakas, M.; Manakou, V.; Kungolos, A. Chemical and ecotoxicological assessment of sludge-based biosolids used for corn field fertilization. Environ. Sci. Pollut. Res. 2021, 28, 3797–3809. [Google Scholar] [CrossRef]
  5. Sharma, S.; Nagpal, A.K.; Kaur, I. Heavy metal contamination in soil, food crops and associated health risks for residents of Ropar wetland, Punjab, India and its environs. Food Chem. 2018, 255, 15–22. [Google Scholar] [CrossRef]
  6. Zhu, F.; Wang, X.; Fan, W.; Qu, L.; Qiao, M.; Yao, S. Assessment of potential health risk for arsenic and heavy metals in some herbal flowers and their infusions consumed in China. Environ. Monit. Assess. 2013, 185, 3909–3916. [Google Scholar] [CrossRef]
  7. Godt, J.; Scheidig, F.; Grosse-Siestrup, C.; Esche, V.; Brandenburg, P.; Reich, A.; Groneberg, D.A. The toxicity of cadmium and resulting hazards for human health. J. Occup. Med. Toxicol. 2006, 1, 22. [Google Scholar] [CrossRef] [Green Version]
  8. Järup, L.; Berglund, M.; Elinder, C.G.; Nordberg, G.; Vahter, M. Health effects of cadmium exposure—A review of the literature and a risk estimate. Scand. J. Work. Environ. Health 1998, 24 (Suppl. S1), 1–51. [Google Scholar]
  9. Kalembkiewicz, J.; Sitarz-Palczak, E.; Zapała, L. A study of the chemical forms or species of manganese found in coal fly ash and soil. Microchem. J. 2008, 90, 37–43. [Google Scholar] [CrossRef]
  10. Pipoyan, D.; Stepanyan, S.; Stepanyan, S.; Beglaryan, M.; Merendino, N. Health Risk Assessment of Potentially Toxic Trace and Elements in Vegetables Grown Under the Impact of Kajaran Mining Complex. Biol. Trace Elem. Res. 2019, 192, 336–344. [Google Scholar] [CrossRef]
  11. Wang, J.; Liu, G.; Wu, H.; Zhang, T.; Liu, X.; Li, W. Temporal-spatial variation and partitioning of dissolved and particulate heavy metal(loid)s in a river affected by mining activities in Southern China. Environ. Sci. Pollut. Res. 2018, 25, 9828–9839. [Google Scholar] [CrossRef] [PubMed]
  12. Punia, A. Role of temperature, wind, and precipitation in heavy metal contamination at copper mines: A review. Environ. Sci. Pollut. Res. 2021, 28, 4056–4072. [Google Scholar] [CrossRef] [PubMed]
  13. Rodríguez, L.; Ruiz, E.; Alonso-Azcárate, J.; Rincón, J. Heavy metal distribution and chemical speciation in tailings and soils around a Pb-Zn mine in Spain. J. Environ. Manag. 2009, 90, 1106–1116. [Google Scholar] [CrossRef] [PubMed]
  14. Vest, K.E.; Hashemi, H.F.; Cobine, P.A. The copper metallome in eukaryotic cells. In Metallomics and the Cell; Springer: Dordrecht, The Netherlands, 2013; pp. 451–478. [Google Scholar]
  15. Cherasse, Y.; Urade, Y. Dietary Zinc Acts as a Sleep Modulator. Int. J. Mol. Sci. 2017, 18, 2334. [Google Scholar] [CrossRef] [Green Version]
  16. Enemark, J.H.; Cooney, J.J.A.; Wang, J.-J.; Holm, R.H. Synthetic Analogues and Reaction Systems Relevant to the Molybdenum and Tungsten Oxotransferases. Chem. Rev. 2004, 104, 1175–1200. [Google Scholar] [CrossRef]
  17. Law, N.A.; Caudle, M.T.; Pecoraro, V.L. Manganese Redox Enzymes and Model Systems: Properties, Structures, and Reactivity. In Advances in Inorganic Chemistry; Sykes, A.G., Ed.; Academic Press: Cambridge, MA, USA, 1998; Volume 46, pp. 305–440. [Google Scholar]
  18. Zhao, Y.; Wang, J.; Zhao, G.; Cui, Y. Metallogenic regularity and prospecting direction of Duobaoshan ore field, Heilongjiang province, China. J. Jilin Univ. 2011, 41, 1676–1688. [Google Scholar]
  19. Institute of Soil Science, Chinese Academy of Sciences. An Analyses of Soil Physico-Chemical Property; Shanghai Scientific and Technical Press: Shanghai, China, 1978. (In Chinese) [Google Scholar]
  20. Muller, G. Index of geoaccumulation in sediments of the Rhine River. Geojournal 1969, 2, 108–118. [Google Scholar]
  21. Sachithanandam, V.; Parthasarathy, P.; Elangovan, S.S.; Kasilingam, K.; Dhivya, P.; Mageswaran, T.; Mohan, P.M. A baseline study on trace metals concentration and its ecological risk assessment from the coast of South Andaman Island, India. Reg. Stud. Mar. Sci. 2020, 36, 101242. [Google Scholar] [CrossRef]
  22. CNEMC. The Backgrounds of Soil Environment in China; China Environment Science Press: Beijing, China, 1990. [Google Scholar]
  23. USEPA. Risk Assessment Guidance for Superfund. Volume I: Human Health Evaluation Manual (Part A); EPA/540/1-89/002; Office of Emergency and Remedial Response: Washington, DC, USA, 1989.
  24. Xu, L.; Yan, S.; He, W.; Qin, A.; Zhao, F. Study on influence of resident’ income level on diet structure in Heilongjiang. Chin. J. Public Health Manag. 2020, 36, 176–189. [Google Scholar]
  25. Huang, M.; Zhou, S.; Sun, B.; Zhao, Q. Heavy metals in wheat grain: Assessment of potential health risk for inhabitants in Kunshan, China. Sci. Total Environ. 2008, 405, 54–61. [Google Scholar] [CrossRef]
  26. Zhu, Y.E.; Zhao, Y.; Sun, K.; Chen, Z.F.; Qiao, J.J.; Ji, Y.Q. Heavy metals in wheat grain and soil: Assessment of the potential health risk for inhabitants in a sewage-irrigated area of Beijing, China. Fresenius Environ. Bull. 2011, 20, 1109–1116. [Google Scholar]
  27. Copat, C.; Vinceti, M.; D’Agati, M.G.; Arena, G.; Mauceri, V.; Grasso, A.; Fallico, R.; Sciacca, S.; Ferrante, M. Mercury and selenium intake by seafood from the Ionian Sea: A risk evaluation. Ecotoxicol. Environ. Saf. 2014, 100, 87–92. [Google Scholar] [CrossRef] [PubMed]
  28. USEPA. Risk Based Screening Table-Generic, Summary Table; United States Environmental Protection Agency: Washington, DC, USA, 2015.
  29. USEPA. Guidelines for the Health-Risk Assessment of Chemical Mixtures; Register, F., Ed.; Federal Register: Washington, DC, USA, 1986; Volume 51, pp. 34014–34025.
  30. MEE. Soil Environmental Quality Risk Control Standard for Soil Contamination of Agricultural Land (GB15618-2018); MEE: Beijing, China, 2018. [Google Scholar]
  31. Xu, Y.; Shi, H.; Fei, Y.; Wang, C.; Mo, L.; Shu, M. Identification of Soil Heavy Metal Sources in a Large-Scale Area Affected by Industry. Sustainability 2021, 13, 511. [Google Scholar] [CrossRef]
  32. Golia, E.E.; Dimirkou, A.; Floras, S.A. Spatial monitoring of arsenic and heavy metals in the Almyros area, Central Greece. Statistical approach for assessing the sources of contamination. Environ. Monit. Assess. 2015, 187, 399. [Google Scholar] [CrossRef] [PubMed]
  33. Sun, C.; Liu, J.; Wang, Y.; Sun, L.; Yu, H. Multivariate and geostatistical analyses of the spatial distribution and sources of heavy metals in agricultural soil in Dehui, Northeast China. Chemosphere 2013, 92, 517–523. [Google Scholar] [CrossRef]
  34. Liu, Y.; Cui, J.; Peng, Y.; Lu, Y.; Yao, D.; Yang, J.; He, Y. Atmospheric deposition of hazardous elements and its accumulation in both soil and grain of winter wheat in a lead-zinc smelter contaminated area, Central China. Sci. Total Environ. 2020, 707, 135789. [Google Scholar] [CrossRef]
  35. Balabanova, B.; Stafilov, T.; Šajn, R.; Bačeva, K. Distribution of Chemical Elements in Attic Dust as Reflection of Their Geogenic and Anthropogenic Sources in the Vicinity of the Copper Mine and Flotation Plant. Arch. Environ. Contam. Toxicol. 2011, 61, 173–184. [Google Scholar] [CrossRef] [Green Version]
  36. Alsbou, E.M.E.; Al-Khashman, O.A. Heavy metal concentrations in roadside soil and street dust from Petra region, Jordan. Environ. Monit. Assess. 2017, 190, 48. [Google Scholar] [CrossRef]
  37. Chang, C.Y.; Yu, H.Y.; Chen, J.J.; Li, F.B.; Zhang, H.H.; Liu, C.P. Accumulation of heavy metals in leaf vegetables from agricultural soils and associated potential health risks in the Pearl River Delta, South China. Environ. Monit. Assess. 2013, 186, 1547–1560. [Google Scholar] [CrossRef] [Green Version]
  38. Kasowska, D.; Gediga, K.; Spiak, Z. Heavy metal and nutrient uptake in plants colonizing post-flotation copper tailings. Environ. Sci. Pollut. Res. 2018, 25, 824–835. [Google Scholar] [CrossRef] [Green Version]
  39. Wang, S.; Wu, W.; Liu, F.; Liao, R.; Hu, Y. Accumulation of heavy metals in soil-crop systems: A review for wheat and corn. Environ. Sci. Pollut. Res. 2017, 24, 15209–15225. [Google Scholar] [CrossRef] [PubMed]
  40. Khan, A.; Khan, S.; Khan, M.A.; Qamar, Z.; Waqas, M. The uptake and bioaccumulation of heavy metals by food plants, their effects on plants nutrients, and associated health risk: A review. Environ. Sci. Pollut. Res. 2015, 22, 13772–13799. [Google Scholar] [CrossRef] [PubMed]
  41. Chen, B.; Tan, S.; Zeng, Q.; Wang, A.; Zheng, H. Soil nutrient heterogeneity affects the accumulation and transfer of cadmium in Bermuda grass (Cynodon dactylon (L.) pers.). Chemosphere 2019, 221, 342–348. [Google Scholar] [CrossRef] [PubMed]
  42. Imtiaz, M.; Rashid, A.; Khan, P.; Memon, M.Y.; Aslam, M. The role of micronutrients in crop production and human health. Pak. J. Bot. 2010, 42, 2565–2578. [Google Scholar]
  43. Arnon, D.I.; Stout, P.R. Molybdenum as an essential element for higher plants. Plant Physiol. 1939, 14, 599–602. [Google Scholar] [CrossRef] [Green Version]
  44. Millaleo, R.; Reyes-Díaz, M.; Ivanov, A.; Mora, M.; Alberdi, M. Manganese as essential and toxic element for plants: Transport, accumulation and resistance mechanisms. J. Soil Sci. Plant Nutr. 2010, 10, 470–481. [Google Scholar] [CrossRef] [Green Version]
  45. Amen, R.; Bashir, H.; Bibi, I.; Shaheen, S.M.; Niazi, N.K.; Shahid, M.; Hussain, M.M.; Antoniadis, V.; Shakoor, M.B.; Al-Solaimani, S.G.; et al. A critical review on arsenic removal from water using biochar-based sorbents: The significance of modification and redox reactions. Chem. Eng. J. 2020, 396, 125195. [Google Scholar] [CrossRef]
  46. Chen, P.; Bornhorst, J.; Aschner, M.A. Manganese metabolism in humans. Front. Biosci. 2018, 23, 1655–1679. [Google Scholar] [CrossRef] [Green Version]
Figure 1. Locations of the study area and sampling sites.
Sustainability 14 02953 g001
Figure 2. Fluctuations of heavy metal(loid)s in soils with distance from tailing pond (DM) or mine (TM). (a) Duobaoshan copper mine; (b) Tongshan copper mine. TM data was fitted by ExpDec2 and DM date fitted unsuccessfully by ExpDec2.
Sustainability 14 02953 g002
Figure 3. Heavy metal(loid)s in food crops (mg/kg). S: soybean grains; W: wheat grains.
Sustainability 14 02953 g003
Figure 4. Bioconcentration factor (BCF) values of five heavy metal(loid)s. Soybean grains: n = 16, wheat grains: n = 9. Different letters within the same heavy metal(loid)s indicate significant differences (p < 0.05).
Sustainability 14 02953 g004
Figure 5. PCA triplot of BCF and soil nutrients and soil physicochemical properties. Wheat grains: W1–W9; soybean grains: S1–S16.
Sustainability 14 02953 g005
Figure 6. Igeo of surface soils.
Sustainability 14 02953 g006
Table 1. Physicochemical properties of soils.
Studied AreaStatistical ValuespHOM
(%)
CEC
(cmol/kg)
Clay
(%)
Silt
(%)
Sand
(%)
Duobaoshan mine (DM, n = 12)Min.5.214.6422.920.8869.7819.93
Max.5.808.1032.002.9477.1428.65
Mean.5.436.9328.271.6773.8524.48
S.D.0.160.962.820.621.902.36
CV 1 (%)2.913.910.037.42.69.6
Tongshan mine (TM, n = 10)Min.5.204.8419.110.2462.3810.19
Max.5.8014.7836.9016.6379.0537.39
Mean.5.487.5727.234.5773.7121.72
S.D.0.213.435.654.885.748.81
CV 1 (%)3.845.420.8106.87.840.6
Downstream of Duobaoshan stream (DDS, n = 3)Min.5.506.0225.660.0157.9924.09
Max.6.2611.1234.901.8174.1042.00
Mean.5.797.7628.790.8066.6032.61
S.D.0.412.915.290.928.118.99
CV 1 (%)7.137.518.4116.012.227.6
Tongshan mining area (KQ, n = 1) 6.502.8818.3712.3875.8611.76
Notes: 1 Coefficient variation.
Table 2. Concentrations of heavy metal(loid)s in soils (mg/kg).
Studied AreaStatistical ValuesAsCdCrCuHgPbZnSeMoMn
DM (n = 12)Min.7.930.0956.226.90.03419.064.40.1590.77859
Max.29.840.1590.783.00.06328.087.30.2542.841221.6
Mean.12.080.1173.753.30.04522.274.60.1901.59961.9
S.D.5.850.0210.622.10.0083.17.30.0280.72101.3
CV 1 (%)48.516.514.341.518.213.89.814.545.110.5
TM (n = 10)Min.10.630.0855.815.50.03320.457.40.0981.00732.6
Max.19.810.3768.947.60.06258.6287.80.2451.921789.9
Mean.12.780.1362.529.10.04726.990.40.1691.271244.4
S.D.2.820.094.39.90.0111.369.70.0440.28288.3
CV 1 (%)22.165.46.934.021.441.877.126.322.023.2
DDS (n = 3)Min.13.810.1049.522.70.03820.056.70.1760.92786.5
Max.77.420.1482.337.50.04525.380.30.2111.801085.5
Mean.41.120.1265.430.70.04122.568.80.1971.32965.8
S.D.32.750.0216.47.50.0042.711.80.0190.44158.1
CV 1 (%)79.616.925.124.38.811.817.29.533.616.4
KQ (n = 1)/21.980.9071.73060.90.32150.4215.41.36371.751147.9
Shanxi province, China 2/11.70.2162.524.80.21329.789.6///
Hunan province, China 3/31.120.9375.09/0.2297.0////
Central Greece 4/2.13.339.234.80.99.829.8///
Background values 5/7.30.08658.620.00.03724.270.70.1951.81065
Risk screening values 6pH < 5.5400.3150501.370200///
5.5 < pH ≤ 6.5400.3150501.890200///
Notes: 1 Coefficient variation, 2 Date from reference [1], 3 Date from reference [31], 4 Date from reference [32], 5 Background values of soil heavy metal(loid)s in Heilongjiang province [22], 6 Date from reference [30].
Table 3. Total variance explained and rotated component matrix for total concentrations of heavy metal(loid)s in soils.
ComponentInitial EigenvaluesRotation Sums of Squared LoadingsElementsPrincipal Component
Total% of VarianceCumulative %Total% of VarianceCumulative %123
13.7837.7837.783.5435.4435.44As0.0250.142−0.795
22.4124.0761.852.5525.5160.95Cd0.9550.1680.052
31.2212.2074.061.3113.1174.06Cr−0.3470.603−0.161
40.838.3082.36 Cu0.0100.9130.195
50.686.7589.11 Hg0.1540.3230.634
60.595.9595.06 Pb0.9640.099−0.026
70.292.8697.92 Zn0.9520.0690.020
80.101.0398.95 Se0.3420.623−0.126
90.080.8299.77 Mo0.1540.8790.090
100.020.23100.00 Mn0.714−0.1640.430
Extraction method: principal component analysis; rotation method: VARIMAX with Kaiser normalization. Rotation converged in six iterations.
Table 4. HQs and HIs of individual heavy metal(loid)s for different exposure populations.
HQ for Soybean GrainsHQ for Wheat Grains
UrbanRuralUrbanRural
AdultsChildrenAdultsChildrenAdultsChildrenAdultsChildren
As0.99 1.10 0.95 1.05 2.04 2.25 2.30 2.54
Cd0.05 0.05 0.04 0.05 0.22 0.24 0.25 0.28
Cr0.00 0.00 0.00 0.00 0.00 0.00 0.00 0.00
Cu0.52 0.58 0.50 0.55 0.58 0.65 0.66 0.73
Hg0.00 0.01 0.00 0.00 0.03 0.03 0.03 0.03
Pb0.18 0.20 0.17 0.19 0.36 0.40 0.41 0.45
Zn0.22 0.25 0.21 0.24 0.54 0.60 0.61 0.68
Se0.01 0.01 0.01 0.01 0.04 0.04 0.04 0.05
Mo0.17 0.19 0.16 0.18 0.38 0.42 0.43 0.47
Mn0.33 0.36 0.31 0.34 0.97 1.07 1.10 1.21
HIs2.48 2.74 2.36 2.61 5.17 5.71 5.84 6.45
Publisher’s Note: MDPI stays neutral with regard to jurisdictional claims in published maps and institutional affiliations.

