
Images to Evoke Decision-Making: Building Compelling Representations for Stakeholder-Driven Futures


1
Landscape Architecture Program, University of Idaho, Moscow, ID 83844, USA
2
Center for Resilient Communities, University of Idaho, Moscow, ID 83844, USA
3
Environmental Science and Policy, Southern Oregon University, Ashland, OR 97520, USA
*
Author to whom correspondence should be addressed.
Sustainability 2022, 14(5), 2980; https://0-doi-org.brum.beds.ac.uk/10.3390/su14052980
Submission received: 31 January 2022
/
Revised: 28 February 2022
/
Accepted: 28 February 2022
/
Published: 3 March 2022
(This article belongs to the Special Issue Trajectories of Change in Food-Energy-Water Systems: Exploring Futures of Landscape-scale Systems Using Community Engagement Methodologies)
Abstract
:Contemporary landscape planning challenges require an increasingly diverse ensemble of voices, including regional stakeholders, physical scientists, social scientists, and technical experts, to provide insight into a landscape’s past trends, current uses, and desired future. To impactfully integrate these disparate components, stakeholder-driven research must include clear lines of communication, share data transparently, and slowly develop trust. Alternative future scenario representations aim to generate conversations through discourse, evoke scenario-based stakeholder input, and ensure stakeholder-based revisions to research models. The current literature lacks a metric for gauging effectiveness and a framework for optimal evaluation for future scenario representations. We have developed and applied a metric for a ranked set of compelling scenario representations using stakeholder input from an active research project. Researchers surveyed stakeholders through a case study in Idaho’s Magic Valley to gauge the effectiveness of each representational approach. To improve future stakeholder-driven geodesign projects and gaps in the research literature, this project provides a ranking of graphic strategies based on the stakeholder survey. Additionally, we provide examples and evaluate graphic representation strategies that can stimulate meaningful conversations, create common understandings, and translate research processes and findings to a variety of audiences. The results of this study intend to provide landscape architects, landscape planners, and geodesign specialists with a framework for evaluating compelling future scenario representations for a stakeholder group.
1. Introduction
The development of tools that effectively document stakeholder input is integral for project development, as it plays a central role in stakeholder engagement in research [1,2,3]. These tools often consist of graphics and visual representations used to depict researcher-based interpretations of stakeholder input throughout the course of a research project [3,4,5,6]. Despite the recognized importance of representations in stakeholder engagement, practioners lack a metric to evaluate the effectiveness of one representation approach to another. As an aim of this research, we explore the effectiveness of these tools using an assessment to understand compelling representations based on stakeholder feedback. The determination of an evaluative framework can provide future stakeholder-based research with a means to measure the effectiveness of graphic tools and ranking visualizations utilized in research. Nine categories of graphics and representations were evaluated according to the proposed metrics in order to determine the efficacy of these images. By conducting this research, this project aims to evaluate representations, such as stakeholder input tools, to determine which were the most “compelling”. This research seeks to answer the research question, “What evaluative metrics can be used to understand compelling graphics in a stakeholder-driven research project?” Stakeholder-driven research requires stakeholder-informed communication mechanisms. This research proposes a method to determine which representations contribute to the potential iteration of procured scenario depictions of the future.
1.1. Project Context
In 2020, the U.S. Census Bureau announced Idaho to be the second-fastest growing state by population in the United States [7]. As these trends continue, this growth can have various impacts on socio-ecological systems (SES), such as increased urban sprawl, pressure exerted on agricultural production, a loss of prime agricultural land, and conflicts in land use [8]. Various scenarios, driven by stakeholders, can help to effectively guide the planning of urban and agricultural solutions [9,10,11]. This research elicits stakeholder-defined key issues and solutions depicted as representations that address Food–Energy–Water systems (FEWS) issues in Magic Valley, Idaho, concerning drought, water demand, water quality, nutrient use, and food security by using a stakeholder-driven geodesign framework [12].
Graphic representations were used to begin and drive conversations with stakeholders. Similarly, these representations greatly aided iterations of scenario representations and their development. Incorporating graphics incrementally throughout the process can engage participants and ensure specific feedback and comments from a stakeholder group [13,14]. In this paper, we seek to measure the effectiveness of these outputs with a metric that can be transferable for future geodesign projects.
1.2. Stakeholder Engagement in FEWS
Stakeholder-defined scenarios [9,10,15] intend to acquire greater acceptance from planners and decision-makers; however, formulating said scenarios requires active stakeholder engagement [16,17,18]. Through stakeholder engagement, synthesized assumptions about systems of the region can be organized into descriptive and spatio-temporal scenarios with embedded solutions [14,19]. Stakeholder interactions inform FEWS research in many ways, including our understanding of:
- Decision-making [10]: nutrient management on farms; how water is allocated on farms (and at regional levels by canal companies) during both drought and good-water years; livestock products and crop residue use as either “byproducts” (i.e., beneficial use) or discarded/retained as “waste” (i.e., negative economic or environmental effects); third-party receivership of livestock waste; and labor allocation.
- Challenges [14]: the difficulties of dairy operators in meeting labor demand in a geographical region and economic sector where labor supply is severely restricted (this includes ways in which being short of labor directly affects the ability of operators to manage waste effectively); the way in which political disputes over federal immigration law affects the labor market in southern Idaho, USA.
- Uncertainty [20]: the way in which biophysical and biochemical factors are likely to affect future growth and development under future scenarios.
- Surprise [21]: emergent constraints to population and agricultural growth and management in the Magic Valley arising from the complexity of the social-ecological-technological system (as represented in water- and nutrient-management law, informal institutions, and enforcement agencies).
- Policy [22]: non-technological solutions which have great promise for affecting nutrient balances on both land and in water bodies in the Magic Valley, ID, USA.
Within the context of this FEWS project, researchers developed a core Stakeholder Advisory Group (SAG) [3,23] to gain an informed understanding of the landscape and its systems. Throughout the SAG process, researchers evoked responses from the SAG by visualizing stakeholder assumptions which took the form of alternative future representations [21].
1.3. Scenario Development
Using methods developed by Shearer [20] and Steinitz [12], the team focused on developing critical uncertainties, through multiple stakeholder workshops in 2018, to form scenarios that describe plausible futures for the Magic Valley. Our process was transparent to stakeholders throughout the lifespan of the project. We organized workshops as well as follow-up absentee interviews to ensure that all input was incorporated into the scenarios throughout the project [3,23]. The following sections provide an explanation of the workshops, and additional information on the scenario development process can be found in Cronan et al. [6].
1.3.1. Issues and Decisions Workshop
The first workshop was held in November of 2017 in Twin Falls, ID, where stakeholders, representing multiple industries and interests, co-developed a set of issues and decisions that the region will face in the future (2050) [3]. These “issues and decisions” were categorized from stakeholder-defined descriptions of the factors that led to the current landscape, as well as variables that are likely to influence the Magic Valley in the future. A summary report was developed and sent out to stakeholders in late 2017 that highlighted the top three issues or decisions facing the region, as ranked by the stakeholders, coupled with multiple graphics to remind stakeholders of the process.
1.3.2. Actors and Uncertainties Workshop
The second workshop, held in May of 2018, highlighted some of the modeling efforts undertaken by the broader team to represent the system, as described by the stakeholders in the “Issues and Decisions” workshop [3]. Additional actors, key policy and decision-makers in the region, were built from an Actor–Resources–Dynamics–Integration process [23] then defined by the SAG to ensure the full consideration of the Food–Energy–Water System (FEWS) [24], before stakeholders identified uncertainties facing the region. These too were ranked by the stakeholders to identify the most critical, before assessing the relationship between the critical uncertainties and the actors.
These two workshops provided a wealth of information to the research team and stakeholders and gave insight into the foundation of the scenario narratives [9,20]. Along with the written narratives, drawings were created to highlight the key elements of each scenarios as a way to quickly remember the intent of each alternative scenario. Draft scenario narratives as text descriptions of the year 2050 were developed for each scenario and then later disseminated to the SAG for review [3,6]. Once these narratives were validated by the stakeholders, alternative future modeling [10,21] commenced to spatially represent the scenarios.
2. Materials and Methods
2.1. Addressing the Knowledge Gap of Visualizations and Stakeholder Engagement
Current practices in science communication and visualization lack effective use of explanatory mechanisms to engage stakeholders while simultaneously providing an evaluative tool for further research development [25,26]. This research proposes an assessment through the combination of various graphic representations to address this knowledge gap by providing a means for interactive deep-mapping [13] through the co-production of knowledge in stakeholder engagement [14,16] through graphic visualizations. This project determined a ranking of compelling graphics based on a survey of our stakeholders. Visualizations were used as a mechanism for ensuring that SAG opinions and assumptions were heard and activated within a project [14]. Presented and crafted without bias, the scenarios were constructed based on stakeholder feedback through an iterative means of research-based modeling to support these assumptions [3,6].
2.2. Determination of Compelling Representations
The representations or graphics are interpretations of stakeholder assumptions about the future. Following a survey instrument, the researchers categorized these graphics as “compelling” activating stakeholder ideas into graphic conventions to express knowledge-driven variables [26], as well as standards in visualization and presentation [27]. These graphics convey revisions of formative ideas and perceptions to activate stakeholder responses. By providing revisions of graphic representations, this project intended to ensure that stakeholder perspectives were heard and integrated into models with the intent to develop stakeholder trust [3,14]. This process aimed to elicit feedback through representations of their own ideas without researcher bias [14,25]. Our process attempts to revise our models through stakeholder and researcher responses over the course of two years (Table 1). Stakeholders were provided with various means to respond to scenario input: verbal input during meetings, anonymous survey instruments, and input through reports and graphics. Quarterly reports of consensus among the SAG input were sent out to provide transparency for scenario development. Simultaneously, these reports provided the SAG with another mechanism for feedback and revision.
2.3. Timing of Scenario Representation Delivery
Scenario representations were introduced to stakeholders at a series of stakeholder workshops throughout the course of the project. During each workshop, stakeholders had opportunities to comment on the plausibility of the data in the graphics. Stakeholders were also given opportunities to comment on scenario plausibility in subsequent workshops and through direct contact with researchers. Initially, less specific and more generalized representations were presented using analog tools (stylized depictions and trace paper overlays) to represent ideas. The idea of timing in the scenario representation delivery was presented at vague-to-specific levels of abstraction throughout the entire project. The rationale for this decision was to provide the SAG with an understanding of systemic operation as well as ensuring anticipatory competence [28] through a better understanding of variables that might elicit future change [29]. Each rendition was designed to evoke stakeholder responses to landscape change, and revisions needed to be made in order to support stakeholder understandings of future scenarios.
2.4. Geodesign Representations for Stakeholder Engagement
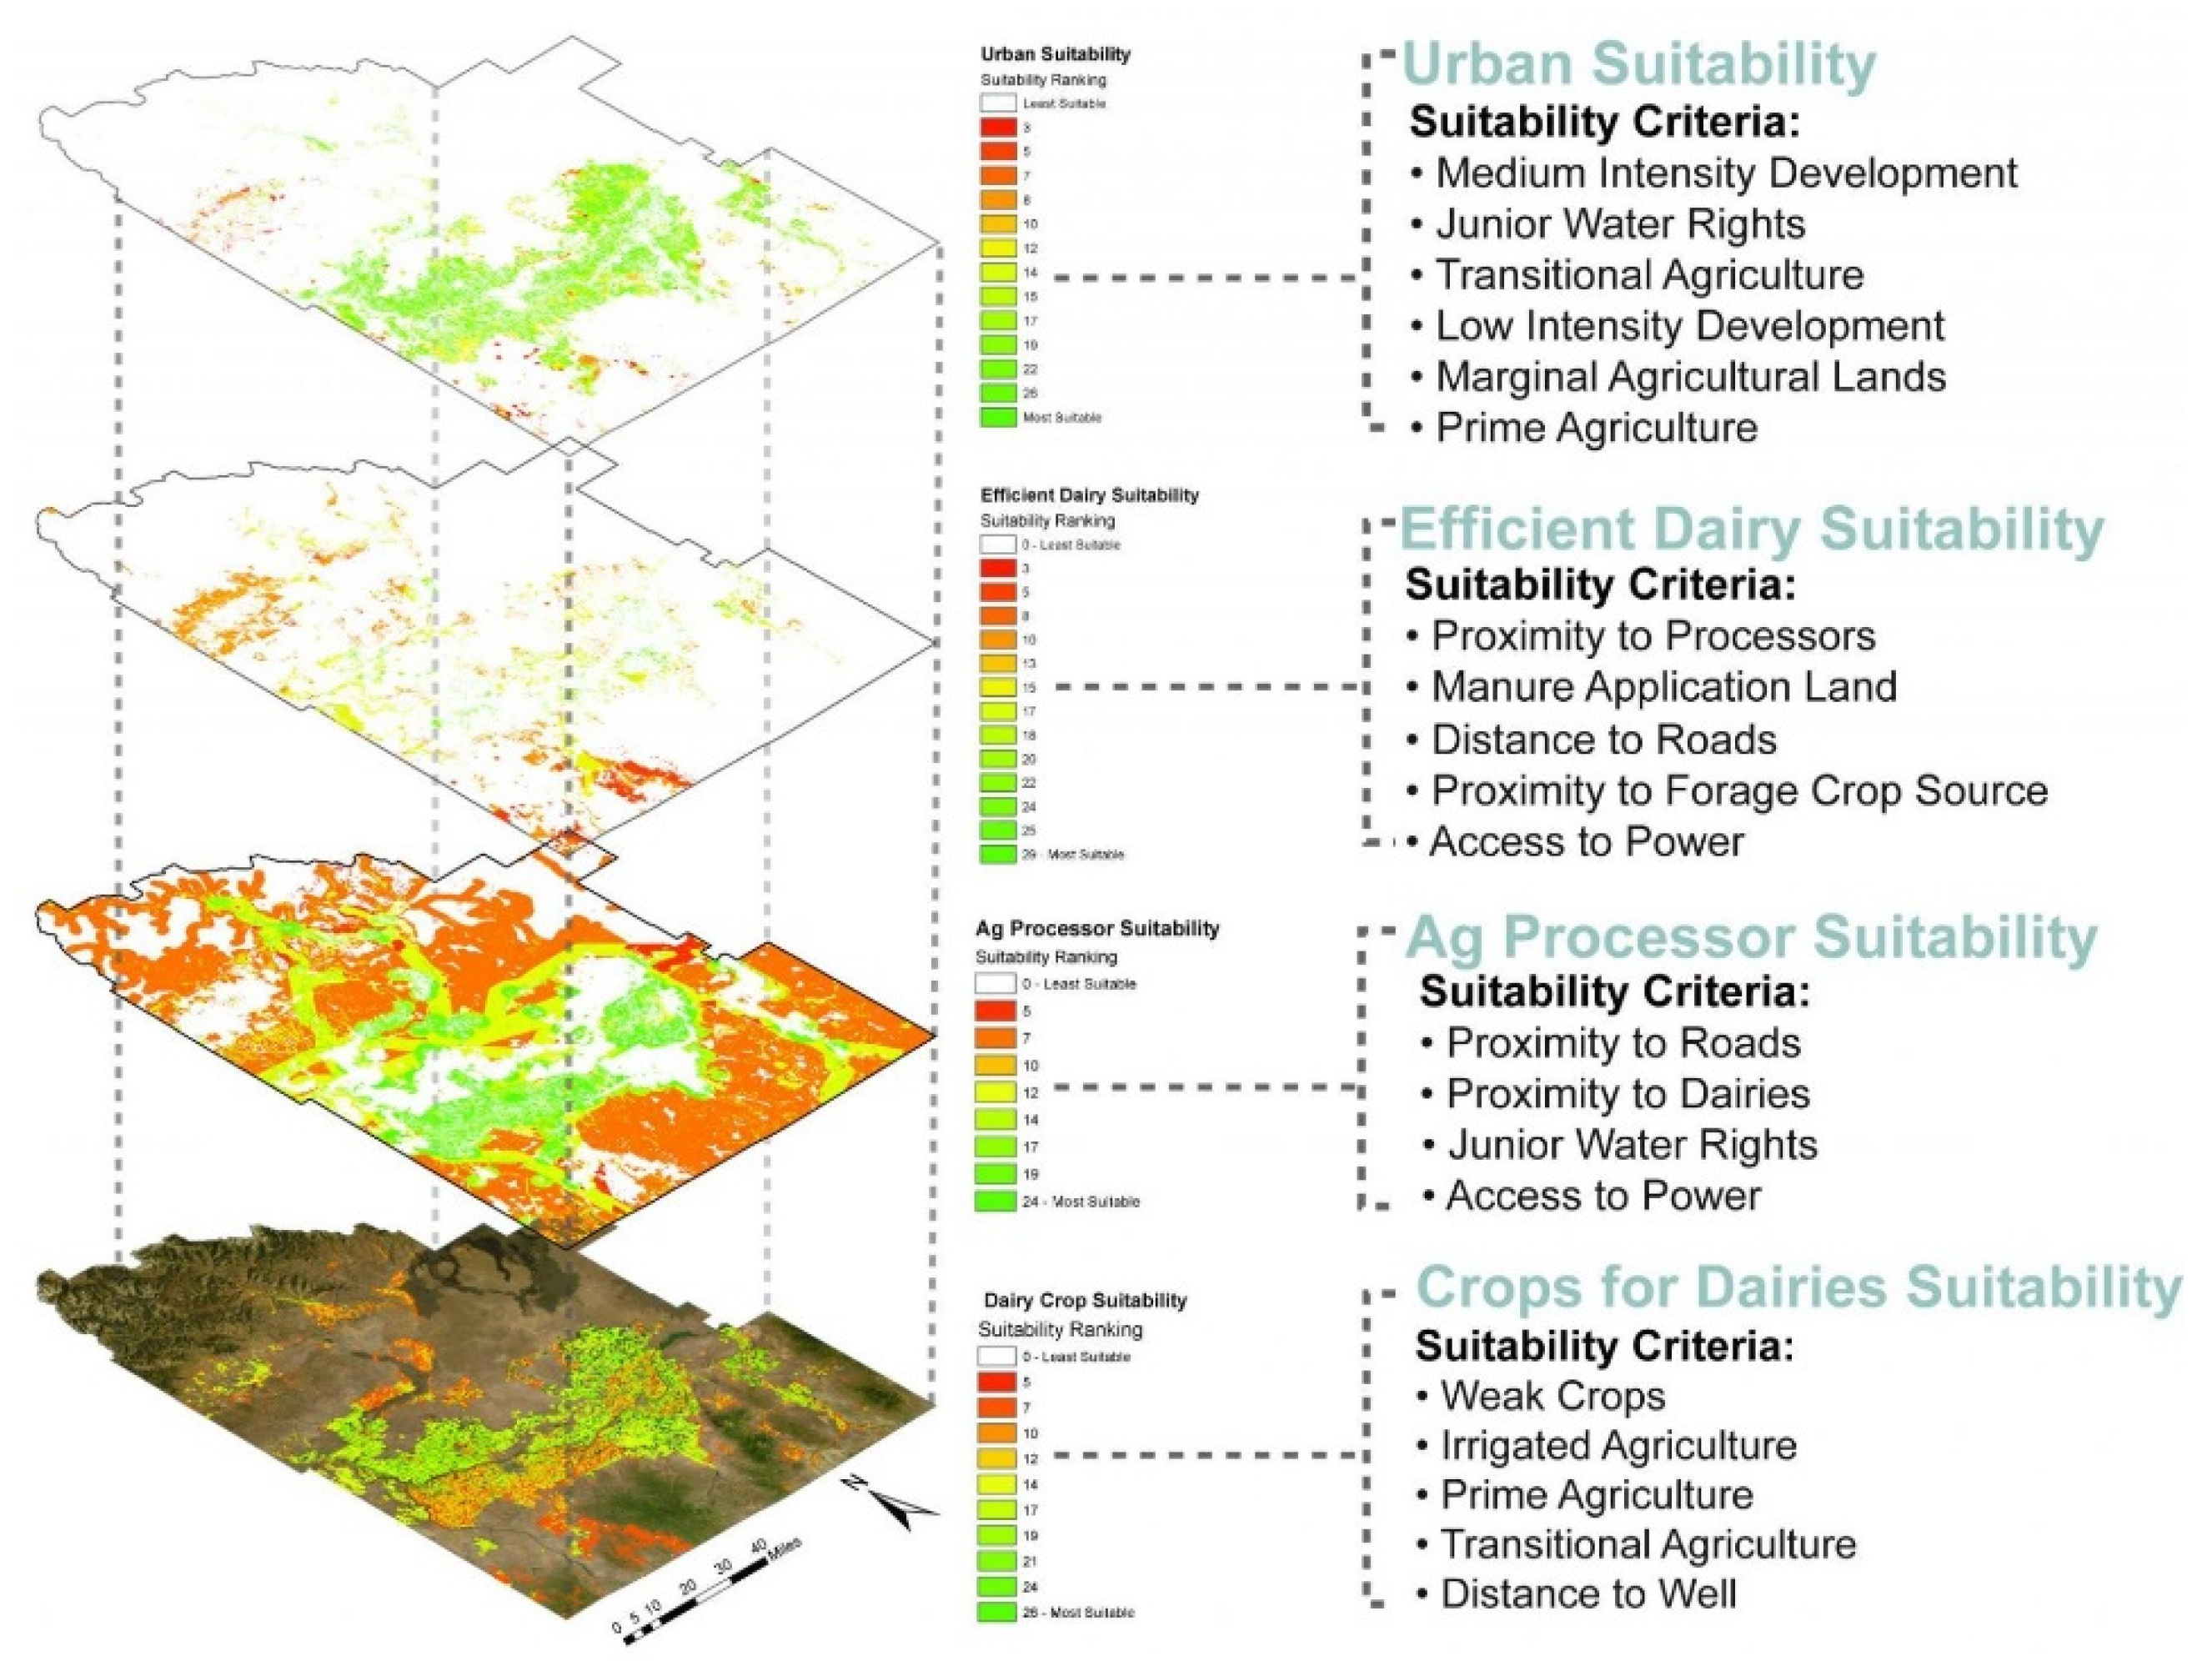
In preparation for the May 2019 stakeholder workshop, researchers developed criteria to guide suitability (Figure 1) with a weighted overlay [30] and exclusivity for certain land use and land cover classes per scenario. These exclusions and suitability criteria were initially selected and ranked by the research team to develop three draft scenario representations: business as usual (trend), mega drought (extreme climate), and happy valley (ideal conditions). The following is an example of exclusions and suitability from the “business as usual” scenario:
Scenario representations were presented to the stakeholder in multiple forms: diagrammatic axonometric drawings, digital stakeholder engagement tools, and land use/land cover change maps. The diagrams were intended to give a general sense of land cover change over time per scenario, whereas the land use/land cover change maps provided a spatially explicit representation on multiple scales. These depictions were utilized to represent the concept of “landscape systemics” [31,32], thus providing the SAG with geospatial conceptualization of the systems analyzed within the network.
Geodesign hinges on the central question, “How do we get from the present state of this geographical study area to the best possible future?” [12]. This process occurs across scales—temporal and geographical—to produce “constructed physical change” in smaller projects and to “influence the way society values and changes its geography” in larger projects [12]. At its core, geodesign relies on an interconnected, representative matrix of experts involving regional stakeholders that include people in the region, geographic scientists, design professionals, and information technologists [12]. While many traditional research methods begin with external loci of expertise and solutions, geodesign places the end users at the center of study. The geodesign process was developed to operationalize stakeholder assumptions through multiple iterations of validated models. These models work as depictions of the landscape which take various forms of representation, such as maps, diagrams, and 3-D models. The scenarios, evoked and validated by stakeholder responses, were revised through multiple representations and presented to stakeholders in various meetings and facilitated charrettes [3,6]. In the FEWS project, five stakeholder meetings (Table 1) were facilitated to evoke responses and provide instruction for scenario representations: (a) issues and decisions (fall 2017); (b) actors and uncertainties (spring 2018); (c) scenario narratives (fall 2018); (d) scenario revisions (spring 2019); and (e) scenario revisions 2 (fall 2019). The representations were incrementally presented during these meeting to evoke responses for future scenario depictions and for stakeholder engagement. Active stakeholder engagement has the capacity to ensure a wide array of questions and concerns as well as develop stakeholder trust [14,18]. Various forms of compelling scenario representations can confuse or engage stakeholders; therefore, the timing of the delivery of representations and their effectiveness is crucial to the geodesign process.
2.5. FEWS Categories of Graphics for Scenario Representation
Here, we describe the rationale for each of the classifications as well as a description of delivery and the components applied. Scenario representations were classified into nine categories to conduct the study:
- 3-D visualizations;
- 3-D digital terrain fly-throughs;
- Process diagrams;
- Bar graphs and pie charts;
- Scenario mapping digital tools;
- Solutions diagrams and visualizations;
- Suitability criteria;
- Analog drawings;
- Stylized scenario depictions.
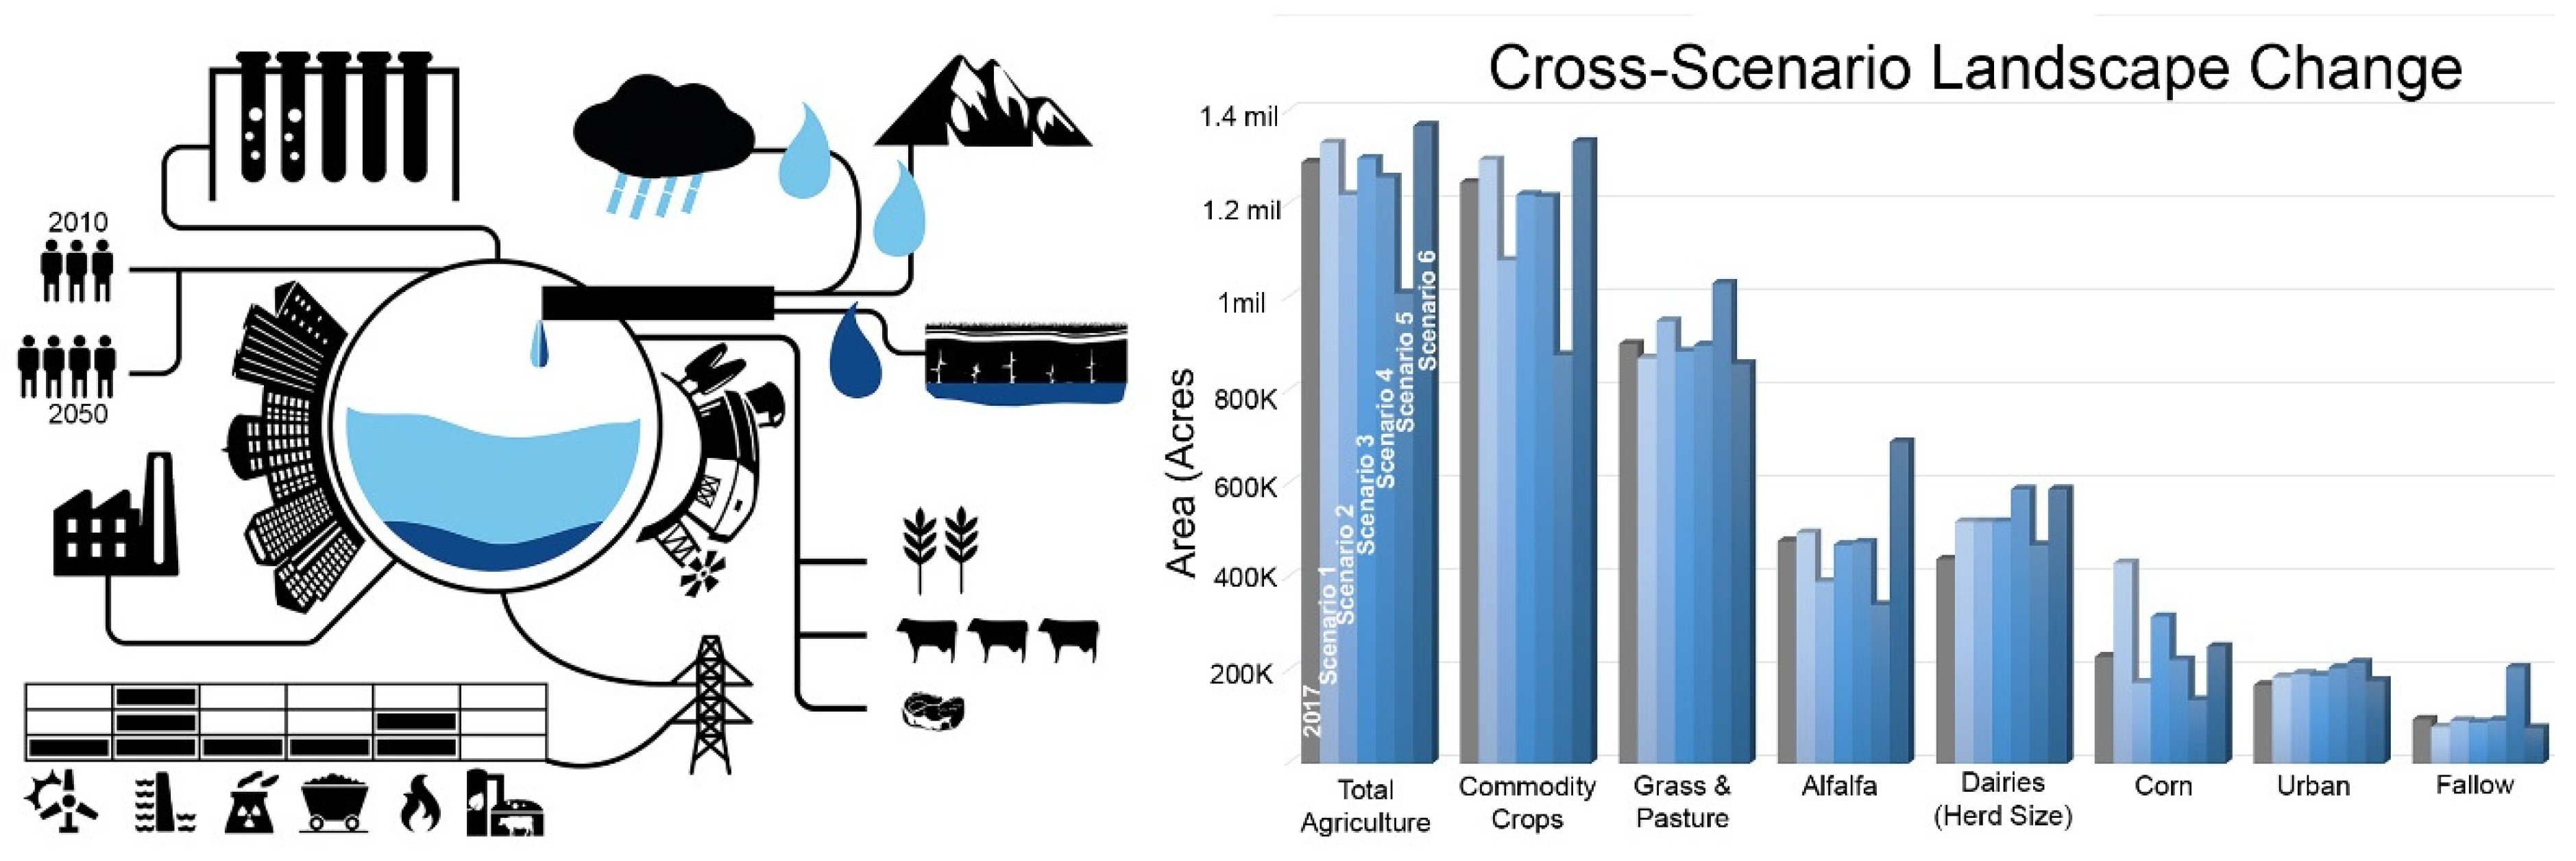
Process diagrams, bar graphs and charts (indicator representations), and conceptual models were utilized to depict systematic conceptualization and scenario-specific understandings of change vetted through the SAG [3,6]. Process diagrams (Figure 2) included graphic explanations of FEWS components for each scenario consisting of the research team’s system perceptions. Standard bar graphs and charts were used to describe current trends, future projections, and indicators of change [33] for each scenario. These diagrams were iteratively revised to align stakeholder assumptions of the trajectories of change as well as research-based conceptions of the systems.
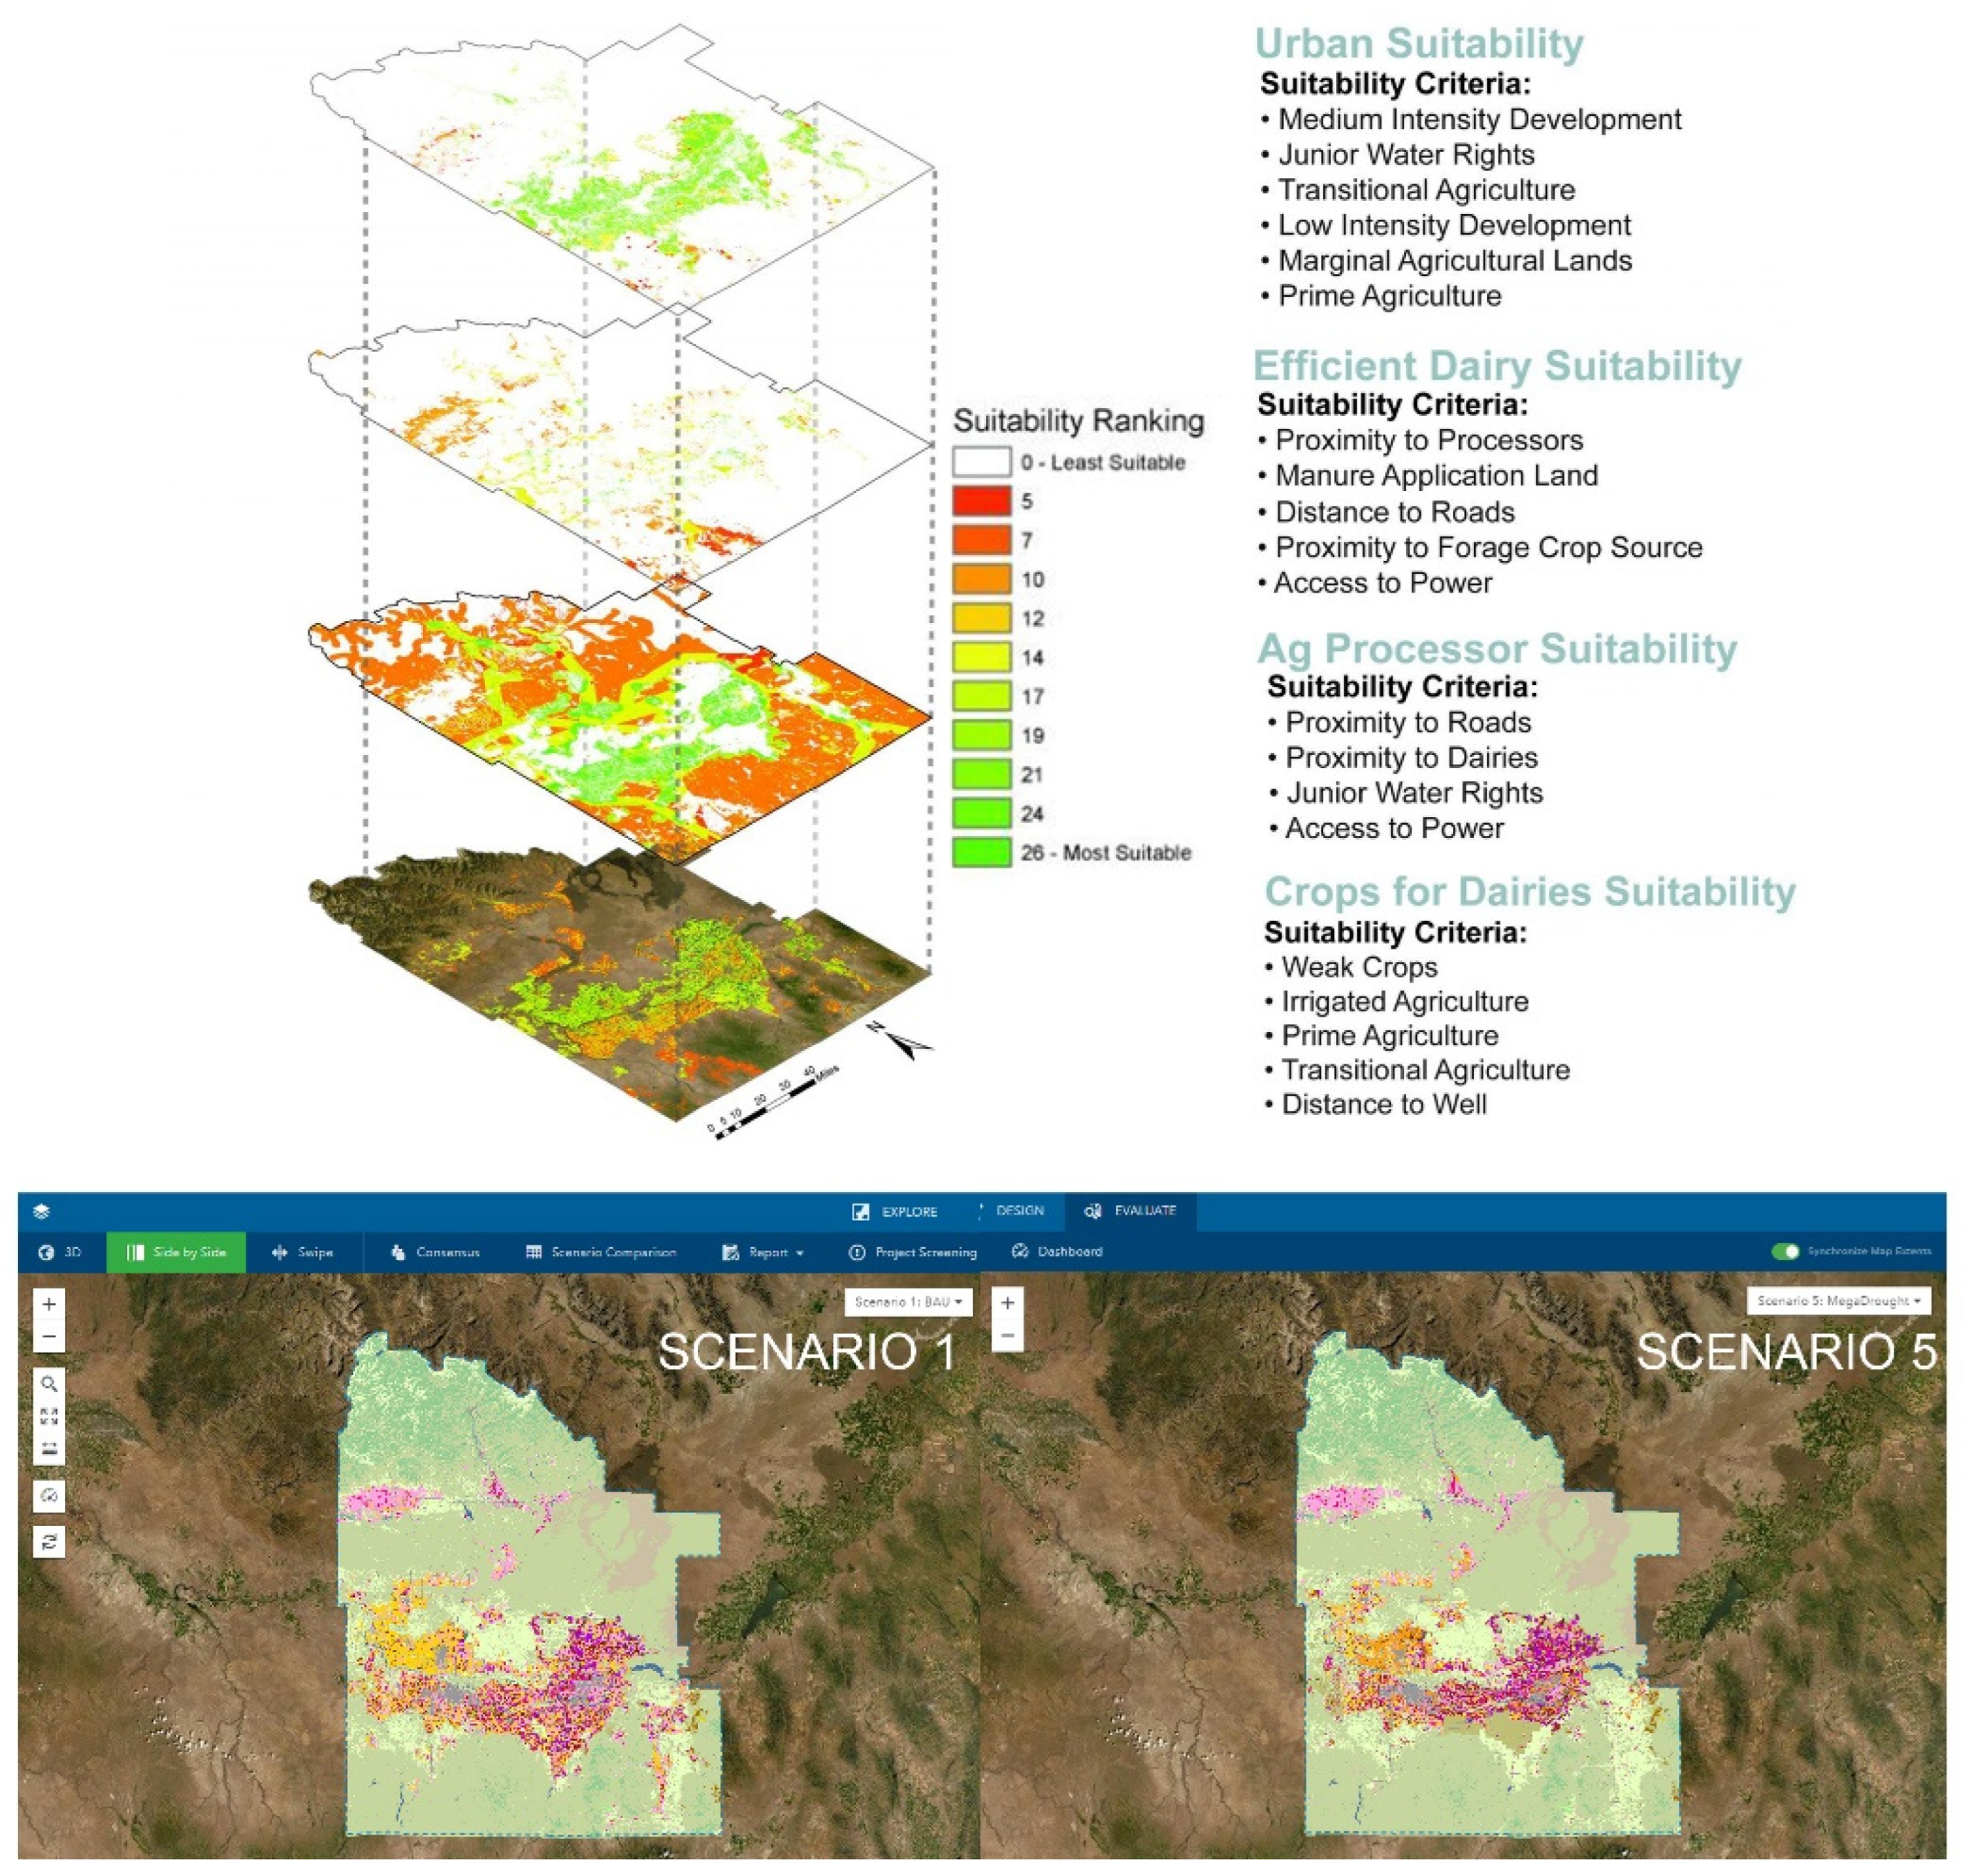
Suitability criteria (Figure 3), exploded axonometric drawings, and scenario mapping digital tool outputs were used to gather spatial input for each scenario. The SAG provided input through various verbal and written responses to illustrate which systems would impact land use and land cover change in each scenario for the year 2050. SAG-defined input through weighted overlays [30] was demonstrated through a web-based ESRI © tool called Geoplanner [34]. During stakeholder workshops, SAG guidance defined which changes would impact each system within the given assumptions of a scenario. Many of these visualizations were delivered to the SAG in tandem to not only provide various options for stakeholder input, but also to align our geospatial datasets to the scenario narrative descriptions.
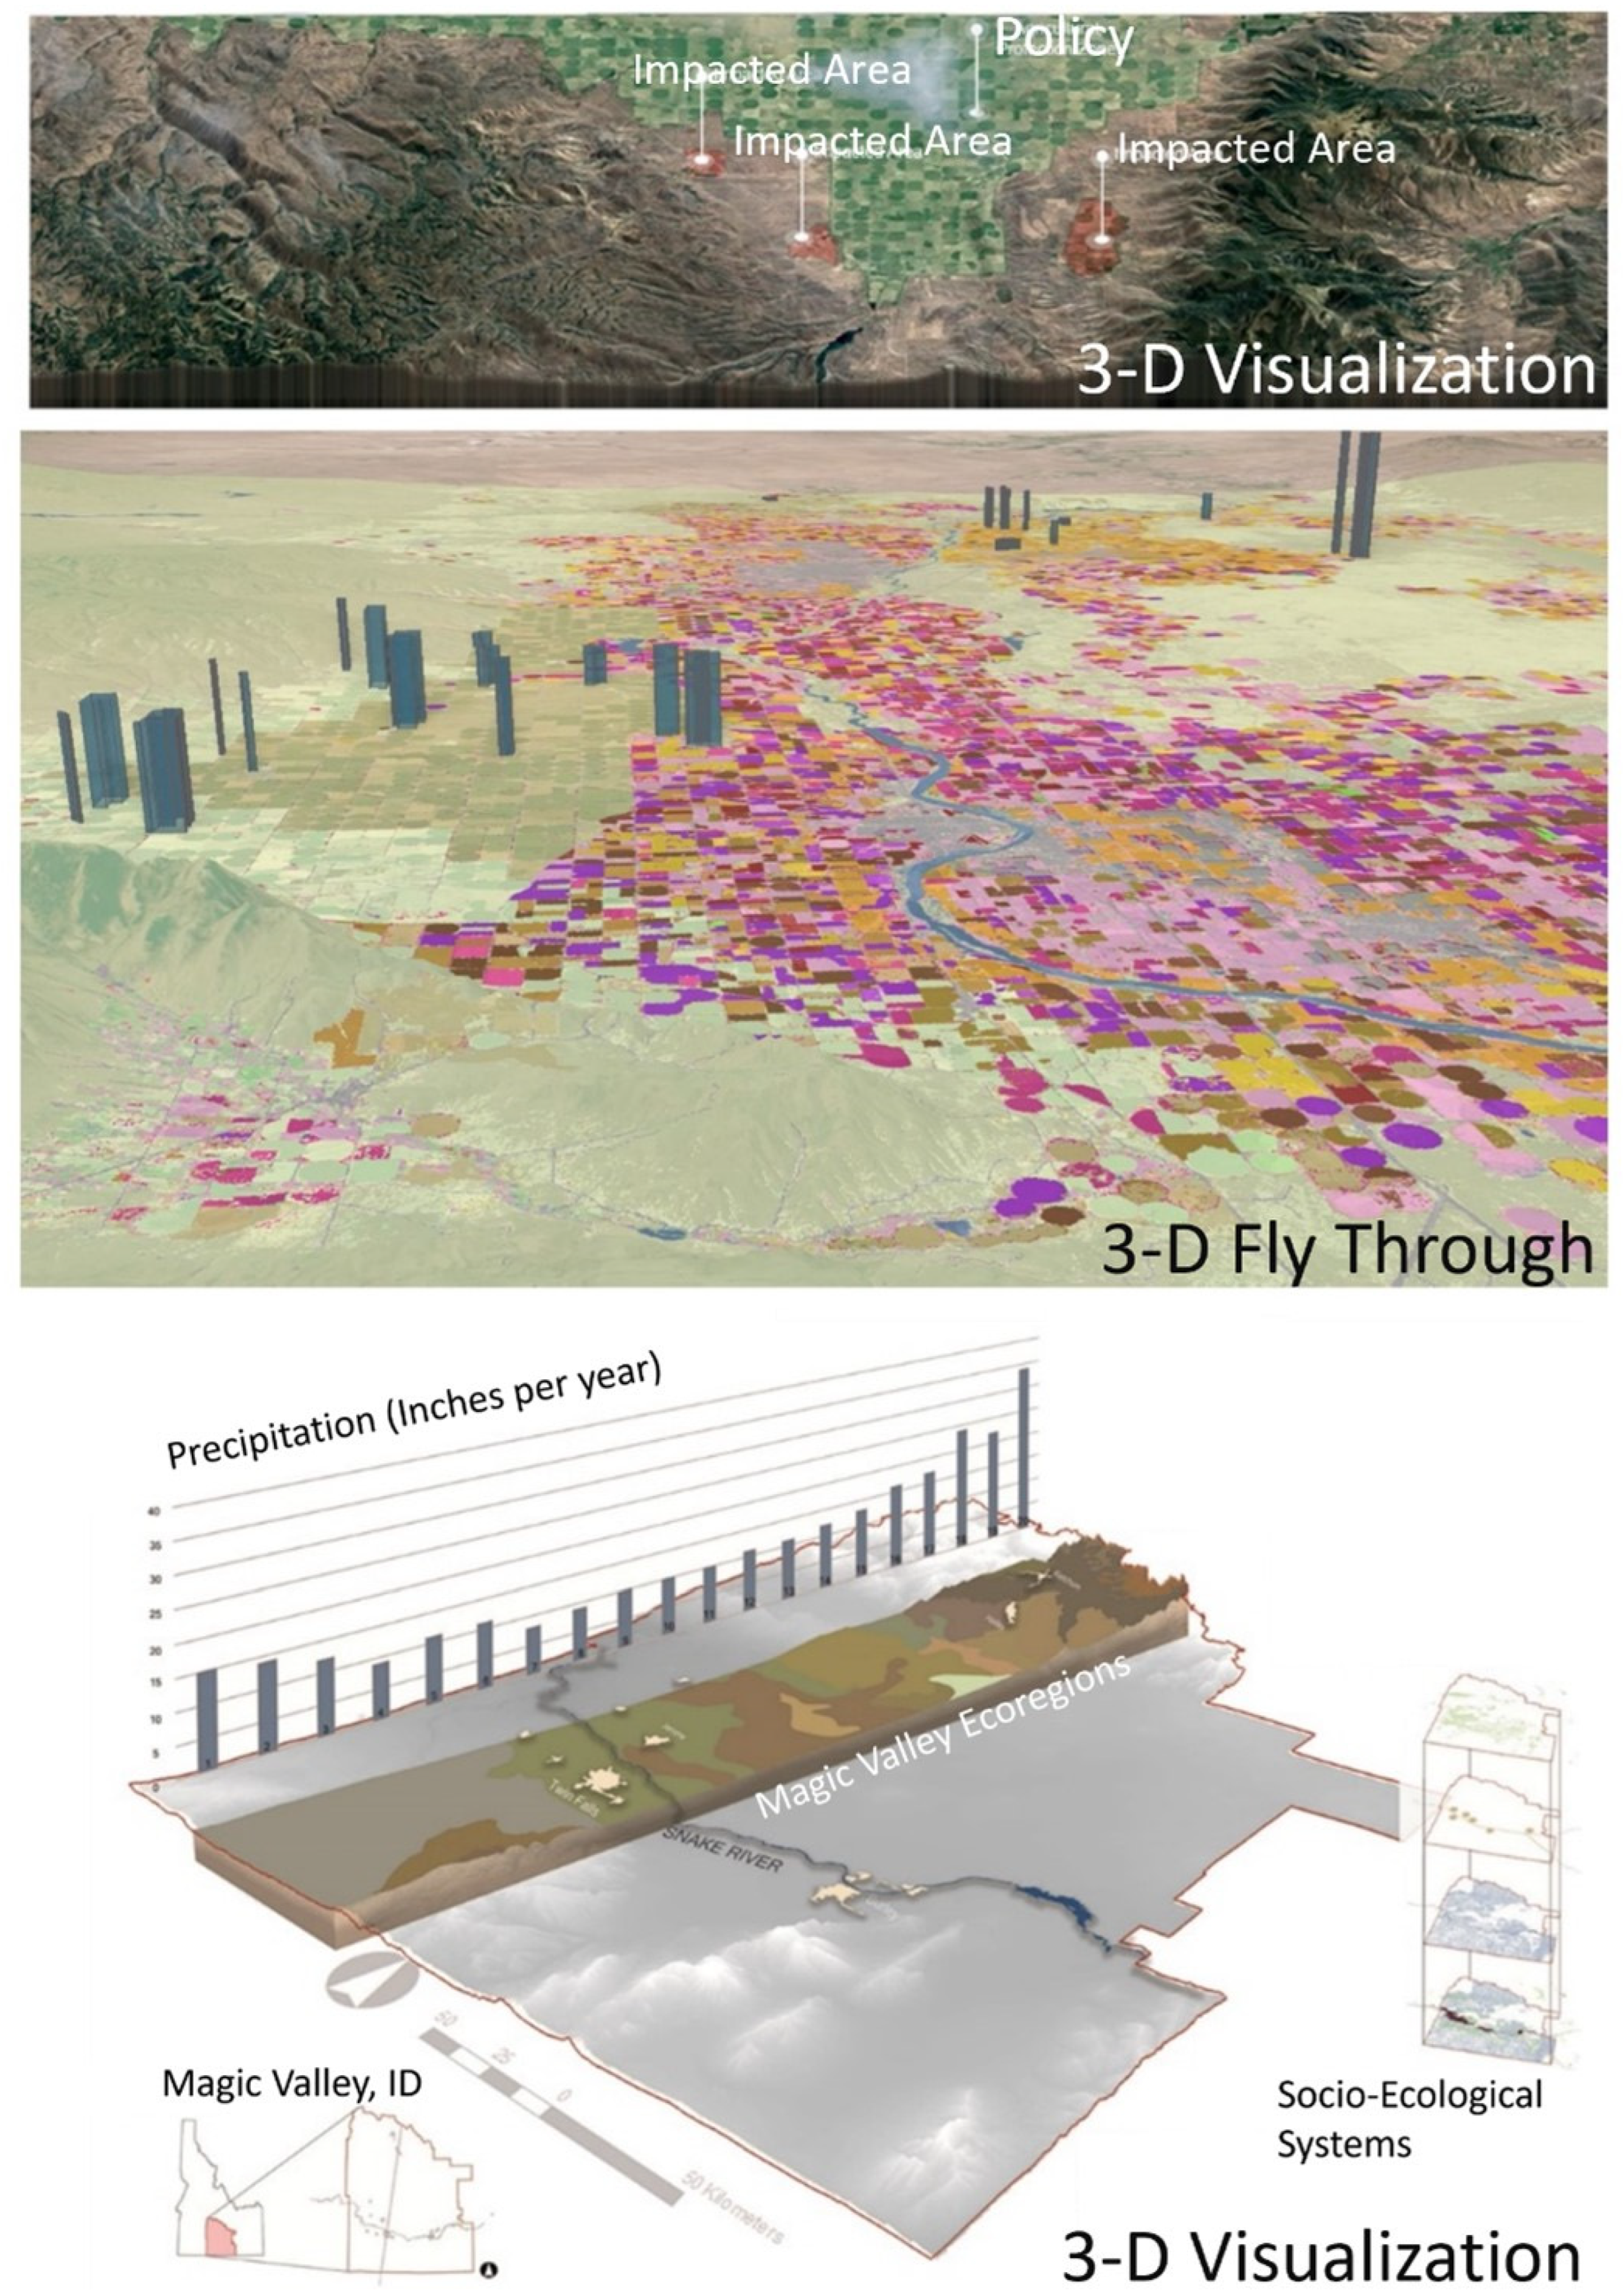
Three-dimensional scenario representations and fly-throughs (Figure 4) provided stakeholders with another option to understand each scenario and the implications of each driver of change across the landscape. These visualizations intended to provide a contextual understanding of how the landscape might change within the existing system.
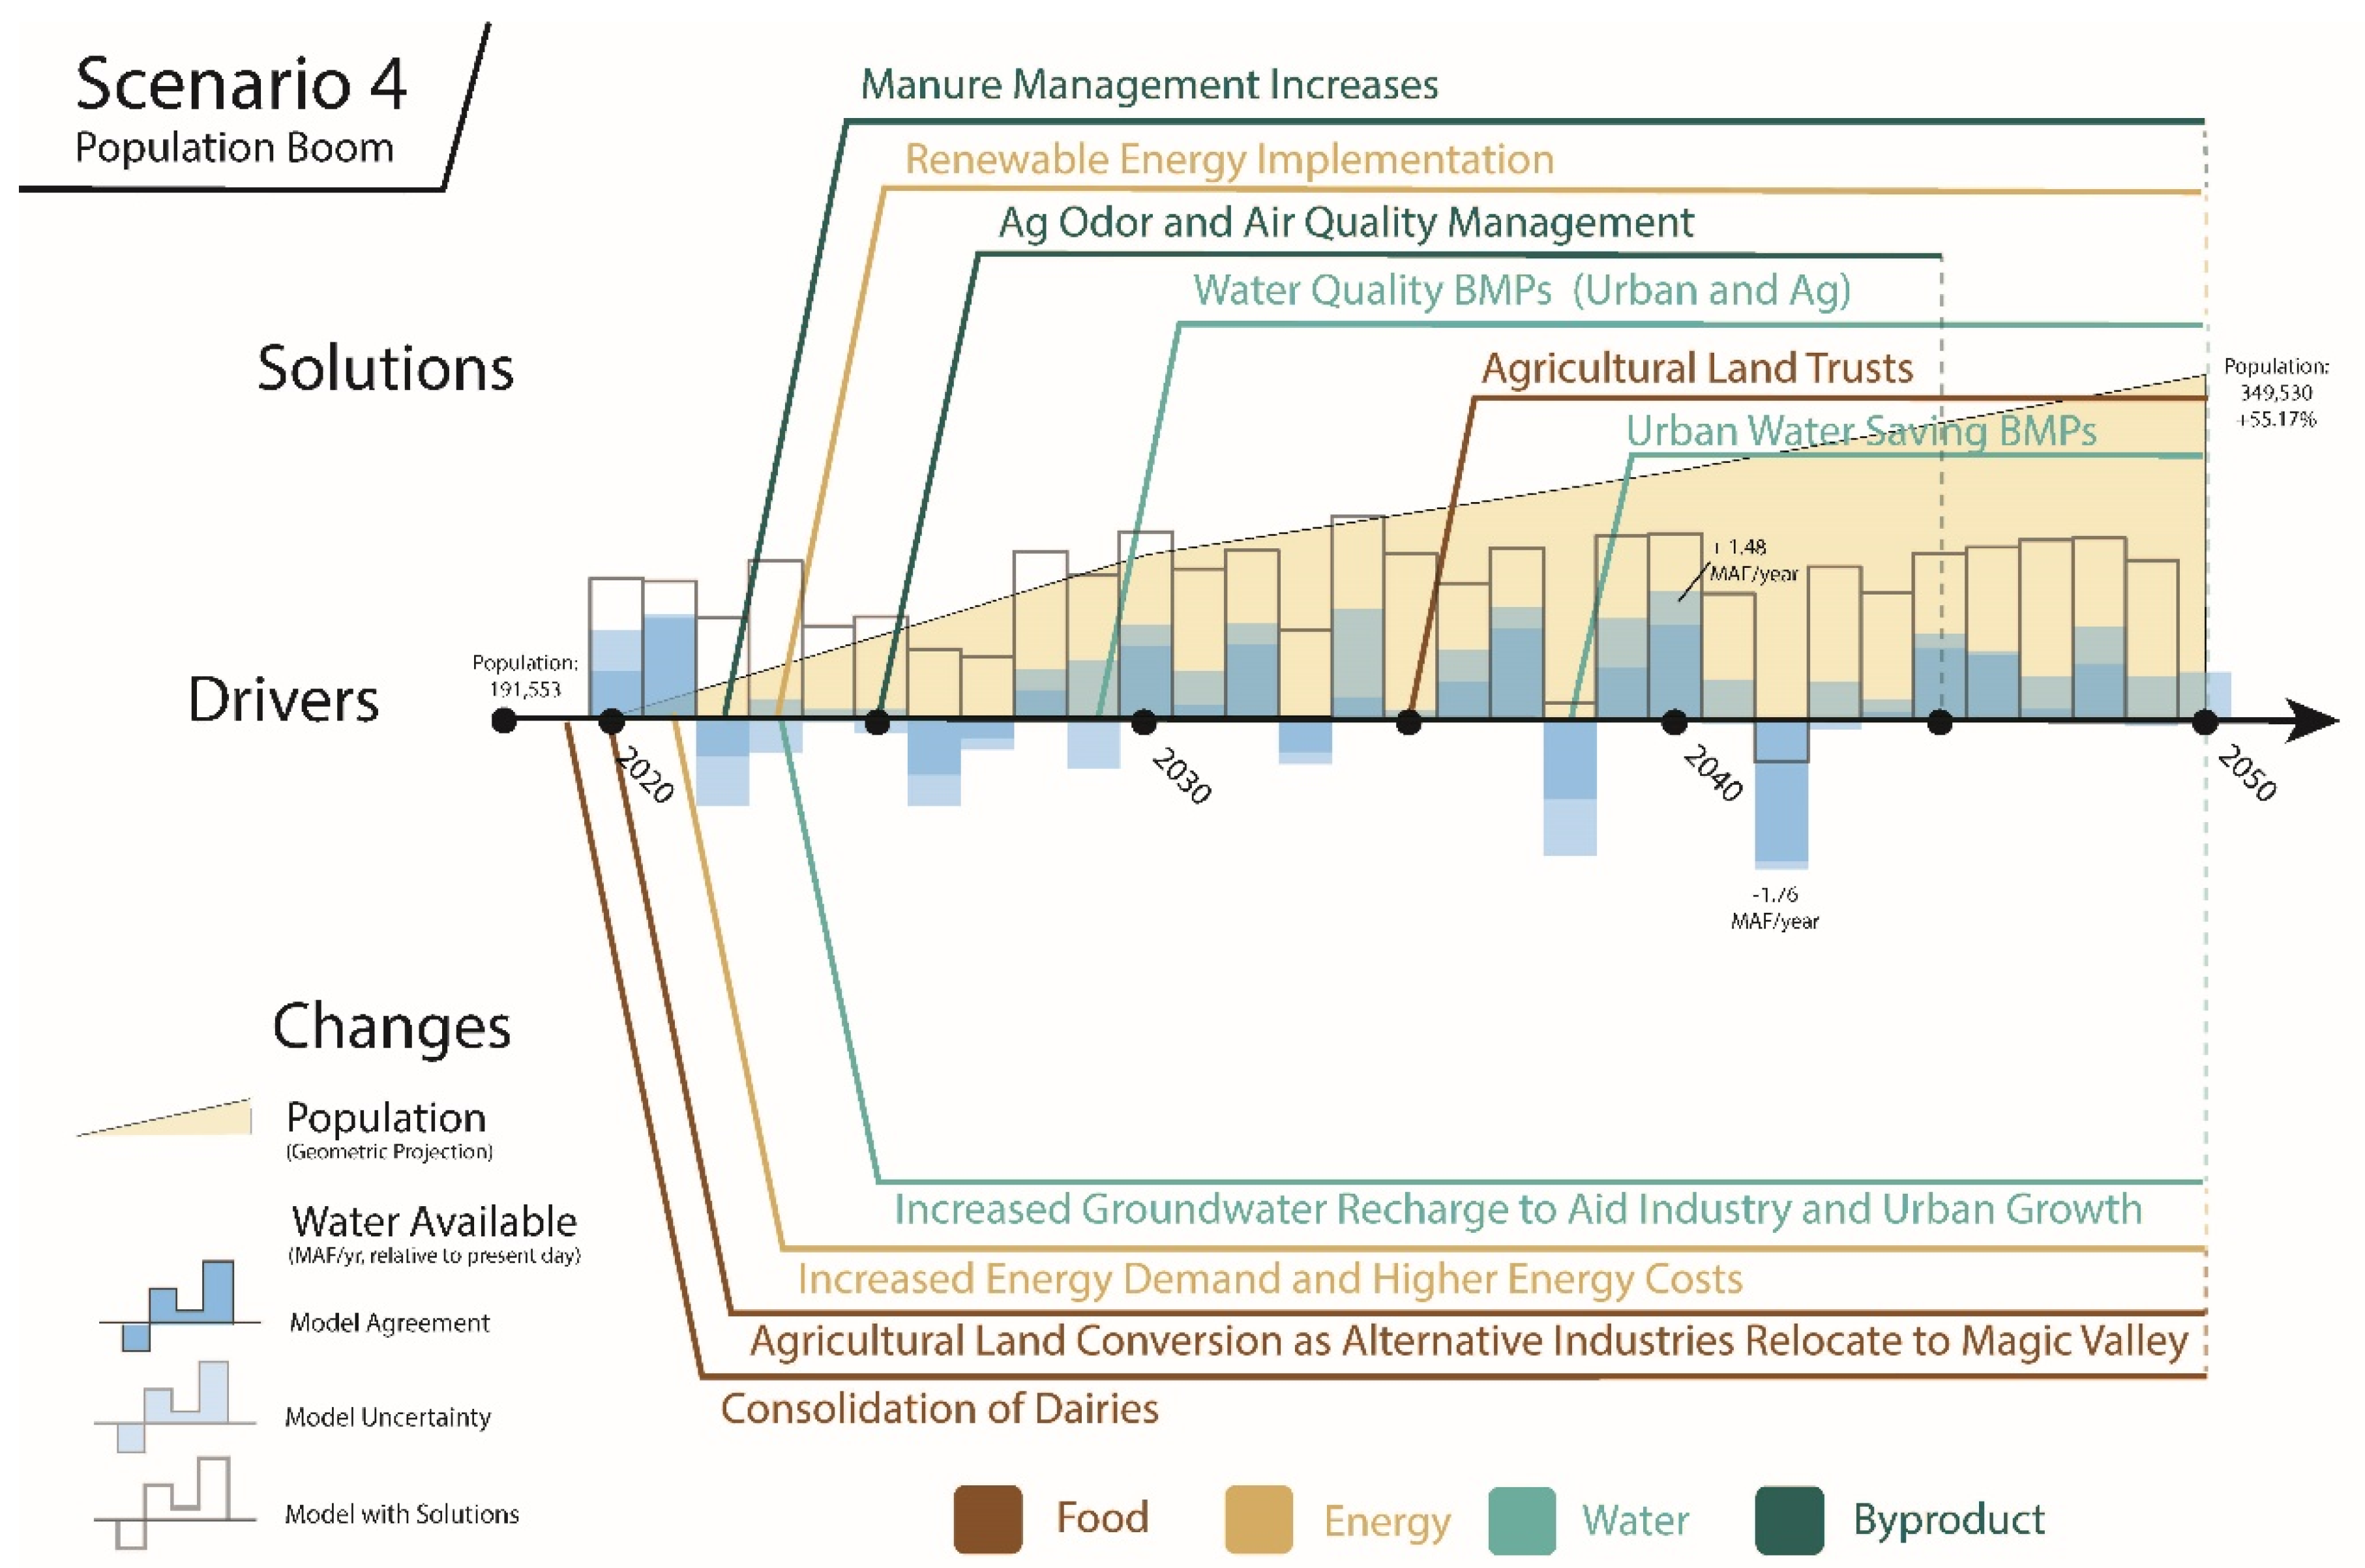
Solutions diagrams and visualizations, such as timelines (Figure 5), for each scenario are intended to allow stakeholders to understand the implications of integrated solutions for each scenario. Biophysical and social elements, such as population growth and water scarcity, are presented within these diagrams to help situate each solution, along with temporal understandings of how the systems may react to each solution and at what point they may result in influencing said change.
Supplemental graphics (Link S1) include: (a) bar graphs/pie charts, (b) analog drawings, and (c) stylized scenario depictions. These graphics were used to demonstrate the change and the performance of each scenario as well as providing a mechanism for revision for the research team.
2.6. Method of Assessing Effectiveness
First, surveys, after being tested through a focus group for appropriateness, were distributed to all stakeholders at the end of meeting (scenario revisions II) to ascertain the stakeholder determination of effectiveness in a set of diagrams, map representations, and 3-D visualizations. Our central question was simply, “In your professional opinion, how informative were the following graphics?” Stakeholders were able to select numbers from 1 to 10 to rank the informative level of each graphic. The results of the survey responses from all stakeholders were then averaged using an effectiveness scale of 1–10 for each graphic: 3-D visualizations, 3-D fly-throughs, process diagrams, bar graphs and charts, a scenario mapping digital tool (ESRI’s Geoplanner ©) [34], solutions diagrams and visualizations, suitability criteria, analog drawings, and stylized scenario depictions. Results were then examined using a standard t-test, assuming equal variances, to compare values and determine effectiveness.
The Geovisualization Usability (GU) metric [35] was used as a comparison variable in the t-test. Similar to the stakeholder survey, scenario representations were scored from 1 to 10 based on researcher assumptions of how each representation fit into the GU metric. Table 2 provides a description of each GU component used for ranking the representations. Finally, we used a t-test to compare the survey results to the GU metric.
Scores from both the GU metric and the survey were then averaged across all operators (locate, identify, etc.) and then compared to stakeholder averaged scores. Scores were then combined using a statistical t-test. The t-test (two samples assuming variances) determines if the relationship is statistically sound. A t-test with a p-value higher than 0.05 states the difference found is not statistically sound. A t-stat lower than 2.00 demonstrates high similarities between samples.
3. Results
Results from the t-test showed a p-value of 0.028. Results (Table 3) indicate a significant difference between the sample sets (the GU metric and stakeholder responses) with a two-tail p-value of 0.02 as well as t critical two-tail results larger than a value of 2.00 for the following interactive representations: process diagrams, bar graphs, and pie charts (indicators); scenario mapping digital tools; and solutions diagrams and visualizations.
These results indicate that a GU metric is somewhat capable of assessing compelling graphics, thus supporting a method to evaluate an initial set of graphics which can allow for the subsequent selection of effective graphic conventions. However, there are certainly some graphics that stakeholders found less compelling than the GU metric would suggest (process diagrams, bar graphs, and pie charts (indicators); scenario mapping digital tools; and solutions diagrams and visualizations; see Figure 5).
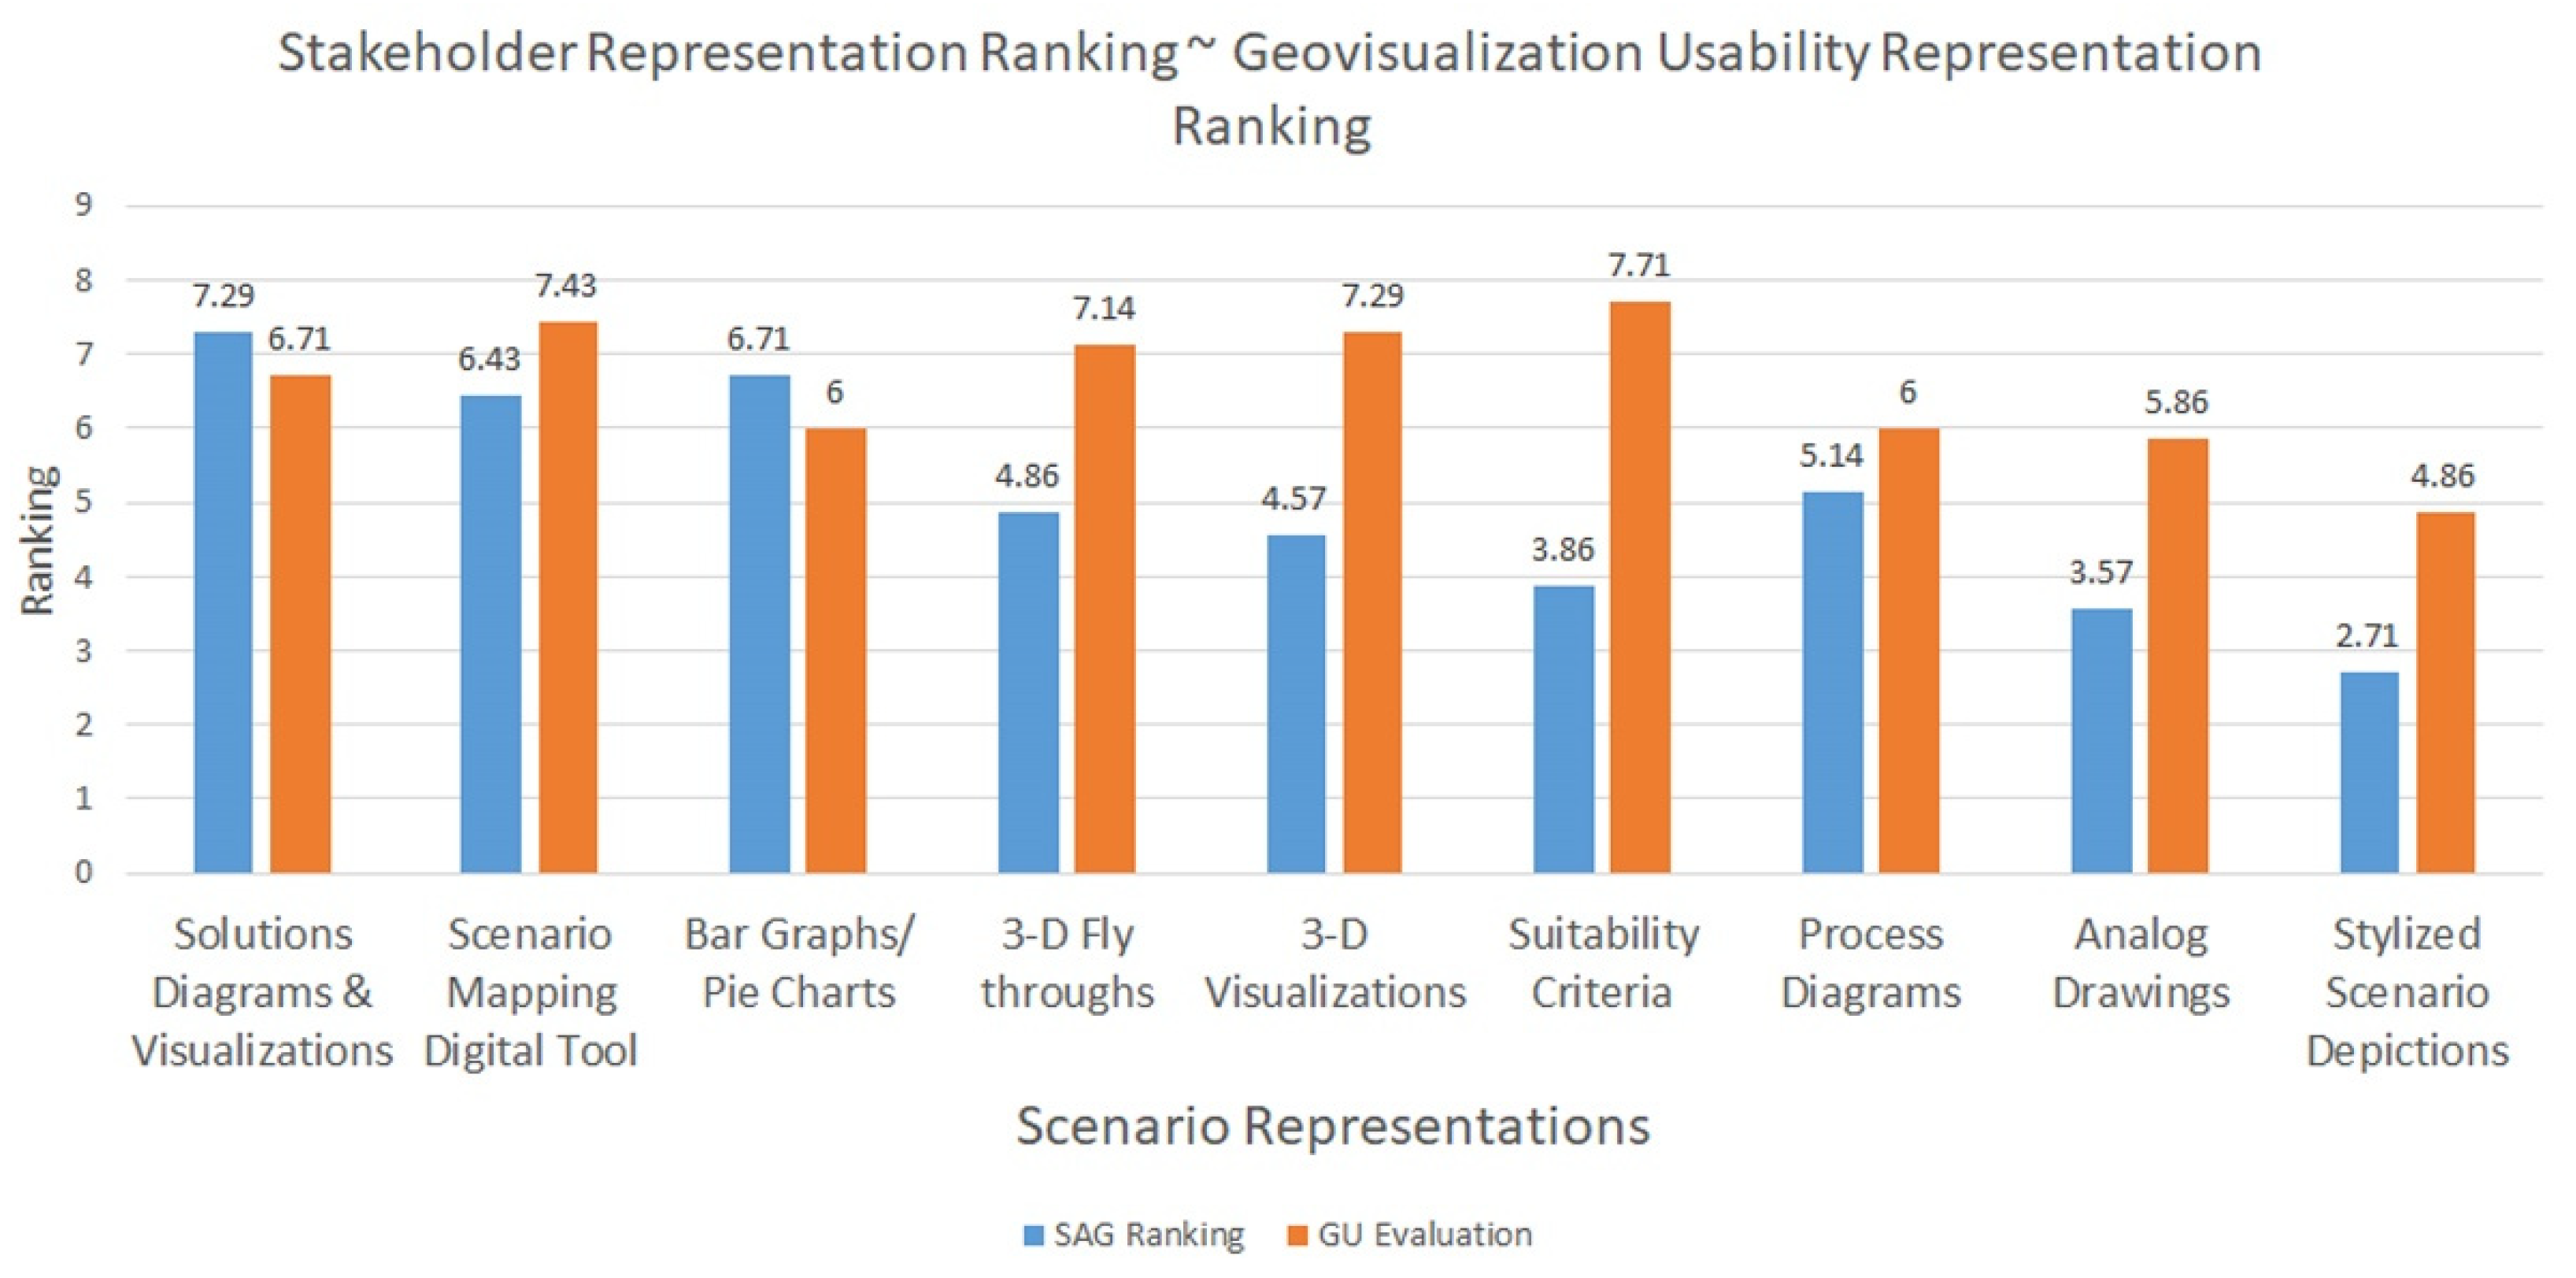
Averaging the results from the stakeholder graphic ranking and the GU metric (Figure 6) indicate a ranked order of graphics which provide an indication of representation effectiveness per type from our study. Higher scores indicate a higher level of effectiveness in this study. The following list denotes the ranked order from mean:
- Solutions diagrams and visualizations (mean 7.00);
- Scenario mapping digital tool (mean 6.93);
- Bar graphs and pie charts (mean 6.36);
- 3-D digital fly throughs (6.00);
- 3-D visualizations (5.93);
- Suitability criteria (5.79);
- Process diagrams (5.57);
- Analog drawings (4.71);
- Stylized scenario depictions (3.79).
4. Discussion
The results from this project indicate that developing a metric for evaluating the effectiveness of scenario representations can provide valuable assessment within projects as well as a framework for content delivery. This metric can provide researchers with an evaluation method to test the effectiveness of their graphics through stakeholder engagement, potentially leading to better, or more meaningful, stakeholder engagement [36] for initial assessment; however, the results indicate that iteration through stakeholder input for graphics is key. Similarly, this assessment and the subsequent iterations of graphics has the potential to provide the further FEWS evaluation of stakeholder engagement strategies [2]. Furthermore, this study supports previous research that documented stronger stakeholder engagement through graphic representation [25] and interactive graphics to guide decision making [1,4]. We offer the framework to provide facilitators with a means for effective representation delivery and evaluation.
The combined survey results and GU metric comparison indicate that process diagrams, bar graphs/pie charts, the scenario mapping digital tool, and solutions diagrams and visualizations are all useful approaches for stakeholder engagement in Food–Energy–Water systems. It can be inferred that all of these diagrams share two consistent factors: (a) graphic development was based-on iterative stakeholder feedback, and (b) visualizations required stakeholder and researcher collaboration and synthesis. Because of this project and similar studies, geodesign and other planning projects can be enhanced through evoking and rendering visualizations that are based on coupled stakeholder and researcher initiatives.
5. Conclusions
This work suggests that a framework for the evaluation of effective and compelling graphics can provide a helpful understanding of which tools can capture the thoughts and assumptions of stakeholders, as well as elicit revisions for a research group. We suggest that further investigation is needed to understand what stakeholders initially found to be “compelling”, in addition to the survey instrument provided after graphics were presented. By addressing this notion, stakeholders would have a sense of graphic standards and perhaps could have utilized delivered tools as a mechanism for input. The inclusion of survey instruments prior to the investigation may have offered a baseline for comparison, thus giving a sense of improvement or engagement.
Further research is needed to understand what tools and graphics can achieve an effective degree of engagement for stakeholders in FEWS projects; however, projects similar to this study have the capacity to begin a conversation about scenarios and simultaneously bolster engagement for future endeavors.
Supplementary Materials
The following supporting information (Link S1) can be accessed at: https://the-infews-atlas-magic-valley-idaho-alternative-futures-uidaho.hub.arcgis.com/ (accessed on 23 February 2022).
Author Contributions
Conceptualization, A.K.; methodology, A.K., E.J.T., D.C.; formal analysis, D.C., E.J.T.; data curation, D.C.; writing—original draft preparation, D.C.; writing—review and editing, D.C., E.J.T., A.K.; visualization, D.C.; supervision, D.C., A.K.; project administration, A.K.; funding acquisition, A.K. All authors have read and agreed to the published version of the manuscript.
Funding
This research was funded by the National Science Foundation, grant numbers 1639524 and 1856059.
Institutional Review Board Statement
The study was conducted according to the guidelines of the Declaration of Helsinki and approved by the Institutional Review Board of the University of Idaho (protocol code 16-042 approved on 13 June 2016).
Informed Consent Statement
All subjects gave their informed consent, and consent was obtained from all subjects involved in the study.
Acknowledgments
Thank you to David Griffith and Paula Williams for ideas that contributed to this paper; to Shantar Zuidema and Richard Lammers for developing the water balance model; to Chad Lorentzen and Katherine Woodhouse for the assistance in drafting scenario narratives and representations; to Sarah Dengler for communication and logistics with stakeholders; and to the University of Idaho Twin Falls Research & Extension Center for providing the venue for all of the stakeholder workshops. We are indebted to the members of the stakeholder advisory group for their expert knowledge and friendship: Phyllis Beard, Cleve Davis, Dawn Davis, Mario de Haro Marti, Erik Frostensen, Paul Harrington, Steven Howser, Gale Kleinkopf, Rick Naerebout, Jack Nelsen, Tanya Oldham, Gerald Orthel, Julia Oxarango-Ingram, and Megan Satterwhite.
Conflicts of Interest
The authors declare no conflict of interest. The funders had no role in the design of the study; in the collection, analysis, or interpretation of data; in the writing of the manuscript; or in the decision to publish the results.
References
- Rafiee, A.; Van der Male, P.; Dias, E.; Scholten, H. Interactive 3D Geodesign Tool for Multidisciplinary Wind Turbine Planning. J. Environ. Manag. 2018, 205, 107–124. [Google Scholar] [CrossRef]
- Daher, B.; Saad, W.; Pierce, S.A.; Hülsmann, S.; Mohtar, R.H. Trade-Offs and Decision Support Tools for FEW Nexus-Oriented Management. Curr. Sustain. Renew. Energy Rep. 2017, 4, 153–159. [Google Scholar] [CrossRef]
- Kliskey, A.; Williams, P.; Trammell, J.; Cronan, D.; Griffith, D.; Alessa, L.; de Haro-Marto, M.; Villamor, G. Oxarango-Ingram. In review. Building trust, building futures: Knowledge co-production as relationship, design, and process in transdisciplinary science. Curr. Res. Environ. Sustain. 2022, 4. submitted. [Google Scholar]
- Jones, P. Developing and Applying Interactive Visual Tools to Enhance Stakeholder Engagement in Accessibility Planning for Mobility Disadvantaged Groups. Res. Transp. Bus. Manag. 2011, 2, 29–41. [Google Scholar] [CrossRef]
- Walker Derek, H.T.; Lynda Margaret, B.; Arthur, S. Influence, Stakeholder Mapping and Visualization. Constr. Manag. Econ. 2008, 26, 645–658. [Google Scholar] [CrossRef]
- Cronan, D.; Trammell, E.J.; Kliskey, A.; Alessa, L. In review. Socio-Ecological Futures: Embedded Solutions for Stakeholder-driven Alternative Futures. SI: Trajectories of Change in Food-Energy-Water Systems: Exploring Futures of Landscape-Scale Systems Using Community Engagement Methodologies. Sustainability 2022, 14. submitted. [Google Scholar]
- Bureau, US Census. Idaho Was the Second-Fastest Growing State Last Decade. Available online: https://www.census.gov/library/stories/state-by-state/idaho-population-change-between-census-decade.html (accessed on 30 January 2022).
- Thompson, J.R.; Plisinski, J.S.; Lambert, K.F.; Duveneck, M.J.; Morreale, L.; McBride, M.; MacLean, M.G.; Weiss, M.; Lee, L. Spatial Simulation of Codesigned Land Cover Change Scenarios in New England: Alternative Futures and Their Consequences for Conservation Priorities. Earth’s Future 2020, 8, e2019EF001348. [Google Scholar] [CrossRef]
- Trammell, E.J.; Thomas, J.S.; Mouat, D.; Korbulic, Q.; Bassett, S. Developing Alternative Land-Use Scenarios to Facilitate Natural Resource Management across Jurisdictional Boundaries. J. Environ. Plan. Manag. 2018, 61, 64–85. [Google Scholar] [CrossRef]
- Hulse, D.; Branscomb, A.; Enright, C.; Bolte, J. Anticipating Floodplain Trajectories: A Comparison of Two Alternative Futures Approaches. Landsc. Ecol. 2009, 24, 1067–1090. [Google Scholar] [CrossRef]
- Iverson Nassauer, J.; Corry, R.C. Using Normative Scenarios in Landscape Ecology. Landsc. Ecol. 2004, 19, 343–356. [Google Scholar] [CrossRef] [Green Version]
- Steinitz, C. A Framework for Geodesign: Changing Geography by Design, 1st ed.; ESRI: Redlands, CA, USA, 2012. [Google Scholar]
- Eanes, F.R.; Silbernagel, J.M.; Robinson, P.; Hart, D.A. Interactive Deep Maps and Spatial Narratives for Landscape Conservation and Public Engagement. Landsc. J. 2019, 38, 7–24. [Google Scholar] [CrossRef]
- Ferguson, L.; Chan, S.; Santelmann, M.; Tilt, B. Exploring Participant Motivations and Expectations in a Researcher-Stakeholder Engagement Process: Willamette Water 2100. Landsc. Urban. Plan. 2017, 157, 447–456. [Google Scholar] [CrossRef]
- Mahmoud, M.; Liu, Y.; Hartmann, H.; Stewart, S.; Wagener, T.; Semmens, D.; Stewart, R.; Gupta, H.; Dominguez, D.; Dominguez, F.; et al. A Formal Framework for Scenario Development in Support of Environmental Decision-Making. Environ. Model. Softw. 2009, 24, 798–808. [Google Scholar] [CrossRef]
- Kliskey, A.; Lilian, A.; David, G.; Sarah, O.; Paula, W.; Sammy, M.; Martin, C.; Jim, G.; Sarah, D. Transforming Sustainability Science for Practice: A Social–Ecological Systems Framework for Training Sustainability Professionals. Sustain. Sci. 2021, 16, 283–294. [Google Scholar] [CrossRef]
- Baba, K.; Naoki, M.; Michinori, K. Scenario-Based Approach to Local Water-Energy-Food Nexus Issues with Experts and Stakeholders. In The Water-Energy-Food Nexus, Edited by Aiko Endo and Tomohiro Oh; Springer: Singapore, 2018; pp. 321–333. [Google Scholar] [CrossRef]
- Arnstein, S.R. A Ladder of Citizen Participation. J. Am. Inst. Plan. 1969, 35, 216–224. [Google Scholar] [CrossRef] [Green Version]
- Iwaniec, D.M.; Cook, E.M.; Davidson, M.J.; Berbés-Blázquez, M.; Georgescu, M.; Krayenhoff, E.S.; Middel, A.; Sampson, D.A.; Grimm, N.B. The Co-Production of Sustainable Future Scenarios. Landsc. Urban. Plan. 2020, 197, 103744. [Google Scholar] [CrossRef]
- Shearer, A.W. Approaching Scenario-Based Studies: Three Perceptions about the Future and Considerations for Landscape Planning. Environ. Plan. B Plan. Des. 2005, 32, 67–87. [Google Scholar] [CrossRef]
- Hulse, D.; Allan, B.; Chris, E.; Bart, J.; Cody, E.; John, B.; Alan, A. Anticipating Surprise: Using Agent-Based Alternative Futures Simulation Modeling to Identify and Map Surprising Fires in the Willamette Valley, Oregon USA. Landsc. Urban. Plan. Geod. Chang. World Chang. Des. 2016, 156, 26–43. [Google Scholar] [CrossRef]
- Iwaniec, D.M. Integrating Existing Climate Adaptation Planning into Future Visions—A Strategic Scenario for the Central Arizona–Phoenix Region. Landsc. Urban. Plan. 2020, 8, 103820. [Google Scholar] [CrossRef]
- Villamor, G.B.; Griffith, D.L.; Kliskey, A.; Alessa, L. Contrasting Stakeholder and Scientist Conceptual Models of Food-Energy-Water Systems: A Case Study in Magic Valley, Southern Idaho. Socio-Environ. Syst. Model. 2020, 2, 16312. [Google Scholar] [CrossRef]
- Scanlon, B.R.; Ruddell, B.L.; Reed, P.M.; Hook, R.I.; Zheng, C.; Tidwell, V.C.; Siebert, S. The Food-Energy-Water Nexus: Transforming Science for Society. Water Resour. Res. 2017, 53, 3550–3556. [Google Scholar] [CrossRef]
- Raaphorst, K.; Gerda, R.; Ingrid, D.; Van der Knaap, W.; Van den Brink, A. Reading Landscape Design Representations as an Interplay of Validity, Readability and Interactivity: A Framework for Visual Content Analysis. Vis. Commun. 2020, 19, 163–197. [Google Scholar] [CrossRef]
- Lang, J. Creating Architectural Theory: The Role of the Behavioral Sciences in Environmental. Design 1987, 1, 53–72. Available online: https://ci.nii.ac.jp/naid/10007184084/ (accessed on 15 January 2022).
- Lewis, J.L. More Art Than Science: The Sources and Effects of Stylistic Variation in Visualization for Planning and Design. Environ. Plan. B Plan. Des. 2012, 39, 551–565. [Google Scholar] [CrossRef]
- Wiek, A.; Lauren, W.; Charles, L.R. Key Competencies in Sustainability: A Reference Framework for Academic Program Development. Sustain. Sci. 2011, 6, 203–218. [Google Scholar] [CrossRef] [Green Version]
- Barnett, R. Emergence in Landscape Architecture; Routledge: New York, NY, USA, 2013. [Google Scholar]
- ESRI. Weighted Overlay, 2021. Available online: https://desktop.arcgis.com/en/arcmap/10.3/tools/spatial-analyst-toolbox/weighted-overlay.htm (accessed on 15 January 2022).
- Duchhart, I. Designing Sustainable Landscapes: From Experience to Theory: A Process of Reflective Learning from Case-Study Projects in Kenya. Ph.D. Thesis, 2007. Available online: https://library.wur.nl/WebQuery/wurpubs/355545 (accessed on 15 January 2022).
- Vroom, M.J. Lexicon of Garden and Landscape Architecture; Birkhäuser, 2006; Available online: https://0-www-degruyter-com.brum.beds.ac.uk/document/isbn/9783764375256/html (accessed on 15 January 2022).
- Boyko, C.T.; Gaterell, M.R.; Barber, A.R.; Brown, J.; Bryson, J.R.; Butler, D.; Caputo, S.; Caserio, M.; Coles, R.; Cooper, R.; et al. Benchmarking Sustainability in Cities: The Role of Indicators and Future Scenarios. Glob. Environ. Chang. 2012, 22, 245–254. [Google Scholar] [CrossRef]
- ESRI. Geoplanner. 2019. Available online: https://doc.arcgis.com/en/geoplanner/latest/documentation/what-is-a-geodesign-project.htm (accessed on 21 February 2022).
- Koua, E.L.; Maceachren, A.; Kraak, M.-J. Evaluating the Usability of Visualization Methods in an Exploratory Geovisualization Environment. Int. J. Geogr. Inf. Sci. 2006, 20, 425–448. [Google Scholar] [CrossRef]
- Stewart, A.F.; Christopher Zegras, P. CoAXs: A Collaborative Accessibility-Based Stakeholder Engagement System for Communicating Transport Impacts. Res. Transp. Econ. 2016, 59, 423–433. [Google Scholar] [CrossRef]
Figure 1.
Scenario representations are depicted in this diagram as diagrammatic axonometric drawings to demonstrate the suitability criteria for each scenario.
Figure 1.
Scenario representations are depicted in this diagram as diagrammatic axonometric drawings to demonstrate the suitability criteria for each scenario.

Figure 2.
This diagram illustrates scenario process and indicator representations. Process diagrams, graphs, and system concept maps were used to explain the process and performance metrics of each scenario.
Figure 2.
This diagram illustrates scenario process and indicator representations. Process diagrams, graphs, and system concept maps were used to explain the process and performance metrics of each scenario.

Figure 3.
This figure illustrates an example of digital decision tools used in scenario representations. Suitability criteria and ESRI’s Geoplanner were both used to demonstrate and engage stakeholders in order to gather their feedback about geospatial changes in each scenario for 2050.
Figure 3.
This figure illustrates an example of digital decision tools used in scenario representations. Suitability criteria and ESRI’s Geoplanner were both used to demonstrate and engage stakeholders in order to gather their feedback about geospatial changes in each scenario for 2050.

Figure 4.
This figure illustrates 3-D scenario representations: video simulations and 3-D model simulations gave stakeholders a contextual understanding of how each scenario fit into the surrounding context within contiguous land use and land cover phenomena.
Figure 4.
This figure illustrates 3-D scenario representations: video simulations and 3-D model simulations gave stakeholders a contextual understanding of how each scenario fit into the surrounding context within contiguous land use and land cover phenomena.

Figure 5.
This figure demonstrates a scenario representation (population boom) taking the form of a solutions example. Stakeholders determined solutions aligned with the temporal shift in biophysical (water availability) and social (population change) variables in each scenario.
Figure 5.
This figure demonstrates a scenario representation (population boom) taking the form of a solutions example. Stakeholders determined solutions aligned with the temporal shift in biophysical (water availability) and social (population change) variables in each scenario.

Figure 6.
This chart depicts the results of the GU metric aligned with stakeholder survey results. Stakeholder representation ranking means compared to geovisualization usability representation means are shown here to understand similarities.
Figure 6.
This chart depicts the results of the GU metric aligned with stakeholder survey results. Stakeholder representation ranking means compared to geovisualization usability representation means are shown here to understand similarities.


Table 1.
Scenario representation type usage per stakeholder meeting.
| Meeting 1: SAG Understandings Addressed | Meeting 2: Actors and Uncertainties (Spring 2018) | Meeting 3: Scenario Narratives (Fall 2018) | Meeting 4: Scenario Revisions 1 (Spring 2019) | Meeting 5: Scenario Revisions 2 & 3 (Fall 2019–Current) |
|---|---|---|---|---|
| Decision-making; Challenges; Surprise; Uncertainty; Policy | 3-D visualizations | 3-D visualizations; 3-D digital Fly throughs | ||
| Decision-making; Challenges; Surprise; Uncertainty; Policy | Process Diagrams | Process Diagrams | Process Diagrams | Process Diagrams |
| Challenges; Surprise; Uncertainty | Bar Graphs and Pie Charts | Bar Graphs and Pie Charts | Bar Graphs and Pie Charts | Bar Graphs and Pie Charts |
| Decision-making; Uncertainty; Policy | Scenario Mapping Digital Tool | Scenario Mapping Digital Tool | ||
| Decision-making; Challenges; Policy | Solutions Diagrams & Visualizations | |||
| Decision-making; Uncertainty; Policy | Suitability Criteria | Suitability Criteria | Suitability Criteria | |
| Decision-making; Uncertainty; Policy | Analog Drawings | Analog Drawings | ||
| Decision-making; Uncertainty; Policy | Stylized Scenario Depictions | Stylized Scenario Depictions |
Table 2.
Geovisualization usability metric per scenario representation.
| GU Visualization Operator | Description |
|---|---|
| Locate | Indicates data items of a certain range of values |
| Identify | Identifies relationships between attributes |
| Distinguish | Distinguishes how a target value measured at one location, varies for different attributes |
| Categorize | Categorizes elements into general groupings |
| Rank | Indicates the best to worst cases of the attribute |
| Compare | Compares values at different spatial locations |
| Associate | Forms relationships between data and defined assumptions |
| Correlate | Discerns which data items share similar attributes |
Table 3.
t test sample table comparing means of stakeholder survey results with the GU metric.
| Statistic | Value |
|---|---|
| Mean of SAG responses | 5.02 |
| Mean of GU metric | 6.56 |
| Variance in SAG responses | 2.37 |
| Variance in GU metric | 0.87 |
| Observations | 9 |
| Pooled variance | 1.798105 |
| Hypothesized mean difference | 0 |
| df | 14 |
| t Stat | 1.977443 |
| P(T ≤ t) one-tail | 0.028322 |
| t critical one-tail | 1.76131 |
| P(T ≤ t) two-tail | 0.0236310 |
| T Critical two-tail | 2.1603686 |
Publisher’s Note: MDPI stays neutral with regard to jurisdictional claims in published maps and institutional affiliations. |
© 2022 by the authors. Licensee MDPI, Basel, Switzerland. This article is an open access article distributed under the terms and conditions of the Creative Commons Attribution (CC BY) license (https://creativecommons.org/licenses/by/4.0/).
Share and Cite
MDPI and ACS Style
Cronan, D.; Trammell, E.J.; Kliskey, A. Images to Evoke Decision-Making: Building Compelling Representations for Stakeholder-Driven Futures. Sustainability 2022, 14, 2980. https://0-doi-org.brum.beds.ac.uk/10.3390/su14052980
AMA Style
Cronan D, Trammell EJ, Kliskey A. Images to Evoke Decision-Making: Building Compelling Representations for Stakeholder-Driven Futures. Sustainability. 2022; 14(5):2980. https://0-doi-org.brum.beds.ac.uk/10.3390/su14052980
Chicago/Turabian StyleCronan, Daniel, E. Jamie Trammell, and Andrew (Anaru) Kliskey. 2022. "Images to Evoke Decision-Making: Building Compelling Representations for Stakeholder-Driven Futures" Sustainability 14, no. 5: 2980. https://0-doi-org.brum.beds.ac.uk/10.3390/su14052980
Note that from the first issue of 2016, this journal uses article numbers instead of page numbers. See further details here.