Article

Valorization of Juglans regia. L Bark Residues as a Natural Colorant Based on Response Surface Methodology: A Challenging Approach to a Sustainable Dyeing Process for Acrylic Fabrics

1
Department of Early Childhood, University College of Turabah, Taif University, P.O. Box 11099, Taif 21944, Saudi Arabia
2
Department of Chemistry, Faculty of Sciences of Monastir, Research Laboratory—Environmental Chemistry and Clean Processes (LR21ES04), University of Monastir, Monastir 5000, Tunisia
*
Author to whom correspondence should be addressed.
Sustainability 2022, 14(7), 4134; https://0-doi-org.brum.beds.ac.uk/10.3390/su14074134
Submission received: 9 March 2022 / Revised: 27 March 2022 / Accepted: 28 March 2022 / Published: 30 March 2022
(This article belongs to the Topic Solid Waste Management)

Abstract

:
The dyeing industry is considered one of the most polluting industries. Thus, several researchers have focused on studying the possibilities of natural textile dyeing. The objective of this paper was to optimize the microwave extraction process for Juglans regia bark residues in order to dye acrylic fabrics. Hence, at first, the following extraction conditions were studied: microwave power, pH, extraction duration and concentration of dry mass. Flavonoid and tannin content was measured each time. Moreover, the obtained extracts were used for dyeing acrylic fibers with microwave assistance, and the corresponding color yield (K/S) was measured. Then, the microwave extraction process already developed was optimized; a response surface design was established using Minitab 19 software. The optimal extraction conditions were found to be: microwave power = 850, pH = 3 and extraction time = 4 min. Finally, dyed and undyed acrylic were characterized by infrared (FTIR) spectroscopy in order to distinguish the effect of this natural dye on the external layer of the acrylic fiber.

Graphical Abstract

1. Introduction

Consumers, as well as textile and fashion researchers, are becoming increasingly interested in the notion of sustainable textiles. Indeed, several alternatives are becoming available on the market to make sustainable clothing. In order to make a sustainable textile, it is important to ensure that all the manufacturing and finishing stages it undergoes meet this criterion. Among these steps, particular interest was given in this study to the dyeing of clothes with natural dyes extracted by the application of modern and sustainable methods [1,2].
Textile dyeing is a very polluting industry. It has a detrimental effect on the environment and generates toxic and dangerous wastes. Searching for cleaner dyeing and finishing processes is increasingly becoming a priority for manufacturers and textile researchers. In this context, natural dyes and their extraction methods have become the subject of several recent studies [3,4,5]. Natural dyes are renewables, biodegradables and they can replace the synthetic dyes already used in the textile dyeing industry since they will lead to cleaner and more sustainable processes [6,7]. Natural dyes can be extracted from several natural resources such as plants, animals and minerals.
Juglans regia. L is a leafy tree with an initially brown bark that turns grayish in color with age. The residues of Juglans regia bark are rich in phenolic compounds such as gallic tannins, hydrolyzable tannins, phenolic acids and flavonoids [8]. It should be noted that flavonoids and tannins are compounds and could be a source of natural dye for textile use. Streamlining the extraction mechanism for a particular source of natural color is a very important step in optimizing the results of a dye. For this, it is necessary to develop the notion of extraction, as well as the different parameters that could react to this operation.
Extraction is a procedure applied to extract from plants their reserves of essential oils, pigments, etc. [9,10,11]. Plant products are usually divided in water but sometimes in portal solvents, which have growing polarity. Solvation is expressed by a strong affinity between a carrier fluid and the active molecules frozen in a solid medium. Therefore, it is a solid–liquid interaction of different kinds depending on the solute, and the solvent and covers different phenomena such as ion–dipole interactions (Na+/water), hydrogen bonds (alcohol/water) or van der Waals bonds (methane/cyclohexane). This interaction designates the extraction mechanism [12].
Conventional extraction techniques have been applied for many years. However, several drawbacks have been noted regarding their energy and solvent consumption and high cost. Thus, to avoid the drawbacks of conventional extraction processes, modern techniques have appeared, namely extraction by infusion, percolation, microwave energy [1,2,13], ultrasonic energy [14,15], etc. Several researchers have argued that microwave extraction is more effective than other methods, primarily because it is fast, economical, inexpensive, etc. Hence, special interest was given to microwave extraction in this study. Indeed, it is a method that eliminates solutes from a solid matrix into a solvent. It grants energy-saving factors and quick processing durations, which result in a decrease in laboratory and manufacturing costs and the enhancement of product yields and uniformity, leading to products having high quality compared with other extraction methods [13,16].
In this paper, microwave-assisted extraction of natural dye from residues of Juglans regia barks will be studied in order to be optimized. Evaluation of the results will be based on the estimation of flavonoid and tannin content in the extracts under the various extraction conditions, as well as on the dyeing quality of the acrylic fabrics.

2. Materials and Methods

2.1. Textile Material

The acrylic fabric used in this study was purchased from a local market in Ksar Hellal, Tunisia.

2.2. Preparation of Plant Material

The plant material contains bark residues of Juglans regia collected from the Fernena region. At first, it was washed with water, then dried at room temperature in the dark, in order to preserve the integrity of the constituents as much as possible. Finally, it was ground in a grinder to obtain a smooth powder.

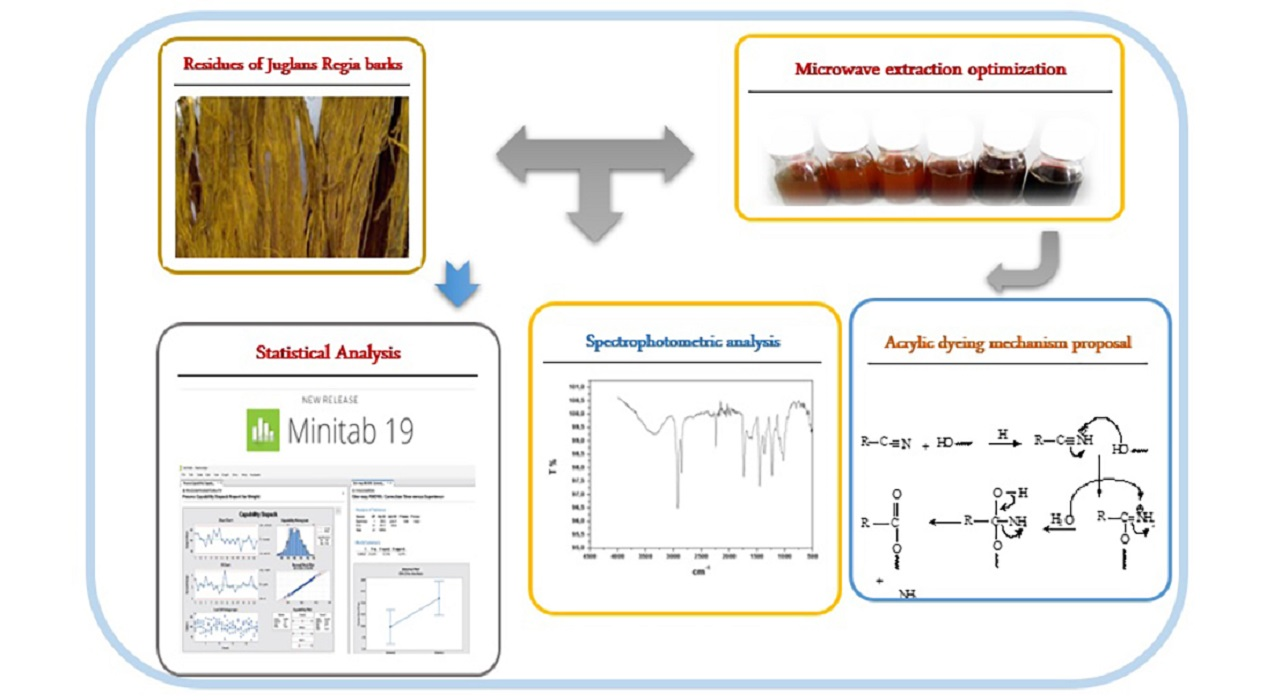
2.3. Microwave Extraction Process

A mass equal to 0.5 g of crushed Juglans regia bark residues is dissolved in 100 mL of water. The extraction was carried out using a microwave at a power of 350 W for a period of 3 min. At the end of the microwave extraction process, the extract was filtered to remove the remaining plant material. A liquid extract ready for dyeing was thus obtained.

2.4. Microwave Dyeing Process

The dyeing technique used consists of impregnating the textile material in the Juglans regia bark residues aqueous extract prepared according to the following parameters: microwave power = 350 W; plant mass = 0.5 g in 100 mL of water; duration = 3 min in the microwave.

2.5. Determination of the Content of Colored Compounds

2.5.1. Determination of the Content of Flavonoids

The level of flavonoids is estimated by the AlCl3 method [17]. Catechin is used as standard, and the quantity of flavonoids is estimated in (mg EQ/g) of Juglans regia bark residue dry extract.

2.5.2. Determination of the Content of Condensed Tannins

This test is based on the condensation of polyphenolic compounds with vanillin in an acid medium. It is specific for flavones3-ols [18]. The condensed tannin concentration is calculated from the regression equation of the catechin standard curve (0–1 mg/mL) and expressed in milligrams of the extract weight (mg EQ/g E) [17].

2.5.3. Determination of the Content of Hydrolyzable Tannins

This method is based on a reaction with ferric chloride. The mixture of the tannic extract with the ferric chloride reagent causes the complexion to turn purple-red, resulting in the formation of ions. The concentration of hydrolyzable tannins is calculated from the regression equation for the standard gallic acid curve (0–1 mg/mL) and expressed in milligrams of the weight of the extract (mg EQ/g E) [19].

2.6. Dyeing Quality Evaluation

Color yield (K/S) and colorimetric coordinates (L*, a*, b*) were estimated by a Spectro Flash SF300 spectrophotometer, with illuminant D65 at a 10° observer angle and 400–700 nm scan. Data were analyzed by Data Master software (Data Color 121 International, USA).

2.7. Dyeing Fastness Properties

The fastness properties of the dyed acrylic fabrics were estimated, namely the washing fastness (ISO 105-CO2, 1989), rubbing fastness (ISO 105-X12, 2016) and light fastness (ISO 105-B01, 2015).

2.8. Spectral Infrared Characterization (FTIR)

The sample was subjected to electromagnetic radiation with wavelengths between 2.5 and 25 µm. Fourier-transform infrared spectra (FTIR) were registered between 4000 and 400 cm−1 using a Perkin Elmer® spectrophotometer.

2.9. Statistical Analysis

Minitab provides numerous data files based on concrete scenarios covering different sectors and fields of study [20,21]. The technique of experiment design aims to optimize the effects of selected variables on the response studied. The experimental matrix, statistical and graphical analysis were established on the basis of Minitab19 software (Ver. 19.0, U.S. Federal Government Commonwealth of Pennsylvania, 134 USA).

3. Results and Discussion

3.1. Development of a Microwave Extraction Process

In this section, standard extraction conditions are set at: pH = 5; microwave power = 350 W; duration = 3 min; dry mass = 5 g; water volume = 1000 mL; and bath ratio = 1/40. The flavonoid (F), condensed tannin (Tc) and hydrolyzable tannin (Th) content, as well as the color yield (K/S), was measured for each parameter variation.

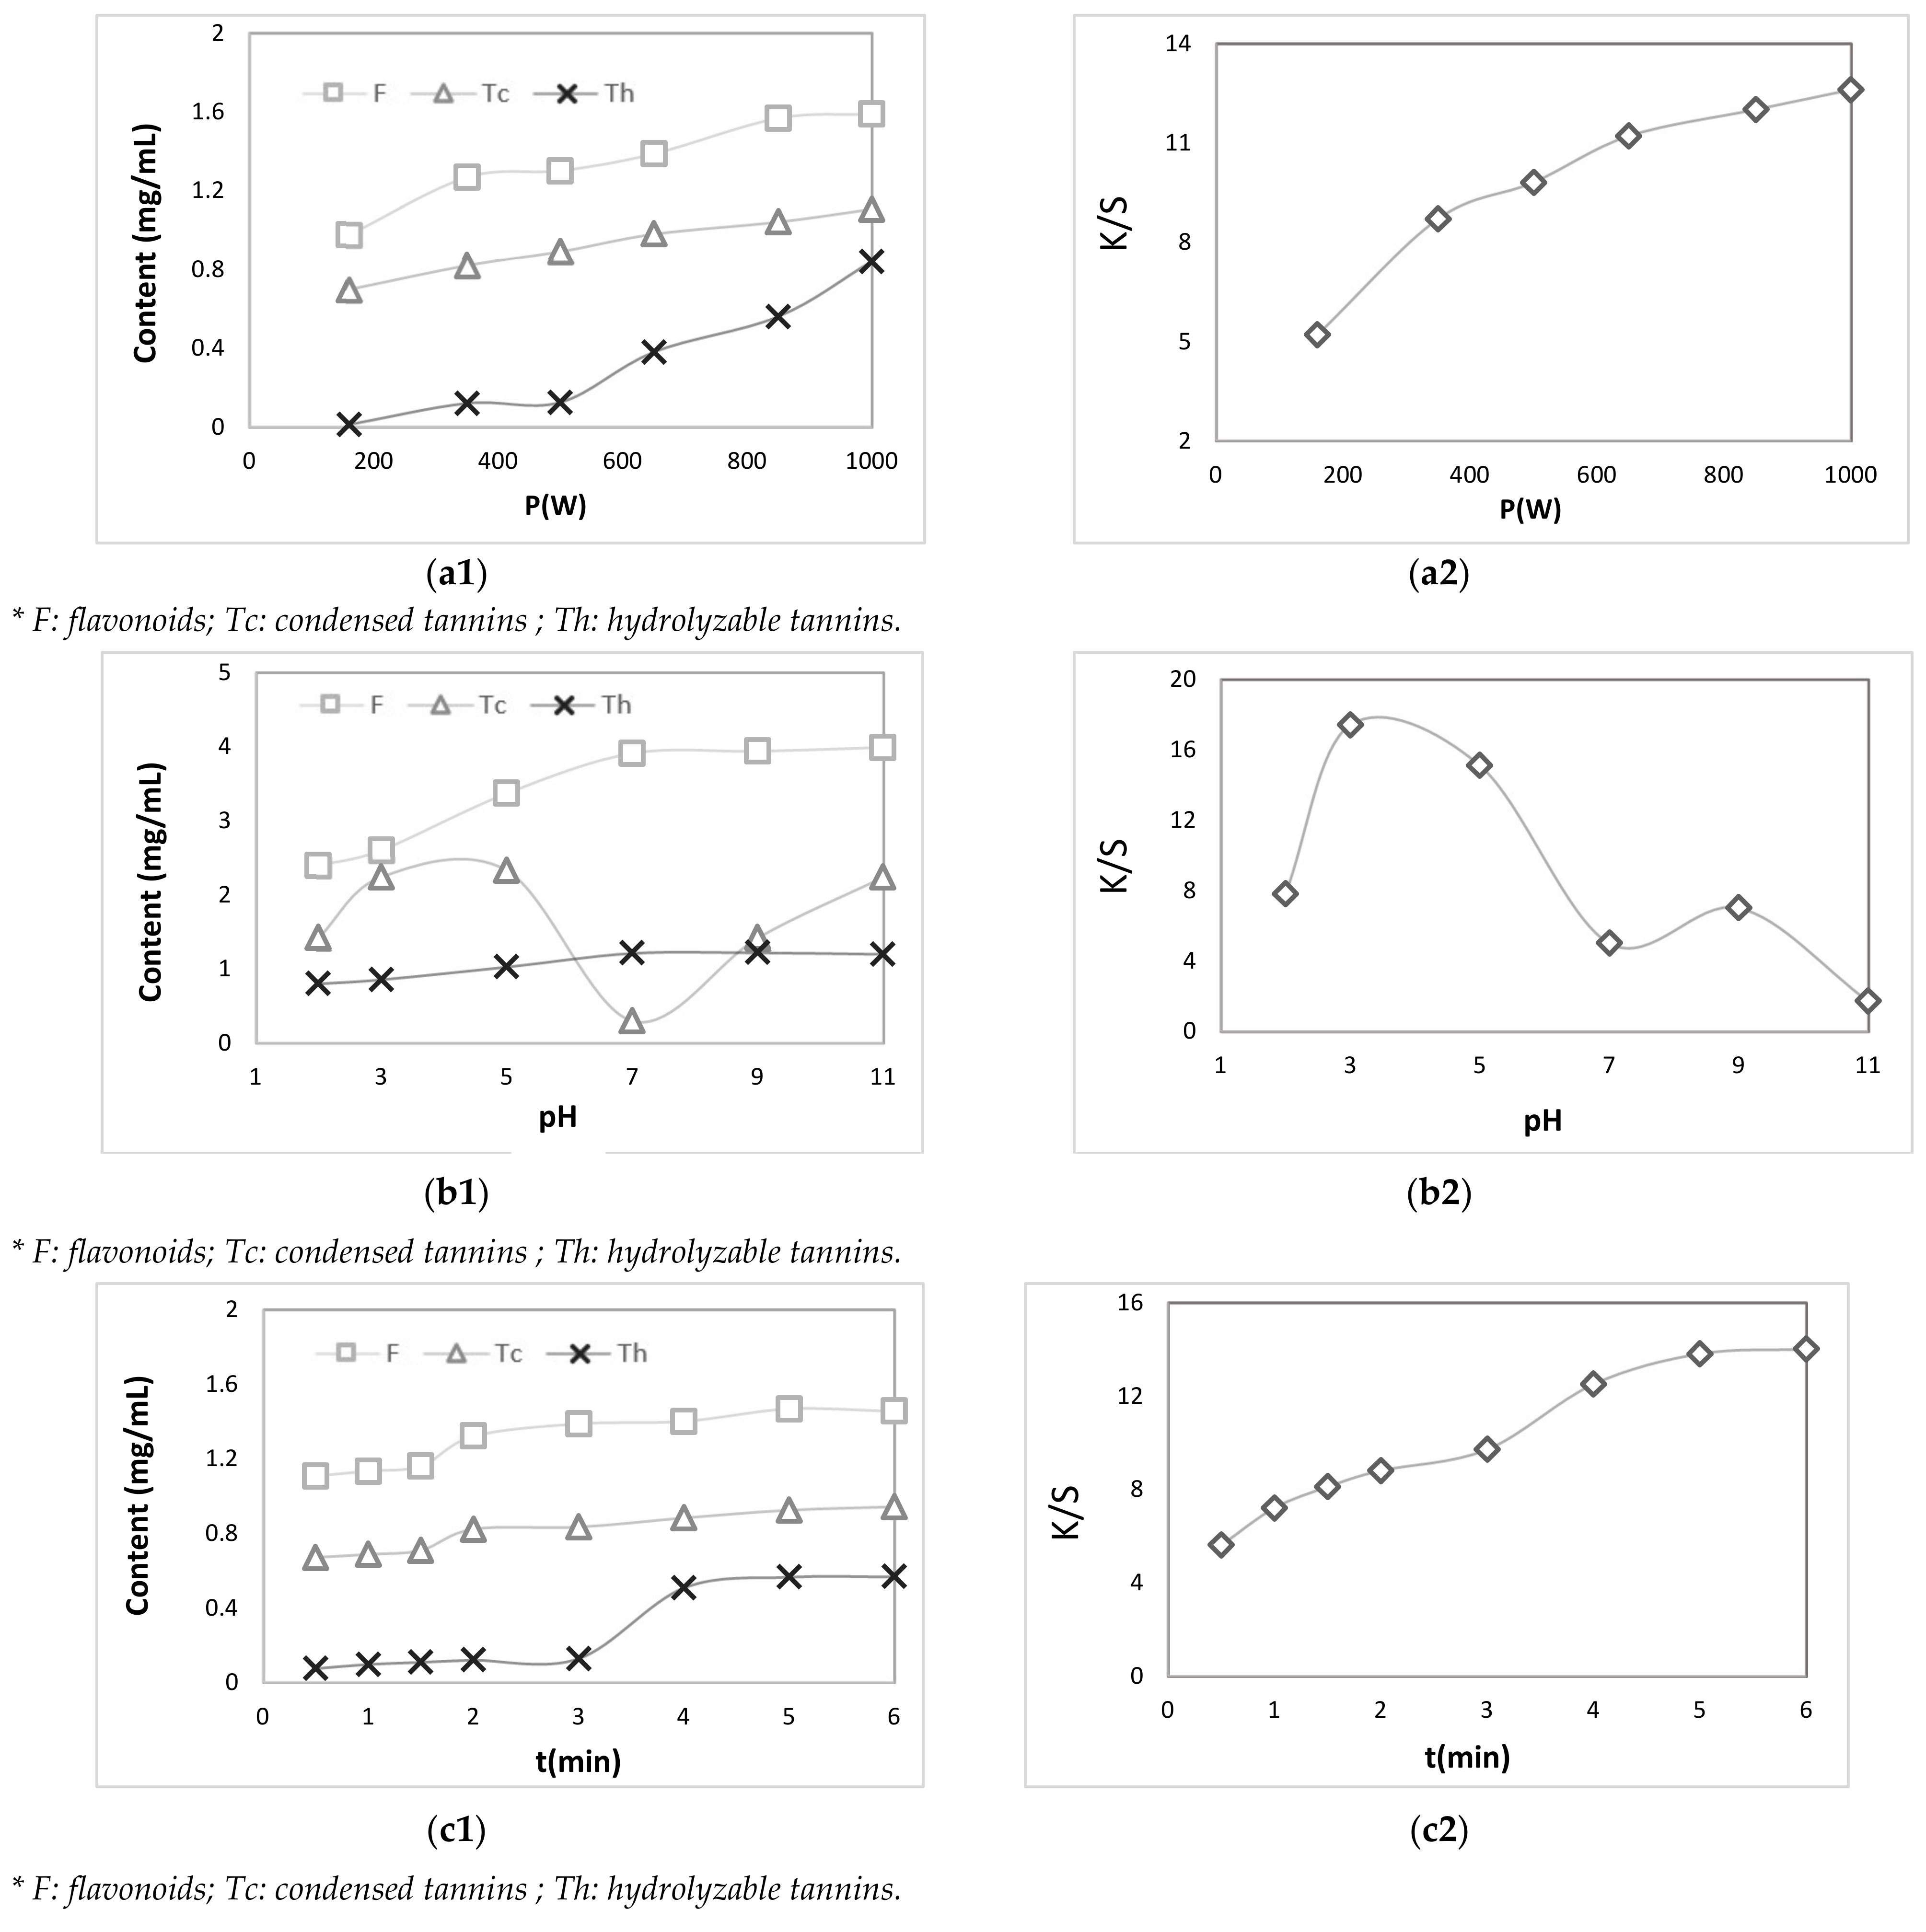
3.1.1. Effect of the Extraction Microwave Power

The evolution of flavonoid, condensed tannin and hydrolyzable tannin content as a function of microwave power is presented in Figure 1(a1). Based on this figure, it can be observed that the highest content of flavonoids, condensed tannins and hydrolyzable tannins was reached at a microwave power of 1000 W. The color yield evolution of acrylic as a function of microwave extraction power is presented in Figure 1(a2). Based on this graph, the positive impact of an increase in extraction power on the dyeing quality of the acrylic fabrics could be confirmed. This parameter reaches a value close to 14 at a microwave power equal to 1000 W. This could be explained by an increase in the content of compounds responsible for coloring at this high power, namely the content of flavonoids and tannins.

3.1.2. Effect of the Extraction pH

The evolution of flavonoid, condensed tannin and hydrolyzable tannin content as a function of pH is presented in Figure 1(b1). Referring to this figure, it can be noticed that the content of flavonoids gradually increased as the pH increased. It reached a maximum value close to 4 mg/mL at pH = 7, so it can be concluded that the extraction of flavonoids was more favorable in a basic medium, unlike the content of tannins, which reached its maximum at pH = 3. The evolution of the color yield (K/S) of the acrylic fabrics as a function of the extraction pH is presented in Figure 1(b2). From this graph, it can be realized that the color yield of the acrylic fabrics increased in the acidic medium and reached a maximum with a value of K/S close to 17 at pH = 3. This could be explained by the fact that the affinity of the acrylic fibers for the extract of Juglans regia bark residues was better in the acid medium.

3.1.3. Effect of the Extraction Duration

The evolution of flavonoid, condensed tannin and hydrolyzable tannin content as a function of duration extraction is presented in Figure 1(c1). Based on this graph, it can be noted that the flavonoid and tannin content reached significant values with an extraction duration of 4 min. Thus, the longer the extraction duration, the higher the flavonoid and tannin content. The color yield (K/S) evolution of the dyed acrylic fabrics at different extraction durations is presented in Figure 1(c2).
Based on this graph, it can be distinguished that the duration positively influenced the dyeing quality result. Indeed, a color yield (K/S) of the acrylic fabric close to 14 for an extraction duration of 5 min was reached. This could be explained by the high contact time of the extraction solvent with the plant matrix, which led to an increase in the colored compound content and therefore to an increase in the resulting coloration.

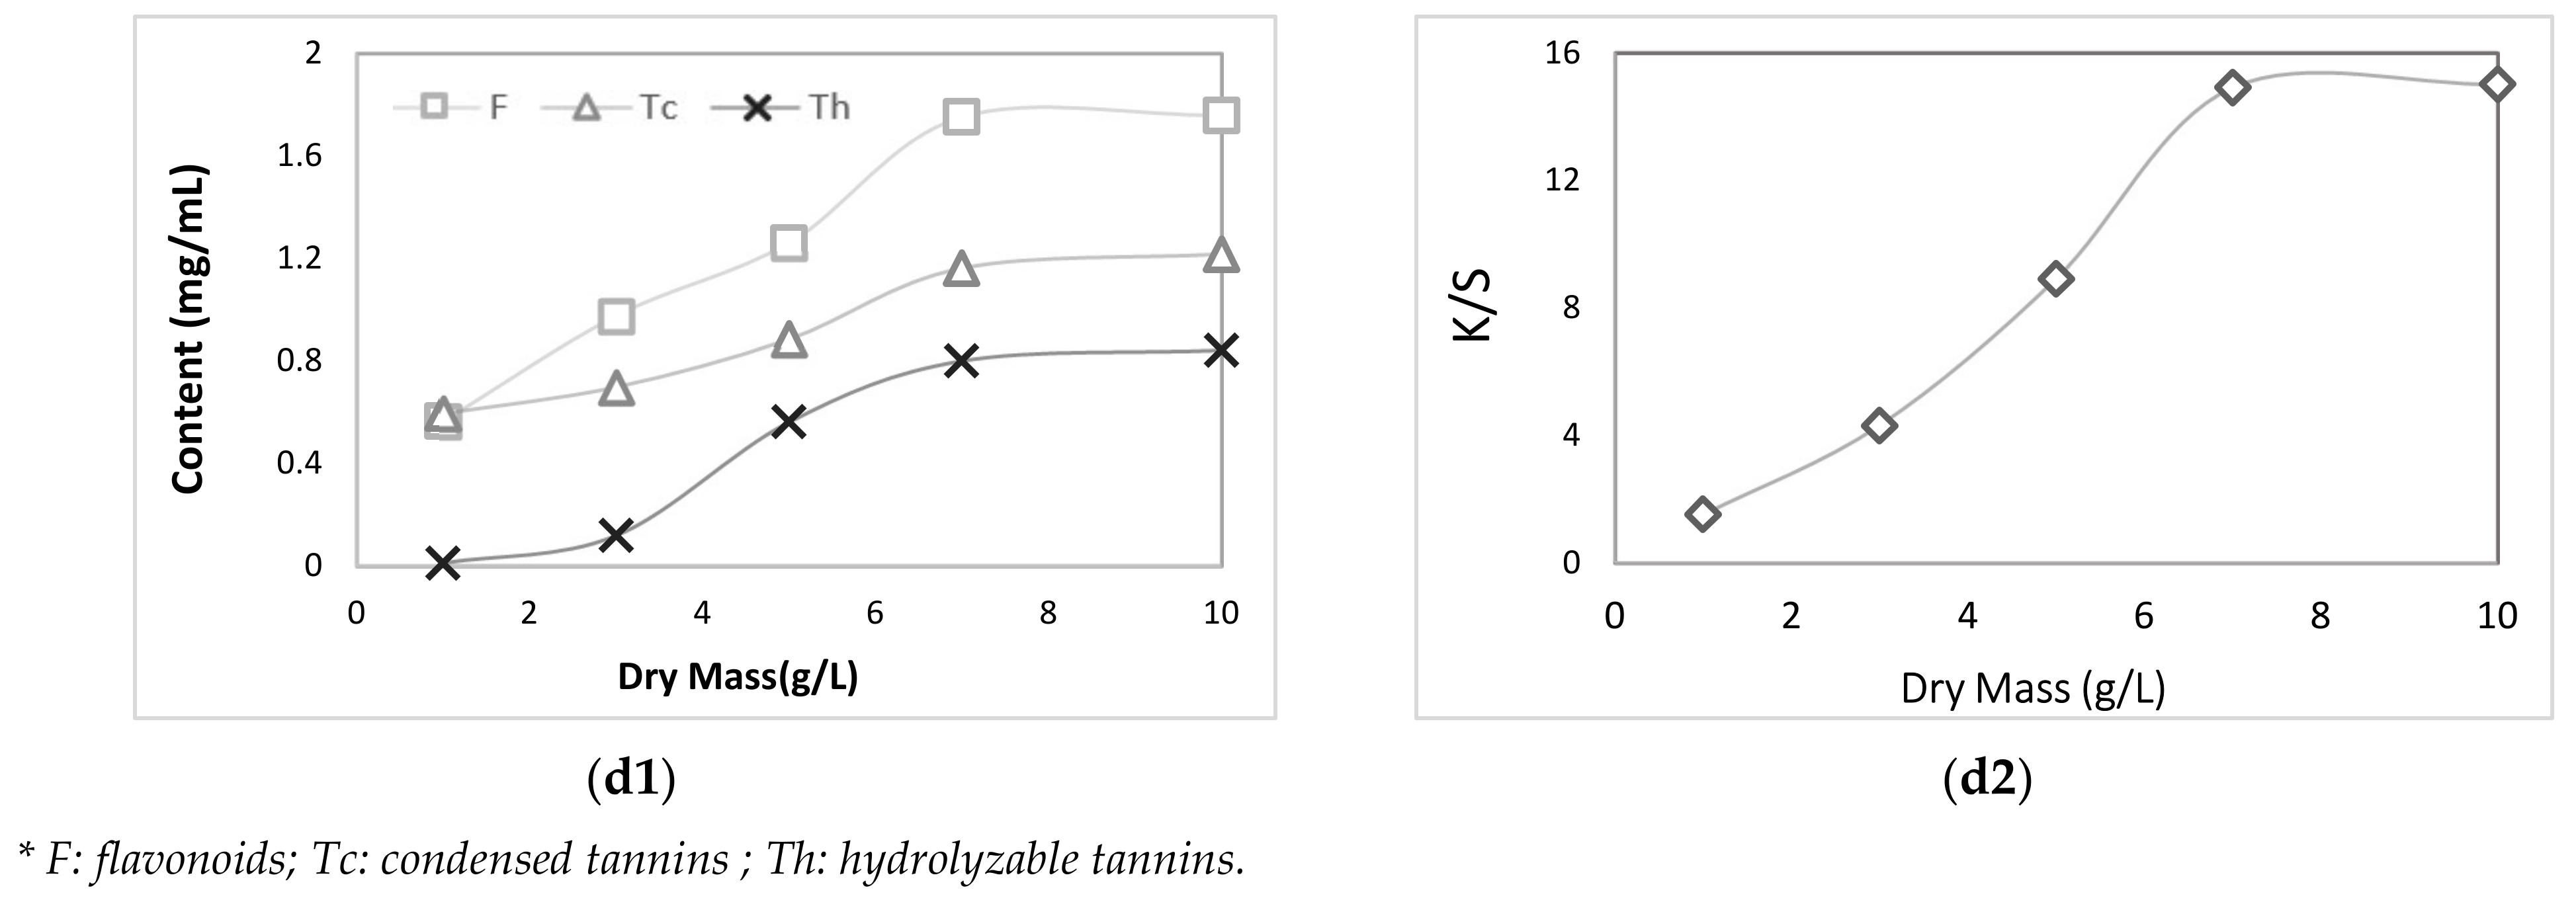
3.1.4. Effect of the Dry Mass of Juglans regia Bark Residues

The evolution of flavonoid, condensed tannin and hydrolyzable tannin content as a function of the dry mass of Juglans regia bark residues is presented in Figure 1(d1). Based on this graph, it can be observed that the maximum flavonoid, hydrolyzable tannin and condensed tannin content was obtained for an amount of dry mass equal to 7 g/L. The color yield (K/S) evolution of dyed acrylic fabrics as a function of the dry mass of Juglans regia bark residues is presented in Figure 1(d2). From this graph, it can be seen that (K/S) increased according to the concentration of the dry mass up to a value of 7 g of the bark residue’s powder. In this interval, the quantity of vegetable matter that formed in the reaction medium was increasing, resulting in an improvement in the absorption of the dye by the fiber and consequently an increase in the coloring yield.

3.2. Optimization of the Microwave Extraction Process

3.2.1. Response Surface Design

Experimental designs make it possible to simultaneously analyze the effects of input variables (factors) on an output variable (response). These experimental plans consist of a series of tests (or tests) during which the input variables are intentionally modified. Data are collected for each trial. The experimental plans make it possible to identify the conditions of the processes and the components of the products that influence the quality and thus determine the parameters of the factors offering optimal results [20,21]. The response surface design is an experimental design method used by software (MINITAB Ver. 19.0, US Federal Government Commonwealth of Pennsylvania, USA). It has been used to model and optimize the experimental conditions of the microwave extraction process. Evaluation of the quality of the natural dye extracted from the Juglans regia bark residues is achieved based on the measurement of the color yield of the acrylic fabric dyed with the extract obtained each time [22].
The factors studied in this section are: microwave power P = 150–500 and 850 W; duration of extraction t = 0.5–2 and 4 min; pH = 3–7 and 9. The established response surface design is described in Table 1.

3.2.2. Establishment of the Mathematical Model

Owing to multiple regression analysis on the experimental data, the model of the expected response could be expressed by the following quadratic polynomial (Equation (1)):
K/S = 8.34 − 0.303 pH + 0.01380 P(W) + 1.292 t (min) + 0.0714 pH × pH − 0.000006 P(W) × P(W) − 0.042 t (min) × t (min) − 0.000822 pH × P(W) − 0.1453 pH × t (min) + 0.000201 P(W) × t (min)
The correlation coefficient R2 corresponding to Equation (1) is equal to 93.11%. This parameter provides information on the degree of predictability of a mathematical model. Indeed, a value of 100% implies a perfect prediction, while a value of 0% indicates a null prediction of the model. For this case, the correlation coefficient R2 observed was equal to 93.11(%), which implied that the proposed model was highly predictable and made sense in this statistical study.

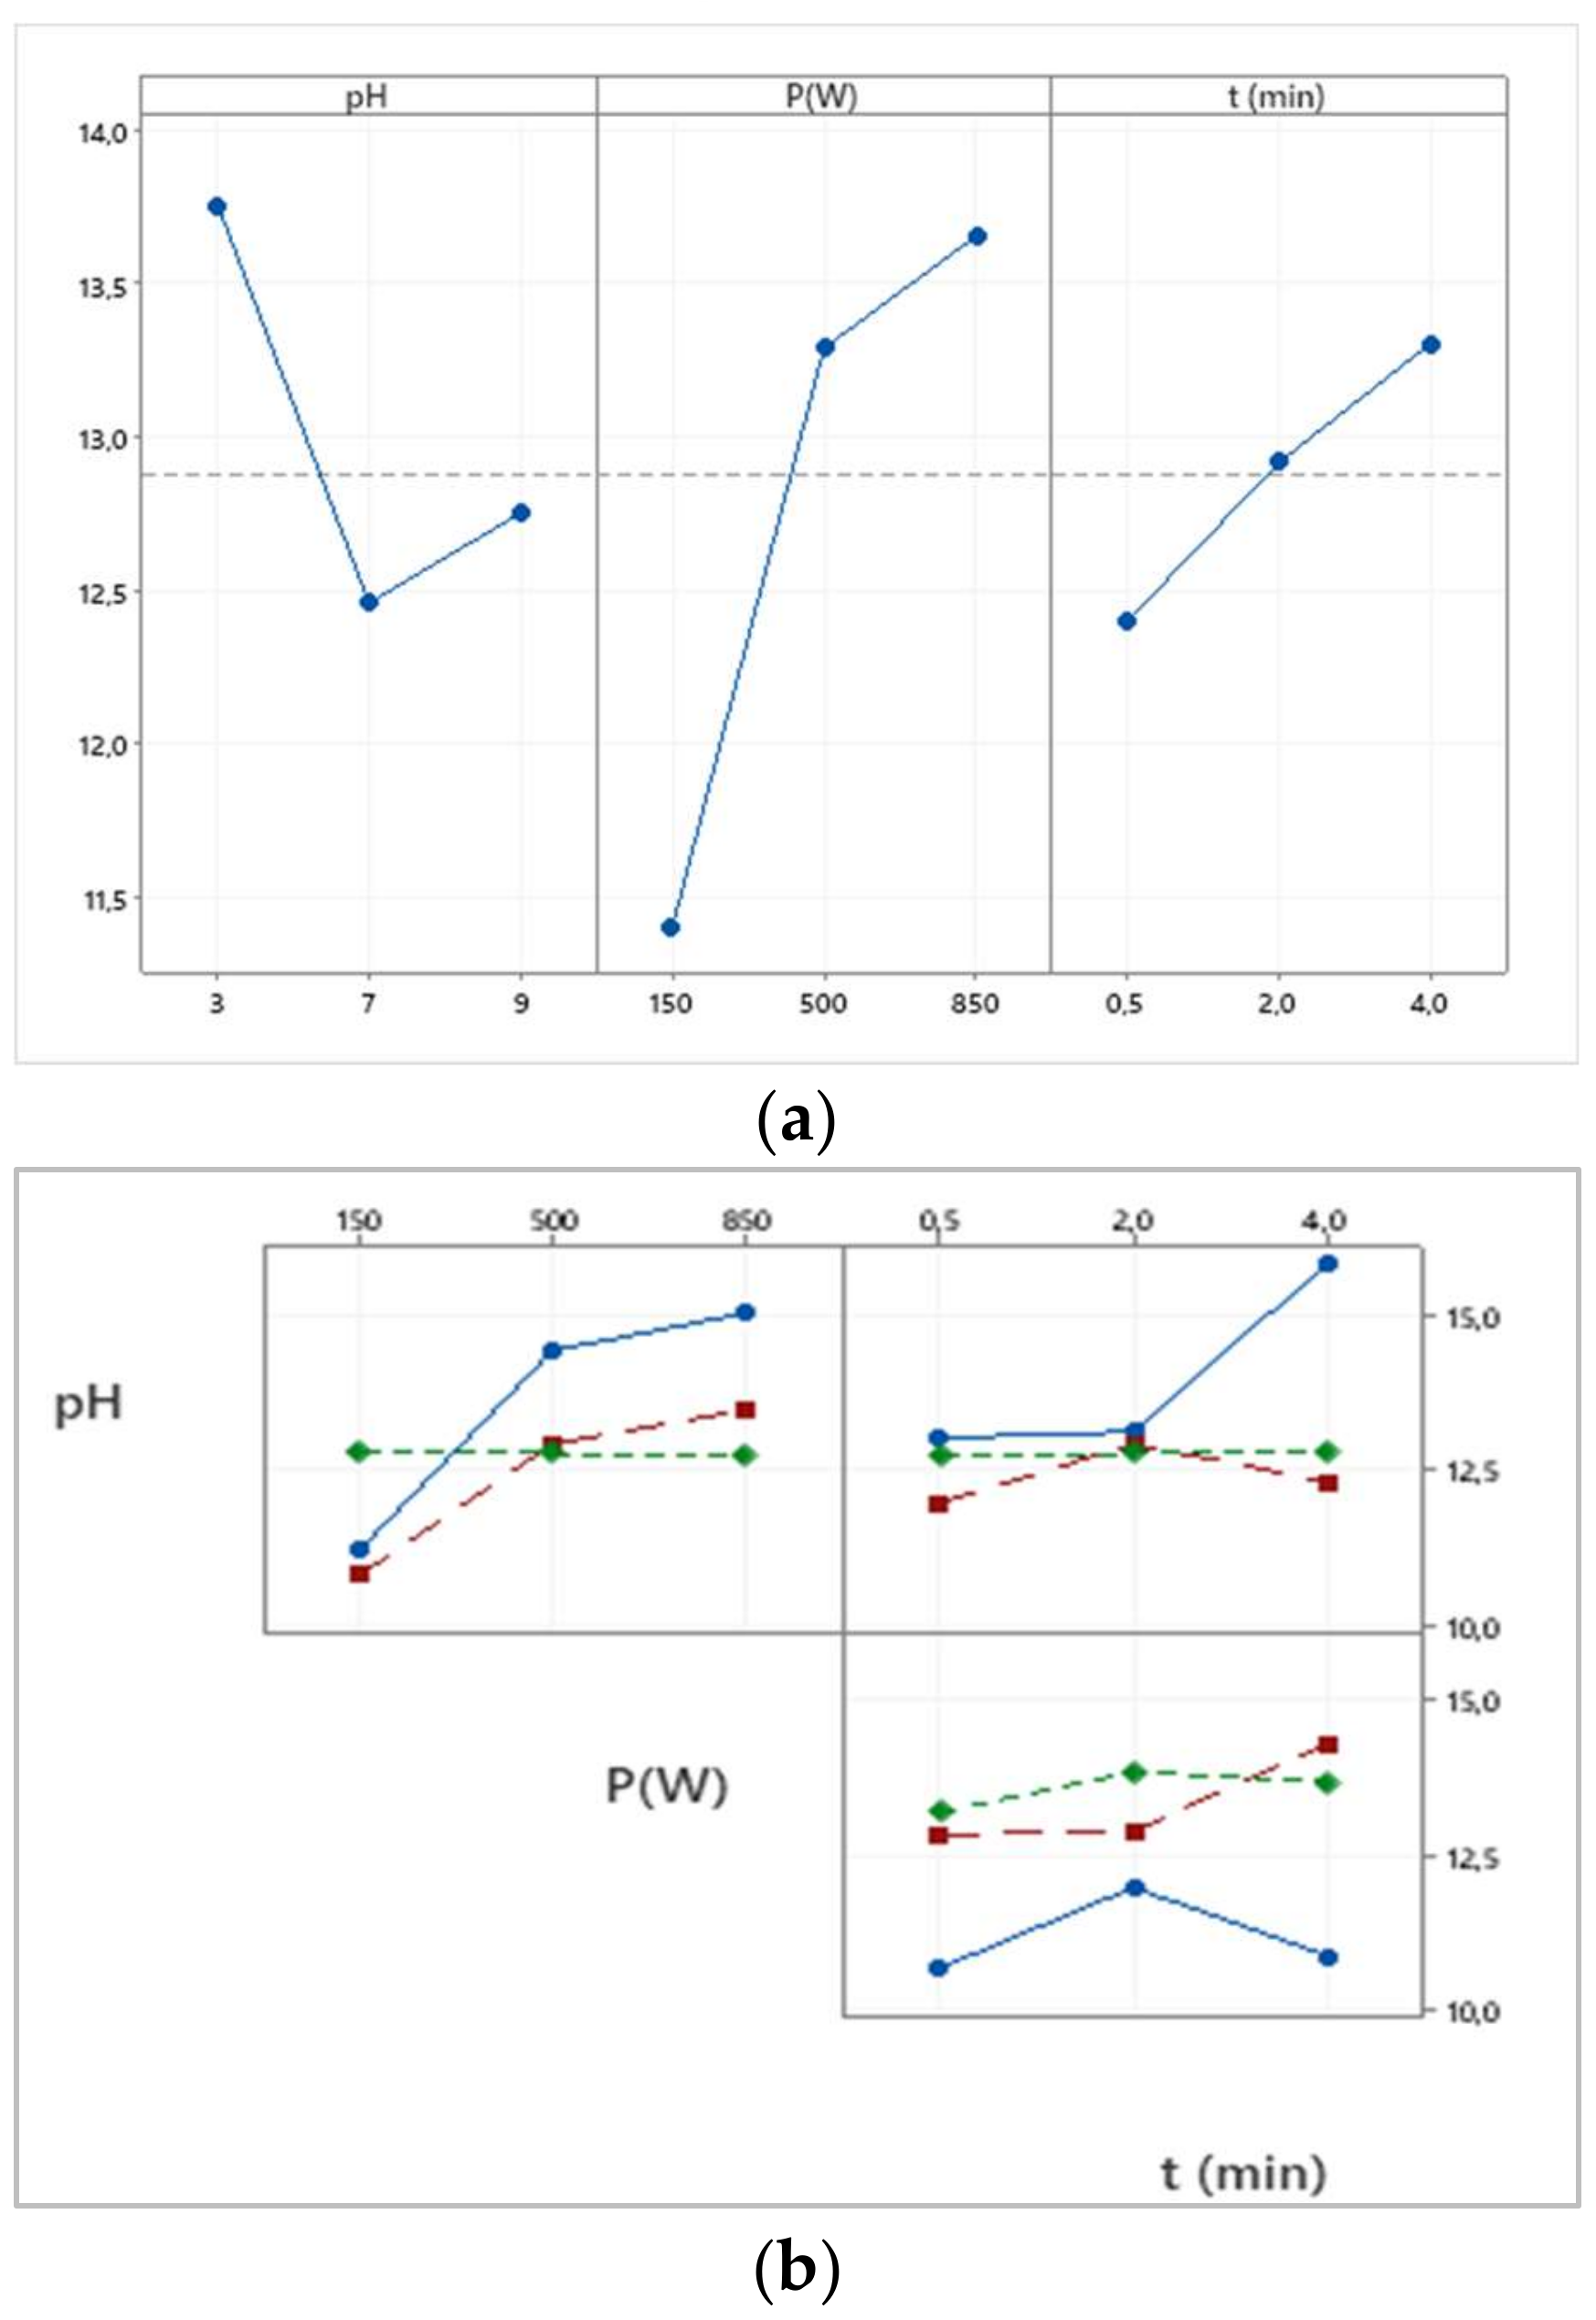
3.2.3. Main Effects Diagram of Microwave Extraction Conditions

The diagram of the main effects related to the color yield (K/S) of the acrylic dyed by the extract of Juglans regia bark residues as a function of three factors (pH, power and duration of extraction) is described in Figure 2a. From this graph, it can be observed that:
-
The power positively affected the dyeing quality of the acrylic fabrics from 150 to 500 W. This effect decreased from 500 to 850 W.
-
From 0.5 to 2 min, the duration of the extraction slightly affected the dyeing quality obtained.
-
The pH intensely affected the dyeing quality of the acrylic fabrics from 3 to 7. This effect became quite significant from a neutral pH to a basic pH.

3.2.4. Analysis of the Effects of the Main Interactions

The purpose of this analysis was to study the degree of interactions between the different factors considered (duration, pH and extraction power). The effects of the main interactions are described in Figure 2b. Based on this figure, it can be deduced that there was a strong interaction between pH, duration and extraction power.

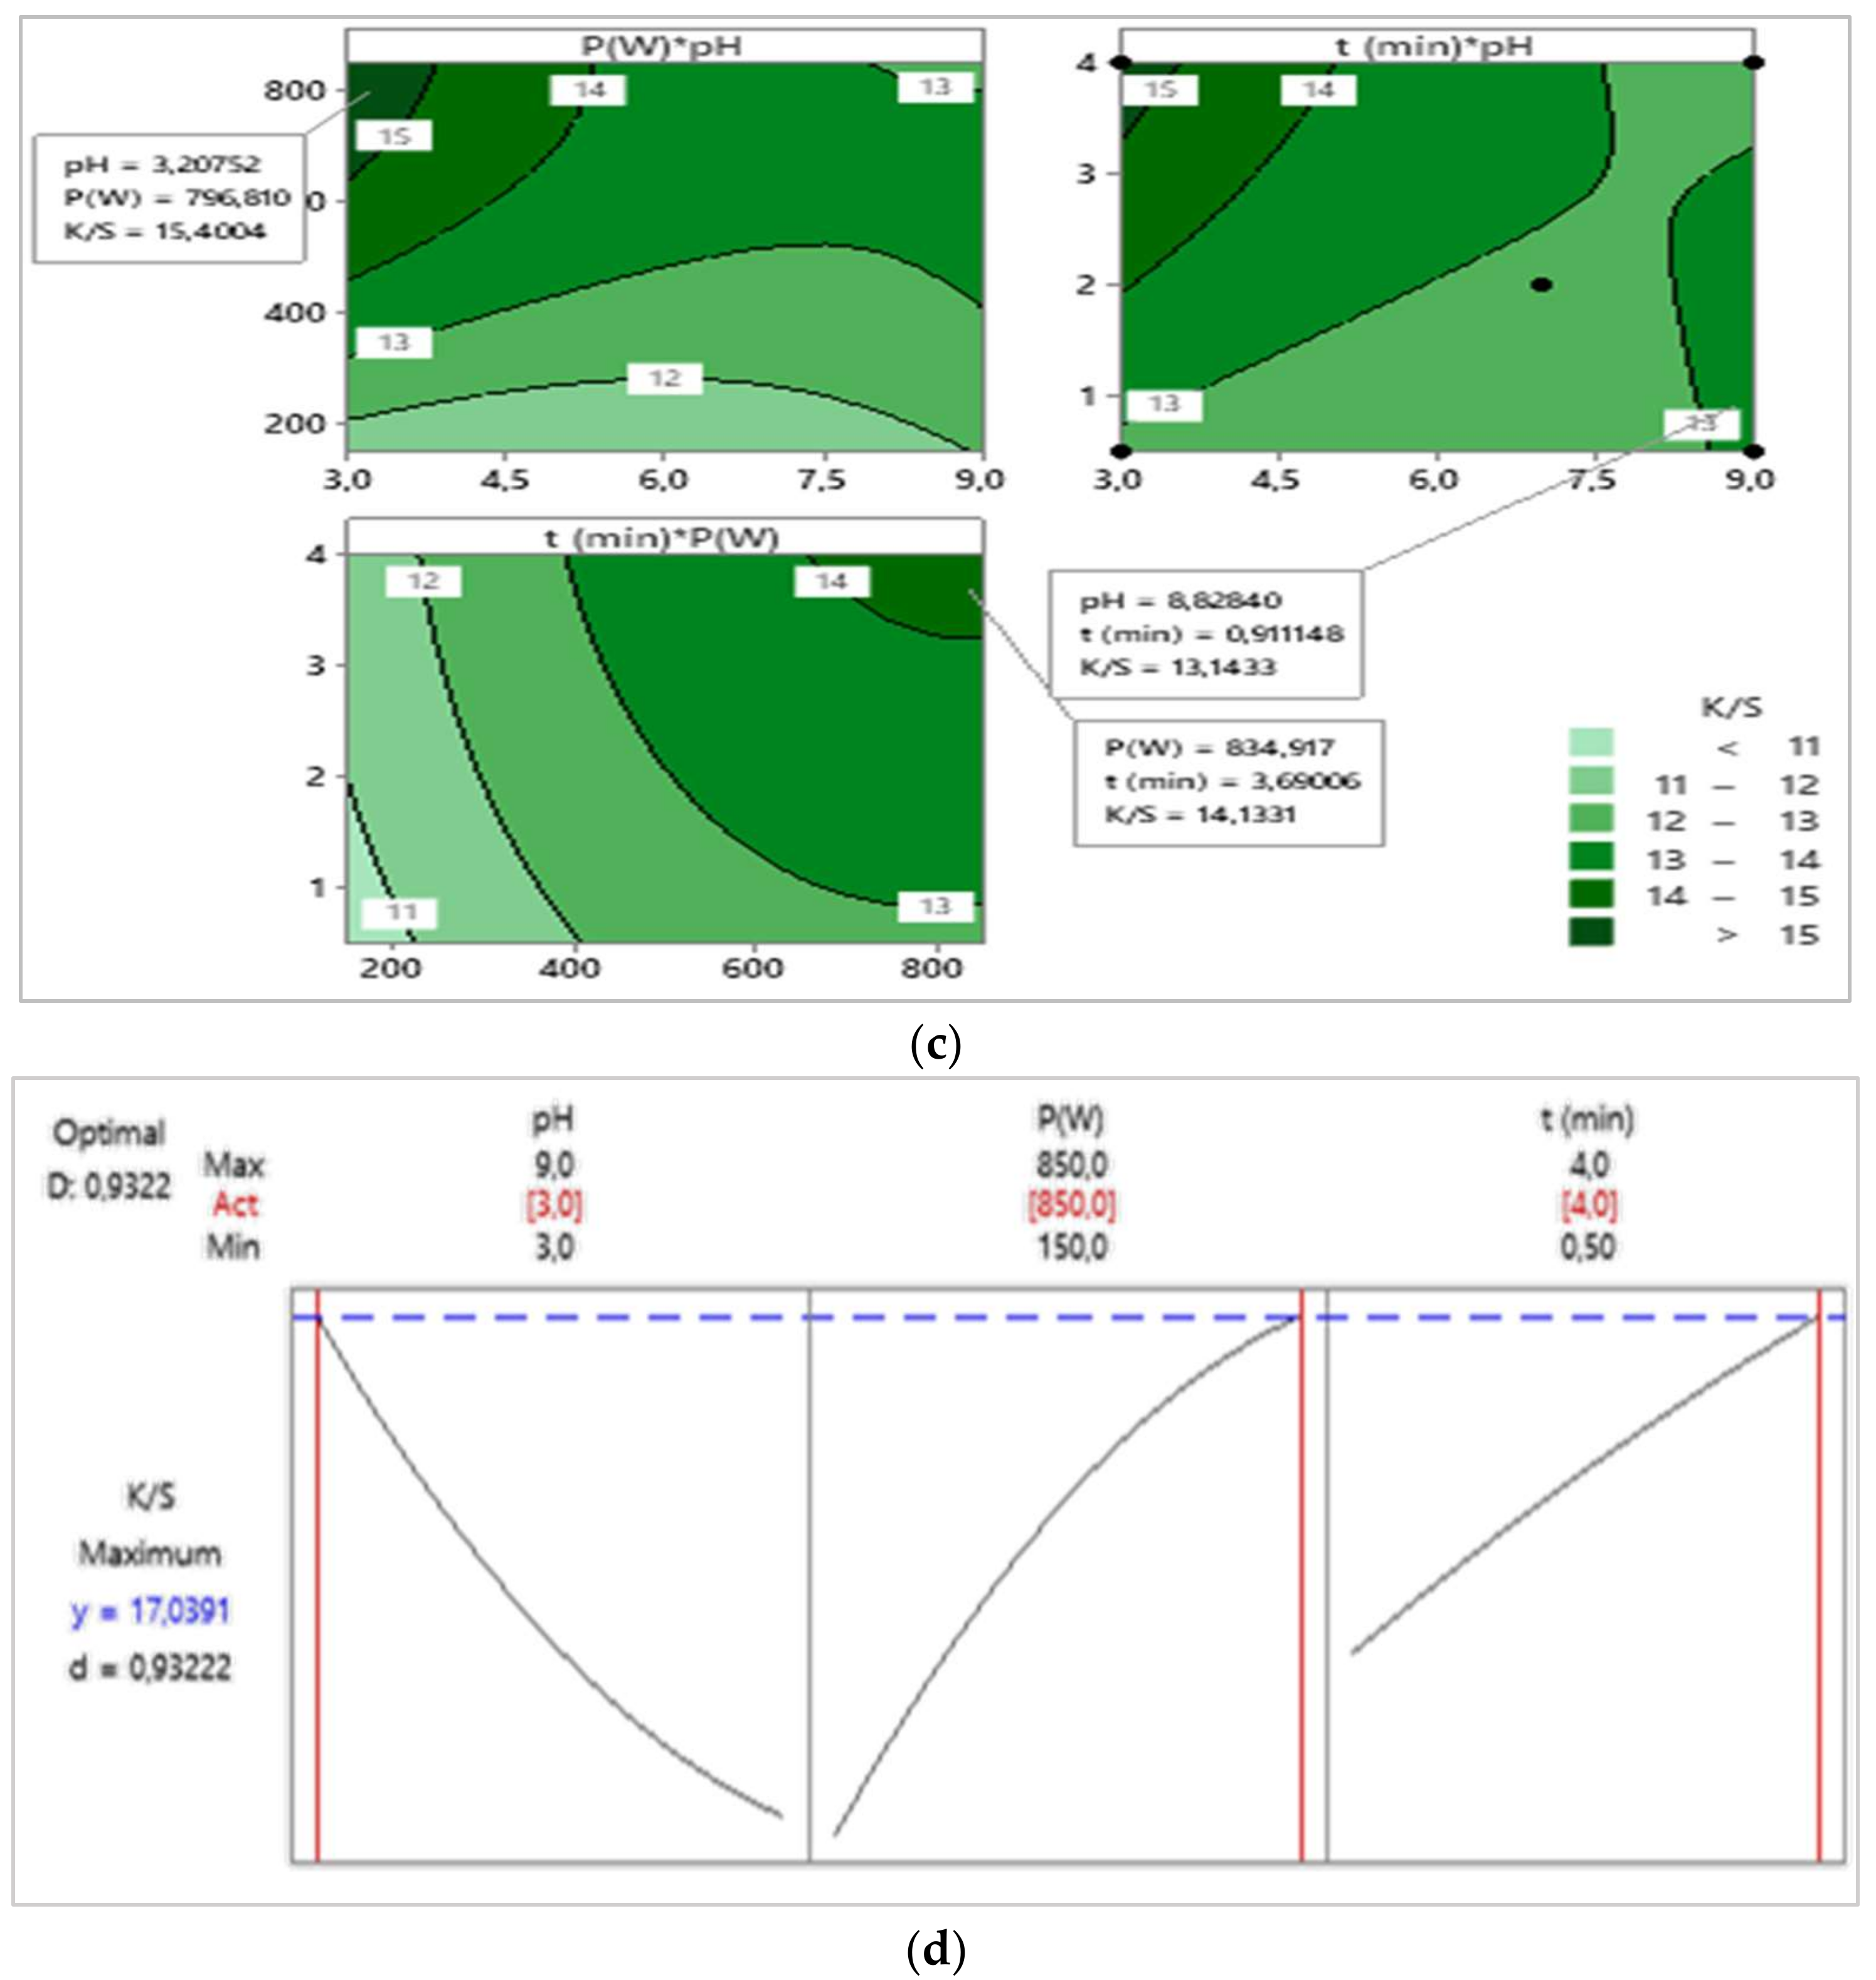
3.2.5. Contour Plots

The study of the contour plots provided a simple method of optimizing the processing rate and identifying interactions between variables. In fact, a contour graph displayed a two-dimensional view of the surface, where the points with the same response were connected to produce contour lines of constant responses.
The contour graphs relating to the color yield (K/S) of the dyed acrylic are shown in Figure 2c. The main information that could be drawn from this graph concerns the distribution of the color yield (K/S) as a function of the extraction parameters studied, namely pH, power P (W) and duration of extraction t (min).

3.2.6. Response Optimization

Based on Figure 2d, it can be deduced that the maximum color yield response (K/S) of acrylic was of the order of 17 for the following optimal extraction conditions: microwave power = 850 W, pH = 3 and extraction duration = 4 min.

3.2.7. Validation of Optimal Extraction Conditions

The results obtained following the application of optimal extraction conditions were in agreement with the theoretical result suggested by the diagram of the optimization response. Indeed, the color yield (K/S) related to acrylic was measured and found to be around 16.88. Thus, the validation of the proposed theoretical model could be confirmed experimentally.

3.3. Fastness Properties Estimation

The extraction process optimized allows fairly high coloring yields to be obtained. However, it would be interesting to check the fastness of these dyes before considering the extract obtained as being effective coloring. The fastness of dyes is the resistance of a material to the change of color following external applications. Among the types of fastness, washing, rubbing and light are the most important. In general, most natural dyes have moderate fastness to washing and poor fastness to light. The results of fastness tests of the acrylic samples dyed with the colored extract obtained under the optimal microwave extraction conditions are presented in Table 2.
According to this table, excellent fastness to washing was obtained, and acceptable fastness to rubbing and light were observed. Hence, it can be deduced that the optimal extract is a promising source of dye for acrylic fiber.

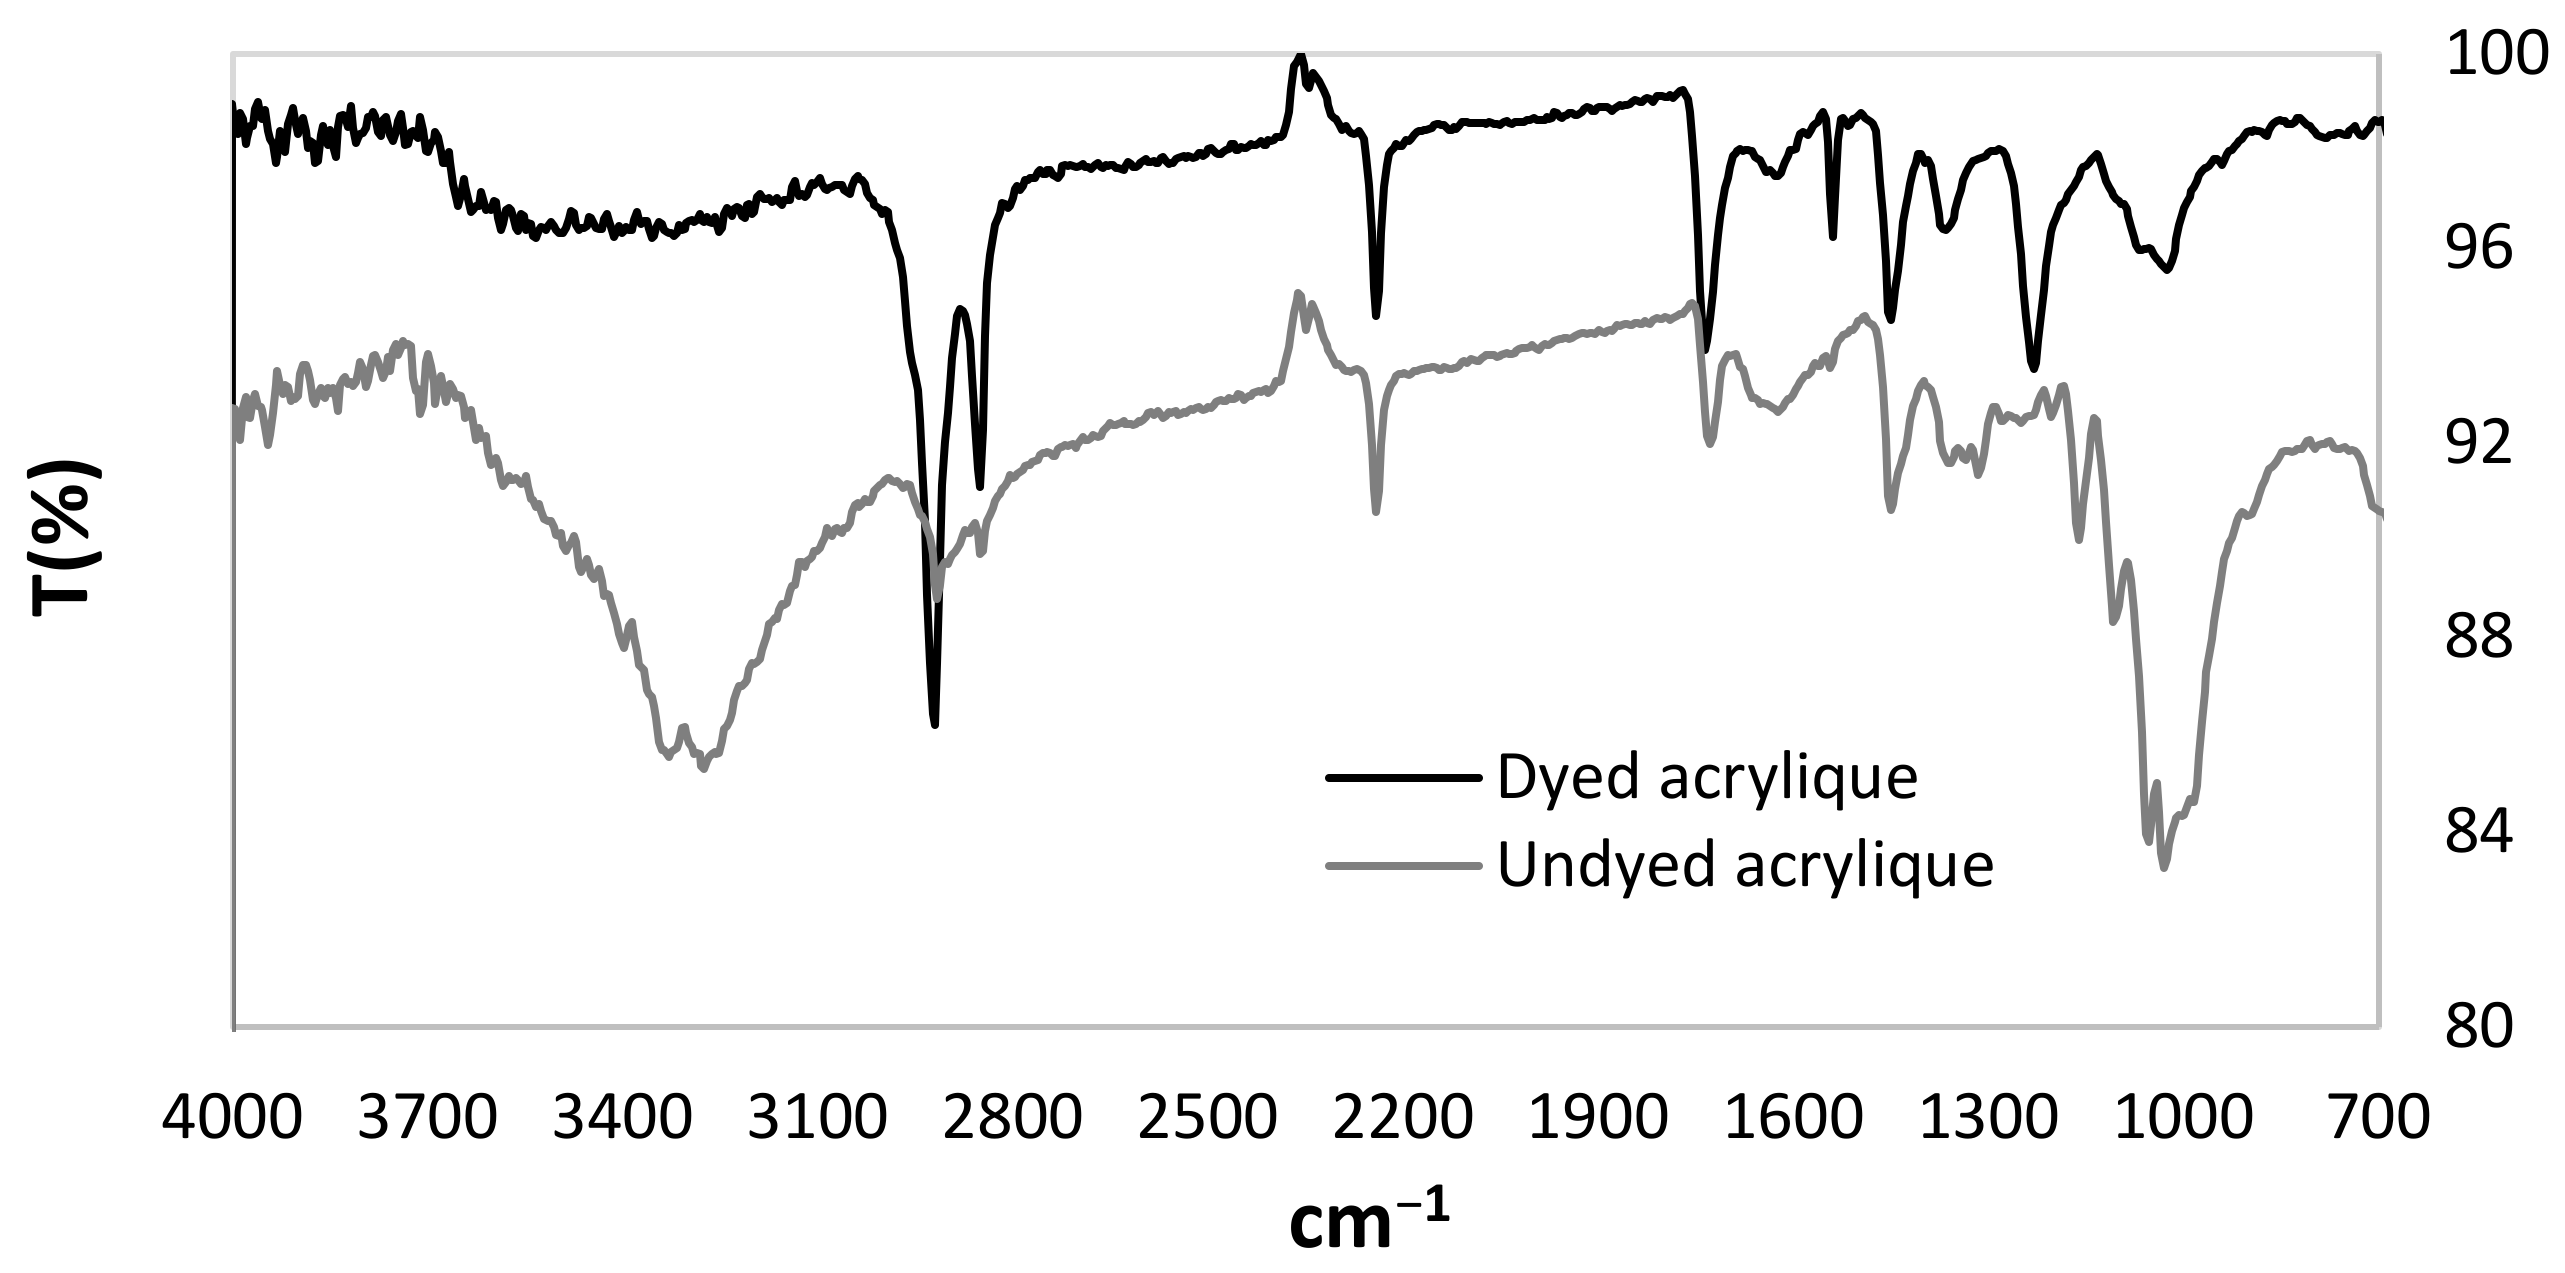
3.4. Spectral Infrared Characterization (FTIR) of Dyed and Undyed Acrylic Fabrics

Infrared spectrometry is a common technique for identifying functional groups present in molecules. The infrared spectra relating to dyed and undyed acrylic are shown in Figure 3.
The FTIR spectrum of the bleached acrylic fiber exhibited characteristic absorption bonds, i.e., a resonance peak at 1620 cm1 attributed to the stretching of -C-N, a strong peak at 1668 cm1 due to the stretching vibration of carbonyl -CO groups in amide, a peak at 2200 cm−1 due to the presence of the nitrile group −C ≡ N and a broad absorption band from 3206 to 3362 cm1 attributed to the stretching of −NH and −OH [23].
All of the above-mentioned characteristic peaks of the acrylic fabric were observed in the spectrum of the dyed acrylic sample, with noticeably lower intensity compared to those of the undyed fiber. This observed shrinkage may be due to the involvement of amine groups of acrylic in the interaction with dye molecules [6]. However, the band at 3000 cm1 could probably be due to -C-H stretching in the aromatic compounds (i.e., polyphenols in the dye extract) [24]. Additionally, the band at 1645 cm1 could be attributed to the C = C stretching vibration of aromatic rings in flavonoids and amino acids [25].

4. Conclusions

In this paper, a sustainable extraction process of natural dye from Juglans regia bark residues was optimized in order to dye acrylic fabrics. Optimal extraction conditions under microwave radiation were found to be: extraction power = 850 W; pH = 3 and extraction duration = 4 min. For these conditions, the color yield (K/S) of the dyed acrylic fabric could reach a value of 17 by exhibiting excellent fastness to washing and acceptable fastness to rubbing and to light.

Author Contributions

Conceptualization, M.B.T. and N.S.; methodology, M.B.T.; software, N.S.; validation, M.B.T., N.D. and H.D.; formal analysis, N.S.; investigation, C.B.; resources, H.D.; data curation, N.S.; writing—original draft preparation, M.B.T.; writing—review and editing, M.B.T.; visualization, N.D.; supervision, C.B. and H.D.; project administration, H.D. All authors have read and agreed to the published version of the manuscript.

Funding

This research received no external funding.

Data Availability Statement

Not applicable.

Acknowledgments

The authors would like to thank the Tunisian Higher Education and Scientific Research Ministry. Moreover, authors would like to acknowledge Taif University Researchers Supporting Project number (TURSP-2020/188), Taif University, Taif, Saudi Arabia.

Conflicts of Interest

The authors declare no conflict of interest.

References

  1. Adeel, S.; Hussaan, M.; Rehman, F.-U.; Habib, N.; Salman, M.; Naz, S.; Amin, N.; Akhtar, N. Microwave-assisted sustainable dyeing of acrylic fabric using cochineal-based carminic acid as natural colorant. J. Nat. Fibers 2019, 16, 1026–1034. [Google Scholar] [CrossRef]
  2. Ben Ticha, M.; Slama, N.; Dhouibi, N.; Boudokhane, C.; Dhaouadi, H. Bark Residues Recovery of Juglans Regia. L For the Dyeing of Wool Fabrics: Development of Microwave-assisted Extraction and Dyeing Processes. J. Nat. Fibers 2021. [Google Scholar] [CrossRef]
  3. Ul Hasan, M.; Adeel, S.; Batool, F.; Ahmad, T.; Cheng-Tang, R.; Amin, N.; Khan, S.R. Sustainable Application of Cassia Obovata Based Chrysophanic Acid as Potential Source of Yellow Natural Colourant for Textile Dyeing. Environ. Sci. Pollut. Res. 2022, 29, 10740–10753. [Google Scholar] [CrossRef] [PubMed]
  4. Adeel, S.; Kiran, S.; Shahid, M.; Habib, S.R.; Habib, N.; Hussaan, M. Ecofriendly application of coconut coir (Cocos nucifera) extract for silk dyeing. Environ. Sci. Pollut. Res. 2022, 29, 564–572. [Google Scholar] [CrossRef] [PubMed]
  5. Adeel, S.; Habib, N.; Batool, F.; Rahman, A.; Ahmad, T.; Amin, N. Eco-friendly Approach towards Isolation of Colourant from Esfand for Bio-mordanted Silk Dyeing. Environ. Sci. Pollut. Res. 2022, 29, 13523–13533. [Google Scholar] [CrossRef]
  6. Dhouibi, N.; Ben Ticha, M.; Raddaoui, H.; Boudokhane, C.; Dhaouadi, H. Valorization and Reuse of Centaurea Kroumeriensis Hydrodistillation Effluent: A Sustainable Phytodyeing Process for Wool Fabrics. Fibers Polym. 2021, 22, 2238–2250. [Google Scholar] [CrossRef]
  7. Adeel, S.; Ur-Rehman, F.; Khosa, M.K.; Rajab, S.; Ziaa, K.M.; Zuber, M.; Batool, F. Eco-Friendly Isolation of Colorant From Arjun Bark for Dyeing of Bio-Mordanted Cotton Fabric. J. Nat. Fibers 2021. [Google Scholar] [CrossRef]
  8. Le Floc’h, E. Contribution à une étude Ethnobotanique de la Flore Tunisienne; Publications Scientifiques Tunisiennes: Tunis, Tunisia, 1983. [Google Scholar]
  9. Baaka, N.; Ben Ticha, M.; Guesmi, A. Valorization of Anthocyanin Pigments Extracted from Phytolacca Americanna L. Fruits as Bio-Colorant to Dye Acrylic Yarns. Fibers Polym. 2019, 20, 2522–2528. [Google Scholar]
  10. Guesmi, A.; Ben Hamadi, N. Study on optimizing dyeing of cotton using date pits extract as a combined source of coloring matter and bio-mordant. Nat. Prod. Res. 2018, 2, 810–814. [Google Scholar] [CrossRef]
  11. Akram, W.; Adeel, S.; Amin, N.; Habib, N.; Inayat, A.; Mirnezhad, S. Impact of MW rays on extraction and application of Ficus religosia bark based natural colorant for cotton dyeing. J. Eng. Fibers Fabr. 2022, 17, 1–17. [Google Scholar]
  12. Marcus, Y. Solvatochromic probes in supercritical fluids. J. Phys. Org. Chem. 2005, 18, 373–384. [Google Scholar] [CrossRef]
  13. Adeel, S.; Ur-Rehman, F.; Zia, K.M.; Azeem, M.; Kiran, S.; Zuber, M.; Irfan, M.; Qayyum, M.B. Microwave supported green dyeing of mordanted wool fabric with Arjun bark extracts. J. Nat. Fibers 2021, 18, 136–150. [Google Scholar] [CrossRef]
  14. Ben Ticha, M.; Meksi, N.; Attia, H.E.; Haddar, W.; Guesmi, A.; Ben Jannet, H.; Mhenni, M.F. Ultrasonic extraction of Parthenocissus quinquefolia colorants: Extract identification by HPLC-MS analysis and cleaner application on the phytodyeing of natural fibres. Dyes Pigm. 2017, 141, 103–111. [Google Scholar] [CrossRef]
  15. Ben Ticha, M.; Meksi, N. Exploitation of Ultrasonic Waves to Develop and Model a Sustainable Process for Washing Denim Fabrics. J. Nat. Fibers 2021. [Google Scholar] [CrossRef]
  16. Veggi, P.C.; Martinez, J.; Meireles, M.A.A. Fundamentals of Microwave Extraction. In Microwave-Assisted Extraction for Bioactive Compounds; Springer: Boston, MA, USA, 2012. [Google Scholar] [CrossRef]
  17. Swain, T.; Hillis, W.E. The phenolic constituents of Prunus domestica. I.—The quantitative analysis of phenolic constituents. J. Sci. Food Agric. 1959, 10, 63–68. [Google Scholar] [CrossRef]
  18. Butler, L.G.; Price, M.L.; Brotherton, J.E. Vanillin assay for proanthocyanidins (condensed tannins): Modification of the solvent for estimation of the degree of polymerization. J. Agric. Food Chem. 1982, 30, 1087–1089. [Google Scholar] [CrossRef]
  19. Mole, S.; Waterman, P.G. A critical analysis of techniques for measuring tannins in ecological studies. Oecologia 1987, 72, 137–147. [Google Scholar] [CrossRef]
  20. Ben Ticha, M.; Meksi, N.; Drira, N.; Kechida, M.; Mhenni, M.F. A promising route to dye cotton by indigo with an ecological exhaustion process: A dyeing process optimization based on a response surface methodology. Ind. Crops Prod. 2013, 46, 350–358. [Google Scholar] [CrossRef]
  21. Ben Ticha, M.; Meksi, N.; Kechida, M.; Mhenni, M.F. Green process for indigo dyeing: Effect and modeling of physico-chemical parameters using statistical analysis. Int. J. Environ. Res. 2013, 7, 697–708. [Google Scholar]
  22. Abdelileh, M.; Ticha, M.B.; Moussa, I.; Meksi, N. Pretreatment optimization process of cotton to overcome the limits of its dyeability with indigo carmine. Chem. Ind. Chem. Eng. Q. 2019, 25, 277–288. [Google Scholar] [CrossRef] [Green Version]
  23. Çelik, M.; Qudrat, M.L.; Akyüz, E.; Açik, L. Synthesis and characterization of acrylic fibers-g-polyacrylamide. Fibers Polym. 2012, 13, 145–152. [Google Scholar] [CrossRef]
  24. Danciu, C.; Pavel, L.Z.; Babuta, R.; Ersilia, A.; Suciu, O.; Pop, G.; Soica1, C.; Dehelean, C.; Radulov, I. Total phenolic content, FTIR analysis, and antiproliferative evaluation of lupin seeds harvest from western Romania. Ann. Agric. Environ. Med. 2017, 24, 726–731. [Google Scholar] [CrossRef] [PubMed]
  25. Oliveira, R.N.; Mancini1, M.C.; de Oliveira, F.C.S.; Passos, T.M.; Quilty, B.; Thiré, R.M.D.S.; McGuinness, G.B. FTIR analysis and quantification of phenols and flavonoids of five commercially available plants extracts used in wound healing. Matéria 2016, 21, 767–779. [Google Scholar] [CrossRef] [Green Version]
Figure 1. Effect of microwave power (a), pH (b), duration of extraction (c) and dry mass of Juglans regia bark residues (d) on the concentration of phenolic compounds of the extract and the color yield (K/S) of acrylic fabrics.
Sustainability 14 04134 g001aSustainability 14 04134 g001b
Figure 2. Principal main effects graphic (a), interaction diagram (b), contour plots (c) and response optimization (d) for the color yield (K/S) of the dyed acrylic fabrics.
Sustainability 14 04134 g002aSustainability 14 04134 g002b
Figure 3. Infrared spectra of undyed and dyed acrylic fabrics.
Sustainability 14 04134 g003
Table 1. Response surface design.
FactorsResponse
pHP(W)t (min)K/S
13500415.8
271500.510.7
37500212.9
495000.512.7
57850413.7
635000.513.0
79850212.7
87150410.9
97500212.9
109500412.8
113850215.0
127500212.9
139150212.8
1478500.513.2
153150211.2
Table 2. Dyeing fastness of dyed acrylic fabric.
FiberSampleRubbing FastnessLight
Fastness
Washing Fastness
WetDry
Acrylic Sustainability 14 04134 i0013335
Publisher’s Note: MDPI stays neutral with regard to jurisdictional claims in published maps and institutional affiliations.

