
Drought Analysis for the Seyhan Basin with Vegetation Indices and Comparison with Meteorological Different Indices


Department of Civil Engineering, Kestel Campus, Alanya Alaaddin Keykubat University, Alanya 07945, Turkey
Sustainability 2022, 14(8), 4464; https://0-doi-org.brum.beds.ac.uk/10.3390/su14084464
Submission received: 13 February 2022
/
Revised: 6 April 2022
/
Accepted: 7 April 2022
/
Published: 8 April 2022
(This article belongs to the Special Issue Impact of Indo-Pacific Climate Variability)
Abstract
:Various drought indices have been developed to monitor drought, which is a result of climate change, and mitigate its adverse effects on water resources, especially in agriculture. Vegetation indices determined by remote sensing were examined by many recent studies and shed light on drought risk management. In the current study, one of the 25 drainage basins in Turkey—the Seyhan Basin, located in the south of the country—was investigated. The Normalized Difference Vegetation Index (NDVI) and the Vegetation Condition Index (VCI) are the most widely used vegetation indices and are very useful because they give results only based on satellite images. This study examined the Seyhan Basin using satellite data in which the vegetation transformation occurring due to the decline of agricultural and forest areas was seen. An increase in drought frequency was detected in the Seyhan Basin using the NDVI and VCI indices and compared with different indices. The results obtained revealed that climate change and drought is increasing with a linear uptrend. It is recommended that decision-makers take the necessary measures by considering the drought risk maps. Long-term drought management plans should also be prepared and implemented.
1. Introduction
The status of water resources is adversely affected by climate change; therefore, drought is a major concern in agriculture and human use. Drought is defined as a natural event that negatively affects land and water resources, and hydrological equilibrium is disrupted due to precipitation falling below normal levels [1].
It is possible to classify droughts as meteorological, agricultural, and hydrological. Meteorological drought is a decrease in precipitation according to the year-long averages. On the other hand, agricultural drought is based on the amount of water available in the root zone of the plant. In terms of agriculture, the periods when the amount of water in the soil is not enough to meet the needs of the plants are defined as arid. Precipitation, plant water consumption, and soil characteristics can be considered the main factors for agricultural drought. Hydrological drought refers to a decrease in surface and groundwater resources due to the lack of long-term precipitation. Even long after the end of meteorological drought, hydrological drought may emerge [2].
Drought risk management constitutes a vital part of water-resource management policies and strategies. National drought policies have an essential role in managing drought risks [3,4,5]. It is necessary to prepare drought management plans to mitigate the effects of drought depending on the legislation of the country and by considering the specific drought characteristics and effects of the basin [6]. Elements of a drought management plan include obtaining the characteristics of a river basin, investigation of historical drought events in the basin, evaluation of the possible risk(s), determination of indicators and threshold values for drought analysis, creation of a program of measures to reduce the effects of drought, and establishment of an early warning system and organizational structure [7,8].
Drought risk management includes the following stages: hazard, impact assessment, and affectability assessment, and early warning system, including drought monitoring and forecasting, preparedness, and harm reduction [9]. Early drought warning systems typically aim to monitor, evaluate, and present information on climate, hydrological features, water supply conditions, and trends [10]. The goal here is to provide early information before or during the onset of drought within a drought risk management plan to mitigate the potential impacts. Since drought is a slow-starting and progressive hydrological event, monitoring and analyzing drought is of great importance.
Monitoring and analysis of a drought are mostly carried out using various indicators and indices. These indicators and indices help characterize drought by providing information on the severity, location, duration, and timing of drought and therefore, allow drought conditions to be determined, classified, and monitored. Some indicators and indices can also be used to validate indicators of drought data that were modeled, remotely detected, or assimilated into the model. The geographic information systems have made it possible to overlap, map, and compare different indicators and indices thanks to the power of evolving computational and imaging systems [11].
Indicators are variables or parameters used to describe drought conditions. In general, drought indicators include the variables summarized in Table 1.
The index values initiate or terminate the implementation stages of a drought management plan. Therefore, drought management plans should be formed based on these index values [11]. The indicators and indices given in the “Handbook of Drought Indicators and Indices”, published by the World Meteorological Organization (WMO) in partnership with the Global Water Partnership (GWP) in the context of the Integrated Drought Management Programme (IDMP), are classified into five main categories according to their characteristics. These categories are meteorology, soil moisture, hydrology, remote sensing, and compounded or modeled.
The two most practical and widely used indices are the NDVI and VCI. Quiring and Ganesh [12] applied the VCI index to 254 Texas counties during 18 growing seasons and found a good correlation between this index and many frequently used meteorological drought indices. On the other hand, interannual variations of the NDVI were investigated and their relationships with temperature and precipitation variables and human activity in China between 1982 and 1999 were examined in a previous study [13]. Variability of the NDVI over Botswana was studied by Nicholson and Farrar [14] during 1982–1987. Shad et al. [15] pointed out that the NDVI and VCI indices concerning MODIS sensors can be a good alternative for estimating drought concerning meteorological indices for Isfahan. Chodhary et al. used the NDVI and VCI indices to investigate drought effects on corn cultivation [16]. Indices are especially vital in examining regions with sporadic or insufficient measuring stations and estimating drought [17,18,19].
Several studies mentioned that the NDVI and VCI indices are useful methods to detect drought and make a prediction. The main aim of the current study was to answer the following questions based on remote sensing technologies.
- -
- Is it possible to apply the NDVI and VCI indices to the Seyhan Basin?
- -
- Are the results produced by NDVI and VCI indices for the Seyhan Basin reasonable?
- -
- Is there a drought problem in the Seyhan Basin, and if so, how is it progressing?
- -
- What is the frequency of the drought in this basin?
- -
- Comparison of vegetation indices with hydrological and meteorological indices for the Seyhan Basin.
Meteorological indices are the DI (Deciles Index), SPI (Standardized Precipitation Index), and SPEI (Standardized Precipitation Evapotranspiration Index), and the hydrological index is the SRI (Standardized Runoff Index). They are described in detail in the study of Asi Basin [20].
In this study, the remote sensing method was used, and drought analysis was performed for the Seyhan Basin with the NDVI and VCI vegetation indices. The results obtained were compared with different indices.
This study was carried out to determine the most appropriate method for monitoring climate change and preparing drought management plans in Turkey. The Seyhan Basin in the Mediterranean region, which is expected to be particularly affected by climate change, is one of 25 basins in Turkey. The correlation of the NDVI and VCI vegetation indices with other indices was calculated. A comparison of hydrological, meteorological, and agricultural drought indices was discussed.
2. Materials and Methods
2.1. Study Area
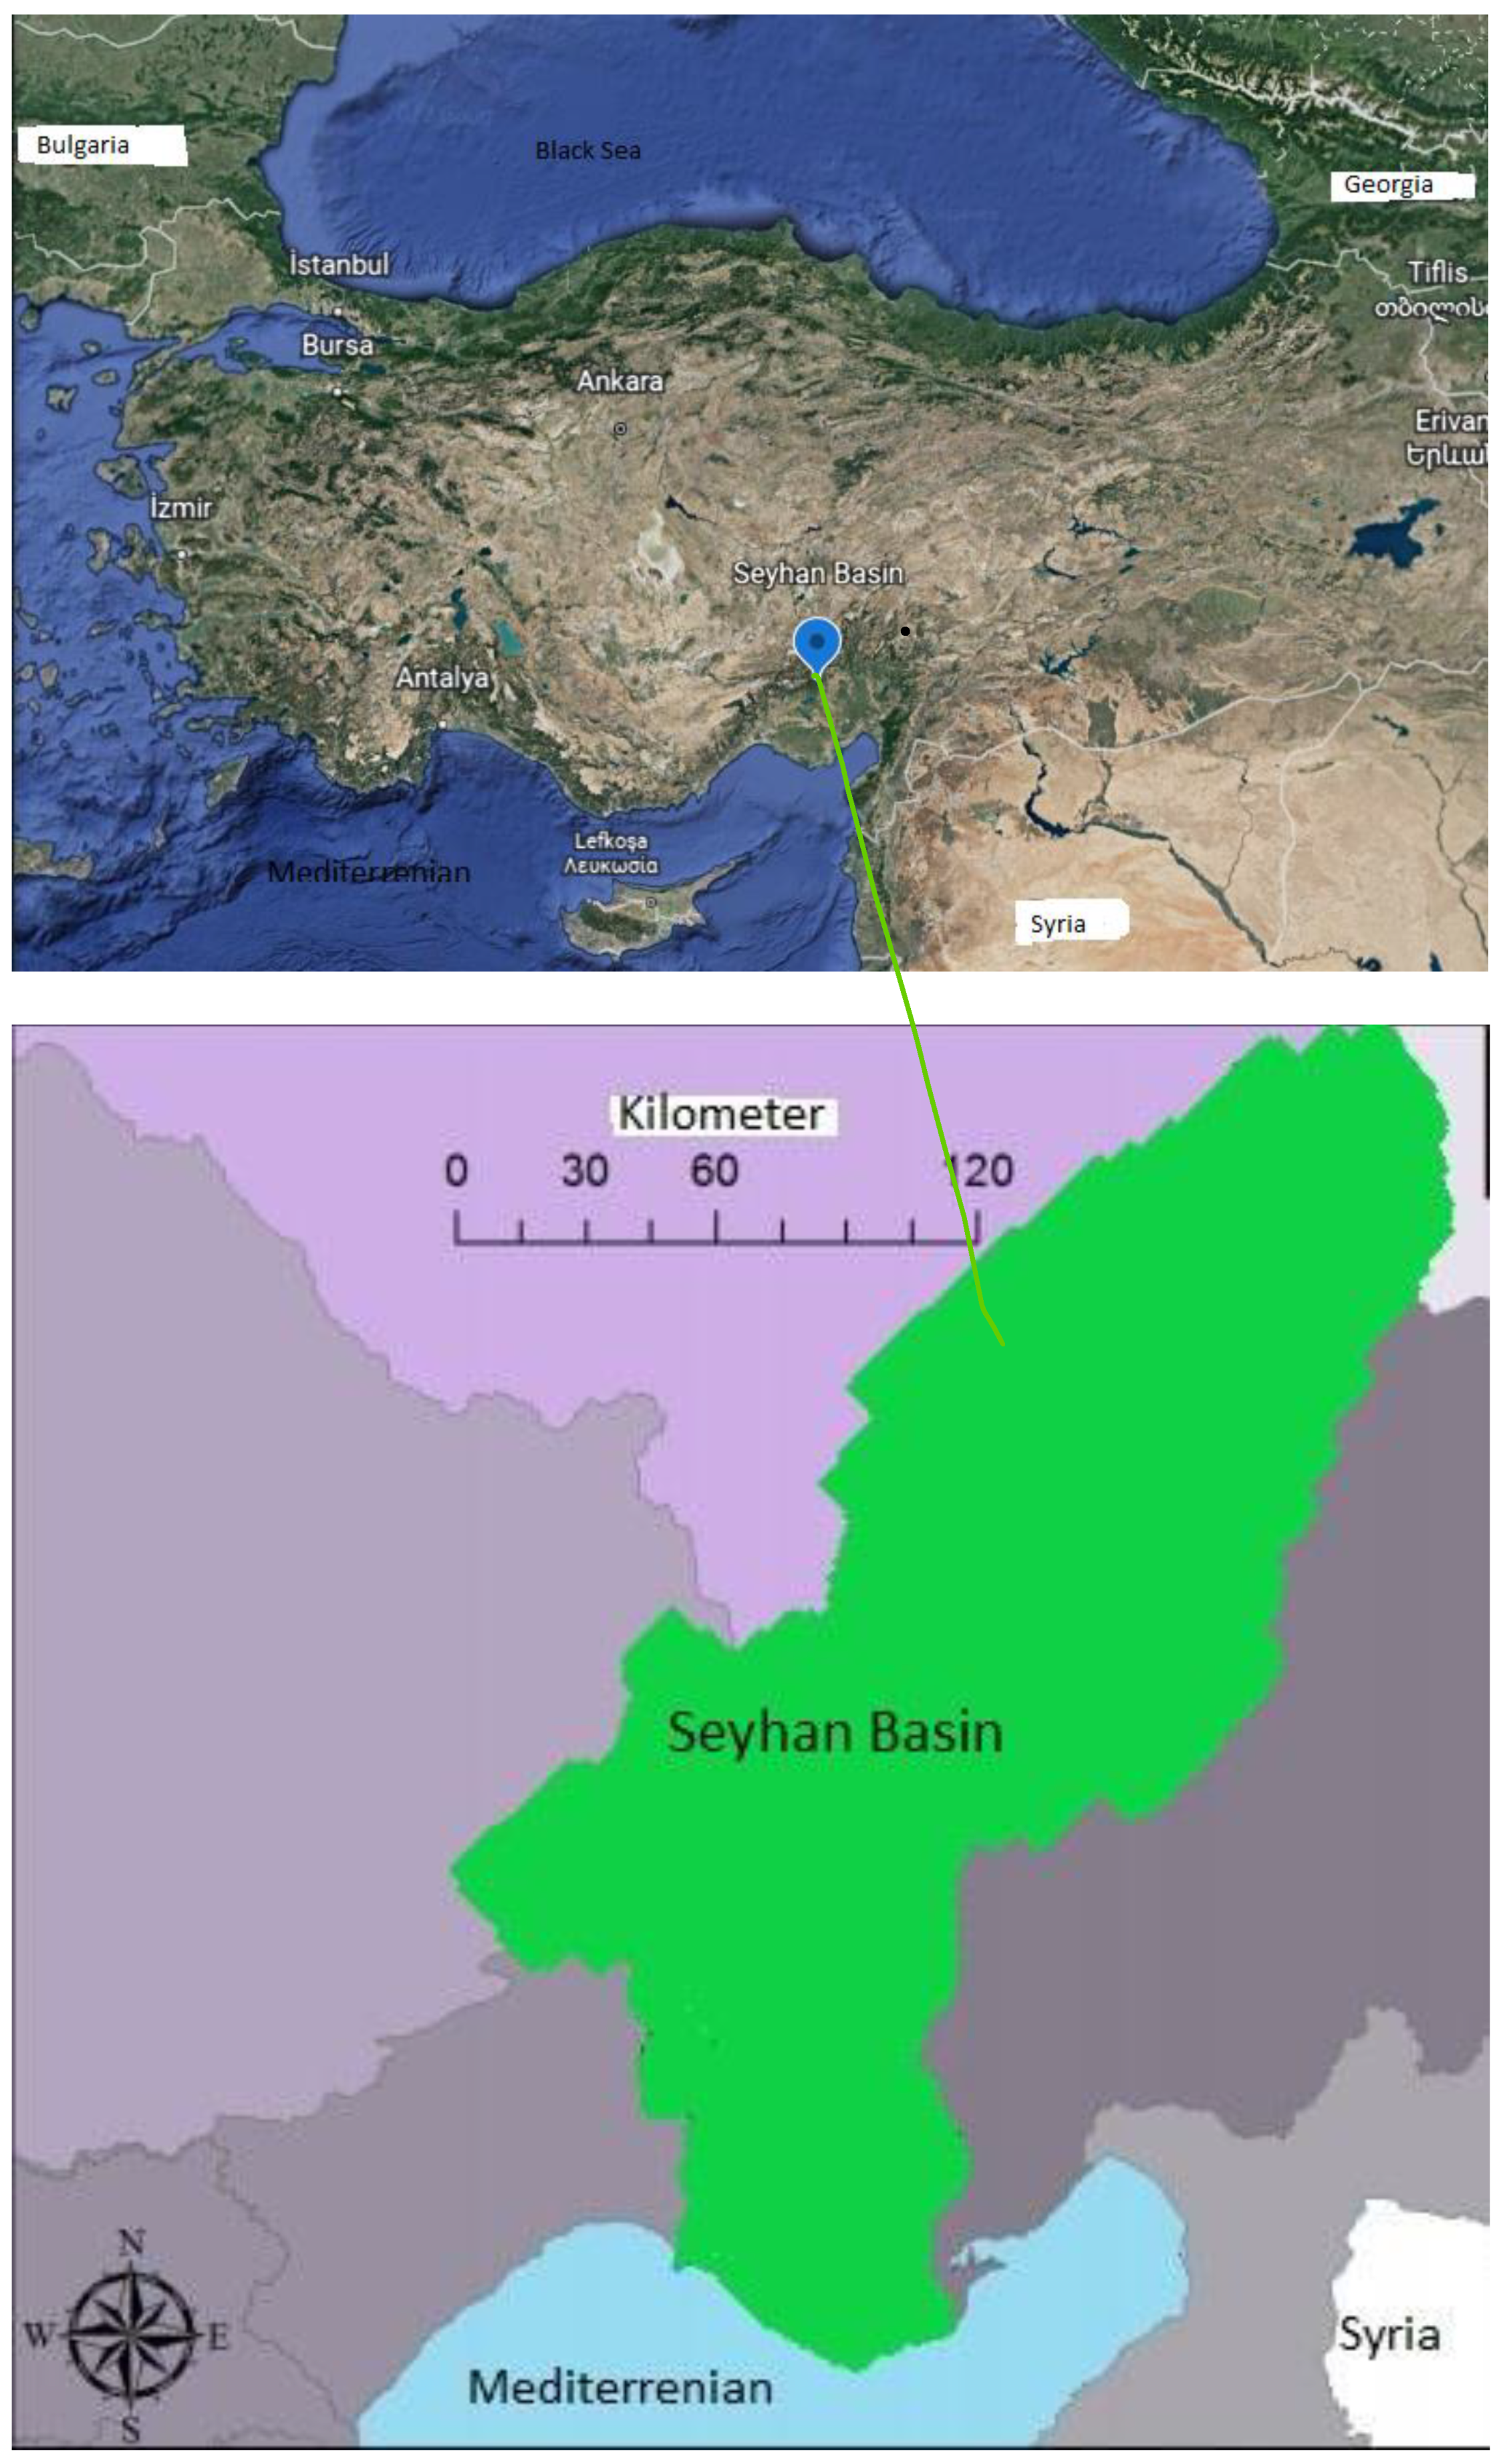
The Seyhan River Basin is in the Eastern Mediterranean, Turkey, within the range of 34.25–37.0° E and 36.5–39.25° N (Figure 1). With a basin area of 22,035 km2, the Seyhan River Basin constitutes 2.07% of the area of Turkey. Mainstream in the basin is the Seyhan River, and it forms after the confluence of the Zamanti and Göksu rivers and discharges into the East Levantian side of the Mediterranean Sea. The Mediterranean climate dominates the lower basin, whereas the middle and upper basins are influenced by the continental climate.
Annual precipitation in the coastal area is about 700 mm, and it increases to 1000 mm as altitude increases. The part of the basin’s shore side, Cukurova, is an important agricultural area for Turkey. Including the Seyhan Basin, the Coastal Mediterranean and Eastern Mediterranean agricultural basins of Turkey are important agricultural areas for Turkey and neighboring agricultural importer countries. Considering this reason, many researchers have developed or applied different methods for monitoring and predicting the drought in this region [21,22,23,24,25]. The drought that occurred in 2021 once again demonstrated the importance of these studies [26].
2.2. Data
Advances in space technologies and computer systems have brought along a broader and more efficient use of remote sensing technologies and geographic information systems (GIS). The ability to easily transfer various geospatial data to the GIS environment with images taken from space via satellites has increased the possibilities for analysis of natural resource management, land use and land cover, environmental and ecological analysis, disaster risk assessment, and meteorological, hydrological, and agricultural applications. Remote sensing technologies, especially satellite products, are used effectively and extensively in various hydrological applications around the world [27]. Jafari et al. compared satellite products with field measurements for drought monitoring in southern Iran [28]. Shojaei and Rahimzadegan improved a comprehensive drought index for the west of Iran [29]. Vegetation and soil moisture, which can be obtained by remote sensing, are data sources commonly used in drought studies [30,31].
High-resolution vegetation changes information provided by both temporal and spatial vegetation indices (e.g., NDVI) and can contribute to drought-related research without requiring additional information on drought. Vegetation indices are preferred because they are easy to use and do not require any assumptions and/or additional information other than themselves [32]. Vegetation indices can be determined by remote sensing methods and have a wide range of applications because green vegetation produces high reflectivity values in the near-infrared region of the electromagnetic spectrum [33]. Certain pigments in plants leave strongly absorbed rays at the visible wavelength (390 µm–700 µm). These rays, especially those at the red end of the spectrum (620 µm–750 µm), are absorbed by the plant for use during photosynthesis.
On the other hand, these indices allow inferences to be made about a plant’s greenness, using its interest in near-infrared (760 μm–900 μm), which is invisible to the human eye. The vegetation spectrum in Asi Basin, a neighboring basin, was given in a previous study [34]. Most satellite sensors measure red and near-infrared light waves reflected from a land surface. Using mathematical formulas, raw satellite data related to these light waves are converted into vegetation indices. Vegetation indices describe the greenness (relative density and health status) of the plant for each cell in the satellite image. Not all vegetation indices perceive greenness in vegetation directly by measuring rays at visible and near-infrared wavelengths; only particular indices can indirectly perceive the change in vegetation. The plant water content allows the plant to perform less temperature swing in the day than the soil; thus, by using the information regarding the temperature change throughout the day, those indices provide the knowledge of vegetation change [35]. Because such indices are sensitive to vegetation, they can provide important information about the drought experienced in the basin. Various indices were used for this purpose in different geographical regions of the world. Main indices were developed on remote sensing data that find wide usage, especially to determine drought—e.g., the Enhanced Vegetation Index (EVI) [36,37,38], Evaporative Stress Index (ESI) [39,40,41], Normalized Difference Vegetation Index (NDVI) [42,43,44], Temperature Condition Index (TCI) [45], Vegetation Condition Index (VCI) [46,47,48], Vegetation Drought Response Index (VegDRI) [49], Vegetation Health Index (VHI) [50,51], Water Requirement Satisfaction Index (WRSI) [52], Normalized Difference Water Index (NDWI) [53], and Land Surface Water Index (LSWI) [54,55].
We summarize some advantages and disadvantages of this method below:
Unlike other data collection methods that may take years, the remote sensing method allows for extremely rapid analysis. Using this method, comparably large areas can be analyzed using just one satellite image. With remote sensing, the required area to be selected can be minimized. Some areas that are easy to reach can be selected and the accuracy of the data can be tested.
In addition, with this method, it is easier to locate potential floods or forest fires over a large region, which makes it easier to plan a rescue mission easily and fast.
On the other hand, this method also has some disadvantages, as explained below.
Examining a small area can be costly. The variability of the weather may cause inaccurate measurements during image acquisition. Powerful active remote sensing systems such as radars that emit their own electromagnetic radiation can be intrusive and affect the phenomenon being investigated. A surveying engineering training may be required to correct, digitize, and analyze raw satellite images and check selected test sites.
The two most commonly used vegetation indices of this method were used in this study.
For drought analysis of the Seyhan Basin, the Normalized Difference Vegetation Index (NDVI) and the Vegetable Condition Index (VCI), which provide information about the change in plant greenness, were analyzed both temporally and spatially within the boundaries of the Seyhan Basin.
2.3. Drought Index
2.3.1. Normalized Difference Vegetation Index (NDVI)
The NDVI is one of the most widely used tools for monitoring green vegetation using remote sensing data. A previous study in which the vegetation index was associated with precipitation [56] showed a correlation between the data obtained from the precipitation stations in different regions of Turkey and the NDVI data. Similar studies performed with rainfall data monitoring stations in Turkey and in compliance with the drought index data were discussed [34]. The NDVI is one of the vegetation indices that is widely used in forest classification and agricultural studies as well as in the detection of land-cover change. Certain pigments in plant leaves strongly absorb visible wavelengths (390 µm–700 µm), especially red wavelengths (620 µm–700 µm), during photosynthesis. By normalizing this knowledge of difference, the NDVI can make an inference about the greenness of the plant. Different ranges of red and near-infrared wavelengths are measured by different satellites through their sensors. Based on observations made in the near-infrared (NIR) and red (RED) region on satellite images, the NDVI is calculated as follows:
NDVI = (NIR − RED)/(NIR + RED)
NDVI values theoretically range from (−1) to (+1). More rays are reflected at the near-infrared region compared to the red wavelengths. Whereas the index value approaches +1 in areas where green vegetation is high (NIR-RED difference increases and gets closer to the sum of NIR + RED), clouds, water, and snow cover have low (−) NDVI indexes. Bare soil and low vegetation indicate near-zero or (−) NDVI values. If agriculture is intensive on an NDVI map, areas with low NDVI values indicate zones with poor plant development due to various reasons, such as drought, excessive humidity, disease, or pests.
On the other hand, high NDVI values indicate areas with healthy plant development [57]. For example, regions with an NDVI value of ≤0.1 represent ore-free rock, sand, or generally snowy areas. In areas covered with sparse vegetation such as shrubs, grasslands, or crops needing to be harvested, NDVI values varying between 0.2 and 0.5 are observed. The highest NDVI values are observed in temperate and tropical forests or areas where crops are at the maximum growth stage, and these values vary between 0.6 and 0.9. NDVI data obtained from National Oceanic and Atmospheric Administration (NOAA), Advanced Very High-Resolution Radiometer (AVHRR), and Moderate Resolution Imaging Spectroradiometer (MODIS) satellites are satellite images commonly used to monitor vegetation changes in large sites. AVHRR and MODIS satellites provide ready-to-use NDVI data. Therefore, atmospheric correction is not needed for these satellite data; thus, no additional data are required for atmospheric correction. Data at the NIR and RED wavelengths obtained from the LANDSAT satellite need atmospheric correction before the calculation of the NDVI. Although the normalizing phase reduces these atmospheric components’ effect on the NDVI, NDVI data obtained from AVHRR and MODIS satellites that do not require atmospheric correction were used in this study. The time interval, resolution, and recurrence time of the NDVI values obtained from these two satellites are given in a previous study on Asi Basin, a neighboring basin [34].
2.3.2. AVHRR
At first, the AVHRR began its observations on the TIROS-N satellite, which was sent to space in 1978. Then, it was placed on the NOAA satellite. The essential features of the AVHRR have not changed over time, and the AVHRR has been continuously utilized in Earth observation. The AVHRR provides a spatial resolution of about 3.6 km, and its strip area is 2399 km wide. Whereas NOAA circles around the Earth 14 times a day, the AVHRR observes the same area twice a day. Several studies in the literature showed that NDVI values calculated using AVHRR satellite data differ from NDVI values obtained from other satellite data [58,59,60,61,62,63]. As a result of the study conducted on partial correction of the AVHRR NDVI time series, the AVHRR NDVI3g product was obtained. In the context of this study and the AVHRR NDVI product, the time series of the AVHRR NDVI3g products were also used.
2.3.3. MODIS
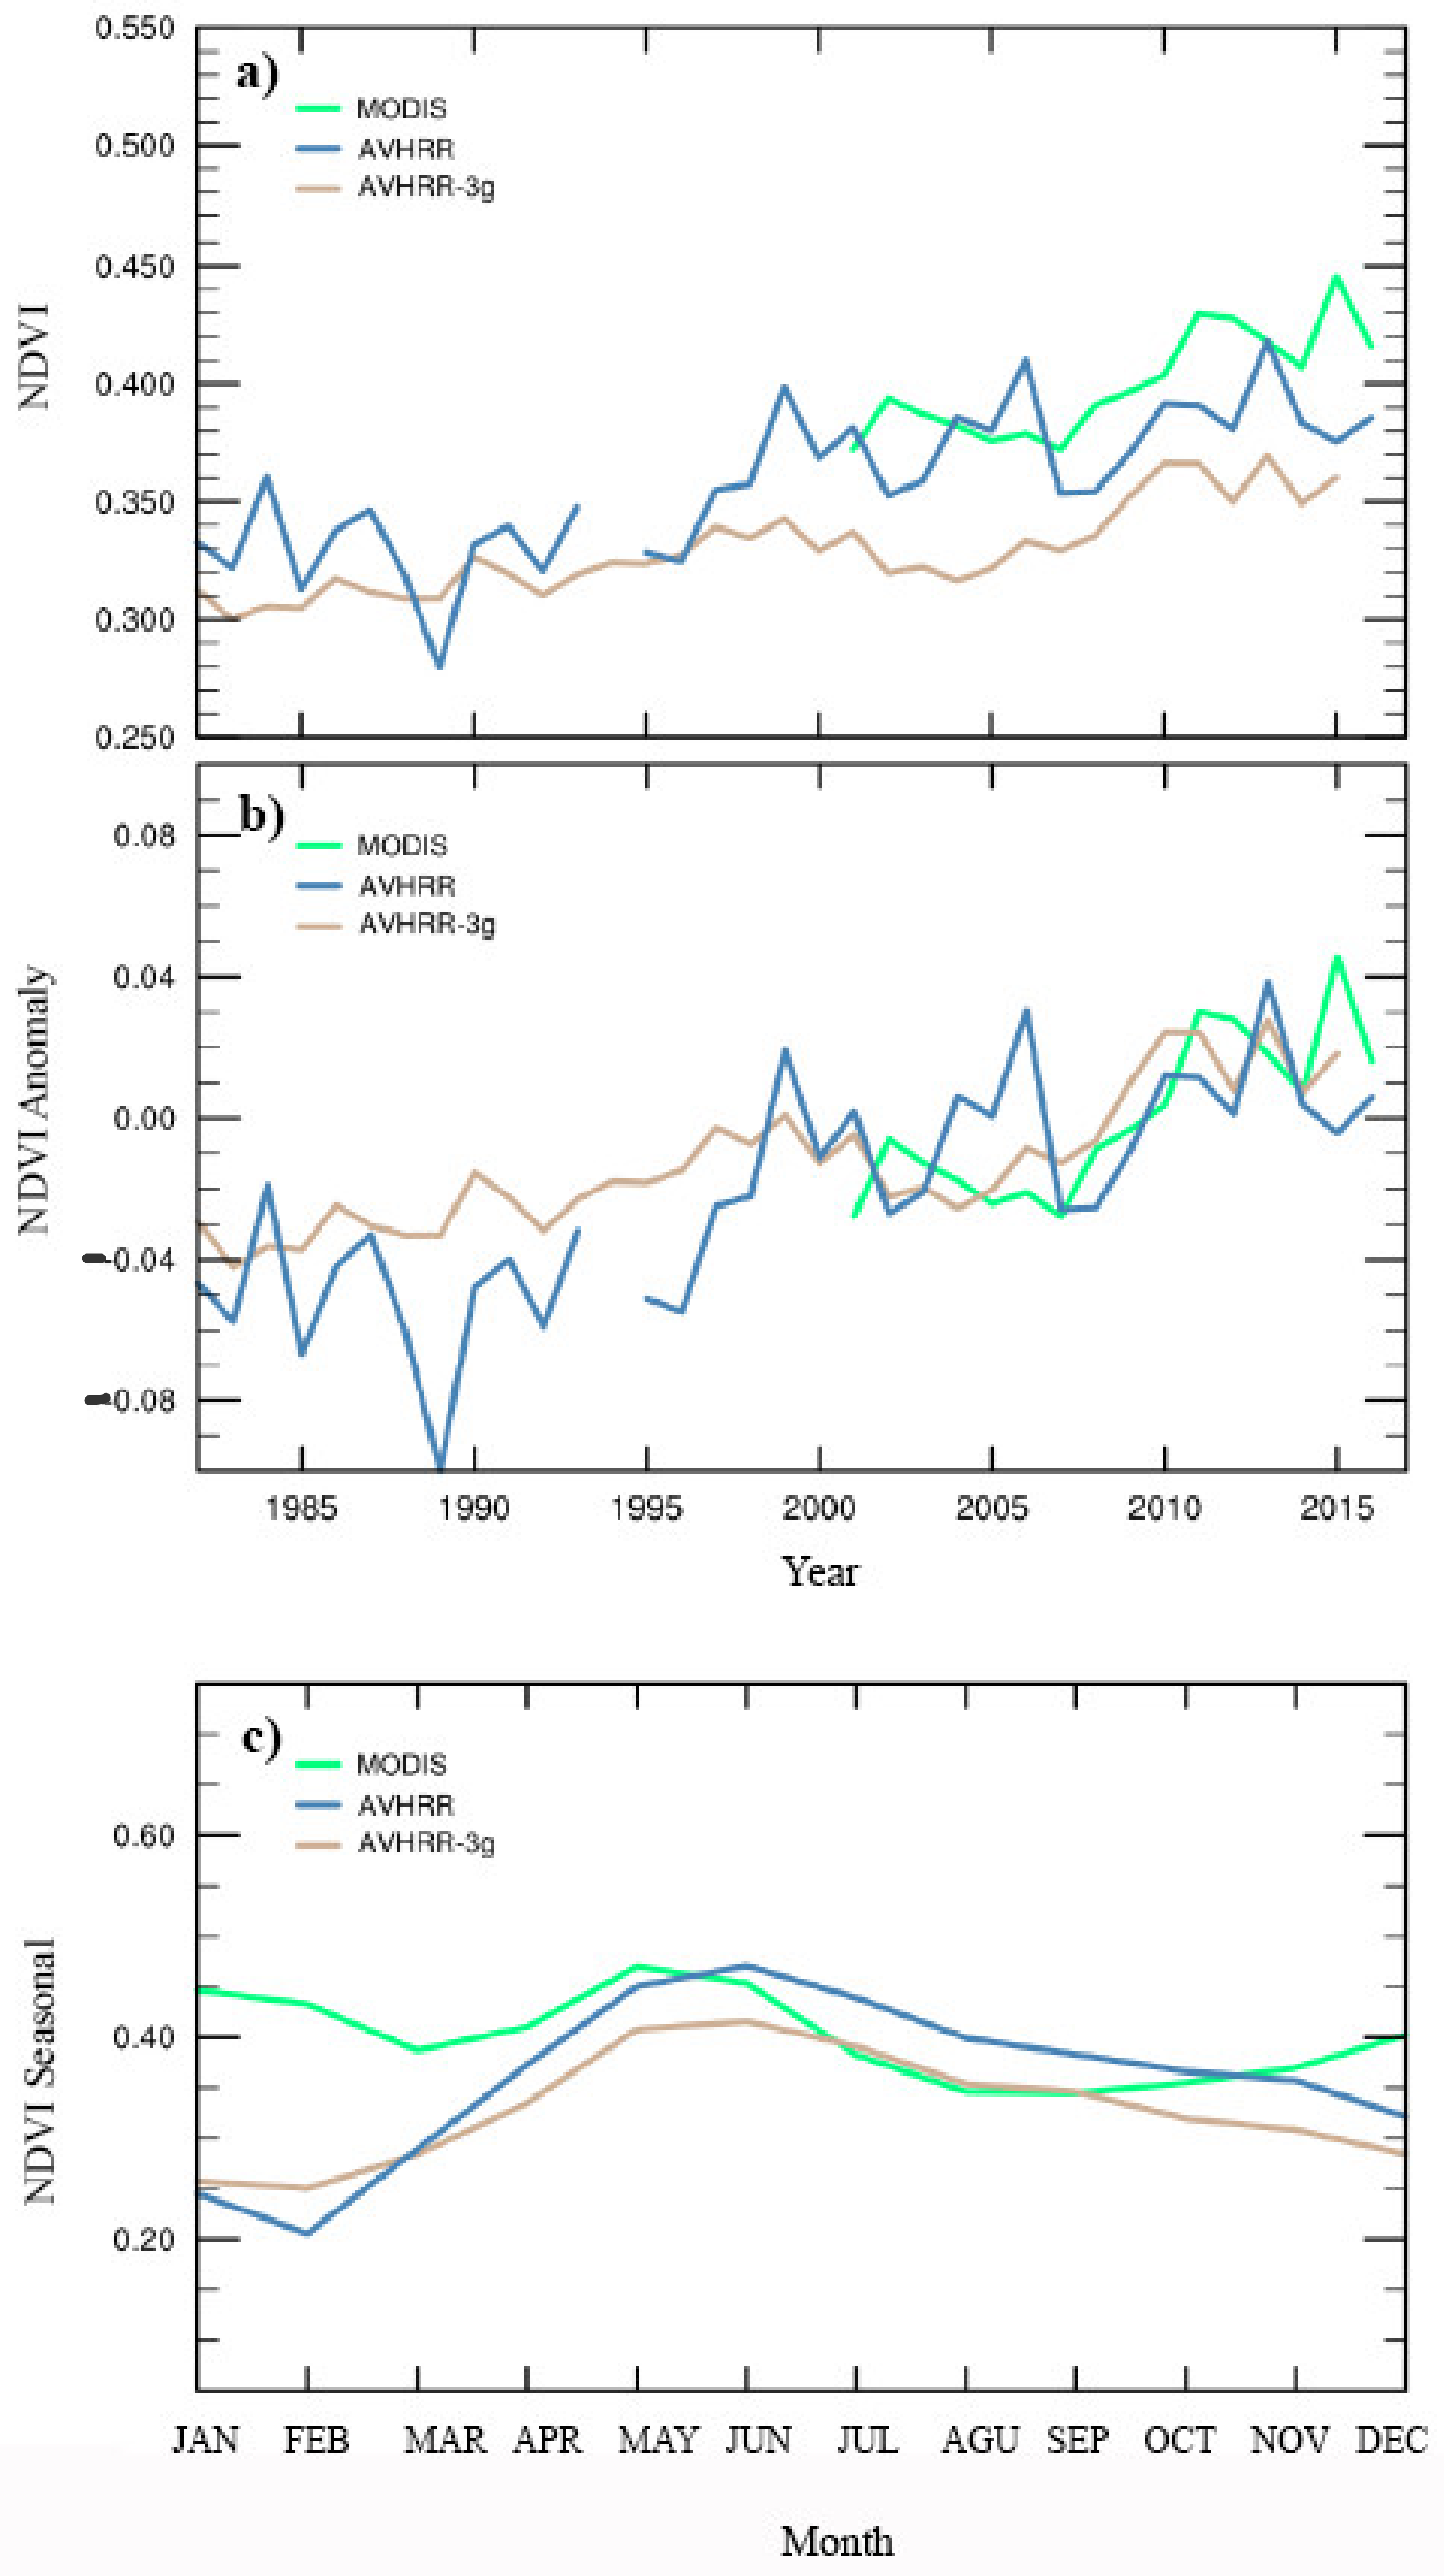
Within the framework of the Earth Observing System (EOS), the National Aeronautics and Space Administration (NASA) launched the first instrument of the MODIS into space with the Terra spacecraft on 18 December 1999. The second instrument of the MODIS, on the other hand, was launched into space on the Aqua spacecraft on 4 May 2002 [64]. MODIS’s difference from the other sensors is that it has a high temporal and positional resolution and can collect data from 0.4 µm to 14 µm in 36 separate spectral bands [65]. The MODIS sensor has 250 m spatial resolution between bands 1 and 2, 500 m spatial resolution between bands 3 and 7, and 1 km spatial resolution between bands 8 and 36 [66]. Although MODIS images are shot twice a day, NDVI products are broadcast as 8-day composites. MODIS NDVI images, consisting of 4800 rows and 4800 columns, provide the opportunity to analyze the change in vegetation activity in an extensive area [67]. Many studies have compared the NDVI data obtained from different satellites. Whereas some studies have argued that MODIS NDVI values are better compared to AVHRR NDVI and AVHRR NDVI3g [68], other studies have indicated that long-term trends show high consistency with each other [69]. AVHRR NDVI, AVHRR NDVI3g, and MODIS NDVI values were used in this study. NDVI time series were compared (Figure 2). To calculate the data series, the period selected was 2001–2015.
2.3.4. Vegetation Condition Index (VCI)
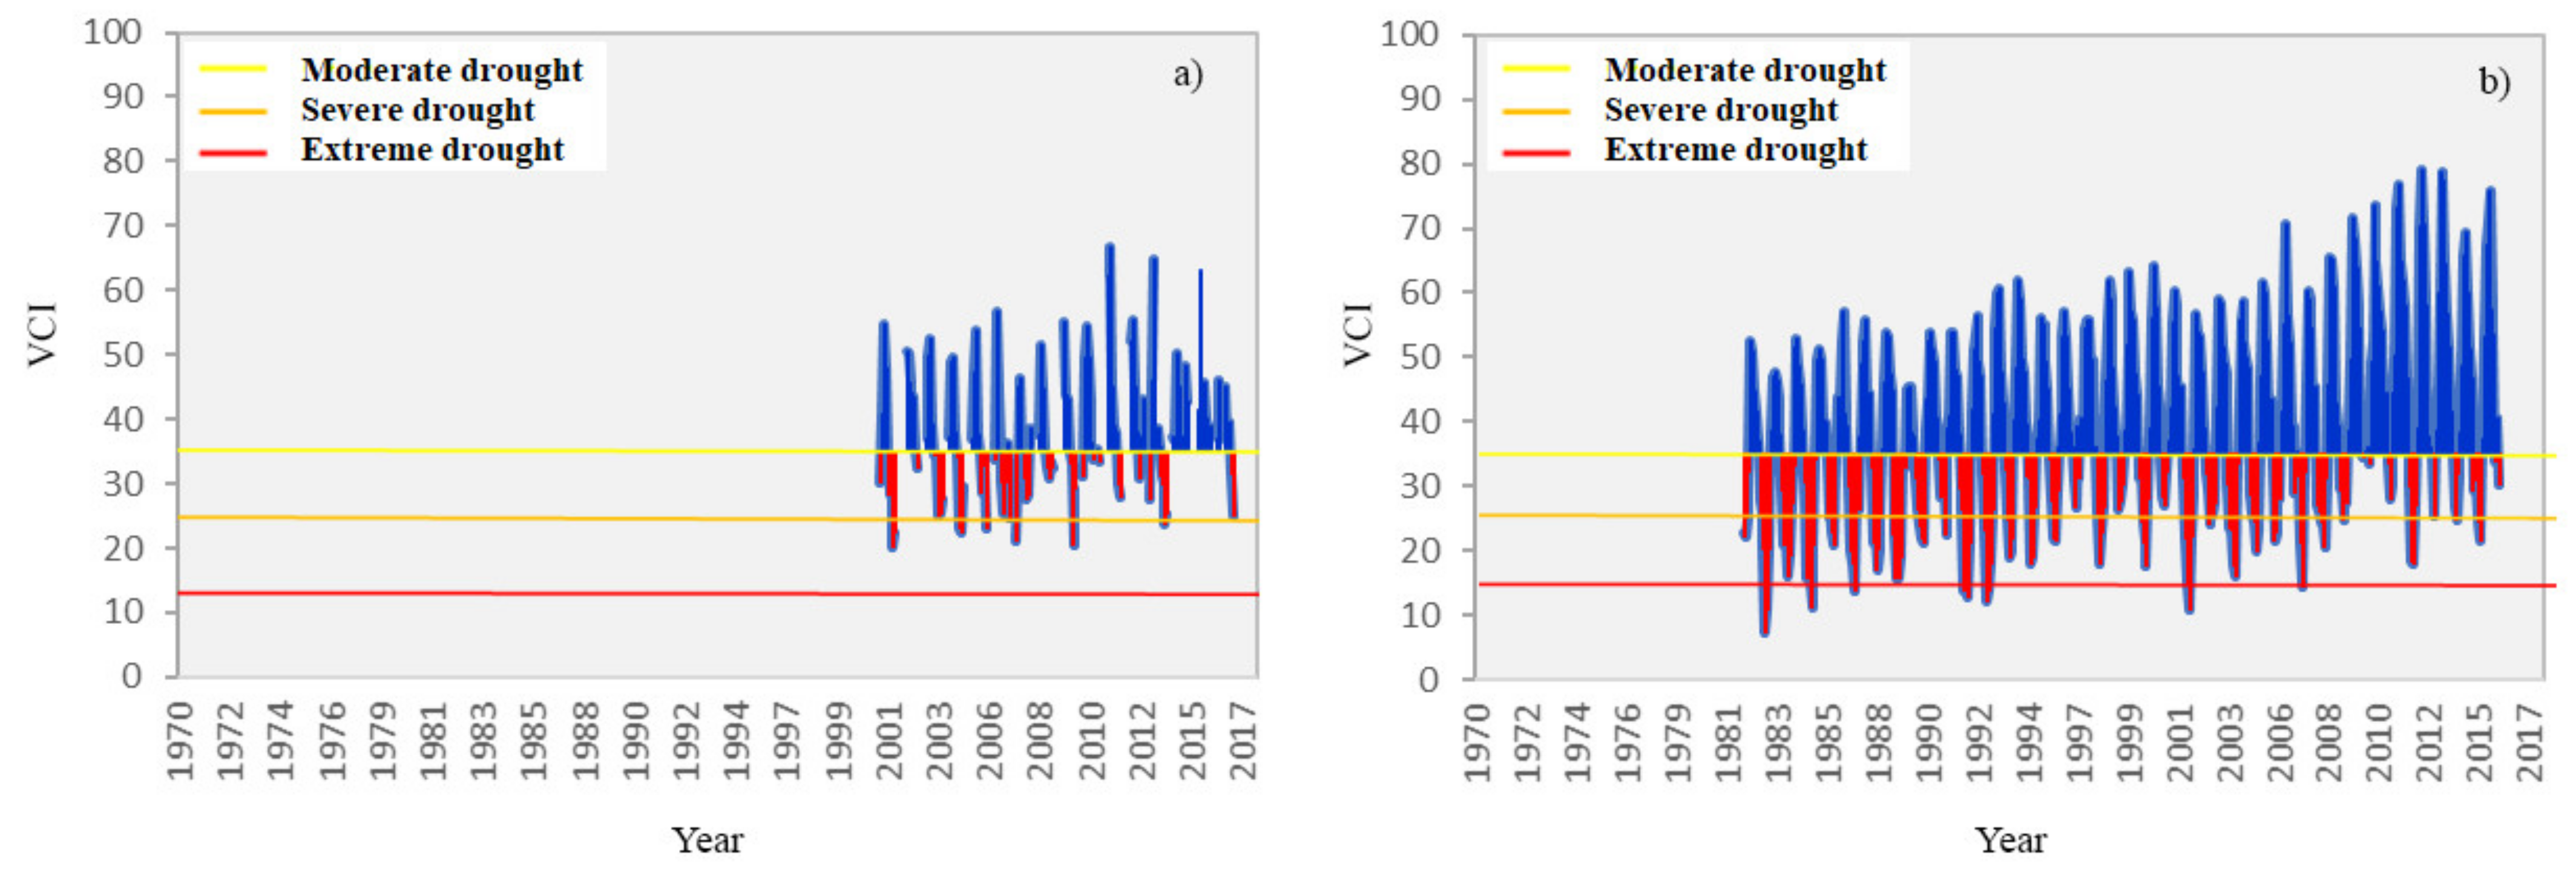
For this study, the VCI was calculated using the NDVI values obtained from MODIS and AVHRR satellite data to compare the drought determined by analyses conducted for the Seyhan Basin. Accordingly, the VCI time series obtained using satellite data covering the years 2001–2016 for each 250 m satellite cell within the basin area boundaries are presented in Figure 3.
In the time series, the VCI values shown in red indicate drought in the plant state, whereas blue values can be interpreted as the plant state corresponding to the seasonal and climatic normal conditions. The VCI can provide information about the onset, duration, and severity of drought by considering the impact of drought on vegetation. The VCI compares the NDVI data of a given period with the highest (max) and lowest (min) data values of the NDVI values belonging to the entire analyzed period [12]. The VCI is expressed as a percentage (%) and provides information about the highest and lowest values observed in past years. Whereas low VCI values indicate poor vegetation status, high VCI values indicate good vegetation [56]. Given that data obtained from the satellite data are spatially obtained over many cells, the VCIi for any cell (i) is calculated as follows:
VCIi = 100 × (NDVIi − NDVImin)/(NDVImax − NDVImin)
The VCI can be considered a normalized version of the NDVI. In addition to the NDVI, the VCI was also evaluated in this study since it is a more appropriate index for assessing the deviation of vegetation from the normal state. Therefore, the VCI allows the comparison of simultaneously measured NDVI values for different ecosystems, i.e., for different vegetation in different geographies. The VCI is a better indicator of soil moisture vulnerability than the NDVI because it can distinguish short-term climate signals from long-term ecological signals. The importance of the VCI is due to the vegetation index’s viability studied by the vegetation index [70]. VCI data, like NDVI data, have high resolution and reasonable areal extent. Several studies related to the use of the VCI for drought analysis purposes were reported in the literature [71].
Drought classification and threshold values used for drought analysis in the Seyhan Basin are given in Table 2.
Dry periods were found depending on whether it was below the determined threshold values. According to Figure 3, the VCI graph showed a dry period every 9–10 years and a semi-arid period every 2–3 years. According to the NDVI graph, a dry period was observed every 5–6 years. Even this varied with different satellites. The rate of vegetation indices finding drought in the past years was lower. The reasons for this are stated in the Data section as the disadvantages of remote sensing.
In addition, it is appropriate to use vegetation indices in determinations such as land change, irrigation change, and human intervention. Meteorological and hydrological indices, which have been measured for many years, should be used to accurately determine the severity and frequency of drought.
3. Results and Discussion
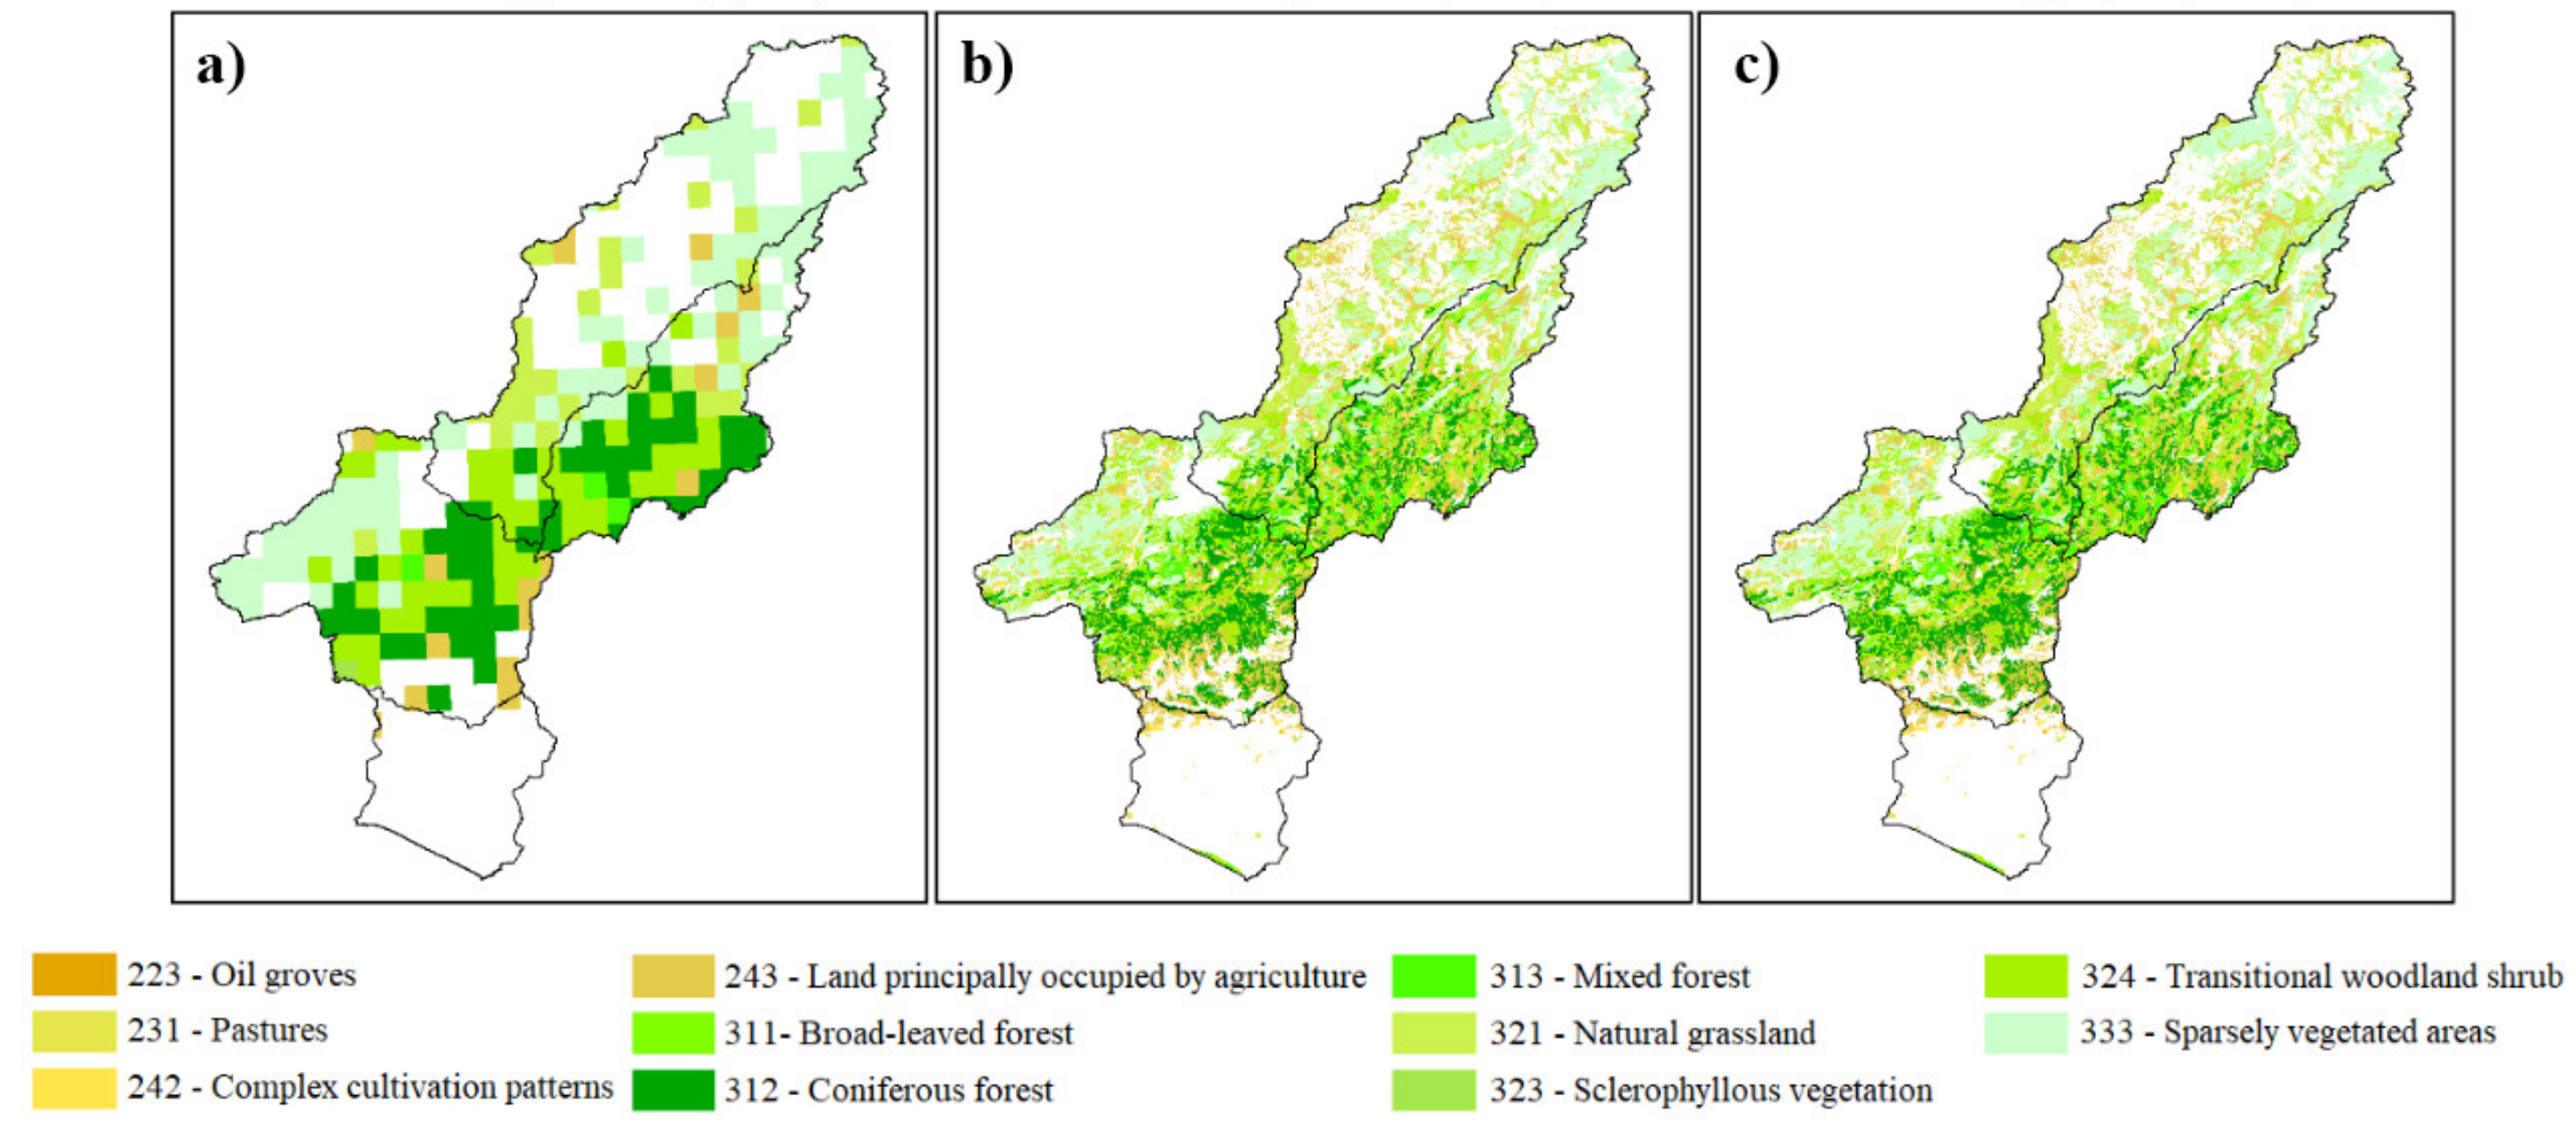
The drought index examinations carried out in the current study aimed to analyze climatic change responses of irregularly irrigated or non-irrigated agricultural areas and forest-vegetation areas within the Seyhan Basin. Coordination of Information on the Environment (CORINE) layers used in these analyses were selected and temporal NDVI changes in these layers were calculated. The distribution of these CORINE layers over the basin is given in Figure 4. In contrast, the layer list is given in Table 3 (in the CORINE classification, the layers beginning with “2” represent agricultural areas and the layers beginning with “3” represent the classes of forest and semi-natural areas).
The fact that the AVHRR-3G and MODIS NDVI data used in the analysis were at different resolutions led to the differentiation of the classified areas. The 8 km resolution pixels in the AVHRR-3G data correspond to 1024 pixels at 250 m resolution in the MODIS data. Therefore, some pixels may consist of a mosaic of classes with very different properties besides the class determined as the dominant data. Another issue to be considered in the assessment is that land usage may change over time.
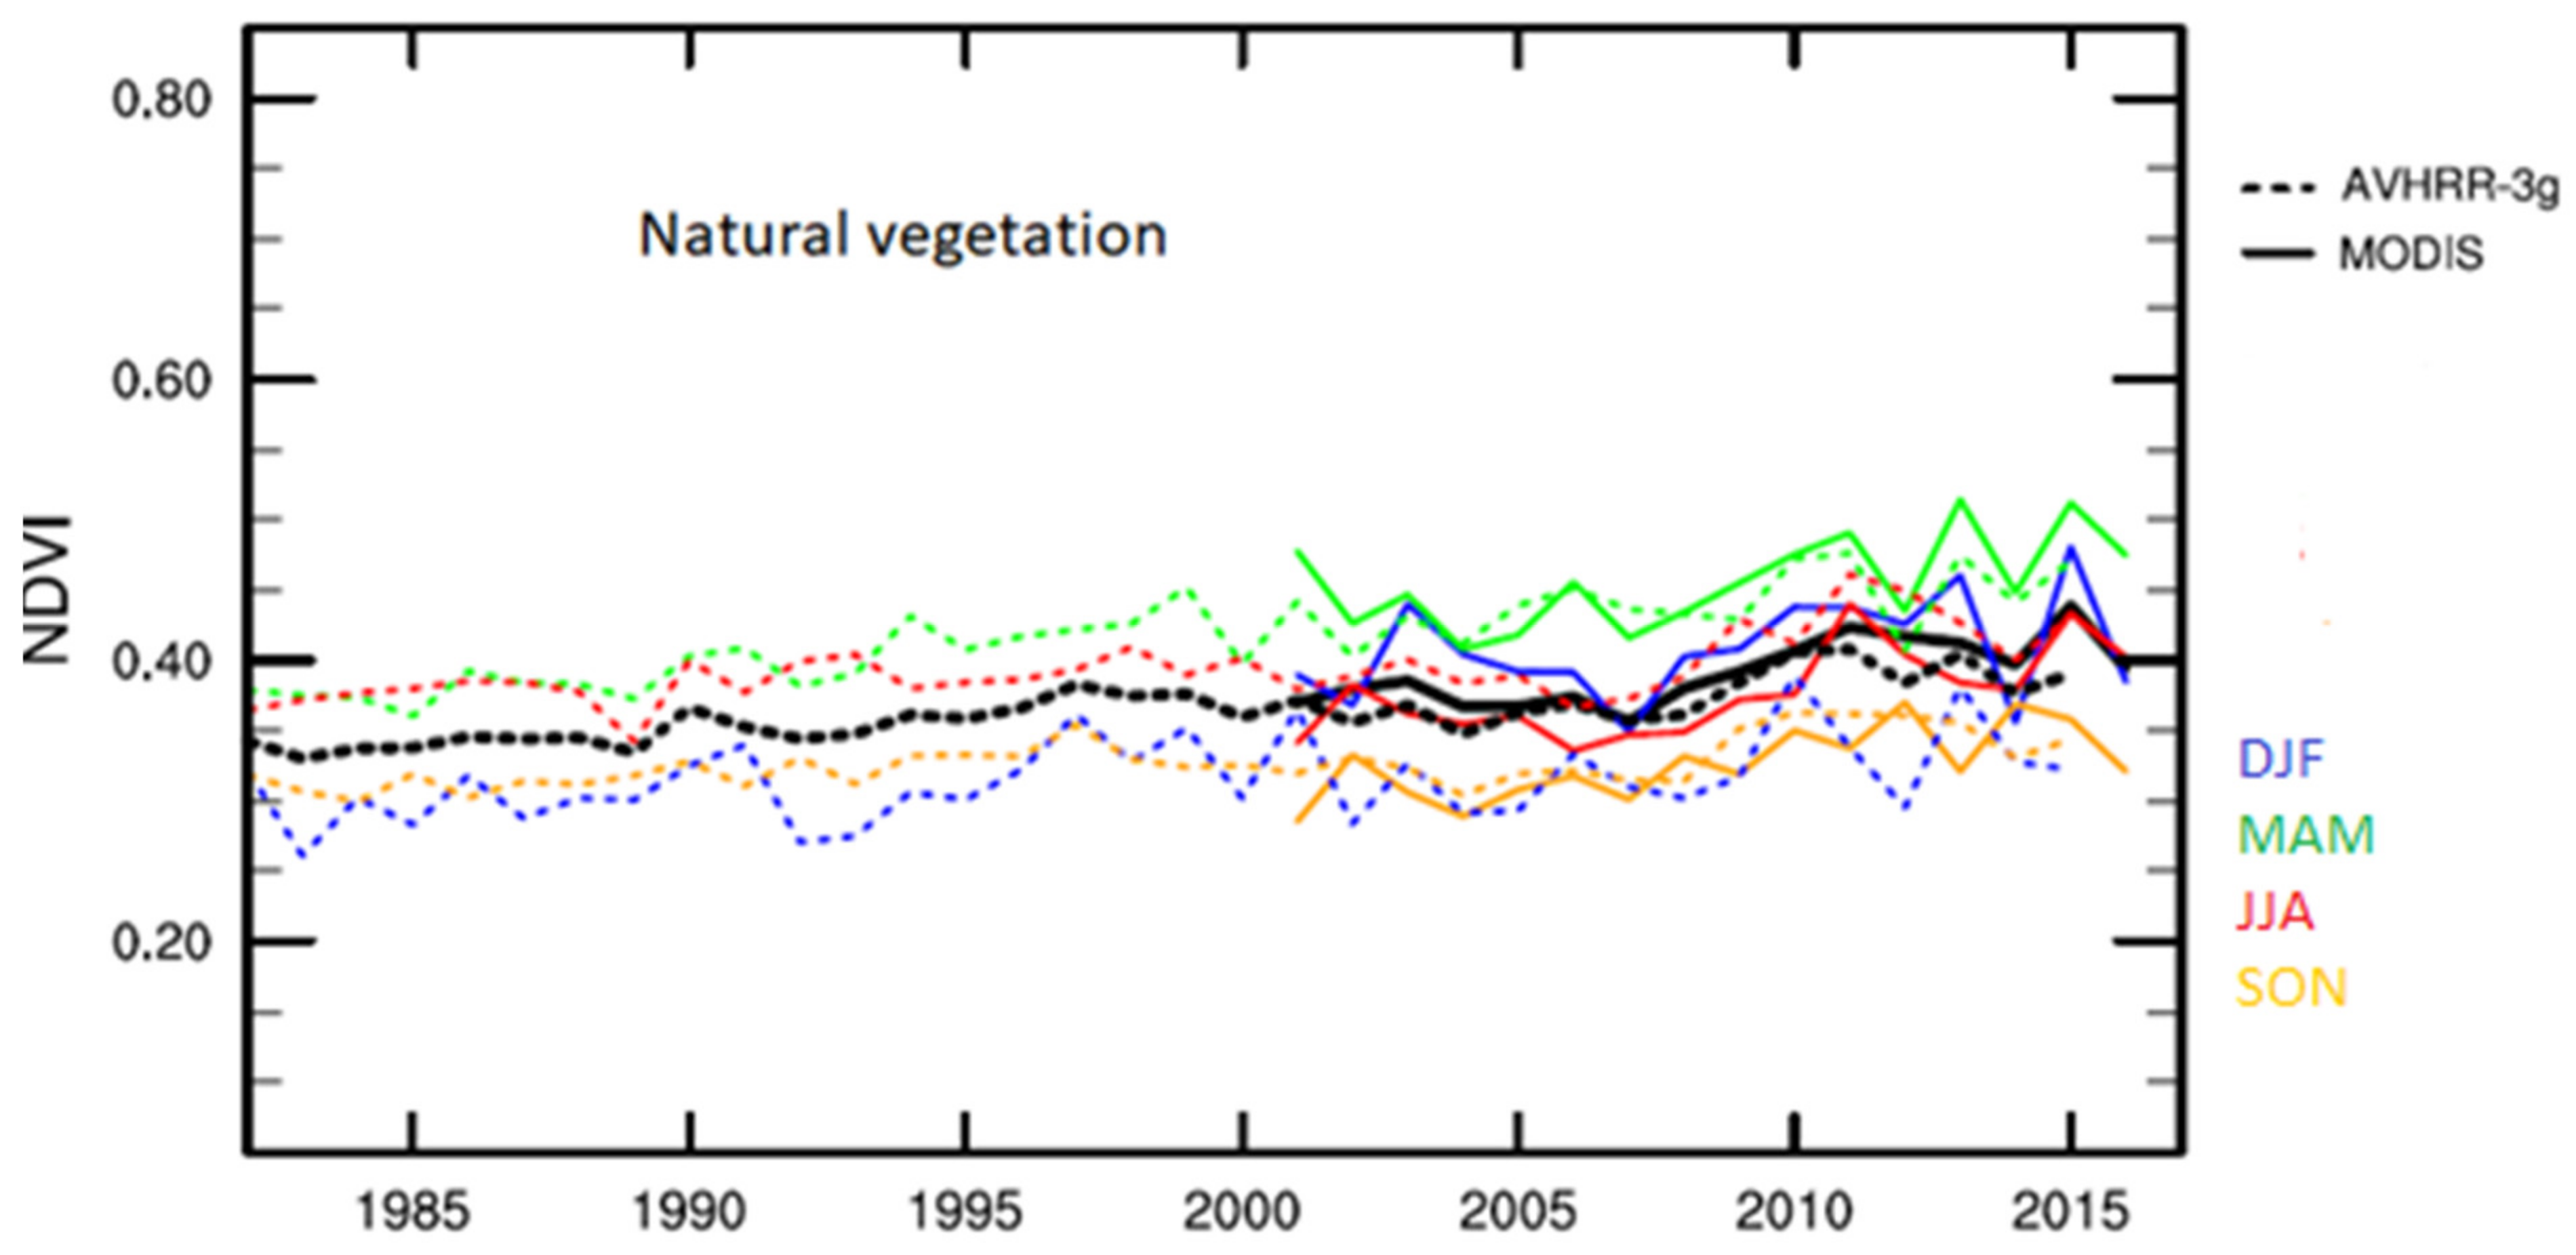
The NDVI temporal change series for agricultural areas starting with Code 2 in the CORINE 2012 land-use data is given annually in Figure 5. The dashed lines represent the AVHRR-3G data and the continuous lines represent the MODIS data. December–January–February (DJF), March–April–May (MAM), June–July–August (JJA), and September–October–November (SON) refer to the winter, spring, summer, and autumn seasons, respectively.
The evaluation of the time series of the examined layers in the general framework indicated that the NDVI values decreased between 2002 and 2004 and rose significantly between 2007 and 2013. Except for short-term fluctuations, the NDVI values were generally higher in spring and decreased in autumn. Since olive grove, pasture, and non-irrigated mixed agriculture classes covered areas too small to be represented in AVHRR-3G resolution, they were not included in the related charts. In olive groves, which are resistant to cold and known as the evergreen undead tree, values above the average were observed in winter, unlike other classes. The natural vegetation class is a vital suppressor in the results, as it covers large areas in the Seyhan Basin. For this reason, the values calculated from different satellite data were always similar. This layer in which the human influence is limited was one of the classes where the effects of drought on plants could be best observed, and it showed significant declines in 1982, 1989, 2004, 2007, 2012, and 2014.
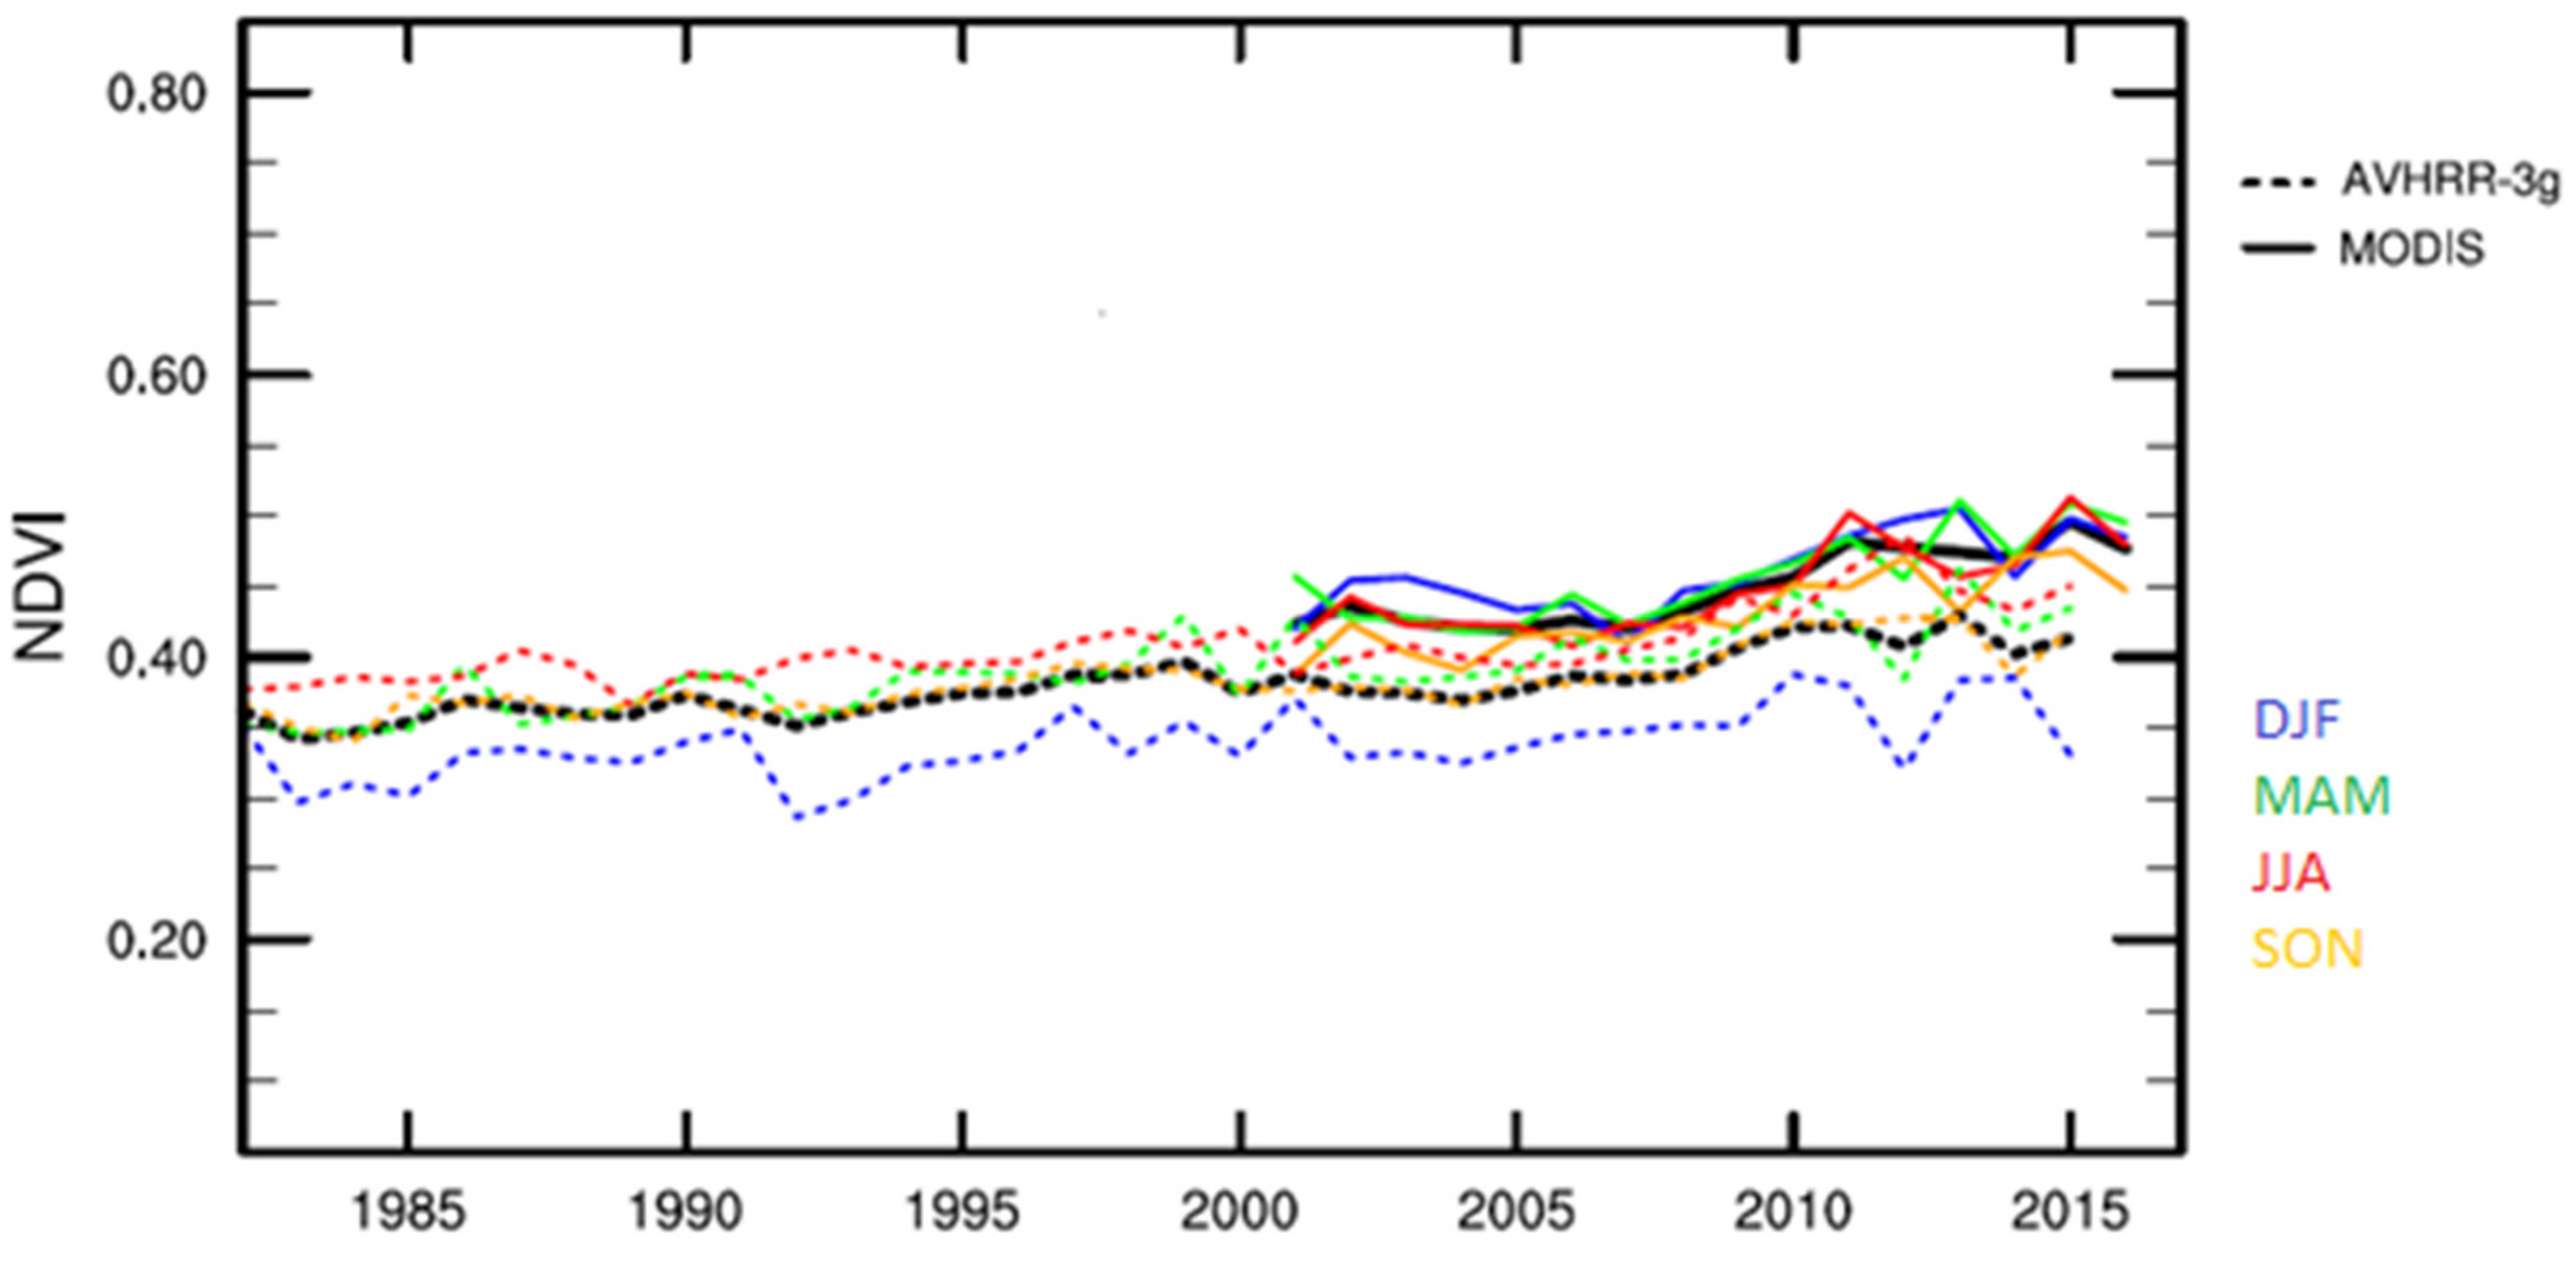
On the other hand, the highest values were observed in 2011 and 2015. The NDVI annual temporal change series for forest and semi-natural areas starting with Code 3 of the CORINE classification is given in Figure 6. In the examined forest layers, annual changes seen in agricultural areas were found to be similar. In corresponding NDVI calculations, the lowest values were obtained in winter and the highest values were determined in summer and spring.
Coniferous trees, which are cold-resistant and evergreen species, received the highest MODIS data values during the winter months. They received the lowest values in the AVHRR-3G data. In this case, it was suggested that the coniferous forests class was confused with other classes since a sufficient class differentiation cannot be obtained at 8 km resolution and that because deciduous trees are located within the same pixel as conifers, they received much lower values in winter than expected.
Comparison with Different Indices
To investigate the accuracy of the vegetation indices that were thought to be used in the basin, it is important to compare them with the meteorological indices.
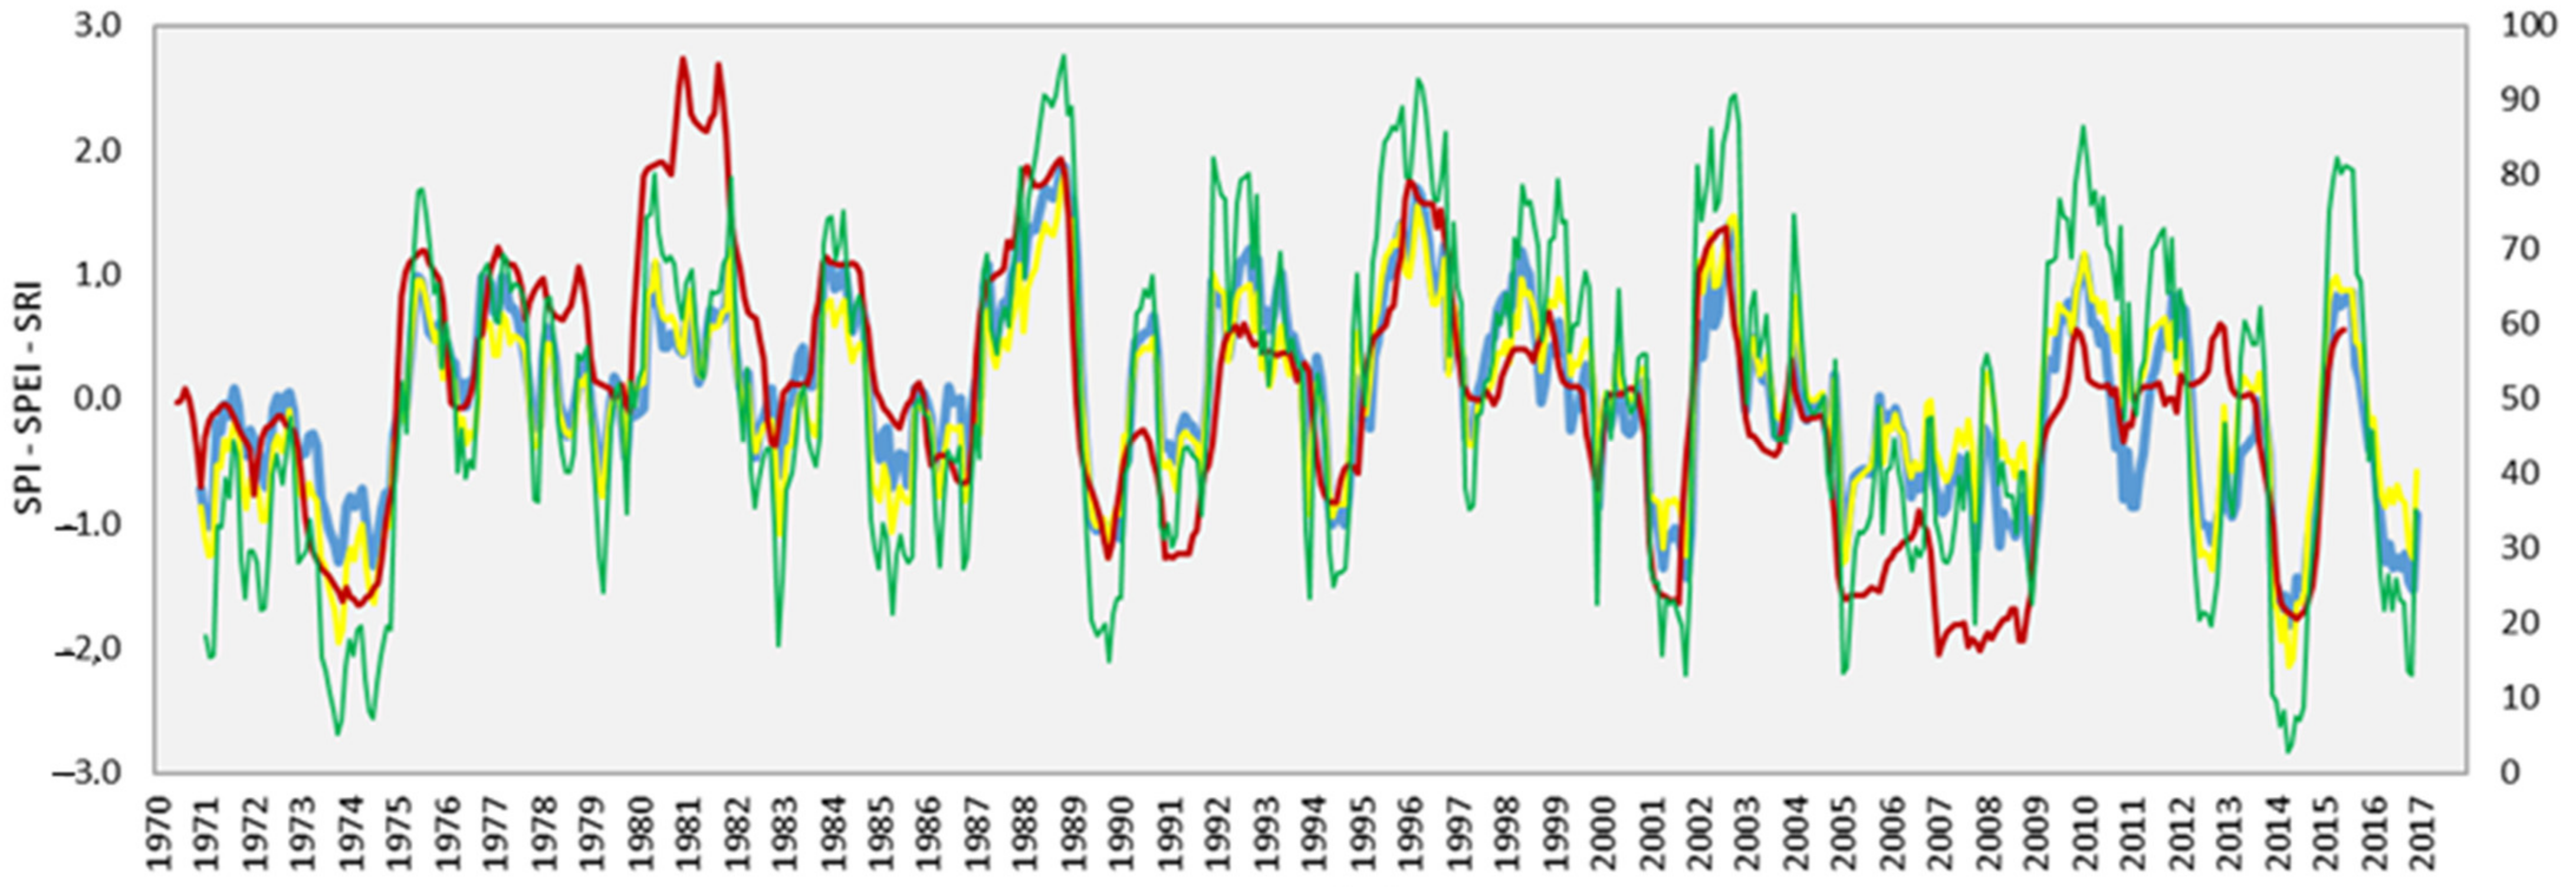
The SPEI (Standardized Precipitation Evapotranspiration Index), SPI (Standardized Precipitation Index), SRI (Standardized Runoff Index), and DI (Deciles Index) indices were used to analyze the drought in the Asi Basin in a previous study [21].
The SPEI12, SPI12, SRI12, and DI (Figure 7) drought indices obtained by meteorological data were compared and it was seen that the values were very close to each other [72].
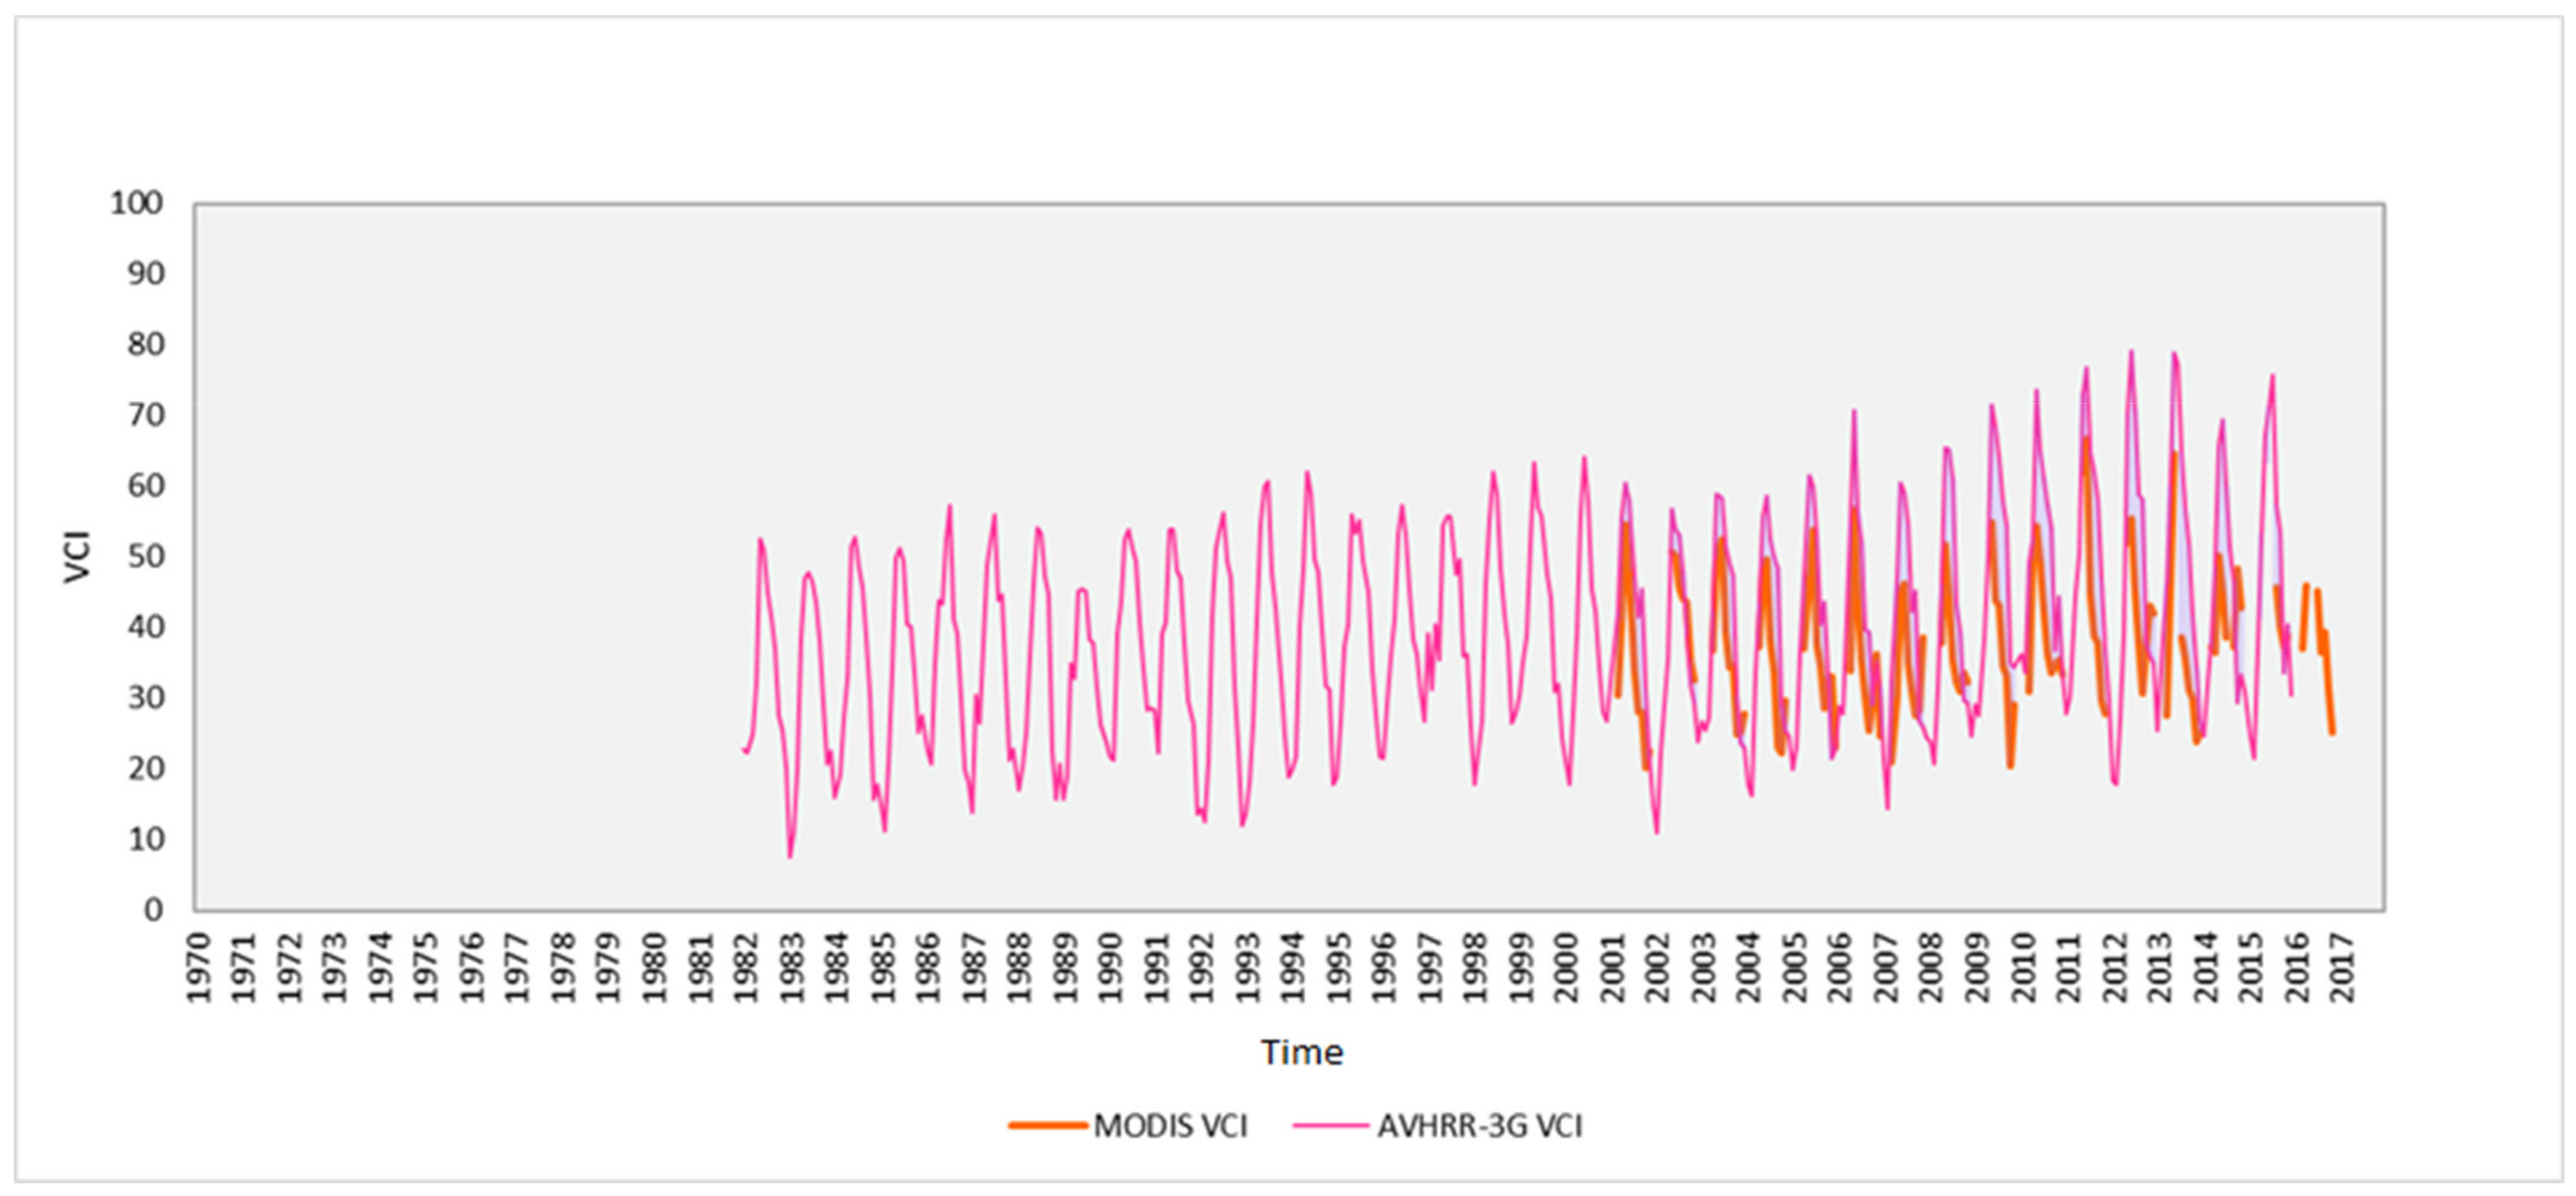
A comparison of the Seyhan Basin MODIS VCI and AVHRR-3G VCI is given in Figure 8. The comparison of the NDVI and VCI vegetation indices found for the Seyhan Basin and the drought indices calculated with the meteorological data are given below (Figure 9 and Figure 10).
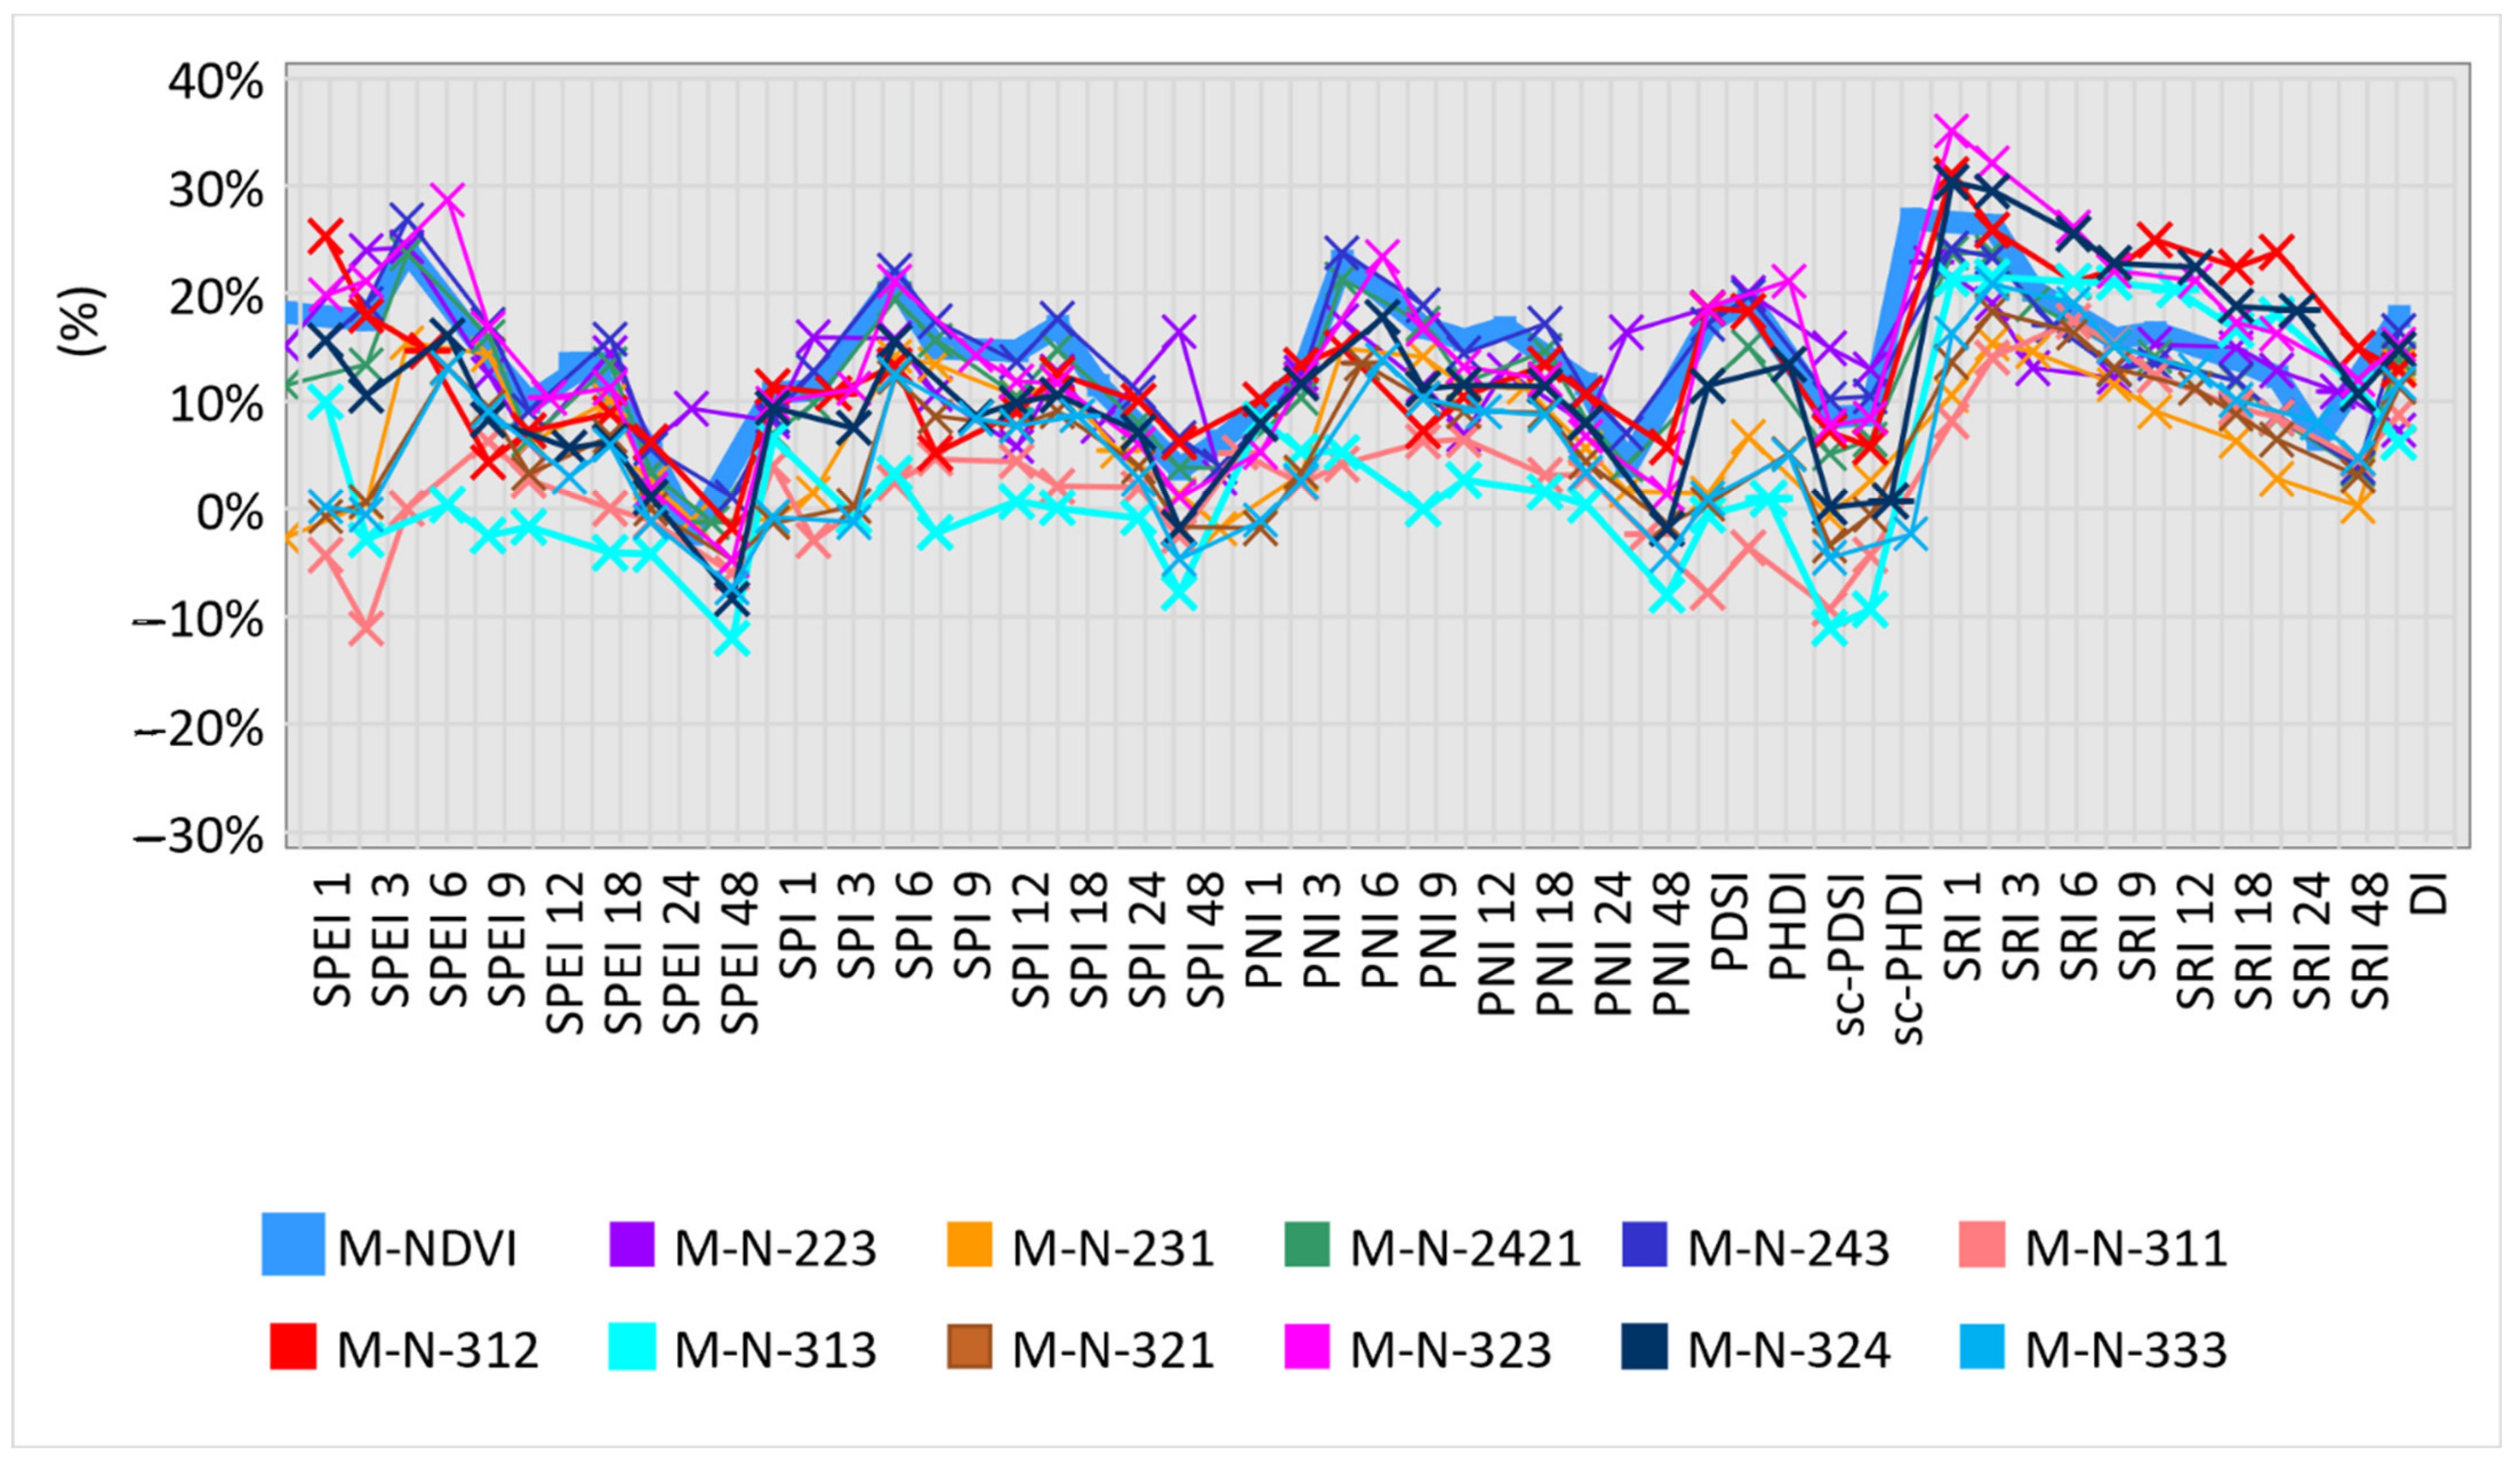
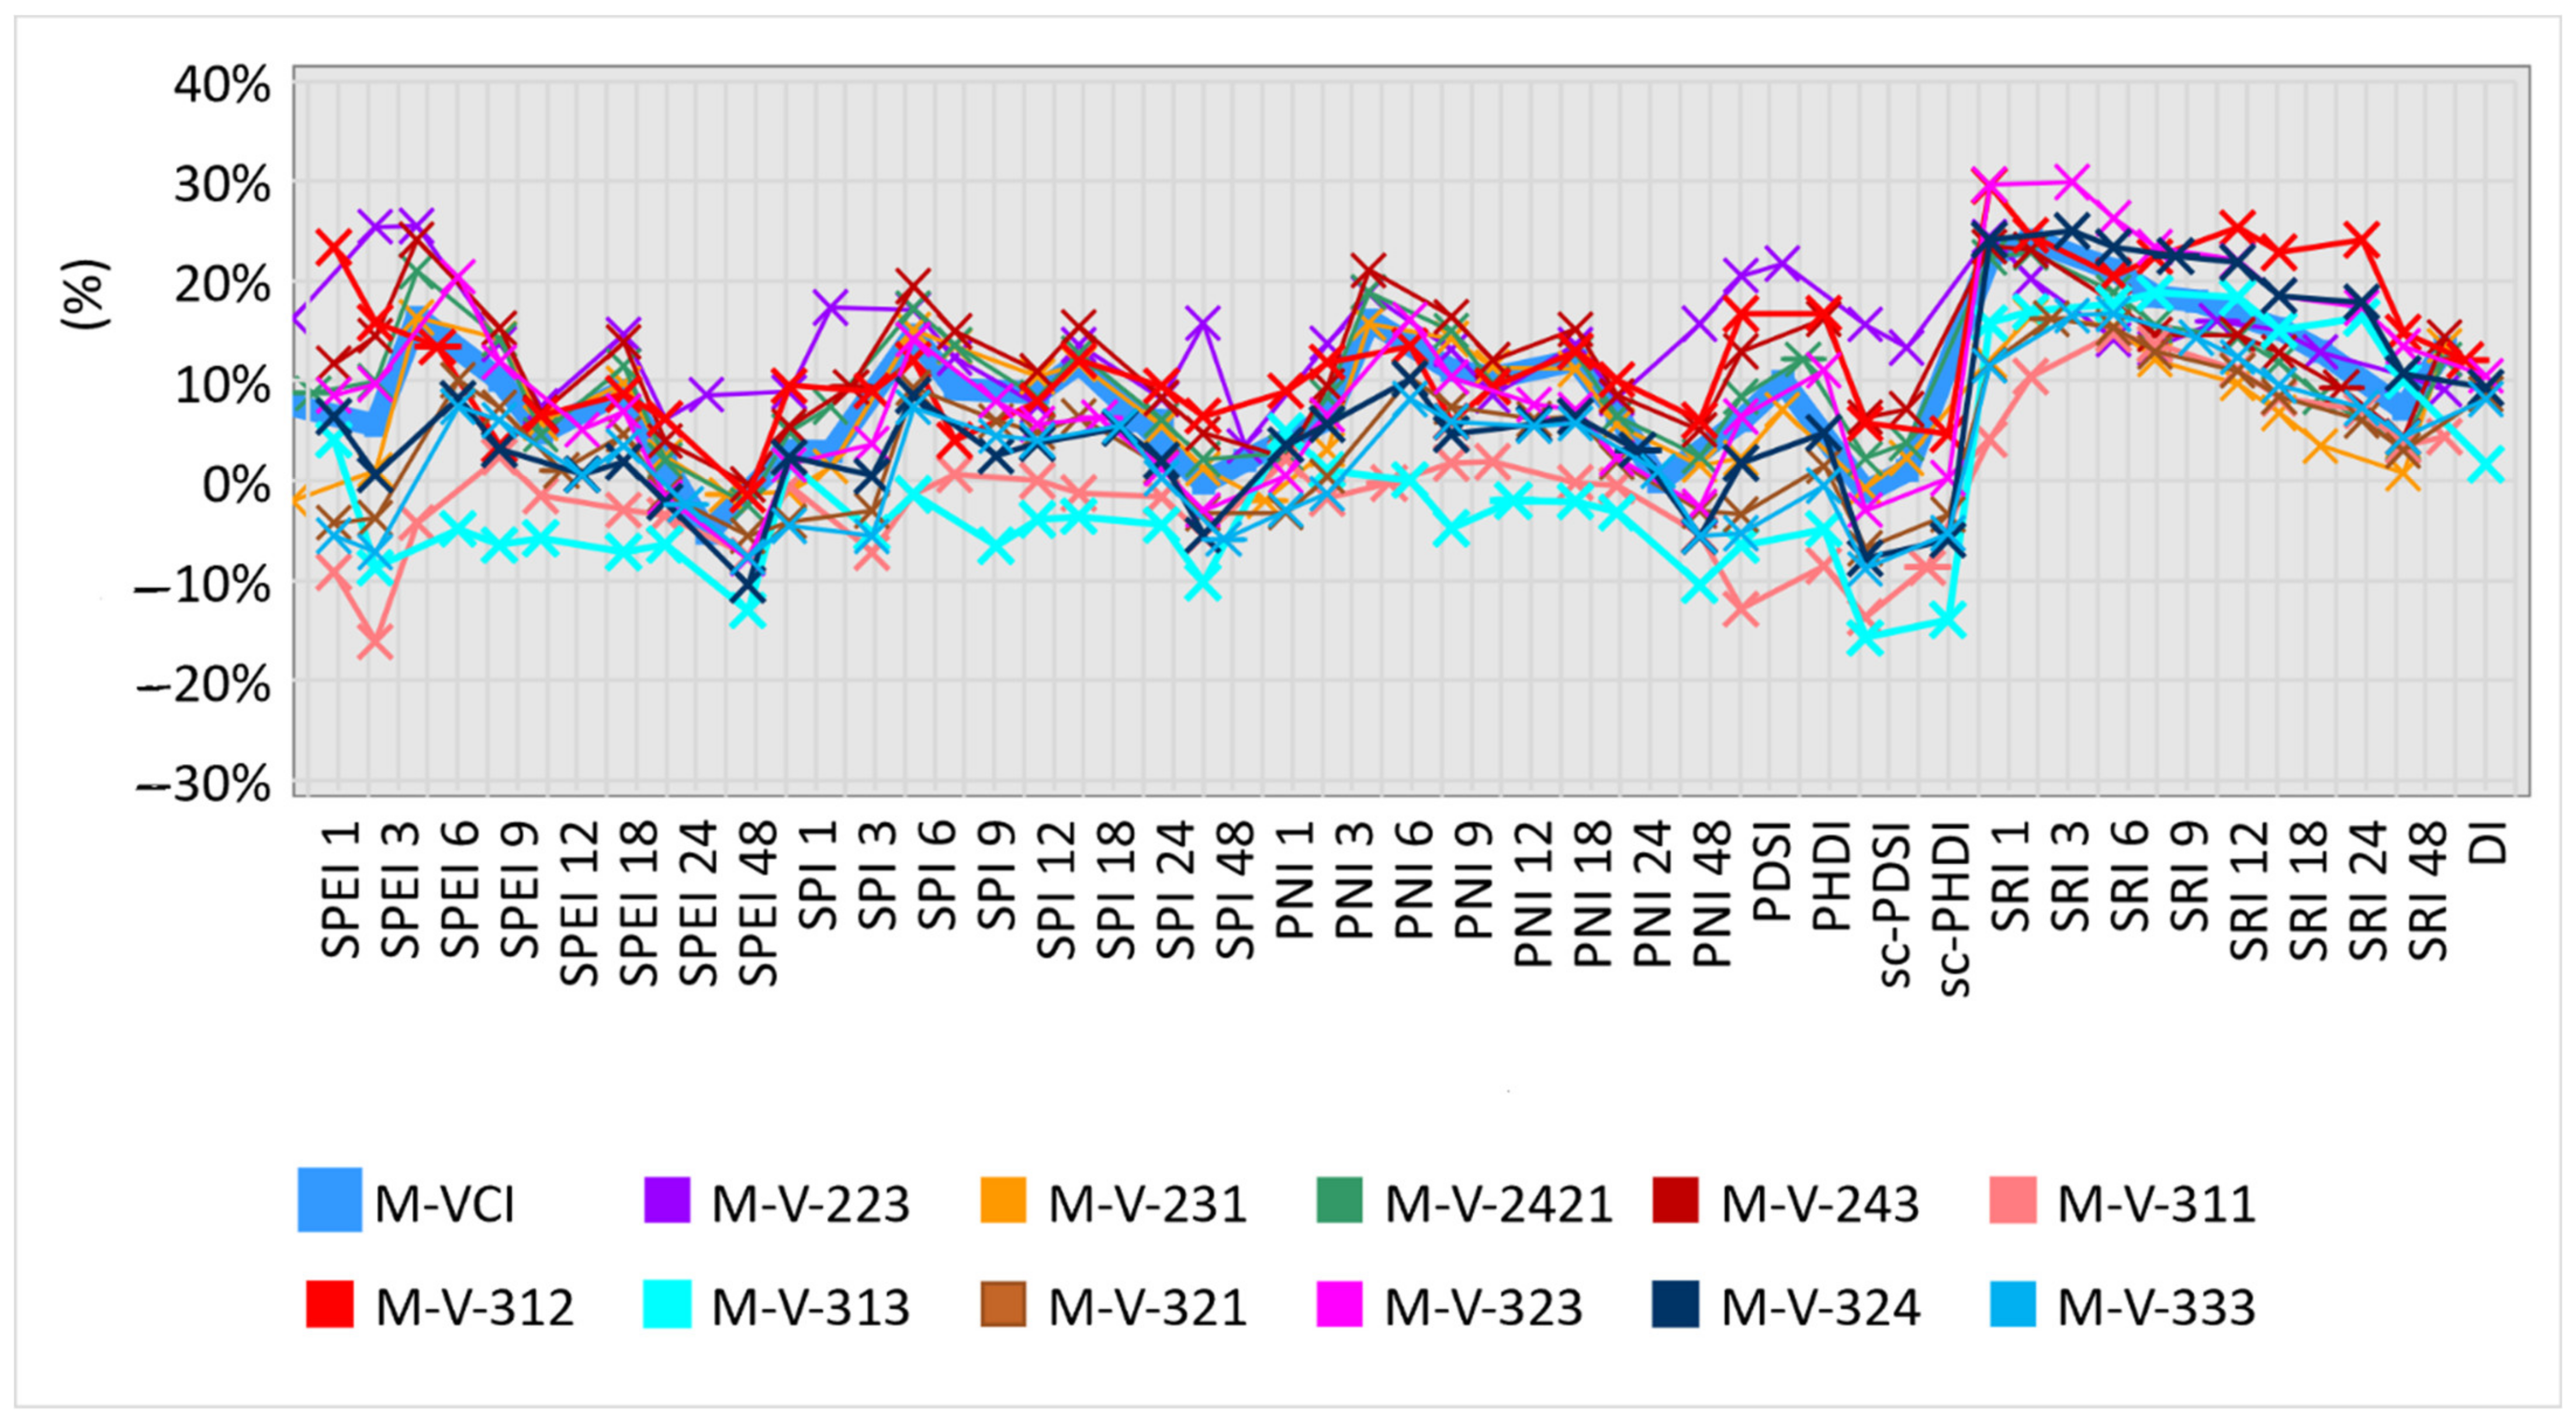
The comparison of the correlation coefficients obtained between the MODIS NDVI and 37 indices were found for the Seyhan Basin. The correlation coefficients of the indices varied between −10% and 40%. The highest correlation was found between SRI-1 and sclerophyll vegetation (M-N-323) at 40%. Figure 8 shows the comparison of the correlation coefficients obtained between the MODIS VCI and 37 indices for the Seyhan Basin. The correlation coefficients of the indices varied between −20% and 30%. The best correlation was found to be 30% between SRI-3 and sclerophyll vegetation (M-V-323).
There was a very low correlation, according to the results shown in the figures.
Comparing the drought indices to follow the course of the drought is useful to examine the accuracy of the method. In previous studies that examined the region, the compatibility of the hydrological and meteorological indices indicates that the determination of drought is accurate. The fact that the vegetation indices did not fit well with other indices obtained by measurements performed over the years indicates that the accuracy is low. Although drought was determined, the determination of its frequency, severity, and magnitude may not be accurate.
4. Conclusions
The years in which two indices indicated drought for the Seyhan Basin were determined as 1973–1974, 1989, 2001, 2007–2008, 2014, and 2016. The drought return period for the Seyhan Basin have decreased over the years. On the other hand, the overall NDVI mean values have increased since the 2000s for all seasons. This increase may result from the fact that the snow cover, which decreases the NDVI values due to climate change, decreased in terms of process and area. It is thought that contribution of the increasing temperature values positively affects the photosynthesis process. Changes in land use may also cause differentiation in the NDVI values. Especially when considering a long period (e.g., 1982–2016), this change is inevitable. It should be considered that with the population growth, forestlands can transform into agricultural areas and agricultural areas can transform into artificial pavement areas, or sometimes the opposite situations can occur due to specific reasons such as migration from village to city, which can cause artificial tendencies in the results. Based on the vegetation indices, it is understood that there is a drought trend in the basin. With the decline of forestland and agricultural areas, the drought seen in the past years will increase over time for the Seyhan Basin. In the case of drought estimation at intervals covering long periods, the changes in the land-use patterns and demography of the region should also be considered.
It is possible to make plans covering different purposes with drought indices, which have a wide application area, include practical application methodology, and can provide a higher resolution and precise solutions thanks to remote sensing technologies. However, these indices should be used to associate field data and other GIS layers such as land use, population growth, etc.
The use of hydrological and meteorological indices should be preferred for the analysis of drought in variable lands. In basins where the land structure does not change much, vegetation indices can give accurate results in a short time only with satellite data.
On the other hand, there were some limitations to the research. There was a transportation difficulty for testing some areas measured by remote sensing. Meteorological and hydrological measurements did not have continuity for many years. Human interventions to the vegetation in the region and changes in wetlands were issues that made the analysis difficult.
Other indices calculated with meteorological measurements for many years have a high correlation with each other and are more accurate according to historical records. Vegetation indices are a quick and easy solution to determine the trend of drought. However, the SPEI, SPI, SRI, and DI, which are calculated by meteorological measurements that have been used for many years, can be considered priority indices for drought analysis.
Considering that the number of satellites in space has increased recently, it may not be correct to analyze drought with only one vegetation index. Vegetation indices, which are compatible with meteorological and hydrological drought indices, can be used in situations with less data and for faster results. They may not give accurate results in areas with high terrain variability.
Funding
This research received no external funding.
Institutional Review Board Statement
Not applicable.
Informed Consent Statement
Not applicable.
Data Availability Statement
Not applicable.
Acknowledgments
We would like to thank the General Directorate of Water Management of the Ministry of Forestry and Water Affairs for sharing the data.
Conflicts of Interest
The author declares no conflict of interest.
References
- Benson, G.J.; Dambe, D.; Darnhofer, T.; Gommes, R.; Mwongela, G.N.; Pedglev, D.E.; Perarnaud, V. Extreme Agrometeorological Events; WMO: Geneva, Switzerland, 1997. [Google Scholar]
- Dinç, N.; Aydinşakir, K.; Işik, M.; Büyüktaş, D. Standartlaştırılmış yağış indeksi (SPI) yöntemi ile Antalya ili kuraklık analizi (Drought analysis of Antalya province by standardized precipitation index (SPI)). Derim 2016, 33, 279–298. [Google Scholar] [CrossRef] [Green Version]
- Meza, I.; Siebert, S.; Döll, P.; Kusche, J.; Herbert, C.; Rezaei, E.E.; Nouri, H.; Gerdener, H.; Popat, E.; Frischen, J.; et al. Global-scale drought risk assessment for agricultural systems. Nat. Hazards Earth Syst. Sci. 2020, 20, 695–712. [Google Scholar] [CrossRef] [Green Version]
- Vogt, J.; Naumann, G.; Masante, D.; Spinoni, J.; Cammalleri, C.; Erian, W.; Pischke, F.; Pulwarty, R.; Barbosa, P. Drought Risk Assessment and Management. A Conceptual Framework; Publications Office of the European Union: Luxembourg, 2018. [Google Scholar] [CrossRef]
- Wilhite, D.A.; Sivakumar, M.; Pulwarty, R. Managing drought risk in a changing climate: The role of national drought policy. Weather Clim. Extrem. 2014, 3, 4–13. [Google Scholar] [CrossRef] [Green Version]
- European Commission. Drought Management Plan Report: Including Agricultural, Drought Indicators and Climate Change Aspect; European Commission: Brussels, Belgium, 2007. [Google Scholar]
- GWP. Guidelines for the Preparation of Drought Management Plans. Development and Implementation in the Context of the EU Water Framework Directive; Global Water Partnership Central and Eastern Europe: Bratislava, Slovakia, 2015. [Google Scholar]
- Pérez-Blanco, C.D.; Gomez, C.M. Drought management plans and water availability in agriculture: A risk assessment model for a Southern European basin. Weather Clim. Extrem. 2014, 4, 11–18. [Google Scholar] [CrossRef] [Green Version]
- Wilhite, D.A. Drought: A Global Assessment; Routledge: London, UK, 2000. [Google Scholar] [CrossRef]
- Funk, C.; Shukla, S. (Eds.) Chapter 3—Drought Early Warning Systems; Elsevier: Amsterdam, The Netherlands, 2020; pp. 43–59. [Google Scholar] [CrossRef]
- Svoboda, M.D.; Fuchs, B.A. Handbook of Drought Indicators and Indices, Drought and Water Crises: Integrating Science, Management, and Policy, 2nd ed.; CRC Press: Boca Raton, FL, USA, 2017. [Google Scholar] [CrossRef]
- Quiring, S.M.; Ganesh, S. Evaluating the utility of the Vegetation Condition Index (VCI) for monitoring meteorological drought in Texas. Agric. For. Meteorol. 2010, 150, 330–339. [Google Scholar] [CrossRef]
- Piao, S.; Fang, J.; Zhou, L.; Guo, Q.; Henderson, M.; Ji, W.; Li, Y.; Tao, S. Interannual variations of monthly and seasonal normalized difference vegetation index (NDVI) in China from 1982 to 1999. J. Geophys. Res. 2003, 108. [Google Scholar] [CrossRef]
- Nicholson, S.; Farrar, T. The influence of soil type on the relationships between NDVI, rainfall, and soil moisture in semiarid Botswana. I. NDVI response to rainfall. Remote Sens. Environ. 1994, 50, 107–120. [Google Scholar] [CrossRef]
- Shad, M.S.; Ildoromi, A.R.; Akhzari, D. Drought monitoring using vegetation indices and MODIS data (Case study: Isfahan Province, Iran). J. Rangel. Sci. 2017, 7, 148–159. [Google Scholar]
- Choudhary, K.; Goel, I.; Bisen, P.; Sanapala, M.; Ray, S.; Murthy, C.; Seshasai, M. Use of Remote Sensing Data for Drought Assessment: A Case Study for Bihar State of India During Kharif; Springer: Berlin/Heidelberg, Germany, 2013; pp. 399–407. [Google Scholar] [CrossRef]
- Klisch, A.; Atzberger, C. Operational Drought Monitoring in Kenya Using MODIS NDVI Time Series. Remote Sens. 2016, 8, 267. [Google Scholar] [CrossRef] [Green Version]
- Nanzad, L.; Zhang, J.; Tuvdendorj, B.; Nabil, M.; Zhang, S.; Bai, Y. NDVI anomaly for drought monitoring and its correlation with climate factors over Mongolia from 2000 to 2016. J. Arid Environ. 2019, 164, 69–77. [Google Scholar] [CrossRef]
- Rezaei Moghaddam, M.H.; Moghadam, R.; Rostamzadeh, H.; Rezaei, A.; Valizadeh Kamran, K. Assessing the Efficiency of Vegetation Indicators for Estimating Agricultural Drought Using MODIS Sensor Images (Case Study: Sharghi Azerbaijan Province). Int. J. Adv. Biol. Biomed. Res. 2014, 2, 399–407. [Google Scholar]
- Dikici, M. Drought analysis with different indices for the Asi Basin (Turkey). Sci. Rep. 2020, 10, 20739. [Google Scholar] [CrossRef] [PubMed]
- Altın, T.B.; Sarış, F.; Altın, B.N. Determination of drought intensity in Seyhan and Ceyhan River Basins, Turkey, by hydrological drought analysis. Theor. Appl. Climatol. 2020, 139, 95–107. [Google Scholar] [CrossRef]
- Dikici, M. Asi Havzası’nda (Türkiye) Kuraklık Analizi. Doğal Afetler Çevre Dergisi 2018, 5, 22–40. [Google Scholar] [CrossRef]
- Dikici, M.; İpek, C.; Topçu, İ. Seyhan Havzası’nda Palmer Indeksleri ile Kuraklık Analizi. In Proceedings of the 6th International Symposium on Innovative Technologies in Engineering and Science, Antalya, Turkey, 9–11 November 2018; pp. 9–11. [Google Scholar]
- Gumus, V.; Algin, H.M. Meteorological and hydrological drought analysis of the Seyhan−Ceyhan River Basins, Turkey. Meteorol. Appl. 2017, 24, 62–73. [Google Scholar] [CrossRef]
- Keskiner, A.D.; Çetin, M.; Şimşek, M.; Akin, S. Kuraklık Riski Altındaki Havzalarda Gölet Haznelerinin Tasarımı: Seyhan Havzasında Bir Uygulama. Tek. Dergi 2020, 31, 10189–10210. [Google Scholar] [CrossRef]
- Patel, K. Turkey Experiences Intense Drought [WWW Document]. NASA Earth Obs. 2021. Available online: https://earthobservatory.nasa.gov/images/147811/turkey-experiences-intense-drought (accessed on 25 January 2021).
- Kundu, A.; Denis, D.M.; Patel, N.R.; Mall, R.K.; Dutta, D. Geoinformation Technology for Drought Assessment; Wiley: Hoboken, NJ, USA, 2020; pp. 171–180. [Google Scholar]
- Jafari, S.M.; Nikoo, M.R.; Dehghani, M.; Alijanian, M. Evaluation of two satellite-based products against ground-based observation for drought analysis in the southern part of Iran. Nat. Hazards 2020, 102, 1249–1267. [Google Scholar] [CrossRef]
- Shojaei, S.; Rahimzadegan, M. Improving a comprehensive remote sensing drought index (CRSDI) in the Western part of Iran. Geocarto Int. 2020, 35, 1–19. [Google Scholar] [CrossRef]
- Drisya, J.; Kumar, D.S.; Roshni, T. Chapter 27—Spatiotemporal Variability of Soil Moisture and Drought Estimation Using a Distributed Hydrological Model; Samui, P., Kim, D., Ghosh, C.B.T., Eds.; Elsevier: Amsterdam, The Netherlands, 2018; pp. 451–460. [Google Scholar] [CrossRef]
- Zhu, J.; Zhou, L.; Huang, S. A hybrid drought index combining meteorological, hydrological, and agricultural information based on the entropy weight theory. Arab. J. Geosci. 2018, 11, 1–12. [Google Scholar] [CrossRef]
- Bulut, B.; Yilmaz, M. Analysis of the 2007 and 2013 Droughts in Turkey by NOAH Hydrological Model. Tek. Dergi 2016, 27, 7619–7634. [Google Scholar]
- Gökdemir, O. Buharlaşma ve Terlemenin NOAA-AVHRR Uydu Görüntüleri ile Tahmini (Estimation of Evaporation and Sweating with NOAA-AVHRR Satellite Images). Master’s Thesis, Hacettepe University, Ankara, Turkey, 2002. [Google Scholar]
- Dikici, M.; Aksel, M. Evaluation of Two Vegetation Indices (NDVI and VCI) Over Asi Basin in Turkey. Tek. Dergi 2021, 32, 10995–11011. [Google Scholar] [CrossRef]
- Hatfield, J.L.; Prueger, J.H. Temperature extremes: Effect on plant growth and development. Weather Clim. Extrem. 2015, 10, 4–10. [Google Scholar] [CrossRef] [Green Version]
- Brede, B.; Verbesselt, J.; Dutrieux, L.; Herold, M. Performance of the Enhanced Vegetation Index to Detect Inner-annual Dry Season and Drought Impacts on Amazon Forest Canopies. ISPRS Int. Arch. Photogramm. Remote Sens. Spat. Inf. Sci. 2015, XL-7/W3, 337–344. [Google Scholar] [CrossRef] [Green Version]
- Jiao, W.; Zhang, L.; Chang, Q.; Fu, D.; Cen, Y.; Tong, Q. Evaluating an Enhanced Vegetation Condition Index (VCI) Based on VIUPD for Drought Monitoring in the Continental United States. Remote Sens. 2016, 8, 224. [Google Scholar] [CrossRef] [Green Version]
- Khusfi, E.; Zarei, K.Z. Relationships between Meteorological Drought and Vegetation Degradation Using Satellite and Climatic Data in a Semi-Arid Environment in Markazi Province, Iran. J. Rangel. Sci. 2020, 10, 204–216. [Google Scholar]
- Nguyen, H.; Otkin, J.A.; Wheeler, M.C.; Hope, P.; Trewin, B.; Pudmenzky, C. Climatology and Variability of the Evaporative Stress Index and Its Suitability as a Tool to Monitor Australian Drought. J. Hydrometeorol. 2020, 21, 2309–2324. [Google Scholar] [CrossRef]
- Nguyen, H.; Wheeler, M.C.; Otkin, J.A.; Cowan, T.; Frost, A.J.; Stone, R.C. Using the evaporative stress index to monitor flash drought in Australia. Environ. Res. Lett. 2019, 14, 064016. [Google Scholar] [CrossRef] [Green Version]
- Anderson, M.; Zolin, C.A.; Sentelhas, P.C.; Hain, C.R.; Semmens, K.; Yilmaz, M.T.; Gao, F.; Otkin, J.; Tetrault, R. The Evaporative Stress Index as an indicator of agricultural drought in Brazil: An assessment based on crop yield impacts. Remote Sens. Environ. 2016, 174, 82–99. [Google Scholar] [CrossRef]
- Solangi, G.S.; Siyal, A.A.; Siyal, P. Spatiotemporal Dynamics of Land Surface Temperature and Its Impact on the Vegetation. Civ. Eng. J. 2019, 5, 1753–1763. [Google Scholar] [CrossRef]
- Tsiros, E.; Domenikiotis, C.; Spiliotopoulos, M.; Dalezios, N. Use of Noaa/Avhrr-Based Vegetation Condition Index (Vci) and Temperature Condition Index (Tci) for Drought Monitoring in Thessaly, Greece. In Proceedings of the EWRA Symposium on Water Resources Management: Risks and Challenges for the 21st Century, Izmir, Turkey, 2–4 September 2004. [Google Scholar]
- Zaw, Z.; Fan, Z.; Bräuning, A.; Xu, C.; Liu, W.; Gaire, N.P.; Panthi, S.; Than, K.Z. Drought Reconstruction Over the Past Two Centuries in Southern Myanmar Using Teak Tree-Rings: Linkages to the Pacific and Indian Oceans. Geophys. Res. Lett. 2020, 47, e2020GL087627. [Google Scholar] [CrossRef]
- Rahman, A.; Kogan, F.; Roytman, L.; Goldberg, M.; Krakauer, N. Application of Advanced Very High Resolution Radiometer (AVHRR)-based Vegetation Health Indices for Estimation of Malaria Cases. Am. J. Trop. Med. Hyg. 2010, 82, 1004–1009. [Google Scholar] [CrossRef] [PubMed] [Green Version]
- Melese, A.; Suryabhagavan, K.V.; Balakrishnan, M. Multimodel and Vegetation Indices for Drought Vulnerability Assessment: A Case Study of Afar Region in Ethiopia. Remote Sens. Land 2018, 2, 1–14. [Google Scholar] [CrossRef]
- Baniya, B.; Tang, Q.; Xu, X.; Haile, G.G.; Chhipi-Shrestha, G. Spatial and Temporal Variation of Drought Based on Satellite Derived Vegetation Condition Index in Nepal from 1982–2015. Sensors 2019, 19, 430. [Google Scholar] [CrossRef] [PubMed] [Green Version]
- Gebrehiwot, T.; Van Der Veen, A.; Maathuis, B. Governing agricultural drought: Monitoring using the vegetation condition index. Ethiop. J. Environ. Stud. Manag. 2016, 9, 354. [Google Scholar] [CrossRef] [Green Version]
- Tadesse, T.; Champagne, C.; Wardlow, B.; Hadwen, T.A.; Brown, J.; Demisse, G.B.; Bayissa, Y.A.; Davidson, A.M. Building the vegetation drought response index for Canada (VegDRI-Canada) to monitor agricultural drought: First results. GISci. Remote Sens. 2017, 54, 230–257. [Google Scholar] [CrossRef]
- Bento, V.A.; Gouveia, C.; DaCamara, C.C.; Trigo, I. A climatological assessment of drought impact on vegetation health index. Agric. For. Meteorol. 2018, 259, 286–295. [Google Scholar] [CrossRef]
- Masitoh, F.; Rusydi, A.N. Vegetation Health Index (VHI) analysis during drought season in Brantas Watershed. In Proceedings of the IOP Conference Series: Earth and Environmental Science, Volume 389, Geomatics International Conference 2019, Surabaya, Indonesia, 21–22 August 2019. [Google Scholar] [CrossRef]
- Masupha, T.E.; Moeletsi, M.E. The use of Water Requirement Satisfaction Index for assessing agricultural drought on rain-fed maize, in the Luvuvhu River catchment, South Africa. Agric. Water Manag. 2020, 237, 106142. [Google Scholar] [CrossRef]
- Amalo, L.F.; Ma’Rufah, U.; Permatasari, P.A. Monitoring 2015 drought in West Java using Normalized Difference Water Index (NDWI). IOP Conf. Ser. Earth Environ. Sci. 2018, 149, 012007. [Google Scholar] [CrossRef]
- Chandrasekar, K.; Sai, M.V.R.S.; Roy, P.S.; Dwevedi, R.S. Land Surface Water Index (LSWI) response to rainfall and NDVI using the MODIS Vegetation Index product. Int. J. Remote Sens. 2010, 31, 3987–4005. [Google Scholar] [CrossRef]
- Chandrasekar, K.; Sai, M.V.R.S.; Behera, G. Assessment of early season agricultural drought through land surface water index (lswi) and soil water balance model. ISPRS Int. Arch. Photogramm. Remote Sens. Spat. Inf. Sci. 2012, W20, 50–55. [Google Scholar] [CrossRef] [Green Version]
- Şahin, M.; Kandırmaz, H.M.; Şenkal, O.; Peştemalci, V.; Yildiz, B.Y. Normalize Edilmiş Bitki ndeksini Kullanarak Yağış Miktarının Hesaplanması (Calculation of Amount of Rainfall by Using Normalized Difference Vegetation Index), Fen Bilimleri Enstitüsü Dergisi. Süleyman Demirel Üniv. Fen Bilimleri Enstitüsü Derg. 2009, 13, 113–122. [Google Scholar]
- Yıldız, H.; Mermer, A.; Ünal, E.; Akbaş, F. Türkiye Bitki Örtüsünün NDVI Verileri ile Zamansal ve Mekansal Analizi. Tarla Bitk. Merk. Araştırma Enstitüsü Derg. 2012, 21, 50–56. [Google Scholar] [CrossRef]
- Lee, E. Analysis of MODIS 250 m NDVI Using Different Time-Series Data for Crop Type Separability. Ph.D. Thesis, University of Kansas, Lawrence, KS, USA, 2014. [Google Scholar]
- Nagol, J.R.; Vermote, E.F.; Prince, S.D. Quantification of Impact of Orbital Drift on Inter-Annual Trends in AVHRR NDVI Data. Remote Sens. 2014, 6, 6680–6687. [Google Scholar] [CrossRef] [Green Version]
- Pinzon, J.; Brown, M.; Tucker, C. Satellite time series correction of orbital drift artifacts using empirical mode decomposition. In Hilbert-Huang Transform and Its Applications; World Scientific: Hackensack, NJ, USA, 2005; pp. 167–186. [Google Scholar]
- Pinzon, J.E.; Tucker, C.J. A Non-Stationary 1981–2012 AVHRR NDVI3g Time Series. Remote Sens. 2014, 6, 6929–6960. [Google Scholar] [CrossRef] [Green Version]
- Tucker, C.J.; Pinzon, J.E.; Brown, M.E.; Slayback, D.; Pak, E.W.; Mahoney, R.; Vermote, E.F.; Saleous, N. An extended AVHRR 8-km NDVI dataset compatible with MODIS and SPOT vegetation NDVI data. Int. J. Remote Sens. 2005, 26, 4485–4498. [Google Scholar] [CrossRef]
- Yin, H.; Udelhoven, T.; Fensholt, R.; Pflugmacher, D.; Hostert, P. How normalized difference vegetation index (NDVI) trends from advanced very high resolution radiometer (AVHRR) and système probatoire d’observation de la terre vegetation (SPOT VGT) time series differ in agricultural areas: An inner mongolian case study. Remote Sens. 2012, 4, 3364–3389. [Google Scholar] [CrossRef] [Green Version]
- Hall, D.K.; Riggs, G.A.; Salomonson, V.V.; DiGirolamo, N.; Bayr, K.J. MODIS snow-cover products. Remote Sens. Environ. 2002, 83, 181–194. [Google Scholar] [CrossRef] [Green Version]
- Hall, D.K.; Riggs, G.A. Accuracy assessment of the MODIS snow products. Hydrol. Process. 2007, 21, 1534–1547. [Google Scholar] [CrossRef]
- Lillesand, T.; Kiefer, R.W.; Chipman, J. Remote Sensing and Image Interpretation, 7th ed.; Wiley: Hoboken, NJ, USA, 2015. [Google Scholar]
- Çelik, M.A.; Karabulut, M. Ahır dağı (Kahramanmaraş) ve çevresinde bitki örtüsü ile yağış koşulları arasındaki ilişkilerin modis verileri kullanılarak incelenmesi (2000–2010) (Examining the relationships between vegetation and precipitation conditions in Ahır Mountain (Kahramanmara). Havacılık Uzay Teknol. Derg. 2013, 1, 123–133. [Google Scholar]
- Beck, H.E.; McVicar, T.; Van Dijk, A.; Schellekens, J.; de Jeu, R.A.; Bruijnzeel, L.A. Global evaluation of four AVHRR–NDVI data sets: Intercomparison and assessment against Landsat imagery. Remote Sens. Environ. 2011, 115, 2547–2563. [Google Scholar] [CrossRef]
- Nayak, R.K.; Mishra, N.; Dadhwal, V.K.; Patel, N.R.; Salim, M.; Rao, K.H.; Dutt, C.B.S. Assessing the consistency between AVHRR and MODIS NDVI datasets for estimating terrestrial net primary productivity over India. J. Earth Syst. Sci. 2016, 125, 1189–1204. [Google Scholar] [CrossRef] [Green Version]
- Jain, S.K.; Keshri, R.; Goswami, A.; Sarkar, A. Application of meteorological and vegetation indices for evaluation of drought impact: A case study for Rajasthan, India. Nat. Hazards 2010, 54, 643–656. [Google Scholar] [CrossRef]
- Domenikiotis, C.; Spiliotopoulos, M.; Tsiros, E.; Dalezios, N.R. Early cotton yield assessment by the use of the NOAA/AVHRR derived Vegetation Condition Index (VCI) in Greece. Int. J. Remote Sens. 2004, 25, 2807–2819. [Google Scholar] [CrossRef]
- Dikici, M.; Aksel, M. Comparison of SPI, SPEI and SRI Drought Indices for Seyhan Basin. Int. J. Electron. Mech. Mechatron. Eng. 2019, 9, 1751–1762. [Google Scholar]
Figure 1.
Seyhan Basin in Turkey (Google Earth).

Figure 2.
Satellite-based time series for the Seyhan Basin: (a) NDVI index; (b) NDVI anomaly for the period 1982–2017; (c) long-term NDVI index average per month.
Figure 2.
Satellite-based time series for the Seyhan Basin: (a) NDVI index; (b) NDVI anomaly for the period 1982–2017; (c) long-term NDVI index average per month.

Figure 3.
VCI index for the Seyhan Basin using (a) MODIS satellite data for the 2001–2016 period and (b) AVHRR satellite data for the 1982–2015 period.
Figure 3.
VCI index for the Seyhan Basin using (a) MODIS satellite data for the 2001–2016 period and (b) AVHRR satellite data for the 1982–2015 period.

Figure 4.
CORINE layers: (a) AVHRR-3G, (b) MODIS, and (c) original used in the NDVI comparison of the Seyhan Basin.
Figure 4.
CORINE layers: (a) AVHRR-3G, (b) MODIS, and (c) original used in the NDVI comparison of the Seyhan Basin.

Figure 5.
Temporal change of the NDVI value calculated for natural vegetation, coded CORINE 243, in the Seyhan Basin.
Figure 5.
Temporal change of the NDVI value calculated for natural vegetation, coded CORINE 243, in the Seyhan Basin.

Figure 6.
Temporal change of the NDVI values calculated for plant-change areas, coded CORINE 324, in the Seyhan Basin.
Figure 6.
Temporal change of the NDVI values calculated for plant-change areas, coded CORINE 324, in the Seyhan Basin.

Figure 7.
The comparison of SPEI12, SPI12, SRI12, and DI of the Seyhan Basin (12 months) [72].
Figure 7.
The comparison of SPEI12, SPI12, SRI12, and DI of the Seyhan Basin (12 months) [72].

Figure 8.
Comparison of the Seyhan Basin MODIS VCI and AVHRR-3G VCI.

Figure 9.
Comparison of the correlation coefficients of the Seyhan Basin MODIS NDVI and other drought indices.
Figure 9.
Comparison of the correlation coefficients of the Seyhan Basin MODIS NDVI and other drought indices.

Figure 10.
Comparison of correlation coefficients of the MODIS VCI and other drought indices in the Seyhan Basin.
Figure 10.
Comparison of correlation coefficients of the MODIS VCI and other drought indices in the Seyhan Basin.


Table 1.
Variables used in drought detection [11].
Table 1.
Variables used in drought detection [11].
| Scope of Variable | Variables |
|---|---|
| Climatic | Temperature, relative humidity, evaporation, evapotranspiration, solar radiation, (wind, etc.), snow cover and thickness, precipitation |
| Hydrological/hydrogeological | Groundwater level, reserve exchange, reservoir, lake and dam level values, precipitation, streamflow |
| Geotechnical | Soil properties and soil (field capacity, the water-holding capacity of the soil or beneficial soil water content, etc.) |
| Agricultural | Vegetation types and characteristics |
| Other | Remote sensing (satellite products, etc.), seasonal and long-term model predictions |
Table 2.
Drought classification and threshold values used for the Seyhan Basin.
| VCI | Drought Classes | |
|---|---|---|
| >37.5 | No drought—normal/humid | |
| 25–37.5 | Mild drought | |
| 12.5–25 | Moderately severe drought | |
| 0–12.5 | Severe drought | |
Table 3.
Layers of the Seyhan Basin examined for CORINE NDVI comparison.
| Main Cod | Sub Cod | Explanation | Main Cod | Sub Cod | Explanation |
|---|---|---|---|---|---|
| 2—Agricultural areas | 223 | Olive groves | 3—Forest and semi-natural areas | 311 | Broadleaf forests |
| 231 | Pastures | 312 | Coniferous forests | ||
| 243 | Natural vegetationFound agricultural area | 313 | Mixed forests | ||
| 2421 | Non-irrigated mixed agricultural area | 321 | Natural meadows | ||
| 323 | Sclerophyll vegetation | ||||
| 324 | Plant change areas | ||||
| 333 | Sparse plant areas | ||||
Publisher’s Note: MDPI stays neutral with regard to jurisdictional claims in published maps and institutional affiliations. |
© 2022 by the author. Licensee MDPI, Basel, Switzerland. This article is an open access article distributed under the terms and conditions of the Creative Commons Attribution (CC BY) license (https://creativecommons.org/licenses/by/4.0/).
Share and Cite
MDPI and ACS Style
Dikici, M. Drought Analysis for the Seyhan Basin with Vegetation Indices and Comparison with Meteorological Different Indices. Sustainability 2022, 14, 4464. https://0-doi-org.brum.beds.ac.uk/10.3390/su14084464
AMA Style
Dikici M. Drought Analysis for the Seyhan Basin with Vegetation Indices and Comparison with Meteorological Different Indices. Sustainability. 2022; 14(8):4464. https://0-doi-org.brum.beds.ac.uk/10.3390/su14084464
Chicago/Turabian StyleDikici, Mehmet. 2022. "Drought Analysis for the Seyhan Basin with Vegetation Indices and Comparison with Meteorological Different Indices" Sustainability 14, no. 8: 4464. https://0-doi-org.brum.beds.ac.uk/10.3390/su14084464
Note that from the first issue of 2016, this journal uses article numbers instead of page numbers. See further details here.