Article

The Effects of Health Crisis on Economic Growth, Health and Movement of Population

by
Constantin Anghelache
1,2,
Mădălina-Gabriela Anghel
2,*,
Ștefan Virgil Iacob
2,3,*,
Mirela Panait
3,
Irina Gabriela Rădulescu
3,
Alina Gabriela Brezoi
3 and
Adrian Miron
4,5
1
Department of Statistics and Econometrics, Bucharest University of Economic Studies, 6 Piata Romana, 1st District, 010374 Bucharest, Romania
2
Finance and Accounting Department, “Artifex” University of Bucharest, 47 Economu Cezărescu Street, 6st District, 060754 Bucharest, Romania
3
Faculty of Economic Sciences, Petroleum-Gas University of Ploieşti, 39 Bucharest Boulevard, 100680 Ploieşti, Romania
4
Elias Surgery Clinic, 17 Marasti Boulevard, 011461 Bucharest, Romania
5
Department 10—General Surgery, Faculty of Medicine, “Carol Davila” University of Medicine and Pharmacy, 8 Eroii Sanitari Boulevard, 02002 Bucharest, Romania
*
Authors to whom correspondence should be addressed.
Sustainability 2022, 14(8), 4613; https://0-doi-org.brum.beds.ac.uk/10.3390/su14084613
Submission received: 8 February 2022 / Revised: 3 March 2022 / Accepted: 7 March 2022 / Published: 12 April 2022

Abstract

:
The COVID-19 pandemic crisis, which was triggered in 2019 with oscillating evolution in 2020 and 2021, was a factor that has had dramatic effects on the economic growth of countries worldwide. In the context of the pandemic crisis, population health has deteriorated; education and economic activity in all the countries around the world have been affected. The main purpose of this paper is to highlight the special situations that humanity is experiencing as a result of the unprecedented effects that the COVID-19 crisis is having on the socioeconomic evolution. Specific statistical econometric methods (such as analysis of linear correlations, multiple linear regression, analysis based on dynamics indicators, and spectral analysis, comparability based on indices) were applied to highlight the evolution and future prospects of the COVID-19 virus worldwide. The COVID-19 crisis has generated another major issue for mankind, along with global warming and the energy transition, namely, population health. For this reason, in this study, we focused on the impact of the COVID-19 crisis on population health in a broader context; the sustained growth of populations in developing countries and aging populations in developed economies.

1. Introduction

The COVID-19 crisis has generated multiple negative economic, social, and environmental consequences [1,2,3,4,5,6,7,8,9,10,11], but also opportunities that have been or may be exploited [12,13,14]. In general, economic and social conditions as well as hospital capacity are particularly delicate, and worsening economic situations reduce the possibility of investing in this precarious field, which must be a priority in every country. The consequences of the COVID-19 crisis have influenced population evolution and the state of health, but, especially, the situation of incomes that will continue to decrease, and as the standard of living becomes lower and lower, the need for financing increases. In contrast with other global events, the pandemic crisis is causing market reactions, resulting in the COVID-19 pandemic having a direct impact [15,16]. Therefore, specific cooperative levers should be found, both at the European and international levels, to actively increase the level of income available to populations. The prospect of a rampant evolution of inflation, which determines the reduction in real incomes available to a population is a concern for public authorities but also for researchers around the world.
In this article, we analyze the economic evolution in the EU countries as well as globally, taking into consideration the prolonged effects implied by the health and economic-financial crisis. We focus on population trends; the current demographic conditions indicating increased population growth in the poorest countries, especially in Africa and Asia, and a decrease in the population growth in European and North American countries due to different fertility rates. Researchers have predicted a population growth of up to 10 billion people by 2050, which will have negative effects on the general situation and living standards of people, due to a drastic limitation of resources [17].
Some medical studies have shown that Covid 19 may have a negative effect on fertility, but vaccination may help to reduce this effect [18,19].
Studies on the causes of death worldwide have had a significant effect on the disruption of economic and social activities, with an effect in reducing the results obtained. The methodology used also includes some statistical-econometric models that can be improved in the next period [20]. Some studies point out that the sustainability of the economic recovery following the COVID-19 pandemic requires accelerating vaccinations to save lives and prevent the crisis from deepening in the economy. Delayed immunization also has negative effects [21].
The general expenditures of the global population as well as in some countries were analysed, taking into consideration the influence of the status of water resources, environmental degradation, etc., which are factors that have a negative effect on population health. This research was conducted on the following two levels to capture the detailed effects of the COVID-19 crisis on demographic situations and economic growth: (1) An investigation of the demographics of the world’s population indicators reveals different situations having negative effects on population growth in the poorest countries and the population decline in the European and North American countries, due to this pandemic (health) crisis. (2) An analysis of the negative effects that the pandemic crisis will have on economic growth in the future.
The article is organized into sections. In the Introduction section, the motivation for the choice of this topic is explained and, in the Literature Review section, we present the results of the most important scientific studies that have addressed similar issues.

2. Literature Review

The pandemic crisis has had many negative economic and social effects, which is why scientific studies have focused either on the impact of the crisis on the economic and social situation in certain countries or regions or on certain areas of activity or markets. Some researchers are concerned about the effects that COVID-19 has on the financial markets, considering the impact of the decrease of the economic activity on the different financial segments [22,23,24,25,26]. Some papers are aiming in the same direction, but being more focused on financial risk management in business, economics and finance under the conditions of the rising COVID-19 crisis [27,28]. Other researchers investigated the effect of the COVID-19 pandemic on global economic activity, the stock market and the energy sector, [20,29].
Other studies aimed to the strategy of the European Union to mitigate and eliminate various situations affecting the population in some countries [17]. The socio-economic impact of the Covid crisis were analysed on various levels related to unemployment, labour productivity, social spacing out [30,31,32]. Some researchers referred to the results of labour productivity in a continuously aging society [33]. Issues related to Gross Domestic Product, real incomes and living standards of the population were addressed and a number of issues related to renewable energy sources were analysed [34,35]. Others focused on the capacities of selected European countries to cope with the potential economic crisis caused by COVID-19, analysing selected indicators on European countries’ GDP and using a linear regression to identify significant policies meant to eliminate the potential negative consequences for economic growth [36,37].The issue of wages and unemployment was addressed according to the income obtained, both the general situation in the community and the concordance between the size of the projected income and the migration decision as well as the influence of inflation [38,39,40,41]. Issues related to the European Demographic Strategy within the European Union was also addressed and the main reasons for the temporary disruption and response of the government to this major public health crisis in combination with the development of the COVID-19 crisis were discussed [42,43].
Another work is aiming to identify a triage system for national public-private partnership programs based on five categories: projects without the need for economic incentive, projects that have suffered minor economic/financial losses, projects that require temporary support/stop or restructuring, projects that cannot survive without significant economic aid and projects that cannot survive, even with government intervention [44].
The relationship between the spread of globalization and the mortality rate (CFR) of 2019 coronavirus disease (COVID-19) calculated on 28 July 2020 in over 150 countries was also examined [45,46]. A study looked at the process of convergence between EU economies over the period 2004–2020 and at how the differences between EU Member States during the 2020 pandemic crisis and the 2008 global economic crisis were compared [47].
Some authors have focused on the economic impact of the COVID-19 pandemic on the Asian economies, while others have been concerned with assessing the economic and environmental impact of the COVID-19 pandemic on the specific countries or industries [48,49,50,51,52,53].
Some authors point out that although COVID-19 has become a priority for many health systems in developing countries, they still have to deal with many other existing diseases, such as malaria, yellow fever and others, and the study shows that strong concerns about the COVID-19 approach disrupt other disease prevention programs [54].
Detailed studies of the impact of the SARS-CoV-2 (COVID-19) pandemic crisis on the European economy were identified [55]. The evolution of the coronavirus pandemic was analysed and the impacts and strategies that have been implemented in previous crises were reviewed mainly those that have affected the hotel industry, selecting Spain in view of the importance of tourism for this country and of the importance of Spain as a leader in international tourist destinations [56].

3. Methodology

The study is based on researching up-to-date data from around the world up to 6 January 2022. As a result, it was found out that a number of states have allocated a low level of their annual budgets for education, health, research, innovation and invention.
Making a retrospective approach on the evolution of this virus, COVID-19 (coronavirus), it is noticed that the strains from which it developed are old (Ebola, SARS and others), evolving rapidly, alarmingly and with the impossibility to ensure at the right time, the stopping and elimination of the spread.
A series of statistical-mathematical and econometric methods were used, processing the data provided by the information offered by Real-time world statistics. The methods of indices, dynamic and structural series were used, and the data in the text were processed by statistical-econometric methods, such as analysis of linear correlations, multiple linear regression, analysis based on dynamics indicators, spectral analysis, comparability based on indices. The main topic of the research is the concern to identify the way in which the COVID-19 pandemic acts on the national framework, causing the economic results to be affected, with an immediate influence on the quality of life. In this regard, a study examined the role of technological innovation and business data analysis of some companies during COVID-19, based on a questionnaire. The data were processed using covariance-based structural equations. The study highlighted that the companies with the most extraordinary technological production processes were the least affected during COVID-19 [8]. At the same time, other authors examined the possibility of examining the relationship between the spread of globalization and the mortality rate as a result of COVID-19 calculated for a significant number of countries. The result of using the linear regression method has shown that countries with higher levels of socio-economic globalization are exposed to higher levels than the critical case rate [45]. In international studies, some authors have used time series to estimate the strength of the impact of COVID-19 on each of the indicators analysed [55].
Methodologically, the databases were established, the information was collected centralized and presented in the form of tables and graphs meant to allow an easier way to analyse and interpret them. From official sources, those data that meet the proposed purpose were retained.
The synthesized data offered the possibility, after processing them by statistical methods, to draw up some conclusions. Based on the analyse performed, the perspective of the evolution of the population health, as well as the capacity of the states to provide the necessary framework to counteract and limit the effect of the pandemic Coronavirus 19 on the population were highlighted. The methods of comparison, indices, dynamic series and significance of the calculated econometric parameters completed the methodology used in the research conducted and the writing of this article.

4. Data, Results and Discussions

4.1. Analysis of the Demographic Situation and World Resources

The population of the globe at the time of writing this article counted for 7,918,417,083 people. The population growth as anticipated by international bodies specialized in demographic statistics, shows the fact that, in 2050 the world’s population will reach about 10 billion people. In Europe, the population will decline due to the declining female fertility. As of 6 January 2022, there were 2,111,019 births, which mean 191,734 daily births.
In the same period, 886,195 deaths were recorded, which means 80,586 deaths daily. The data are not entirely correlated, because in terms of daily deaths or births, we took the level recorded on 6 January 2022, so that, obviously, in each of the days following this moment, there was an oscillation of births and deaths. The data are structured in Table 1.
The majority of the population will be located in the Asian and African continents, where there are countries with fertility of 6–7 percentage points, compared with only 1.41 percentage points fertility in Europe. There will be increases in South and North America, decreases in Europe. It should be noted that the migration may affect the European population. Out of the Earth’s 10 billion inhabitants, more than 1,400,000,000 will be located in the African states.
Regarding the energy, the daily consumption counts for 234,422,900 kWh. From non-renewable sources, consumption is of 199,628,810 kWh per day and from renewable sources 35,331,680 kWh. The solar and wind energy will be on the upwarding path and will become one of the main sources of supplying the energy needs. The daily oil consumption counts for 48,295,700 barrels. The current reserves, without any prospecting resulting from the scientific research that will be carried out, are estimated as 1,451,162,677,530 barrels. In terms of current consumption, it turns out that these reserves will be able to cover the needs for 15,134 days, i.e., about 42 years. The natural gas reserves are currently at the level of 1,084,503,785,910 bep. These resources will be depleted in 57,079 days, approximately 158 years. The coal reserves, currently counting for 4,299,169,397,915 bep, indicate that the days remaining until their depletion would be 148,247 (see Table 2).
Regarding the water resources, until 6 January 2022, 6,206,590 litters of water were consumed. Deaths caused by some diseases that spread through water and its circuit in nature, so far, have raised to 12,705 people and in the same period, 787,570,636 people do not have access to drinking water. The data are presented in Table 3.
The evolution of the energy and water reserves is influenced by the human factor that causes substantial climate change. To argue this assessment, we specify that the losses of forested areas until 6 January 2022 counted for 78,489 ha every day. During the same period, 105,672 ha came out of the agricultural circuit, as a result of the improper use of these lands. The carbon dioxide emissions counted for 548,679,713 tons. The desertification of some lands, until 6 January 2022, registered 181,147 ha, a process that continues as a result of the reduction of the water reserves, as a result of the modification of the water circuit in nature, of the climatic alterations and other factors. A worrying element is the increase in toxic waste, which affects water, air and the environment in general. This waste amounted to 147,826 tons, until 6 January 2022. The analysed data are presented in Table 4.
At the national level, health, education and research are considered to be priority areas. Worldwide, $8,105,970,510 is spent on medical care, $5,483,371,514 is allocated daily for education and research. The amounts are unevenly distributed and many countries spend very little out of the Gross Domestic Product for health (development and modernization of hospitalization capacity, production of medicines, equipment, and so on). Globally, every day, $2,410,810,590 are spent on the military. These data are presented in Table 5.
As a result of the nourishment, there are currently 857,590,714 undernourished people. Globally, 1,721,207,081 people are underweight due to medical conditions, lack of food, food unrelated to the body’s needs. 799,747,750 of the people are obese, mostly due to medical causes. Every day, 15,750 people die worldwide due to hunger, i.e., lack of nutrition. Expenditure on obesity and overweight counts for $315,368,970 per day, while malnutrition avoidance counts for $97,510,730. This picture of nutrition is presented in figures using several indicators, which reveal the large discrepancies that exist around the world, but also the shocking limits that exist in terms of ensuring global help. The data are structured in Table 6.
Since we are still under the conditions of the great health crisis caused by Coronavirus, let’s show what the situation is be faced in the field of health, with an emphasis on using some indicators that reveal that in a way the new health crisis is more burdened by fear, although it must be treated with the utmost importance compared to other causes of death recorded worldwide. Thus, until 6 January 2022, there were 196,163 deaths due to communicable diseases. If we follow the last row of Table 7, we find that in the period 1 October 2019–6 January 2022, a number of 5,482,053 people died due to the COVID virus 19. It can be easily seen that the daily deaths due to contagious diseases are about 32,693, and those due to COVID-19 are about 7028 (slightly more than 4 times less).
This is a picture of the perspective of the evolution of humanity starting from today’s state of affairs. These are known elements, known by governments, leaders of international institutions in the field of health, research, innovation. There is no other choice but to minimize, eliminate, if possible, the destructive element in order to give a chance to the human survival.
In this regard, some authors have analysed the effect of the COVID-19 pandemic, which affects the whole world. The authors consider that its scope and economic dimensions mean that it poses a major threat to the achievement of the UN Sustainable Development Goals. In conclusion, he considers that the results obtained point out that, although COVID-19 has become a priority for many health systems in developing countries, they still have to deal with many other existing diseases, such as malaria, yellow fever. and others [54].

4.2. Analysis of the COVID-19 Pandemic Regarding the Evolution Perspective and the Effect on the Population Movement and Health

In order to understand more clearly the situation of the future evolution of this wave 4 of Corona Virus and after that, a stop-frame at a certain moment was carried out in order to draw up some conclusions about what can be carried out to foresee in the future, what should have been carried out or at least should be carried out from now on. This brief analysis was made because the Corona Virus-19 pandemic has caused the economic and financial crisis, which will evolve in the same direction and at the same pace in the next period. Thus, research highlights the potential economic impact of the COVID-19 pandemic on South Asian economies, using a systematic review approach. In this context, we study the cause-effect relationship that led to the outbreak of COVID-19, which slowed the evolution of gross domestic product, along with the evolution of major sectors and economic indicators [48].
Returning, it must be specified that on 4 October 2021, and 19 January 2022, respectively, there were 223 or 224 states, regions or territories in the world that were and are affected by the Corona Virus pandemic. In this context, the evolution so far on this stop-frame sheet shows that, on 4 October 2021, only 33 countries, regions and territories still registered active infections and only 26 countries recorded daily deaths. As of 19 January 2022, 80 countries, regions and territories were still experiencing active infections, and 60 countries were experiencing daily deaths.
On the three indicators presented at this moment, it could be concluded that no matter how dangerous this fourth wave of the Corona Virus pandemic is, it does not seem to act similarly in all the states of the world.
Taking in account the WHO table and update it on the 224 states, regions and territories, it must be noted that in more than 80% of them, an insignificant number of people is registered during this crisis as infected and, moreover, as deaths. On the other hand, in a number of states with a very large population in which this crisis has had effects, due to a current strategy, modified each time according to the evolution, infections and deaths have been at least tempered if not reduced. In the final part of this analysis, on the basis of accurate data, the strategy of the states that have suffered the most because of this pandemic crisis was analysed.
Given that at the time of this analysis, the corona virus has reached stage 5 omicron, very virulent in terms of spread/infection, we will compare data from the same source, data from 4 October 2021 and 19 January 2022. To note the dramatic evolution of the number of infections, but the conclusion is that it manifests itself in mild forms.
From the onset of the pandemic, to the data specified above, on 4 October 2021, respectively, 19 January 2022, the total number of infections worldwide was 235,765,336, respectively, 335,840,617 cases (persons). At the time of the analysis, it turned out that, on average, there were 81,870 and, respectively, 649,781 infections with the mentioned virus in the world.
The number of deaths recorded worldwide on 4 October 2021 was 4,817,196, respectively, 5,575,724 people who died on 19 January 2022, specifying that it was mentioned in the context of Corona Virus, which leads to the conclusion that the deceased had other co-morbidities. At the time of the analysis, one-day deaths worldwide counted for 2684.
At the same time, it turns out that the number of the infected and cured patients was 212,636,735 on 4 October 2021, respectively, 271,483,390 people on 19 January 2022. On average, in a single day since the onset of this crisis, 71,847 people were recovered by healing, following the treatment used, per day on 4 October 2021, respectively, 528,286 people per day on 19 January 2022. As of 4 October 2021, and 19 January 2022, there were 18,318,305 and, respectively, 58,781,503 active cases worldwide, of which 86,886 and 61,113, respectively, were in critical condition, requiring treatment and special attention.
The cases of infected people per 1 million inhabitants were on 4 October 2021 of 30,247.5 cases, and on 19 January 2022 of 43,085 cases. There were 618 deaths per 1 million inhabitants in the world on 4 October 2021, and 715 on 19 January 2022, respectively.
From this point of view, despite the totally alarming situation in some European countries, but especially in Romania, taken as an example, the situation is much more alarming. It is said that these waves, which also have a baptismal name, are built in connection with the situation that exists in a certain geographical area, often identifiable with a country. This is how the Indian virus, the South African virus, the Delta virus and finally the omicron variant were launched.
To understand how Corona Virus has acted and continues to operate around the globe, we have selected a total of 18 of the 224 states, regions and territories.
The data are presented in the Table 8 and Table 9 on 4 October 2021 and on 19 January 2022 and from here we can deduce which was and must be the strategy to follow, at least from now on. We will also find, by comparison, the rate of spread/infection in wave 5 omicron.
Comparing the indicators from the two Table 8 and Table 9, at the time of data collection for 
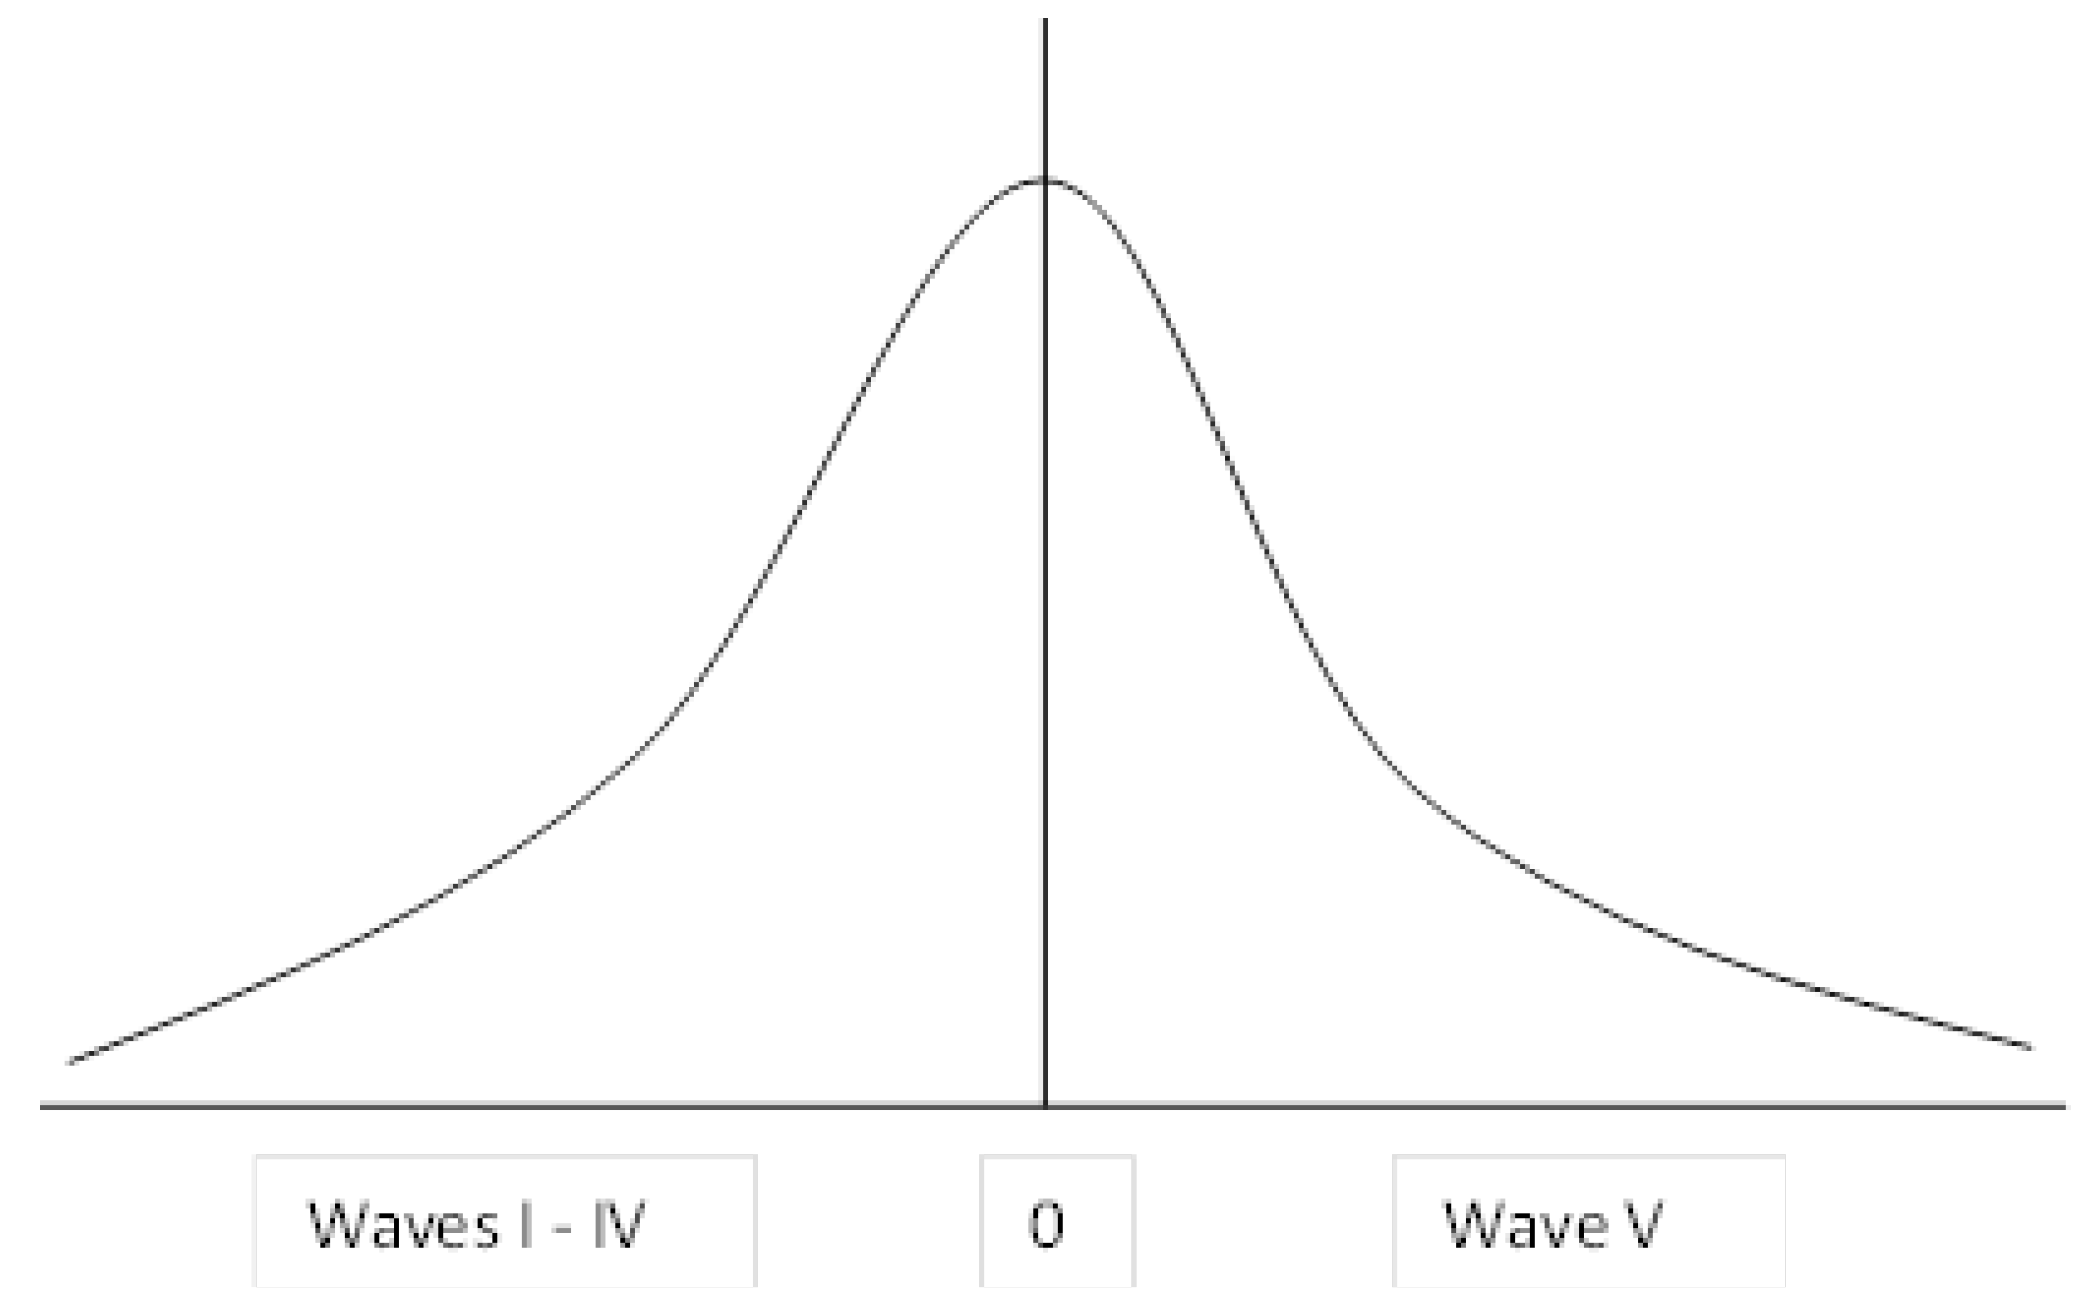
Table 9, mankind was in the fifth wave of COVID-19, omicron, and the data reveals the following aspect: the total infections increased, in some states doubled; the total number of deaths did not follow the same pace, the decrease of this indicator being obvious. The same comparison can be made for the active and critical case indicators. In wave V, omicron, the number of active cases increased a lot due to the high level of infections, while the number of critical cases increased slightly, remained at the same level or even decreased.
In this context, it is confirmed that this fifth wave of COVID-19 is the inflection point pick from which the serious infections will be reduced, although the level of mild infections will continue. In a study, the authors point out that public health crises are the cornerstone of testing the governance capacity of public health crises in the states of the world [43].
It can be anticipated that the evolution of COVID-19 follows the Poisson curve, i.e., the two branches, ascending and descending, are symmetrical. These issues are shown in Figure 1.
As a strategy, it is clear that the number one basic element is the population testing. Given the high impoverishment of the population in most countries of the world, with a high percentage of people living in absolute poverty, this test should be carried out free of charge. This is not impossible as long as these tests can be distributed throughout the country. Performing fast, complete and repeated testing can identify all the infected people to whom the 14-day isolation is applied under monitoring and ensures the necessary treatment free of charge. The testing and treatment should be carried out completely and free of charge and no pressure would have been required for citizens to be tested. This must be the main point of the strategy to be followed.
Then, there is the second factor to come, simultaneously with the first one, the vaccination. Vaccination is also free of charge. The evolution of the infection shows that those who are vaccinated can become infected and transmit the virus, but for them the forms are very mild and usually do not require hospitalization, but only a short period of quarantine and appropriate treatment. The deaths, for the most part, are associated with SARS CoV 2, which means that probably most of those who died had other co-morbidities that, directly or indirectly, were also stimulated by Corona Virus infection. When the entire population of a country, territory or land is vaccinated, it can certainly be said that the green card makes sense because everyone can be infected, transmitting to others, but being vaccinated, they are bearing the disease as one of a light shape.
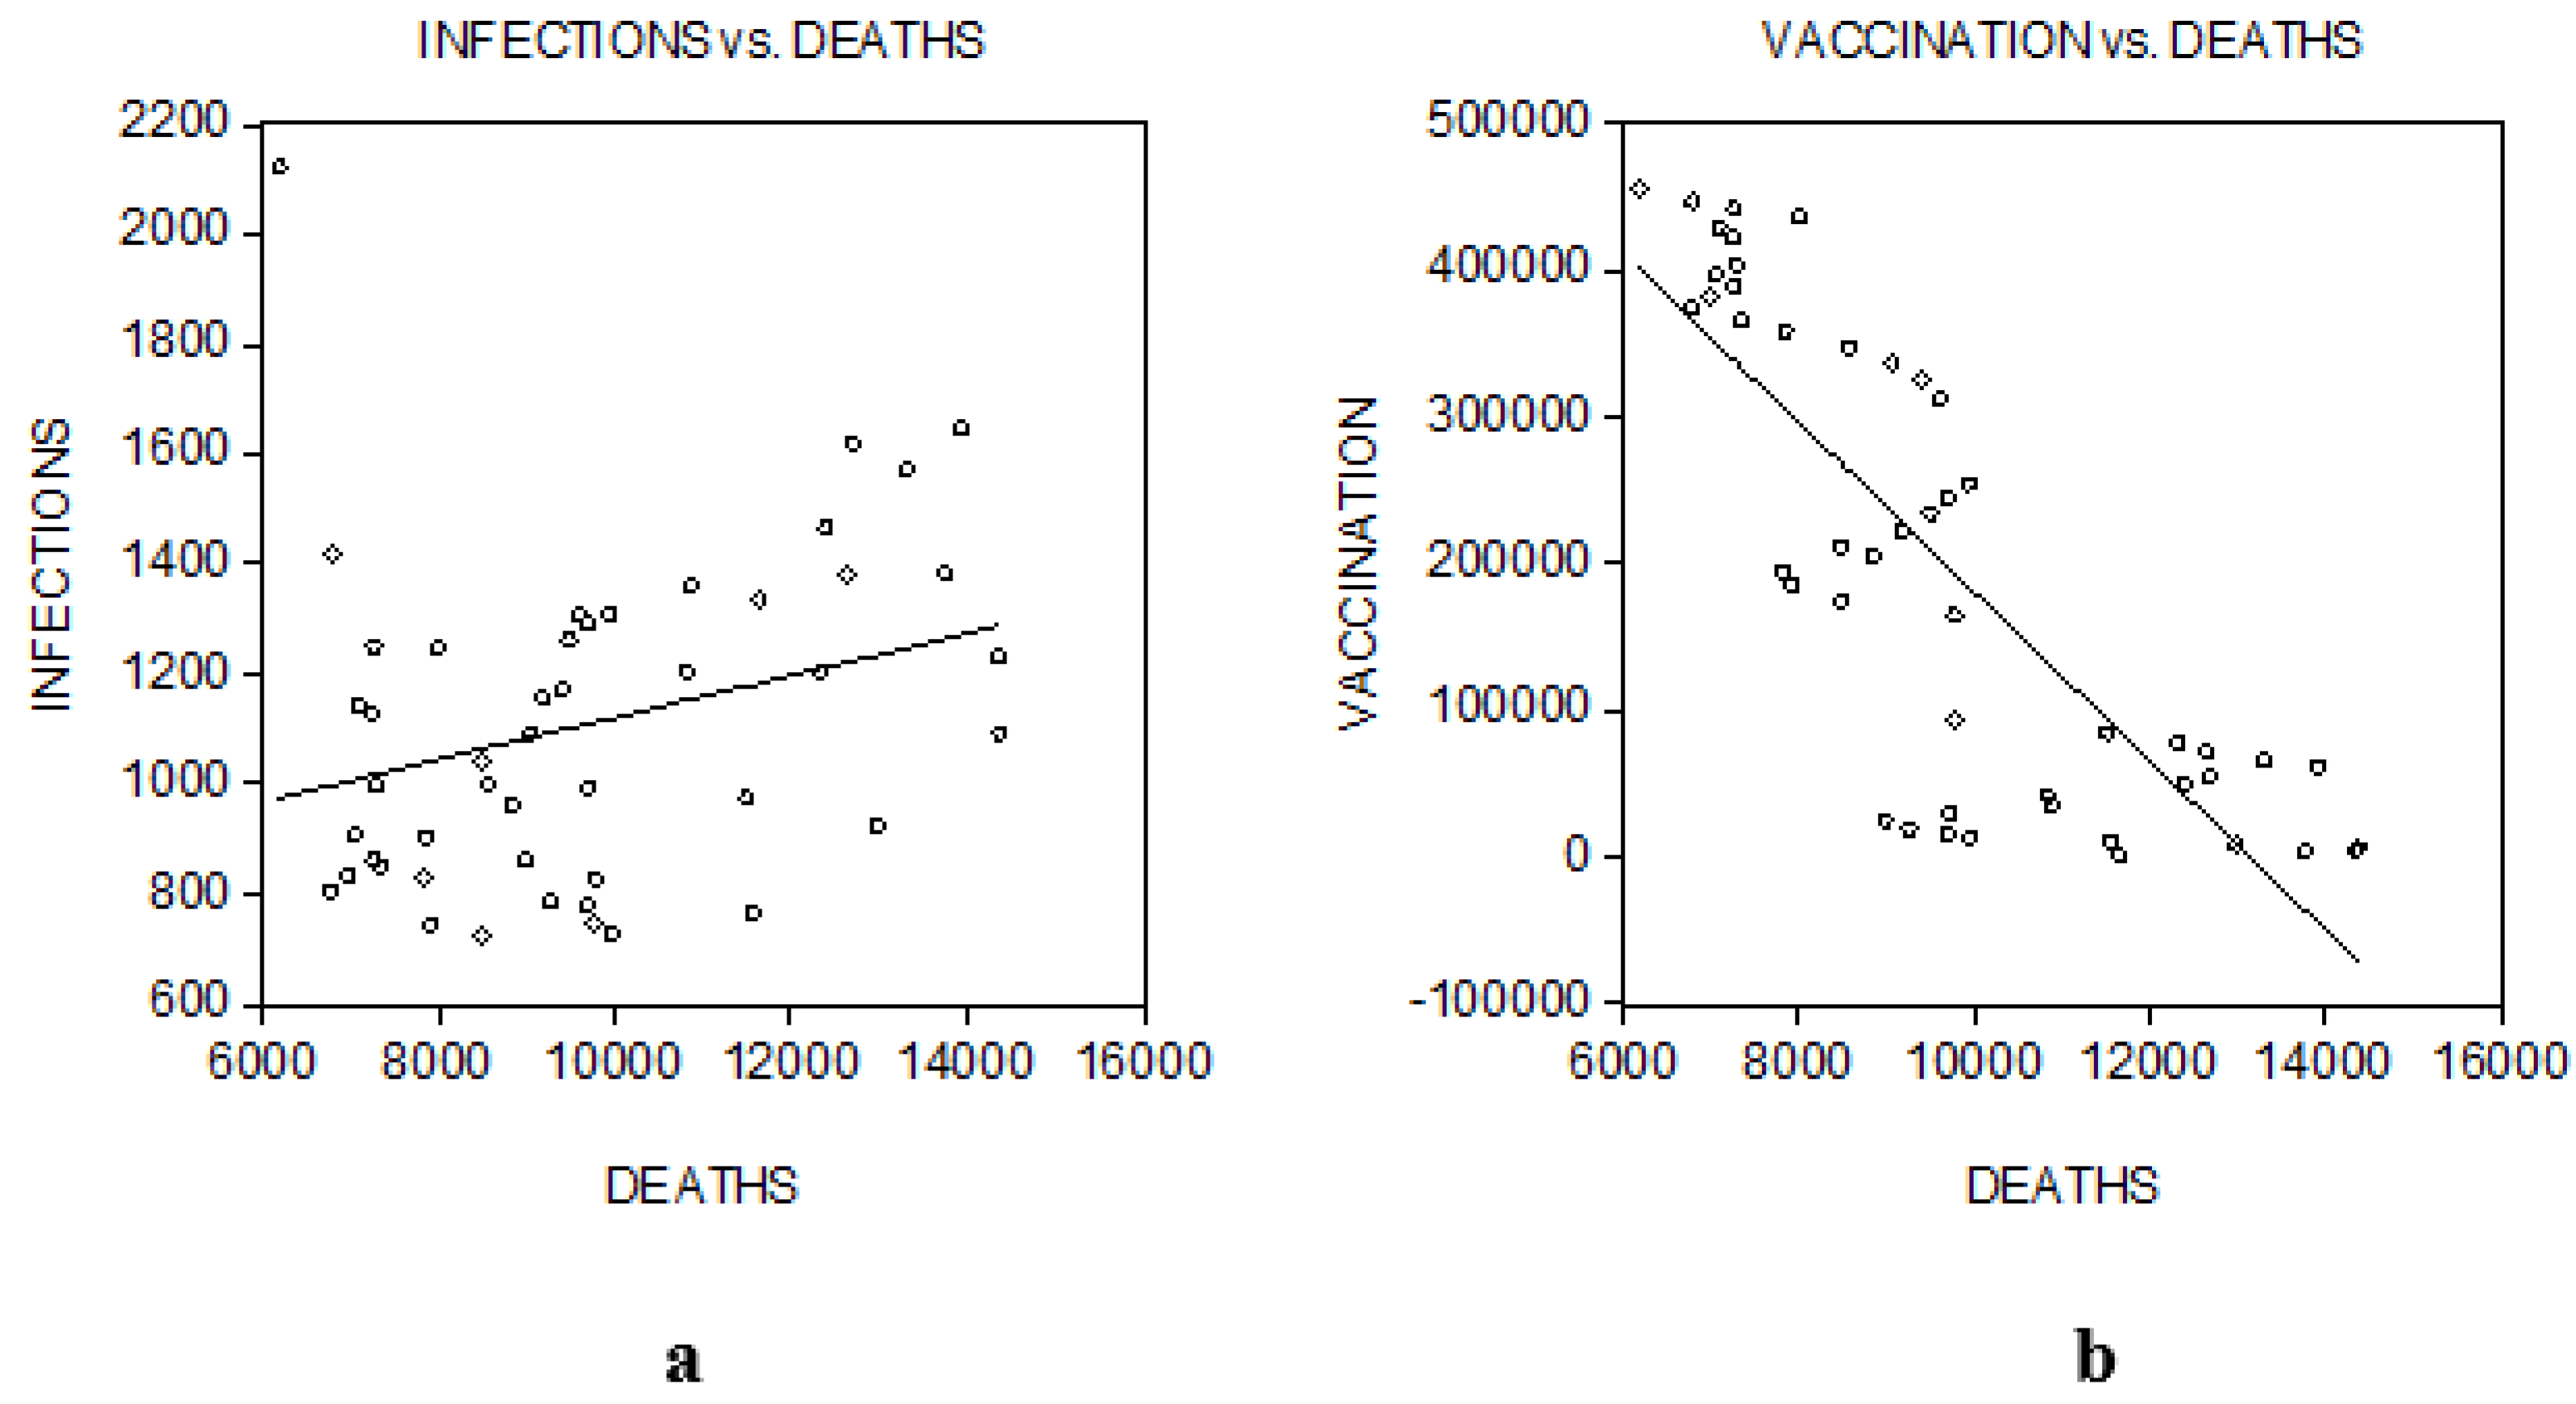
In order to confirm the above, weekly data were collected, sorted and analysed to reflect the evolution of deaths caused by COVID-19, the number of infected people and the number of vaccinated people between 1 January 2021–1 January 2022. Thus, the correlation between the deaths caused by COVID-19, the number of infected persons and the number of vaccinated persons in the mentioned period is presented in the following graphs.
The graphs bellow (Figure 2a,b) show that there is a linear correlation between each of the two indicators analysed. In this respect, in order to accept the linearity hypothesis, the coefficient of linear correlation between the deaths caused by COVID-19 and the number of infected persons, will be calculated, according to the relation:
r D / I = c o v D , I σ D · σ I = D 48 D ¯ ( I 48 I ¯ ) 48 · σ D · σ I
where: D represents the number of deceased persons
I represents the number of infections,
σ D = D t D 2 48   ș i   σ I = I t I ¯ 2 48
After performing the calculations, we acquire r D / I = 0.95 , value close to the upper limit of the range [–1, 1], which confirms that there is a strong linear correlation between the two variables. Following the same reasoning, it was found that in the case of the correlation between the deaths caused by COVID-19 and vaccination, there is a linear correlation, the correlation coefficient having the value of 0.56. Based on these results the analysis using the multiple shape linear regression models can be extended:
D = a + b · I + c · V + ε
where:
D (deaths) is the dependent variable;
I (infections) is the independent variable;
V (vaccinations) is the independent variable;
a ,   b   and   c are the regression parameters;
ε represents the residual variable
The point cloud described by the values recorded by the studied indicators is concentrated around a straight line, which allows the continuation of the study using the single or multiple linear regression model.
Both estimating the parameters of the regression equation using the least squares method and testing the significance of the model were carried out using the EViews statistical-econometric analysis program, and the results are shown in the Table 10:
Interpreting the obtained results, it can be concluded that the model is a valid one, fact confirmed by the statistical tests F-statistic and t-Statistic which values are superior to the tabulate (Fc = 78.77 > Ft = 1.96 and tc = 4.75, respectively, 11.82 > tt = 2.84). In addition, the correlation coefficient R-squared = 0.77, confirms the strong correlation that exists between the three variables under study. Thus, we can estimate the theoretical values of the dependent variable, according to the relation:
D ^ = 9148.719 + 2.596119 · I ^ 0.011769 · V ^ + ε
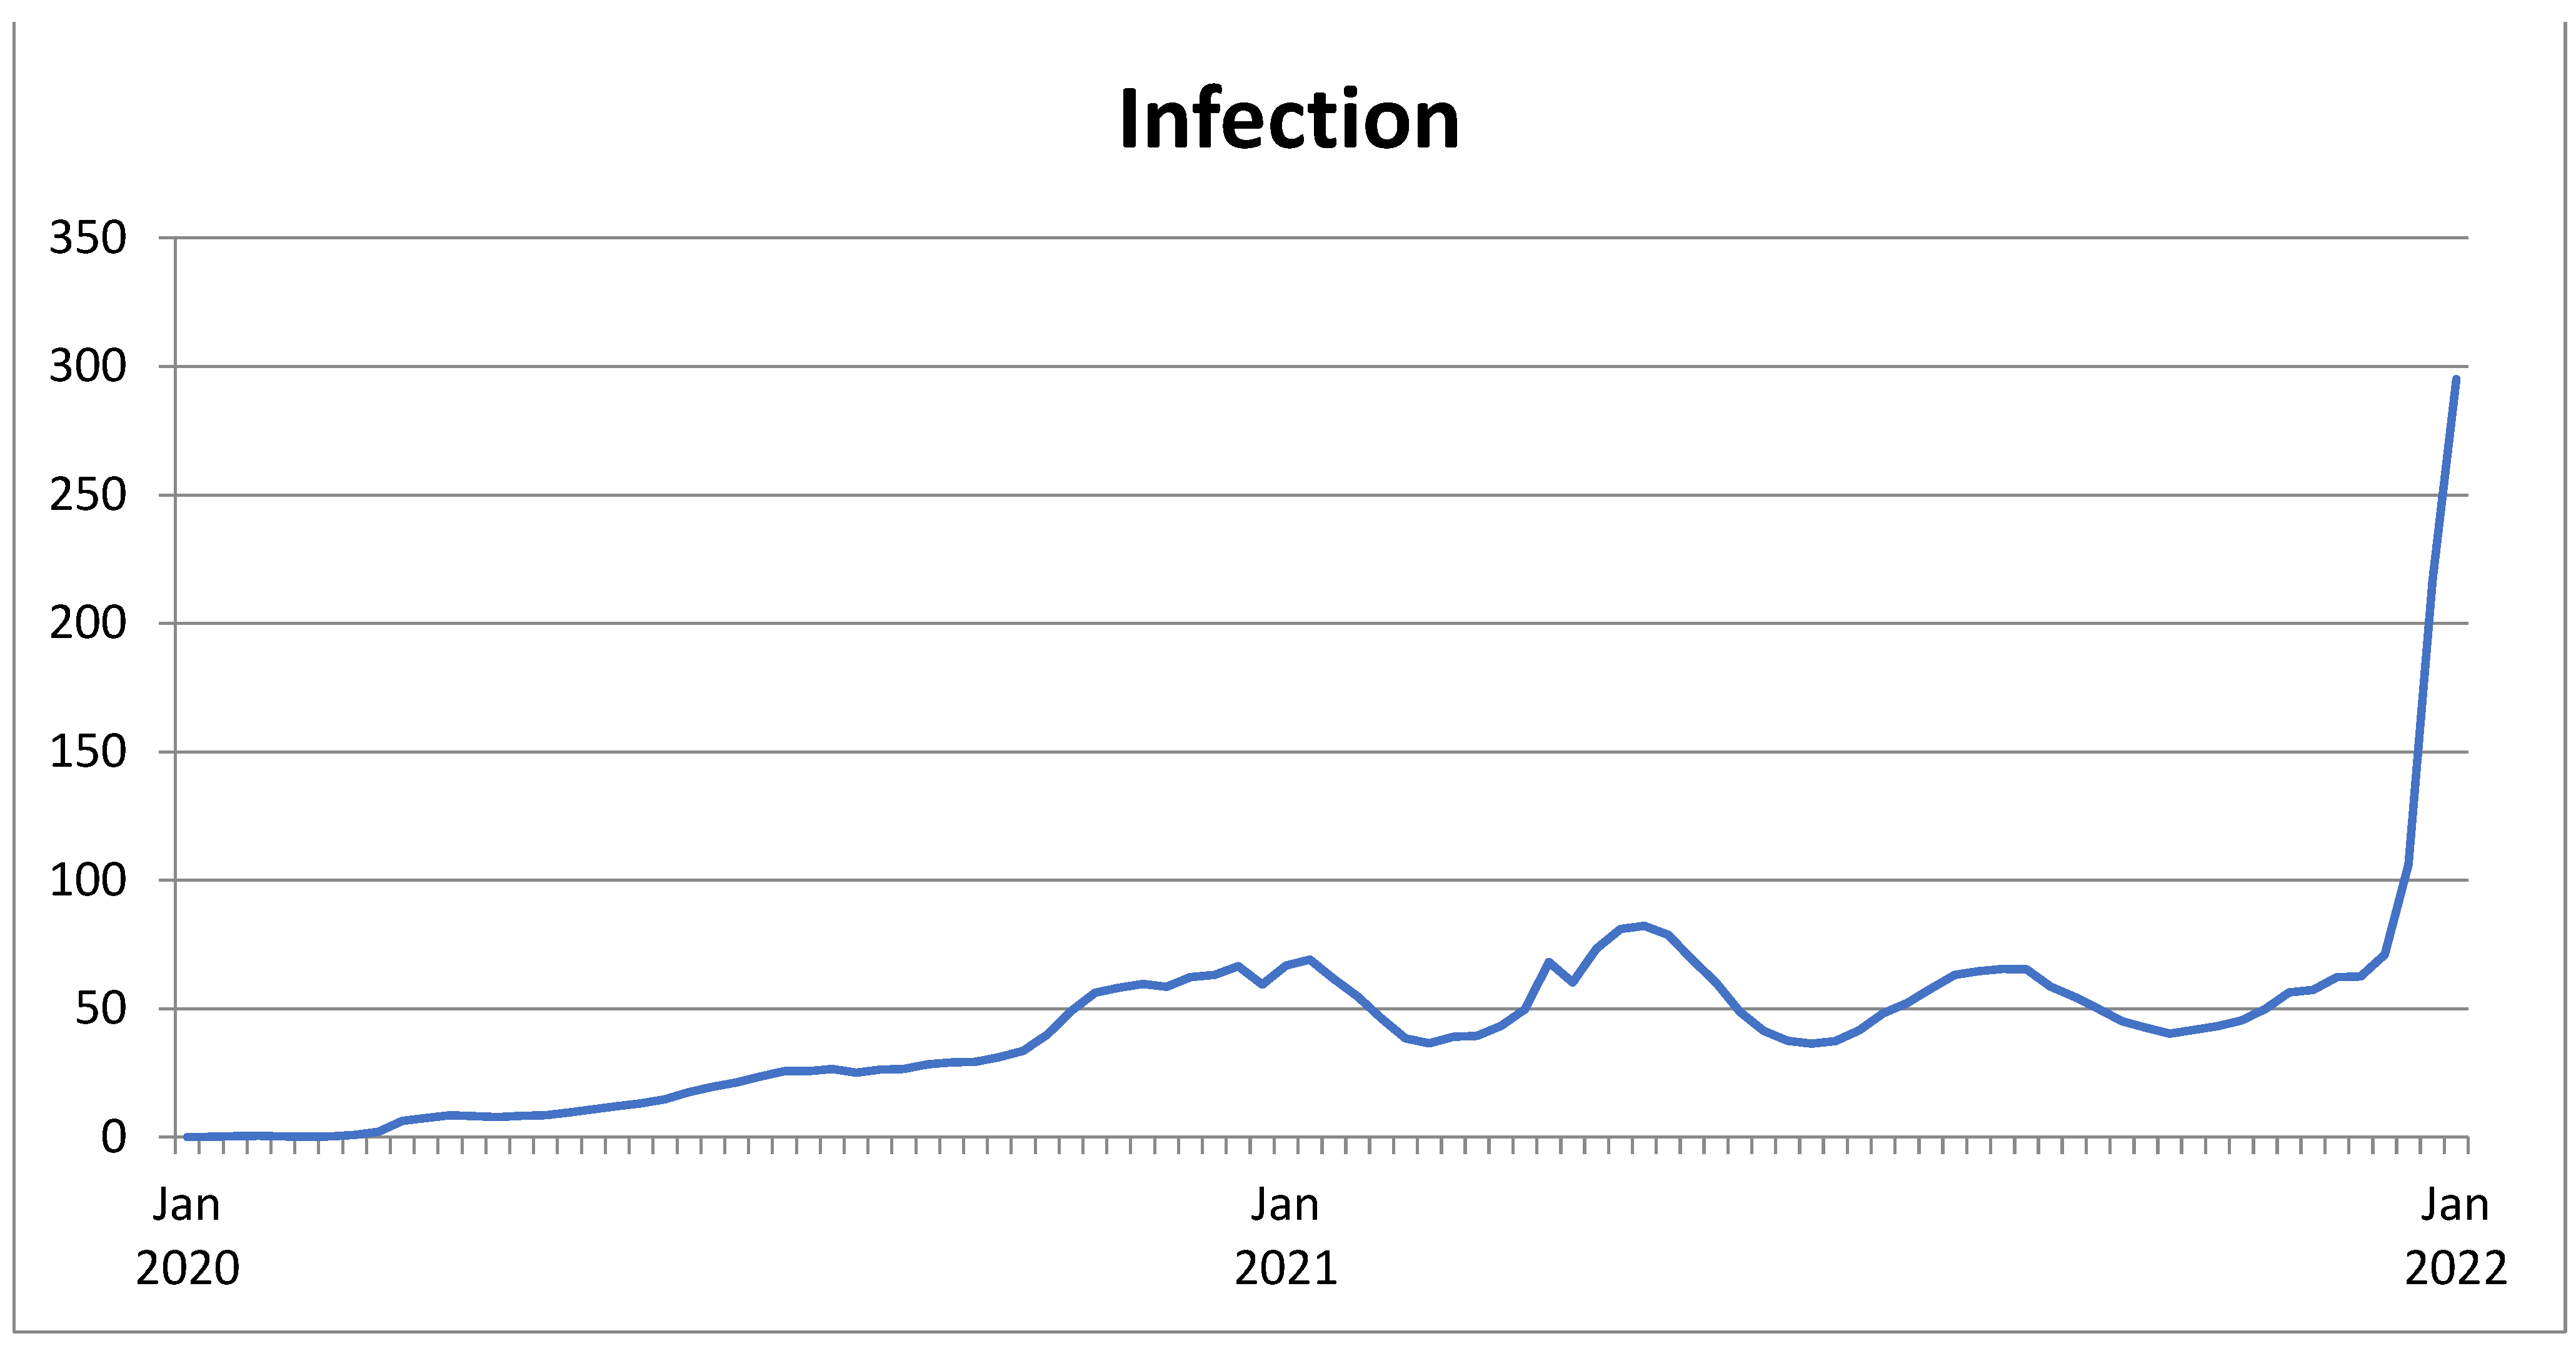
Based on the calculated parameters we can conclude that an influence on deaths caused by COVID-19 has the number of virus infections, and vaccinations have the effect we expected, in the sense that the coefficient of the factorial variable has the minus meaning, which confirms the inverse-proportional effect on this variable, i.e., confirms that the more vaccinated people, even if the number of infections increases, the number of deaths does not have the same trend and may stagnate or even decrease, as happens in this period of the V wave (December 2021–January 2022).
The evolution of COVID-19 infections in the period January 2020–January 2022 is presented in Figure 3.
Based on the data collected and presented graphically, an analysis from a spectral point of view regarding the evolution of COVID-19 infections between January 2020 and January 2022 was performed. Thus, an oscillating evolution determined by a chronological numerical sequence with more than sixty observations, such as the one analysed and presented in the previous graph, can be written as a finite sum of sine and cosine functions, according to the relation:
y t = a 0 2 + f = 1 p a f c o s 2 π T f t + b f s i n 2 π T f t + u t
where:
a 0 , a f , b f = parameters
T = number of time units
f = the frequency initially set
t has values in the range [1, T]
What interests us are the parameter estimates a ^ f, b ^ f, because these are the ones that lead to the approximation of the function f(t) by the finite sum of sine and cosine functions. Applying the least squares method, we will follow the integral:
1 2 π   0 2 π f t y n t 2 d t
Thus, the minimization of the function implies the equalization with zero of the partial derivatives of the first order, which will lead to the following calculation relations of the estimated parameters:
a ^ f = 2 T   t = 1 T y t c o s 2 π T f t
b ^ f = 2 T   t = 1 T y t s i n 2 π T f t
a ^ 0 = y t T
These coefficients are needed in further analysis to determine the specific indicators for spectral analysis such as amplitude:
A f = a ^ f 2 + b ^ f 2
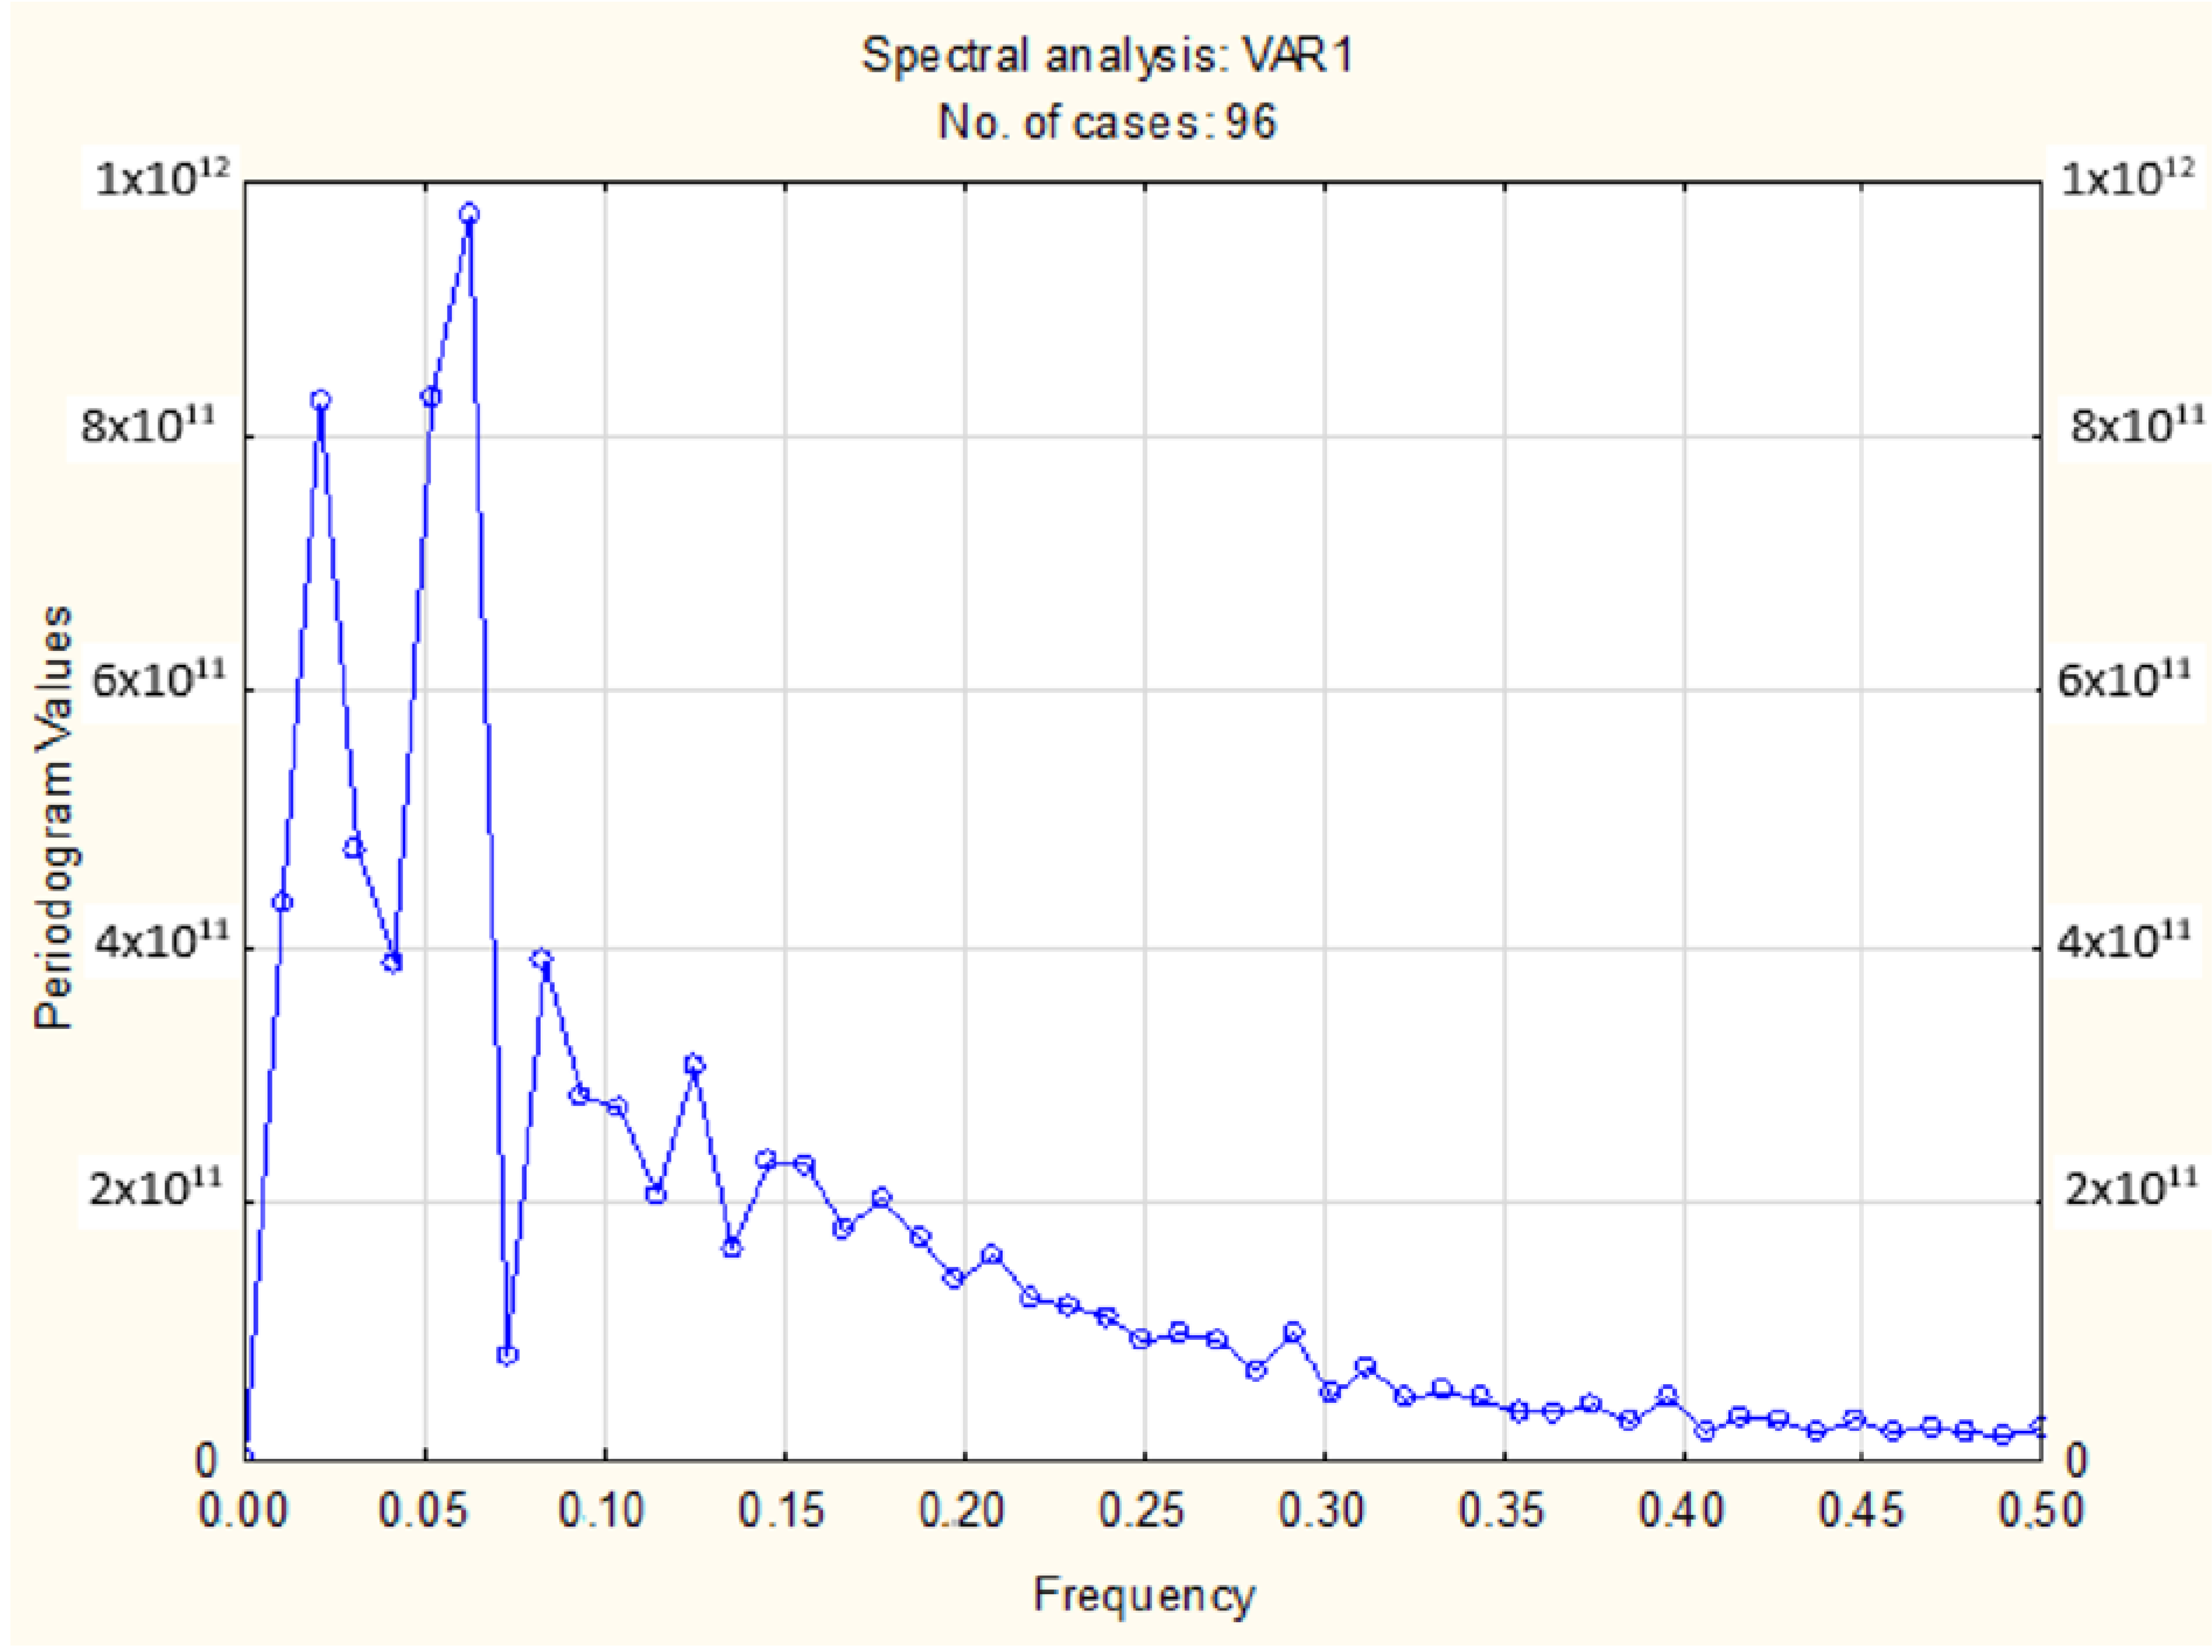
For the analysis of the fluctuations’ intensity generated by the oscillations of the analysed process, the data of the numerical series were introduced in the economic analysis program STATISTICA. The results regarding the frequency of oscillations, the Euler-Fourier coefficients, as well as the values of the periodogram and the density are structured in the following table.
Interpreting the results presented in Table 11 and represented in Figure 4 it can be concluded that due to the high values of the amplitude for periods less than one year (in the case analysed at 16 weeks and 19.2 weeks), an influence of seasonality in respect of COVID infection 19 is observed. In addition, the existence of the trend is indicated by high amplitude values (indicated by the periodogram in Table 11 column six) for frequencies lower than the unit value (Table 11 columns two).
In the United States, with a population of approximately 334,003,592 citizens on 19 January 2022, a total of 867,857,475 tests were performed, which means that if we take the population from the age at which these tests have been made from the beginning, there are about 3 tests on average per person. The number of tests performed on a resident, including those at the age of one day, was 2,598,348. In India, with a population of 1,400,976,358 inhabitants on 19 January 2022, 707,421,650 tests were performed, returning 504,949 tests per 1 million inhabitants. Brazil is another country with a very large population, 214,895,351 inhabitants on 19 January 2022. In this country, 63,776,166 tests were performed, 296,776 tests per 1 million inhabitants. The United Kingdom, which left the European Union, with a population of 68,437,373 citizens on 19 January 2022, performed over 437 million tests, which means 6,385,557 tests per 1 million inhabitants.
According to the data on 19 January 2022, Denmark (19,693,325 tests per million inhabitants), Austria (14,700,100 tests per million inhabitants), Cyprus (7,761,100 tests per million inhabitants), Great Britain (6,385,557 tests per million inhabitants), Greece (5,202,898 tests per million inhabitants), Israel (4,436,346 tests per million inhabitants) carried out very special tests.
If these tests were free of charge in the environments that are most exposed, such as education (kindergarten, nursery, school, university) from one end to the other, teachers, health professionals, staff working in public administration and other professional categories, free testing would be performed once every week or two, and at the same time, also free of charge, to be urged to vaccinate, the population would have responded favourably.
It is appreciated that the PNNR believes that significant sums have been provided to ensure the free testing and vaccination of the population as well as the implementation of the necessary treatments to stop as much as possible the spread of this virus and the development of other waves that might follow.

4.3. Perspectives on Global and European Developments in the Context of the Continuing COVID-19 Crisis

The world is entering the 3rd year since the outbreak of the Corona virus pandemic, with special effects in 2020 and 2021.
So far, four waves of this virus have been consumed, which has produced economic and social destabilization in all countries of the world, with a focus on the European Union. Of course, the states of the world have noticed the extremely dangerous nature of this virus, COVID-19, which has set itself and evolved in particularly aggressive terms.
In addition to infections in the population which led to deaths from causes associated with the Corona virus, but also due to comorbidities that were affected by this virus. We can go back in time and find that there were other pandemics that occurred in the years 1916–1930 and later, in the years 1940–1945, which caused economic-co-financial crises with social effects difficult to imagine at every moment.
The world is now in the phase in which this COVID-19 virus passes from one wave to another and, according to the assessments of specialists and institutions around the world, has a well-defined direction.
After traversing the first waves, the 5th wave—Omicron—has now appeared on the horizon. It is known to be extremely dangerous, with a very rapid ability to infect. It is not clear to us from all domestic and international press releases, from all the studies carried out, if this wave, Omicron, is also very dangerous. Several hypotheses have been issued which have shown, for the time being, that it is very virulent in its ability to spread and infect. We do not yet have concrete data to justify whether there is a depth, a risk to human life.
On the contrary, from reports even from the last few days both domestically, but especially internationally, it is found that the very fast pace of spread and infection is confirmed at the same time as a trend of reducing the number of deaths.
It would be good for the Poisson mathematical model, through its curve, to suggest that we are on the second side of the curve of the same name, Poisson, which suggests the decrease, at least in terms of virulence, that this new variant has carried it and carries it on.
There are enough elements urging the world’s states to take measures and restrictions to prevent the spread of this virus as much as possible.
Thus, due to the COVID-19 pandemic, EU governments have been forced to introduce measures to close borders, restrict human movement and suspend trade in certain sectors. These restrictions may have deepened the crisis to a much greater extent than the economic shock of the Great Depression of 1929–1933. Under these conditions, the already existing gap in the development of some countries’ economies is becoming even more pronounced, with an effect on the convergence process of the Member States of the European Union [47].
Vaccination is continued in all countries. In this respect, we take the example of Israel, which is already moving to the second set of complete vaccinations, with the second recall. However, the infections do not stagnate and the concern that arises from this situation is that we will continue to face, vaccinated or unvaccinated, a very serious condition. It remains to be seen whether what is already being said about the fact that Israel and other states are on the verge of providing medicines for the preventive and curative treatment of this virus will happen.
Science has evolved enormously and especially in the medical field; exceptional results have been obtained and we hope to continue to achieve them. Perhaps this would be a point of reassurance when there will be a preventive and curative treatment scheme.
From all the research carried out worldwide, it is clear that a strategy in this regard can only start with testing, and then combine with some prudent measures to avoid infection (wearing masks, keeping physical distance, avoiding crowded places, flawless personal hygiene), all within easy reach of each person.
The vaccination cannot be omitted, which, even if only because of the post-vaccination infections, is easier, without endangering the world’s population.
The problem with this strategy is probably that of funding, and we believe that, at least for the European Union, that PNRR is in a position to provide funding to enable a complex strategy to be achieved. The restrictive measures, which have been taken too hard, show obviously that they have aroused huge waves of protests across Europe.
From this point of view, it is considered that the de-generative conflict that has arisen between the two groups, vaccinated and unvaccinated, must be stopped as a matter of the utmost urgency. This is all the more so as it has been established precisely that those who are vaccinated can also become infected and transmit the virus.
Therefore, the only preventive measure is to test, not only the population working in areas of utmost importance, such as health, public institutions, education and others, but for all citizens of a country and, more broadly, worldwide.
A number of appreciations could be invoked which have been expressed worldwide regarding the origin, continuous spread and passage through various waves of this pandemic Corona virus but, in order not to enter the sphere of speculation; it is good to note only that we are in a rather difficult time for the future of the mankind.
Corona virus, which is developing the 5th-Omicron wave, will accompany at least the first part of 2022 and will create great difficulties for the management of macroeconomic institutions, which must find solutions.
Globally, resources are dwindling due to exploitation/use, and this requires more rigors in the way that measures are put in place that do not hinder the evolution of production and reduce it, which means lower incomes that lead to fragile sources for the population, which will face a number of other constraints.
On the basis of the above, it can be specified that in 2022 this pandemic will continue with wave 5 and maybe, after a few months, wave 6. Theta, which could clarify whether the spread of the virus is high but less offensive in terms of serious health damage. Finally, it may be found that world is entering a stage where, such as the flu vaccine case, it is need, under well-established conditions, a vaccine or preventive treatment.
However, until then, in 2022, the effects of the Corona virus pandemic over two years will materialize primarily in the following areas:
-
Measures to prevent the spread of this virus will continue but, in addition, will disrupt the production of goods and services in all countries and, as a result, the economic outcomes will be increasingly modest, unable to provide the necessary income to the population. Given the complexity, intensity and frequency of the COVID-19 pandemic disasters, global health, government and business leaders will need to move from isolated approaches to decision-making to an in-depth analysis of the multidisciplinary and transdisciplinary level of cooperation [44].
-
The reduction of the activity in the economic field will have the effect of decreasing the number (rate) of the employed population at the same time as the increase of unemployment. This phenomenon will continue and may, if the necessary restrictive measures are in place, lead to a reduction in indicators that we can hardly imagine now;
-
The industry will enter a crisis, primarily in terms of international cooperation and the setting of goals with broad economic cooperation; will lead to a decrease in the production of components, semiconductors and others with immediate effect in areas such as automotive, electrical, telephony, electronic components, and basic equipment for modernizing the industry. The number of orders from each country will decrease, which will be placed abroad for the possible capitalization of the surplus of some existing products;
-
The economy will be particularly affected by one of the three crises (energy crisis, food crisis, health crisis). The energy crisis, because less and less investment will be placed, primary energy resources will diminish, the switch to green energy will drag on and then investments in the current infrastructure will be quite low. Thus, in the field of hydropower there will be very little investment, thermal power plants will be almost completely closed, in general terms, nuclear energy is reconsidered and wind energy, although it is growing, there are few investments that can be allocated and natural conditions are conjunctural;
-
Agriculture is another field that will create big problems for the national management in each country and the global warming crisis has exacerbated the need to take high-level agrotechnical measures that can ensure the rhythmic development of the agriculture. Countries such as Poland, Germany, Bulgaria, Spain, Serbia and other Central European countries, along with Romania, have conditions for a modern agriculture but which in turn requires a lot of investment. Let’s hope that Romania will find in this sense the necessary resources to be able to finance with its own sources and those attracted from the European Union, to improve the agro technics used and, on this background, to increase the complex agricultural production (vegetable, animal, forestry, fish, etc.). We must not omit in any way the fact that Romania, through the natural environment with which the soil and land surfaces are endowed, can provide food for at least 80 million people. Romania has a population of just over 19 million, a resident population, which means that in the case of a re-modernized agriculture it could provide, by export, food for other European countries, especially in the European Union. Romania could also develop an agri-food industry that, again, could produce the food needs of the population. However, the current conditions tend to assess the fact that we are in an agri-food crisis;
-
The other branches of the national economy (construction, transport, services or tourism, HoReCa) will also continue to be affected by the health and financial-economic crisis. Researchers point out that the health crisis caused by the COVID-19 pandemic has been so severe that the decline in economic and tourism activity in most countries has led to an economic crisis with financial consequences that is difficult to estimate at this time [56].
-
The second crisis we talked about, the gas and energy crisis, will have a significant impact virulently on all other branches of the national economy that, in the chain, will depend on these price increases. We have the clear example that in this field, of natural gas and energy, prices have increased several times and at the beginning of 2022, after exceeding a few months of measures to freeze prices, they will increase and will have a negative impact on the other crisis, agro-food, in which all prices will rise.
It is now difficult to take action without a concrete situation. We must not lose sight of the fact that Russia, the main supplier of natural gas, has its own policy that can generate many difficulties and shortcomings for the population of other European countries. The Russian head of state recently had a speech in which he specified that worldwide the price of gas per thousand cubic meters has increased from $120 to almost $2000. He suggested and pointed out that on the basis of long-term treaties, countries such as Germany still have the benefit of obtaining natural gas at the lowest price, and in this way, he noted and questioned the fact that Poland and other European countries benefit from these long-term contracts to receive cheaper gas from Germany.
Gas and energy prices will continue to rise, amid declining world reserves, which in the case of oil and gas are limited to about 42 years of exploitation (oil) and almost 100 years of gas exploitation.
The issue of the Germany-Russia Nord-Stream is a problem that is between the two countries and that will be able to be, if not a weapon, an element of political influence at European level.
-
The labour force in this context will become a problem and, under the circumstances, we have in analysis some paradoxical elements. In some countries of the European Union (Spain, Portugal, Italy, Germany) there is unemployment but a significant number of the population at the same time, countries such as Romania, Poland, other Central and Eastern European countries offer cheap labour that is targeted to those activities that are bypassed by the citizens of the developed countries that I have mentioned.
Having said that, the existence of paradoxes can be noted. This is one of them in developed countries but also in countries such as Romania or Poland. In the case of Romania, there are 4 million citizens who have found permanent or temporary jobs in European Union countries, but there is an acute need for labour. In this sense, Romania, Poland and several other member countries of the European Union have become a point of attraction for people from Asian countries (Thailand, Sri Lanka, Vietnam, Philippines) who want to come to these countries. In the case of Romania, the problem is becoming more acute, it is proposed to approve about 200,000 people from Asian countries to be accepted for acquiring jobs. So, unemployment is an element with many repercussions on the situation in a number of European countries.
-
The inflation is another issue that cannot be neglected, which, according to forecasts of specialized institutions abroad and in Romania (the National Institute of Statistics, the Institute of Forecasting and the National Bank) foreshadows a possibility that this inflation will reach a growth rate in 2022 with double digits, i.e., over 10%.
-
Issues related to a possible global economic recession have recently been discussed. For now, we are on the brink of this element of the global economic cycle (recession) that can be triggered if employment issues arise more and more often.
By the way, we can also appreciate the fact that in a number of European countries there is no precise strategy for professional conversion, there is clearly a long enough distance between the needs felt by the national economies and the supply of the labour market. I am referring here to the structural elements, by professions, specializations, etc.
Another paradox is that in a country such as Romania, with an unemployment rate of 500,000 people, we have vacancies at the level of tens of thousands, which are still being taken out to be filled, but nevertheless, the desired phenomenon does not happen. In this sense, it is clear that the labour market supply as a structure by specializations, seniority, etc., is not in line with the requirements of the national economy. This aspect should be analysed quickly and we will see if things do not become better, even through subsidies but less through external loans that will put countries in difficulty, such as Romania, Bulgaria and others, to increase their indebtedness both externally and also internally.
At this point in the analysis, we can specify that we are currently facing a process of stagflation. The process of stagflation is the one that manifests itself when the economy stagnates or even declines (it is a situation in which the economies of some European countries are situated) against the background of rising inflation and unemployment.
These two elements, these two indicators have an effect in the sense that there is compatibility between stagflation and recession but, above all, there will be symbiosis between the elements (indicators) that define stagflation and that cause stagnation or economic downturn.
The unemployment and inflation, in the process of recession, will increase alarmingly. In 2022 the growth of the rate of inflation could reach a double-digit level, as well as the unemployment that will increase due to the non-coordination of the labour market with the needs of the national economy.
Stagflation is a phenomenon that is forgotten by many researchers, but it is still relevant, although it was considered and brought into the circuit after World War II and even earlier, when researchers realized that stagnation or declining economic growth has as causes and outcomes the increase of the inflation and unemployment.
It remains to be seen whether the government strategies, such as those of the European Union, will take into consideration and analyse, qualitatively and quantitatively, the negative effects of this unprecedented pandemic crisis.
There is a need for better coordination and superior use of the resources available to each country, to find major projects in areas of importance so that, gradually, overcoming these effects of the COVID-19 pandemic situation offers the perspective of a trend of resumption of growth. After all, these strategies must ensure what the EU directives provide for, namely the economic growth of each country, the increase of the labour productivity, the income level of the population and, in this way, to improve the quality of life in all EU member states.
The economic and financial crisis is the result of the pandemic crisis, which imposed many restrictions that disrupted macro stability and brought into question increases in inflation and unemployment, as well as the reduction of the economic growth.
At the same time, the spread of the new COVID-19 has had a significant impact on the financial markets at a steady pace. In this regard, some studies have shown that the response of stock markets in different contexts has evolved, leading to the emergence and deepening of macroeconomic imbalances [22].
Of course, it can be emphasized the fact that education and health, along with scientific research, in all EU Member States, must be undeniable priorities to which investments, national and European subsidies must be directed. Such a policy can ensure a resumption of optimism, confidence in the prospect of growth and overcoming stagnation.
Realistically, when dealing with stagflation issues, we can appreciate that it is more in the realm of theory at the moment, but as a number of world-renowned researchers predict a recession, which means a decrease of several consecutive quarters of economic growth or stagnation at least, these are the conditions that lead us to believe that if we are not in stagflation, we are on the eve of a stagflation’s phenomenon with special influences on the real growth of the economy in each member state of the European Union.

5. Conclusions

The COVID-19 crisis has generated another major issue for mankind, along with global warming and the energy transition, namely the health of the population. For this reason, the study focused on the impact of the COVID-19 crisis on the health of the population in a broader context and the sustained growth of the population in developing countries along with the aging of the population in developed economies.
Following the research conducted by the author series of theoretical and practical conclusions can be formulated. A first conclusion is that this correlation that must exist between the growth of the world’s population and the existence of living resources is deficient, in the sense that the total population of the world will increase, and resources will decrease and provide fewer and fewer resources for global the development of each country.
This problem of the growing disproportion between the growing population and the declining world resources is now also influenced by the unprecedented health and economic and financial crisis. The gap between resources and population should be covered in the most efficient way and there is only the research, the innovation which can ensure development in the future.
The study shows that the situation of food and living conditions will affect the least developed countries, Africa and Asia, which do not have the necessary resources and have difficult access to drug production, to an adequate level of medication, as there are few specialists in this domain. Therefore, the question arises that on the globe there should be a much more efficient cooperation between the states of the world so that the resources which, incidentally or not, are mainly in the less developed countries and which, by ensuring a technological level from the developed countries will bring superior results. Of course, the research must play a special role and must be developed individually and in conjunction with the world. Another foreseeable situation is that in most countries of the world there must be a close correlation between the resources allocated in education and health and the need to ensure the necessary living conditions, medication and treatment in order to maintain the health of the population.
Global health care is an objective necessity and must be seen in close conjunction with the effects of the health and economic and financial crisis. States in a situation of high poverty, in need, require resources and support through concrete cooperation. There is talk of resetting the world’s population first of all, international solidarity should be more actively developed in order to ensure that the existing resources are used as efficiently as possible and directed to provide better conditions and growing for the population of every country both in the world and in the European Union.
Another conclusion is that the Member States of the European Union will initiate large-scale projects, but this must also take into consideration the attraction of countries with a lower potential, to work together, so as to reduce the prospect of the population growth on the verge of poverty. Currently, this category, the most severely affected, being in absolute poverty, exceeds 1 billion people, i.e., about one seventh of the world’s population.
The above conclusions can also be summarized by the need for priority-oriented funding in priority areas, which will ensure recovery and resilience for the most severely affected countries. Specifically, the European Union has drawn up a recovery and resilience plan on the basis of which each Member State will receive free resources or in the form of low-interest financing, so as to ensure the improvement of the living conditions of the population.
Regarding the situation of income and expenditure, the income and expenditure are affected by the COVID-19 and the economic and financial crisis and this is prolonged with effect on the health situation and the improvement of living conditions of the population.
Based on data provided by Eurostat and Real-time world statistics, it is necessary to take radical decision to help the poor people, the priority development of health and education, which must be more seriously funded and to ensure the evolution of the growth of an intellectually and physically healthy population.
The complex investments that need to be made must be targeted in all the areas especially those that can bring additional income, create jobs, absorb some of the unemployment and the unemployed population, and create a more serious basis for maintaining the inflation under control and to ensure, in this way, the increase of the real incomes of the population.
A final conclusion is that this economic-financial and health crisis has a particularly serious effect on the health of the population. The data submitted to the research showed that starting with 2019 and then 2020 and 2021, the pandemic crisis has led to the worsening of the economic evolution and health system in all the countries around the world, in the European Union and in each member country of this union. The COVID crisis has led to a reconsideration of human priorities, in the sense that the health of the population should be the first priority of public authorities given the importance of human resources in managing other issues facing humanity, namely climate change and energy transition.

Author Contributions

Conceptualization, C.A., M.-G.A., Ș.V.I., M.P., I.G.R., A.G.B. and A.M.; methodology, C.A., M.-G.A., Ș.V.I., M.P. and A.M.; software, M.-G.A. and Ș.V.I.; validation, C.A., M.-G.A., Ș.V.I., M.P., I.G.R., A.G.B. and A.M.; formal analysis, C.A., M.-G.A., Ș.V.I. and M.P.; investigation, C.A., M.-G.A., Ș.V.I., M.P., I.G.R., A.G.B. and A.M.; resources, C.A., M.-G.A., Ș.V.I., M.P., I.G.R., A.G.B. and A.M.; data curation, C.A., M.-G.A., Ș.V.I., M.P., I.G.R., A.G.B. and A.M.; writing—original draft preparation, C.A., M.-G.A., Ș.V.I. and M.P.; writing—review and editing, C.A., M.-G.A., Ș.V.I., M.P., I.G.R., A.G.B. and A.M.; visualization, C.A., M.-G.A., Ș.V.I., M.P., I.G.R., A.G.B. and A.M.; supervision, C.A., M.-G.A., Ș.V.I. and M.P.; project administration, C.A.; funding acquisition, C.A., M.-G.A., Ș.V.I., M.P., I.G.R., A.G.B. and A.M. All authors have read and agreed to the published version of the manuscript.

Funding

This research received no external funding.

Institutional Review Board Statement

Not applicable.

Informed Consent Statement

Not applicable.

Data Availability Statement

All information used are publicly available.

Conflicts of Interest

The authors declare no conflict of interest.

References

  1. Agboola, M.O.; Bekun, F.V.; Balsalobre-Lorente, D. Implications of social isolation in combating COVID-19 outbreak in Kingdom of Saudi Arabia: Its consequences on the carbon emissions reduction. Sustainability 2021, 13, 9476. [Google Scholar] [CrossRef]
  2. Almeida, F. Innovative response initiatives in the European Union to mitigate the effects of COVID-19. J. Enabl. Technol. 2021, 15, 40–52. [Google Scholar] [CrossRef]
  3. Balsalobre-Lorente, D.; Driha, O.M.; Bekun, F.V.; Sinha, A.; Adedoyin, F.F. Consequences of COVID-19 on the social isolation of the Chinese economy: Accounting for the role of reduction in carbon emissions. Air Qaul. Atmosph. Health 2020, 13, 1439–1451. [Google Scholar] [CrossRef]
  4. Belhadi, A.; Kamble, S.S.; Khan, S.A.R.; Touriki, F.E.; Kumar, M.D. Infectious waste management strategy during COVID-19 pandemic in Africa: An integrated decision-making framework for selecting sustainable technologies. Environ. Manag. 2020, 66, 1085–1104. [Google Scholar] [CrossRef] [PubMed]
  5. Bilal, M.F.B.; Komal, B.; Benghoul, M.; Bashir, M.A.; Tan, D. Nexus between the COVID-19 dynamics and environmental pollution indicators in South America. Risk Manag. Healthc. Policy 2021, 14, 67. [Google Scholar] [CrossRef]
  6. Bilgili, F.; Dundar, M.; Kuşkaya, S.; Lorente, D.B.; Ünlü, F.; Gençoğlu, P.; Muğaloğlu, E. The age structure, stringency policy, income, and spread of coronavirus disease 2019: Evidence from 209 countries. Front. Psychol. 2021, 4042. [Google Scholar] [CrossRef]
  7. Grossi, G.; Ho, A.T.; Joyce, P.G. Budgetary responses to a global pandemic: International experiences and lessons for a sustainable future. J. Public Budget. Account. Financ. Manag. 2020, 32, 737–744. [Google Scholar] [CrossRef]
  8. Khan, S.A.R.; Ponce, P.; Tanveer, M.; Aguirre-Padilla, N.; Mahmood, H.; Shah, S.A.A. Technological innovation and circular economy practices: Business strategies to mitigate the effects of COVID-19. Sustainability 2021, 13, 8479. [Google Scholar] [CrossRef]
  9. Shuai, Z.; Iqbal, N.; Hussain, R.I.; Shahzad, F.; Yan, Y.; Fareed, Z. Climate indicators and COVID-19 recovery: A case of Wuhan during the lockdown. Environ. Dev. Sustain. 2021, 1–21. [Google Scholar] [CrossRef]
  10. Yu, Z.; Rehman Khan, S.A. Evolutionary game analysis of green agricultural product supply chain financing system: COVID-19 pandemic. Int. J. Logis. Res. Appl. 2021, 1–21. [Google Scholar] [CrossRef]
  11. Zeb, S.; Akbar, A.; Gul, A.; Haider, S.A.; Poulova, P.; Yasmin, F. Work–Family conflict, emotional intelligence, and general self-efficacy among medical practitioners during the COVID-19 pandemic. Psychol. Res. Behav. Manag. 2021, 14, 1867. [Google Scholar] [CrossRef] [PubMed]
  12. Gonzalez-Perez, M.A.; Mohieldin, M.; Hult, G.T.M.; Velez-Ocampo, J. COVID-19, sustainable development challenges of Latin America and the Caribbean, and the potential engines for an SDGs-based recovery. Manag. Res. J. Iberoam. Acad. Manag. 2021, 19, 22–37. [Google Scholar] [CrossRef]
  13. Ozili, P. COVID-19 in Africa: Socio-economic impact, policy response and opportunities. Int. J. Soc. Soc. Policy 2020, MPRA Paper No. 103316 posted 9 October. 42, 177–200. [Google Scholar] [CrossRef]
  14. Schaltegger, S. Sustainability learnings from the COVID-19 crisis. Opportunities for resilient industry and business development. Sustain. Account. Manag. Policy J. 2020, 12, 889–897. [Google Scholar] [CrossRef]
  15. Goodell, J.W. COVID-19 and finance: Agendas for future research. Finance Res. Lett. 2020, 35, 101512. [Google Scholar] [CrossRef]
  16. Wójcik, D.; Ioannou, S. COVID-19 and finance: Market developments so far and potential impacts on the financial sector and centres. Tijdschrift Econ. Soc. Geogr. 2020, 111, 387–400. [Google Scholar] [CrossRef]
  17. Anghelache, C.; Anghel, M.G. The European Union’s strategy for increasing the living conditions of the population in the member states. Th. Appl. Ec. 2017, XXIV, 5–18. [Google Scholar]
  18. Mascio, D.D.; Buca, D.; Berghella, V.; Khalil, A.; Rizzo, G.; Odibo, A.; Saccone, G.; Galindo, A.; Liberati, A.; D’Antonio, F. Counseling in maternal-fetal medicine: SARS-CoV-2 infection in pregnancy. J. Int. Soc. Ultrasound Obstet. Gynecol. 2021, 57, 687–697. [Google Scholar] [CrossRef]
  19. Fei, C.; Shiheng, Z.; Zhiqing, D.; Lanting, H.; Chun, L.; Qi, G.; Chaofan, M.; Yankun, Z. Effects of COVID-19 and mRNA Vaccines on Human Fertility; Human Reproduction: Oxford, UK, 2021. [Google Scholar]
  20. Hasan, M.; Mahi, M.; Sarker, T.; Amin, M. Spillovers of the COVID-19 Pandemic: Impact on Global Economic Activity, the Stock Market, and the Energy Sector. J. Risk Financ. Manag. 2021, 14, 200. [Google Scholar] [CrossRef]
  21. Mennini, F.S.; Magni, D.; Daniele, L.M.; Favato, G. Knowledge management in turbulent times: Time-based scenario analysis of vaccinations against COVID-19. J. Knowl. Manag. 2022, 26, 71–88. [Google Scholar] [CrossRef]
  22. Arslan, H.M.; Bilal; Bashir, M.F. Contemporary research on spillover effects of COVID-19 in stock markets. A systematic and bibliometric review. In Proceedings of the 3rd International Electronic Conference on Environmental Research and Public Health—Public Health Issues in the Context of the COVID-19 Pandemic, Basel, Switzerland, 11–25 January 2021. [Google Scholar]
  23. Sharma, G.D.; Tiwari, A.K.; Jain, M.; Yadav, A.; Erkut, B. Unconditional and conditional analysis between covid-19 cases, temperature, exchange rate and stock markets using wavelet coherence and wavelet partial coherence approaches. Heliyon 2021, 7, e06181. [Google Scholar] [CrossRef] [PubMed]
  24. Lento, C.; Gradojevic, N. S&P 500 Index Price Spillovers around the COVID-19 Market Meltdown. J. Risk Financial Manag. 2021, 14, 330. [Google Scholar]
  25. Vasile, V.; Panait, M.; Apostu, S.A. Financial inclusion paradigm shift in the postpandemic period. digital-divide and gender gap. Int. J. Environ. Res. Public Health 2021, 18, 10938. [Google Scholar] [CrossRef] [PubMed]
  26. Duan, Y.; Liu, Y.; Chen, Y.; Guo, W.; Yang, L. Research on the impact of knowledge sharing on risk control of inclusive finance in rural areas during the post-COVID-19 era. J. Knowl. Manag. 2021. [Google Scholar] [CrossRef]
  27. Chang, C.-L.; McAleer, M.; Wong, W.-K. Risk and Financial Management of COVID-19 in Business, Economics and Finance. J. Risk Financ. Manag. 2020, 13, 102. [Google Scholar] [CrossRef]
  28. Chevallier, J. COVID-19 pandemic and financial contagion. J. Risk Financ. Manag. 2020, 13, 309. [Google Scholar] [CrossRef]
  29. Navon, A.; Machlev, R.; Carmon, D.; Onile, A.E.; Belikov, J.; Levron, Y. Effects of the COVID-19 pandemic on energy systems and electric power grids—A review of the challenges ahead. Energies 2021, 14, 1056. [Google Scholar] [CrossRef]
  30. Davidescu, A.A.; Apostu, S.A.; Stoica, L.A. Socioeconomic Effects of COVID-19 Pandemic: Exploring Uncertainty in the Forecast of the Romanian Unemployment Rate for the Period 2020–2023. Sustainability 2021, 13, 7078. [Google Scholar]
  31. Davidescu, A.A.; Apostu, S.A.; Marin, A. Forecasting the Romanian Unemployment Rate in Time of Health Crisis—A Univariate vs. Multivariate Time Series Approach. Int. J. Environ. Res. Public Health 2021, 18, 11165. [Google Scholar] [CrossRef]
  32. Magni, D.; Sestino, A. Students’ learning outcomes and satisfaction. An investigation of knowledge transfer during social distancing policies. Int. J. Learn. Intellect. Cap. 2021, 18, 339–351. [Google Scholar] [CrossRef]
  33. Börsch-Supan, A.; Düzgün, I.; Weiss, M. Labor productivity in an aging society. In Frontiers in Pension Finance and Reform; Broeders, D., Eiffinger, S., Houben, A., Eds.; Edward Elgar Publishing: Cheltenham, UK, 2008; pp. 83–96. [Google Scholar]
  34. Chamberlin, G. Gross domestic product, real income and economic welfare. Econ. Labour Mark. Rev. 2011, 5, 5–25. [Google Scholar] [CrossRef] [Green Version]
  35. Edenhofer, O.; Hirth, L.; Knopf, B.; Pähle, M.; Schlörner, S.; Schmid, E.; Ueckerdt, F. On the Economics of Renewable Energy Sources. Energy Econ. 2013, 40, 12–33. [Google Scholar] [CrossRef]
  36. Kennan, J.; Walker, J.R. The effect of expected income on individual migration decisions. Econometrica 2011, 79, 211–251. [Google Scholar]
  37. Oravský, R.; Tóth, P.; Bánociová, A. The ability of selected European countries to face the impending economic crisis caused by COVID-19 in the context of the global economic crisis of 2008. J. Risk Financ. Manag. 2020, 13, 179. [Google Scholar] [CrossRef]
  38. Dimian, G.C.; Apostu, S.A.; Vasilescu, M.D.; Aceleanu, M.I.; Jablonsky, J. Vulnerability and resilience in health crises. Evidence from European countries. Technol. Econ. Dev. Econ. 2021, 27, 783–810. [Google Scholar] [CrossRef]
  39. Koulakiotis, A.; Lyroudi, K.; Papasyriopoulos, N. Inflation, GDP and Causality for European Countries. Int. Adv. Econ. Res. 2012, 18, 53–62. [Google Scholar] [CrossRef]
  40. Kroli, K.; Notowidigdo, M.J. Should Unemployment Insurance Valy with the Unemployment Rate? Theory and Evidence. Rev. Econ. Stud. 2016, 83, 1092–1124. [Google Scholar]
  41. Mishra, T. Stochastic Demographic Dynamics and Economic Growth: An Application and Insights from the World Data. Hist. Soc. Res. 2008, 33, 9–187. [Google Scholar]
  42. Walker, A.; Maltby, T. Active ageing: A strategic polity solution to demographic ageing in European Union. Int. J. Soc. Welf. 2012, 21, s117–s130. [Google Scholar] [CrossRef]
  43. Zhang, J.; Zhang, R. COVID-19 in China: Power, transparency and governance in public health crisis. Healthcare 2020, 8, 288. [Google Scholar] [CrossRef]
  44. Baxter, D.; Casady, C.B. A Coronavirus (COVID-19) Triage Framework for (Sub)National Public–Private Partnership (PPP) Programs. Sustainability 2020, 12, 5253. [Google Scholar] [CrossRef]
  45. Farzanegan, M.R.; Feizi, M.; Gholipour, H.F. Globalization and the outbreak of COVID-19: An empirical analysis. J. Risk Financ. Manag. 2021, 14, 105. [Google Scholar] [CrossRef]
  46. Hili, A.; Lahmandi-Ayed, R.; Lasram, H. Differentiation, labor market and globalization. J. Int. Trade Econ. Dev. 2016, 25, 809–833. [Google Scholar] [CrossRef]
  47. Fedajev, A.; Radulescu, M.; Babucea, A.G.; Mihajlovic, V.; Yousaf, Z.; Milićević, R. Has COVID-19 pandemic crisis changed the EU convergence patterns? Econ. Res. Ekon. Istraživanja 2021, 1–30. [Google Scholar] [CrossRef]
  48. Islam, M.; Jannat, A.; Al Rafi, D.A.; Aruga, K. Potential Economic Impacts of the COVID-19 Pandemic on South Asian Economies: A Review. World 2020, 1, 283–299. [Google Scholar] [CrossRef]
  49. Kitamura, Y.; Karkour, S.; Ichisugi, Y.; Itsubo, N. Evaluation of the economic, environmental, and social impacts of the COVID-19 pandemic on the japanese tourism industry. Sustainability 2020, 12, 10302. [Google Scholar] [CrossRef]
  50. Jain, M.; Sharma, G.D.; Goyal, M.; Kaushal, R.; Sethi, M. Econometric analysis of COVID-19 cases, deaths, and meteorological factors in South Asia. Environ. Sci. Pollut. Res. 2021, 28, 28518–28534. [Google Scholar] [CrossRef]
  51. Sharma, G.D.; Thomas, A.; Paul, J. Reviving tourism industry post-COVID-19: A resilience-based framework. Tour. Manag. Perspect. 2021, 37, 100786. [Google Scholar] [CrossRef]
  52. Sharma, G.D.; Tiwari, A.K.; Jain, M.; Yadav, A.; Srivastava, M. COVID-19 and environmental concerns: A rapid review. Renew. Sustain. Energy Rev. 2021, 148, 111239. [Google Scholar] [CrossRef]
  53. Ruiu, M.L.; Ragnedda, M.; Ruiu, G. Similarities and differences in managing the Covid-19 crisis and climate change risk. J. Knowl. Manag. 2021, 24, 2597–2614. [Google Scholar] [CrossRef]
  54. Leal Filho, W.; Brandli, L.L.; Lange Salvia, A.; Rayman-Bacchus, L.; Platje, J. COVID-19 and the UN sustainable development goals: Threat to solidarity or an opportunity? Sustainability 2020, 12, 5343. [Google Scholar] [CrossRef]
  55. Pinilla, J.; Barber, P.; Vallejo-Torres, L.; Rodríguez-Mireles, S.; López-Valcárcel, B.G.; Serra-Majem, L. The Economic Impact of the SARS-COV-2 (COVID-19) Pandemic in Spain. Int. J. Environ. Res. Public Health 2021, 18, 4708. [Google Scholar] [CrossRef] [PubMed]
  56. Rodríguez-Antón, J.M.; Alonso-Almeida, M.D.M. COVID-19 impacts and recovery strategies: The case of the hospitality industry in Spain. Sustainability 2020, 12, 8599. [Google Scholar] [CrossRef]
  57. Worldometers. Available online: https://www.worldometers.info/ro/ (accessed on 19 January 2022).
Figure 1. Evolution of COVID-19 (Wave I–V).
Sustainability 14 04613 g001
Figure 2. Correlation between COVID-19 deaths, number of infected people and number of vaccinated people. (a) Infections vs. Deaths, (b) Vaccination vs. Deaths.
Sustainability 14 04613 g002
Figure 3. Evolution of COVID-19 infections between January 2020 and January 2022. Note: The number of infections listed in the figure are rounded and divided by 10,000. Source: Real-time world statistics. Accessed on 19 January 2022—data summarized by the authors [57].
Sustainability 14 04613 g003
Figure 4. Periodic table values by frequency.
Sustainability 14 04613 g004
Table 1. World population on 6 January 2022.
Crt. No.IndicatorPeriodVolume
1The population of the globeup to date in 20227,918,417,083
2Birthsup to date in 20222,111,019
3Birthsdaily191,734
4deathsup to date in 2022886,195
5deathsdaily80,586
6Population growthup to date in 20221,224,890
Source: Real-time world statistics. Accessed on 6 January 2022—data processed by the authors [57].
Table 2. Worldwide primary energy sources on 6 January 2022.
Crt. No.SourceU.M.IndicatorPeriodsVolume
1ElectricitykWhconsumptiondaily234,422,900
2non-renewablekWhconsumptiondaily199,628,810
3regeneratorkWhconsumptiondaily35,331,680
4Solar energyMWhreached the grounddaily1,472,890,700
5Oilbarrelconsumptiondaily48,295,700
6Oilbarrelremaining reservesuntil exhaustion1,451,162,677,530
7Oildaydays until exhaustionuntil exhaustion15,134
8Natural gasesbeptotal reservesuntil exhaustion1,084,503,785,910
9Natural gasesdaydays until exhaustionuntil exhaustion57,079
10Coalbepreservationsuntil exhaustion4,299,169,397,915
11Coaldaydays until exhaustionuntil exhaustion148,247
Source: Real-time world statistics. Accessed on 6 January 2022—data processed by the authors [57].
Table 3. Water resources and the effect of consumption on 6 January 2022.
Crt. No.IndicatorU.M.PeriodsVolume
1Drinking waterlitre2022 daily6,206,590
2Deaths due to water consumptionpeople2022 daily12,705
3People without access to waterpeople2022 daily787,570,636
Source: Real-time world statistics. Accessed on 6 January 2022—data processed by the authors [57].
Table 4. The situation of the environment on 6 January 2022.
Crt. No.IndicatorU.M.PeriodsVolume
1Loss of forestshaIn 202278,489
2Lost agricultural landhaIn 2022105,672
3Carbon dioxide emissionstoneIn 2022548,679,713
4DesertificationhaIn 2022181,147
5Toxic wastetoneIn 2022147,826
Source: Real-time world statistics. Accessed on 6 January 2022—data processed by the authors [57].
Table 5. Daily expenses with medical care, education, research and military during the period 1 January 2021–6 January 2022.
Crt. No.IndicatorPeriodsVolumeU.M.
1Health care expensesdaily8,105,970,510$
2Education and research expensesdaily5,483,371,514$
3Military spendingdaily2,410,810,590$
Source: Real-time world statistics. Accessed on 6 January 2022—data processed by the authors [57].
Table 6. Nutrition and effects on population health during the period 1 January 2021–6 January 2022.
Crt. No.IndicatorU.M.PeriodsVolume
1Malnourished peoplepeopleTotally up to date857,590,714
2Underweight peoplepeopleTotally up to date1,721,207,081
3Obese peoplepeopleTotally up to date799,747,750
4Deaths due to malnutritionpeopledaily15,750
5Expenditure on disease control$daily315,368,970
6Expenditure on avoiding malnutrition$daily97,510,730
Source: Real-time world statistics. Accessed on 6 January 2022—data processed by the authors [57].
Table 7. Deaths on 6 January 2022.
Crt. No.IndicatorU.M.PeriodsVolume
1Deaths from contagious diseasespeople2022196,163
2Deaths of children under fivepeople2022114,870
3Abortionspeople2022645,030
4Deaths at birth (mothers)people20224671
5People infected with AIDSpeople202243,306,759
6Deaths due to AIDSpeople202225,408
7Deaths due to cancerpeople2022124,139
8Deaths due to malariapeople20225961
9Smoked cigarettespeopledaily7,855,900,340
10Deaths due to smokingpeople202275,589
11Deaths due to alcoholpeople202237,819
12Suicidespeople202216,216
13Traffic accident deathspeople202220,415
14Drug use expensesUS $20226,050,610,900
15Deaths due to COVID19people1 October 2019–6 January 20225,482,053
Source: Real-time world statistics. Accessed on 6 January 2022—data processed by the authors [57].
Table 8. Demographic indicators on the effect of the global COVID-19 pandemic on global population movement as of 4 October 2021.
CountryTotal InfectionsTotal DeathsTotal HealActive CasesCritical CasesTotal TestsThe PopulationTests at 1 Million
US44,518,437719,93333,938,1479,860,31719,236664,748,606333,437,2101,933,643
India33,834,702449,02933,121,247264,4268126574,252,4001,397,013,045411,057
Brazil21,468,121597,96820,442,653427,482721263,776,166214,454,297297,388
U.K.7,900,800136,9536,417,6601,346,067815304,621,00168,333,3324,457,668
Russia7,612,317210,8016,740,491661,0251980193,700,000146,012,9991,326,596
France7,027,059116,7986,790,335119,9261355143,234,81365,454,753188,303
Spain4,961,12886,4634,755,73874,42750766,213,858456,777,9011,415,496
Italy4,682,034131,0314,458,03684,10637495,445,81860,348,2851,581,494
Germany4,260,49494,2964,032,400132,867133473,348,90184,125,917871,894
Romania1,265,82737,5441,129,09699,187144013,048,53219,076,516684,010
China96,258463690,6758574160,000,0001,439,323,776111,163
Czech Republic1,726,69030,6061,666,06631,01812339,824,01510,734,9943,709,738
Israel1,322,39580461,300,95413,39530328,799,6739,326,0003,088,106
Portugal1,084,53418,1291,035,45030,9556019,550,68010,157,7641,924,703
Denmark375,5452697360,72511,6431685,162,6175,818,90914,935,506
Cyprus121,54656990,75530,222229,420,9081,218,8617,729,272
Austria794,98211,245754,07229,66522794,627,7369,073,65810,428,841
Greece714,28315,598663,77434,91135324,512,38110,356,3542,366,993
Source: Real-time world statistics. Accessed on 4 October 2021—data summarized by the authors [57].
Table 9. Demographic indicators on the effect of the global COVID-19 pandemic on global population movement as of 19 January 2022.
CountryTotal InfectionsTotal DeathsTotal HealActive CasesCritical CasesTOTAL TESTSThe PopulationTests at 1 Million
US67,767,004877,24043,528,11024,361,65425,810867,857,475334,003,5922,598,348
India37,901,241487,22635,526,0391,830,9268944707,421,6501,400,976,358504,949
Brazil23,215,551621,57821,773,085820,888831863,776,166214,895,351296,776
U.K.15,399,300152,87211,738,9233,615,555703437,010,76468,437,3736,385,557
Russia10,899,411127,6389,925,855650,1802300247,600,000140,031,4011,695,529
France14,739,297127,6389,612,7315,434,8643881216,918,55565,497,2503,311,873
Spain8,518,97591,2775,390,8183,194,661223066,213,85846,782,8331,415,345
Italy9,018,925141,8256,450,5962,626,5901688159,001,73360,324,0002,635,792
Germany8,140,446116,6107,139,8001,005,730266489,622,21884,198,8231,064,411
Romania1,944,91659,3851,793,66891,86353018,203,03619,038,854956,099
China105,345463697,478329716160,000,0001,439,323,776111,163
Czech Republic2,652,68536,9372,447,642194,15324548,558,05410,739,7574,521,150
Israel2,035,43283621,530,716496,35454141,373,3649,326,0004,436,346
Portugal1,950,62019,3801,627,279356,47715330,295,16610,150,6472,984,555
Denmark1,188,9083,535869,063316,31050114,689,9275,823,79719,693,325
Cyprus230,856869124,370108,023609,477,1381,220,9717,761,098
Austria1,475,95113,9581,328,340161,372193133,564,9659,085,99014,700,100
Greece1,703,39622,2851,429,157272,05468358,819,68010,344,1735,202,898
Source: Real-time world statistics. Accessed on 19 January 2022—data summarized by the authors [57].
Table 10. Results of the analysis of the dependence of deaths caused by COVID-19 on the number of infected persons and the number of vaccinated persons.
Dependent Variable: D
Method: Least Squares
Sample: 1 48
Included Observations: 48
VariableCoefficientStd. Errort-StatisticProb.
C9148.719648.778114.101460.0000
I2.5961190.5462084.7529840.0000
V−0.0117690.000995−11.822670.0000
R-squared0.777836Mean dependent var9704.979
Adjusted R-squared0.767963S.D. dependent var2288.075
S.E. of regression1102.172Akaike info criterion16.90841
Sum squared resid54665204Schwarz criterion17.02536
Log likelihood−402.8019F-statistic78.77675
Durbin-Watson stat0.481284Prob(F-statistic)0.000000
Table 11. Results of spectral analysis for the evolution of COVID-19 infections between January 2020 and January 2022.
Spectral Analysis: VAR1 (Spreadsheet1.sta) No. of Cases: 96 Largest Period og. Values
FrequencyPeriodCosine-CoeffsSine-CoeffsPeriodogramDensity
60.06250016.0000067,925.6−125,1299.730205 × 10116.823908 × 1011
50.05208319.20000130,647.116,2818.320191 × 10117.196085 × 1011
20.02083348.00000129,480.021,4448.267964 × 10116.028183 × 1011
30.03125032.0000096,778.223,8034.767662 × 10115.510783 × 1011
10.01041796.00000−50,577.680,6694.351489 × 10114.261483 × 1011
80.08333312.0000083,060.7−34,6823.888922 × 10113.063099 × 1011
40.04166724.0000078,922.4−43,1933.885288 × 10115.532403 × 1011
120.1250008.0000034,015.0−72,2093.058172 × 10112.442467 × 1011
90.09375010.6666742,517.8−64,1152.840848 × 10112.970077 × 1011
100.1041679.6000051,347.9−55,4792.742964 × 10112.656651 × 1011
Source: Data summarized by the authors.
Publisher’s Note: MDPI stays neutral with regard to jurisdictional claims in published maps and institutional affiliations.

