Article

Climate Change in Africa and Vegetation Response: A Bibliometric and Spatially Based Information Assessment

by
Oladayo Amed Idris
1,
Prosper Opute
1,2,
Israel Ropo Orimoloye
3,4 and
Mark Steve Maboeta
1,*
1
Unit for Environmental Sciences and Management (UESM), Faculty of Natural and Agricultural Sciences, North-West University, Private Bag X6001, Potchefstroom 2520, South Africa
2
Department of Animal and Environmental Biology, Faculty of Life Sciences, University of Benin, Benin City 300213, Nigeria
3
Centre for Environmental Management, University of the Free State, Bloemfontein 9300, South Africa
4
School of Social Science, The Independent Institute of Education, MSA, Roodepoort, Johannesburg 1724, South Africa
*
Author to whom correspondence should be addressed.
Sustainability 2022, 14(9), 4974; https://0-doi-org.brum.beds.ac.uk/10.3390/su14094974
Submission received: 25 February 2022 / Revised: 28 March 2022 / Accepted: 4 April 2022 / Published: 21 April 2022
(This article belongs to the Topic Climate Change and Environmental Sustainability)

Abstract

:
The impact of climate change over the coming decades will increase the likelihood of many species undergoing genetic alterations or even becoming extinct. Vegetation and belowground organisms are more vulnerable to the intensified impact of climate change due to a possible lack of genetic plasticity and limited mobility. Organisms are inter-dependable in ecosystems; hence, this study focused on the impact of climate change, examining the soil condition in Africa, vegetation responses and the overview of species’ responses to climate change through a bibliometric study and an analysis of remote sensing information. The bibliometric study examines climate change-related literature published from 1999 to 2019, collected from the Web of Science and Scopus database platforms, and this reveals an overall rapid increase in the number of climate change publications in Africa, with South Africa occupying a leading position in all the studied parameters. The spatially based information on soil moisture, temperature and the photosynthetic activities of vegetation affirmed that there is increasing amount of drought in Africa with more impact in northern, southern and eastern Africa. African countries, especially in the above-mentioned regions, need to urgently invest in support programs that will ease the impact of climate change, particularly on food security.

1. Introduction

Climate change caused by anthropogenic activities is currently gaining global awareness due to obvious alterations in the spatial distribution of rainfall and the impact on many species [1]. It is generally perceived that global climate change is human-induced, while others consider it to be a natural phenomenon [2]. An increase in population growth and economies does, no doubt, have a direct impact on the environment and biota [1]. To convince the general public of the impact of rapid climate change, scientists are challenged to predict and develop models on how species populations and distributions will be impacted. The models should be able to explain how the flow of energy will be modified by changes in the structure and function of biotic communities and, subsequently, how an ecosystem component will respond to a shift in the climate. Predicting and reversing the consequences of global climate change is a huge challenge and may be impossible for the scientific community [1,3].
The concepts of most predictive models are based on the principle of the susceptibility of species to climate change, combined with exposure level, sensitivity, genetic adaptation and the species’ ability to geographically shift. Geographical shifting and dispersal may have been the most spontaneous response of several species to avert the consequences of climate change [4]. Nevertheless, most predictive models represent the impact of climate change with naive algorithms that do not fully consider some factors that can complicate the prediction of the models, such as species body physiology, genetic change, phenotypic plasticity, interspecies or intraspecies interactions, the rates of environmental change and exposure levels [5]. The impact of climate change has been reported on different biomes, including aquatic [6], desert [7], grassland [8], rain forest and tundra forest [9,10], by many scientists in various papers.
The increasing global human population and the exploitation of the environment have been the major drivers of climate change [11], which subsequently negatively impacts communities’ structure, population abundance and individual physiology [11]. The general perception that climate change alters the behaviour and physiology of many plants and animals species is now obvious [5]. The study of the effects of climate change in Africa predicts that indigenous communities will be the most vulnerable to the impacts of climate change [12,13] due to their high dependence on the climate for agriculture, their underdeveloped economies and their poor institutional capacity to deal with the precipitation variability caused by climate change [13]. Africa is already facing water and food crises caused by climate change, and these crises are affecting the continent’s increasing population growth [14]. Climate change has caused a high variability of rainfall [12] and has a strong repercussion on the continent’s deserts and forests [10].
In order to monitor species extinction due to the consequence of anthropogenic activities and the impact of climate change leading to a decline in biodiversity, the International Union for Conservation of Nature (IUCN) developed a conservation Red List for both plant and animal species [15]. Presently, there are about 120,000 species on the IUCN Red List, with approximately 32,000 species declared to be threatened with extinction, among which are 26% of mammals, 14% of birds, 33% of reef-building corals, 34% of conifers and 41% of amphibians globally [16]. Recently, the IUCN has been able to provide data that could be deployed as a metric to estimate the rates of species extinctions, but this algorithm may not accurately estimate possibly extinct species due to imprecise data regarding species’ adaptations to climate change, geographical shifting and anthropogenic activities [17].
Climate change and intensive land use complement each other, thus severely decreasing soil total biomass [18]. In addition, over the past decades, grasslands and forests biomes have been gradually transformed notably due to increased droughts and a decrease in soil health [19]. This has altered plant distribution and aided tolerant invasive plant species with the consequence of a loss of plant diversity [20]. Organisms are inter-dependable in an ecosystem, and recurring or prolonged drought, as recorded in the sub-Saharan region of Africa, could lead to the extinction of plant species with adverse effects on other species biodiversity [21].
This article provides an overview of the potential impact of climate change on species, emphasizes the general physiological response to heat and predicts species’ susceptibility to climate change by analysing vegetation photosynthetic activities, soil moisture anomalies, rainfall patterns and temperatures across Africa from 1999 to 2019. A comprehensive bibliometric evaluation of scientific publications on climate change-related articles in Africa was also conducted.

2. Methods

2.1. Space-Based Climate Data Analysis

Temperature and rainfall information of African countries (from January 1999 to December 2019) was acquired from the National Aeronautics and Space Administration (NASA) Prediction of Worldwide Energy Resource (POWER) database. This meteorological data are produced natively on a global 1° × 1° latitude/longitude grid and remapped to a 0.5° × 0.5° latitude/longitude grid through bilinear interpolation or replication. The data are thereafter processed, archived and made available through POWER’s Services Suite. The retrospective data analysis was derived from NASA’s GMAO MERRA-2 assimilation model and GEOS 5.12.4 FP-IT MERRA-2, a new version of NASA’s Goddard Earth Observing System (GEOS) [22]. The GEOS version 5.12.4 has the same grid resolution as MERRA-2 (they use the same physics model, fewer selected observations and surface rain gauge normalized precipitation). The GEOS 5.12.4 data are processed by the POWER project team daily and appended to MERRA-2 daily time series to provide low-latency products, which are usually ready within 2 days. The MERRA-2 values are updated every month. The data on rainfall and temperature for this study were collected from MERRA-2 and the retrieved data were reanalysed using ArcGIS 10.5.
African vegetation was studied from the year 1999 to 2019 using Fraction of Absorbed Photosynthetically Active Radiation (FAPAR) and data were collected from the Global Drought Observatory (GDO) database. However, substantial data were collected for the years 2001 and 2019 because of the availability of data. For vegetation photosynthetic activity, FAPAR was used to quantify the fraction of the solar radiation absorbed by plants. FAPAR data depend on the structure of the canopy, the optical properties of the vegetative part of plants, the atmospheric conditions and the angular configuration. The data collected for the years 2001 and 2019 for this study on the global drought observatory (study area: Africa Continent) system were evaluated using the web-based software provided by the Copernicus Emergency Management Service (CEMS). The technique used in this study helped in identifying the conditions of relative vegetation stress (negative anomalies) in extreme climatic conditions, such as drought or extreme heat, during the study period. Various vegetation conditions were identified using this method, including photosynthetic activities that were lower than normal, near normal and higher than normal. Soil moisture anomalies, temperature and rainfall distribution over Africa were assessed during the study period. More importantly, the soil moisture was evaluated in this study to assess the soil health using belowground species as bioindicators, with a preference for earthworms.

2.2. Bibliometric Data and Analysis

In the systematic section of this paper, data were collected electronically from Scopus and ISI Web of Science (WoS). These databases are considered to be suitable and reliable for bibliometric analyses due to the wide scope of scientific articles [23,24]. Articles related to climate change in Africa were collected using the keywords “climate change” and “species interaction” and “Africa” in combinations to query the databases. The keywords were connected with the Boolean operator “AND” in the databases and two-word keywords were enclosed using Boolean strings in Scopus.
The query was run in the Scopus and WoS search engines in “All fields” of the databases from January 1999 to December 2019, which returned 1343 and 349 articles, respectively. Afterwards, the articles were limited to countries in Africa, returning 283 articles in Scopus and 266 articles in WoS. The data were further cleaned manually, eliminating articles that did not fit the scope of the study, using two specific measures to determine whether the paper was appropriate for the bibliometric analysis.
(1) Inclusion criteria: the literature was limited to research articles, reviews and book chapters. Articles from Africa and/or literature whose data were from Africa were considered. Articles with predictive models for species’ responses to climate change and laboratory-simulated climate change targeting species’ responses were considered.
(2) Exclusion criteria: non-English articles, letters, proceeding papers, correction addition, case reports and editorial materials were excluded. Articles addressing the impacts of climate change, but on a global scale, although relevant, were considered to be outside the scope of this study.
The analytics tools of WoS and Scopus were used to export the data in BibTeX file format. The files were imported to RStudio version 3.6.3 with the installed bibliometric package and dependencies as described [25,26,27]. The bibliometric parameters, including annual scientific production, most productive authors, total citations per country, most cited articles, collaboration networks, citation networks and bibliographic coupling, were extracted from the BibTeX file with appropriate command codes. The relationship between topics, authors, institutions and countries was studied using clustering algorithm software, VOSviewer version 1.6.15, as described by Perianes-Rodriguez et al., (2016) [28]. VOSviewer was used to construct and visualize desired bibliometric maps from the bibliographic database files, using fractional counting mode of calculation. The bibliometric maps were then used to illustrate the co-authorship network, keywords co-occurrence, bibliographic coupling and conceptual structure of the citation network. The size of circles in the R analysis and VOSviewer visualization maps represents strength, the thickness of links and the distance between two terms indicates the correlation. Additionally, terms related to each other are grouped in clusters with a certain colour.

3. Results

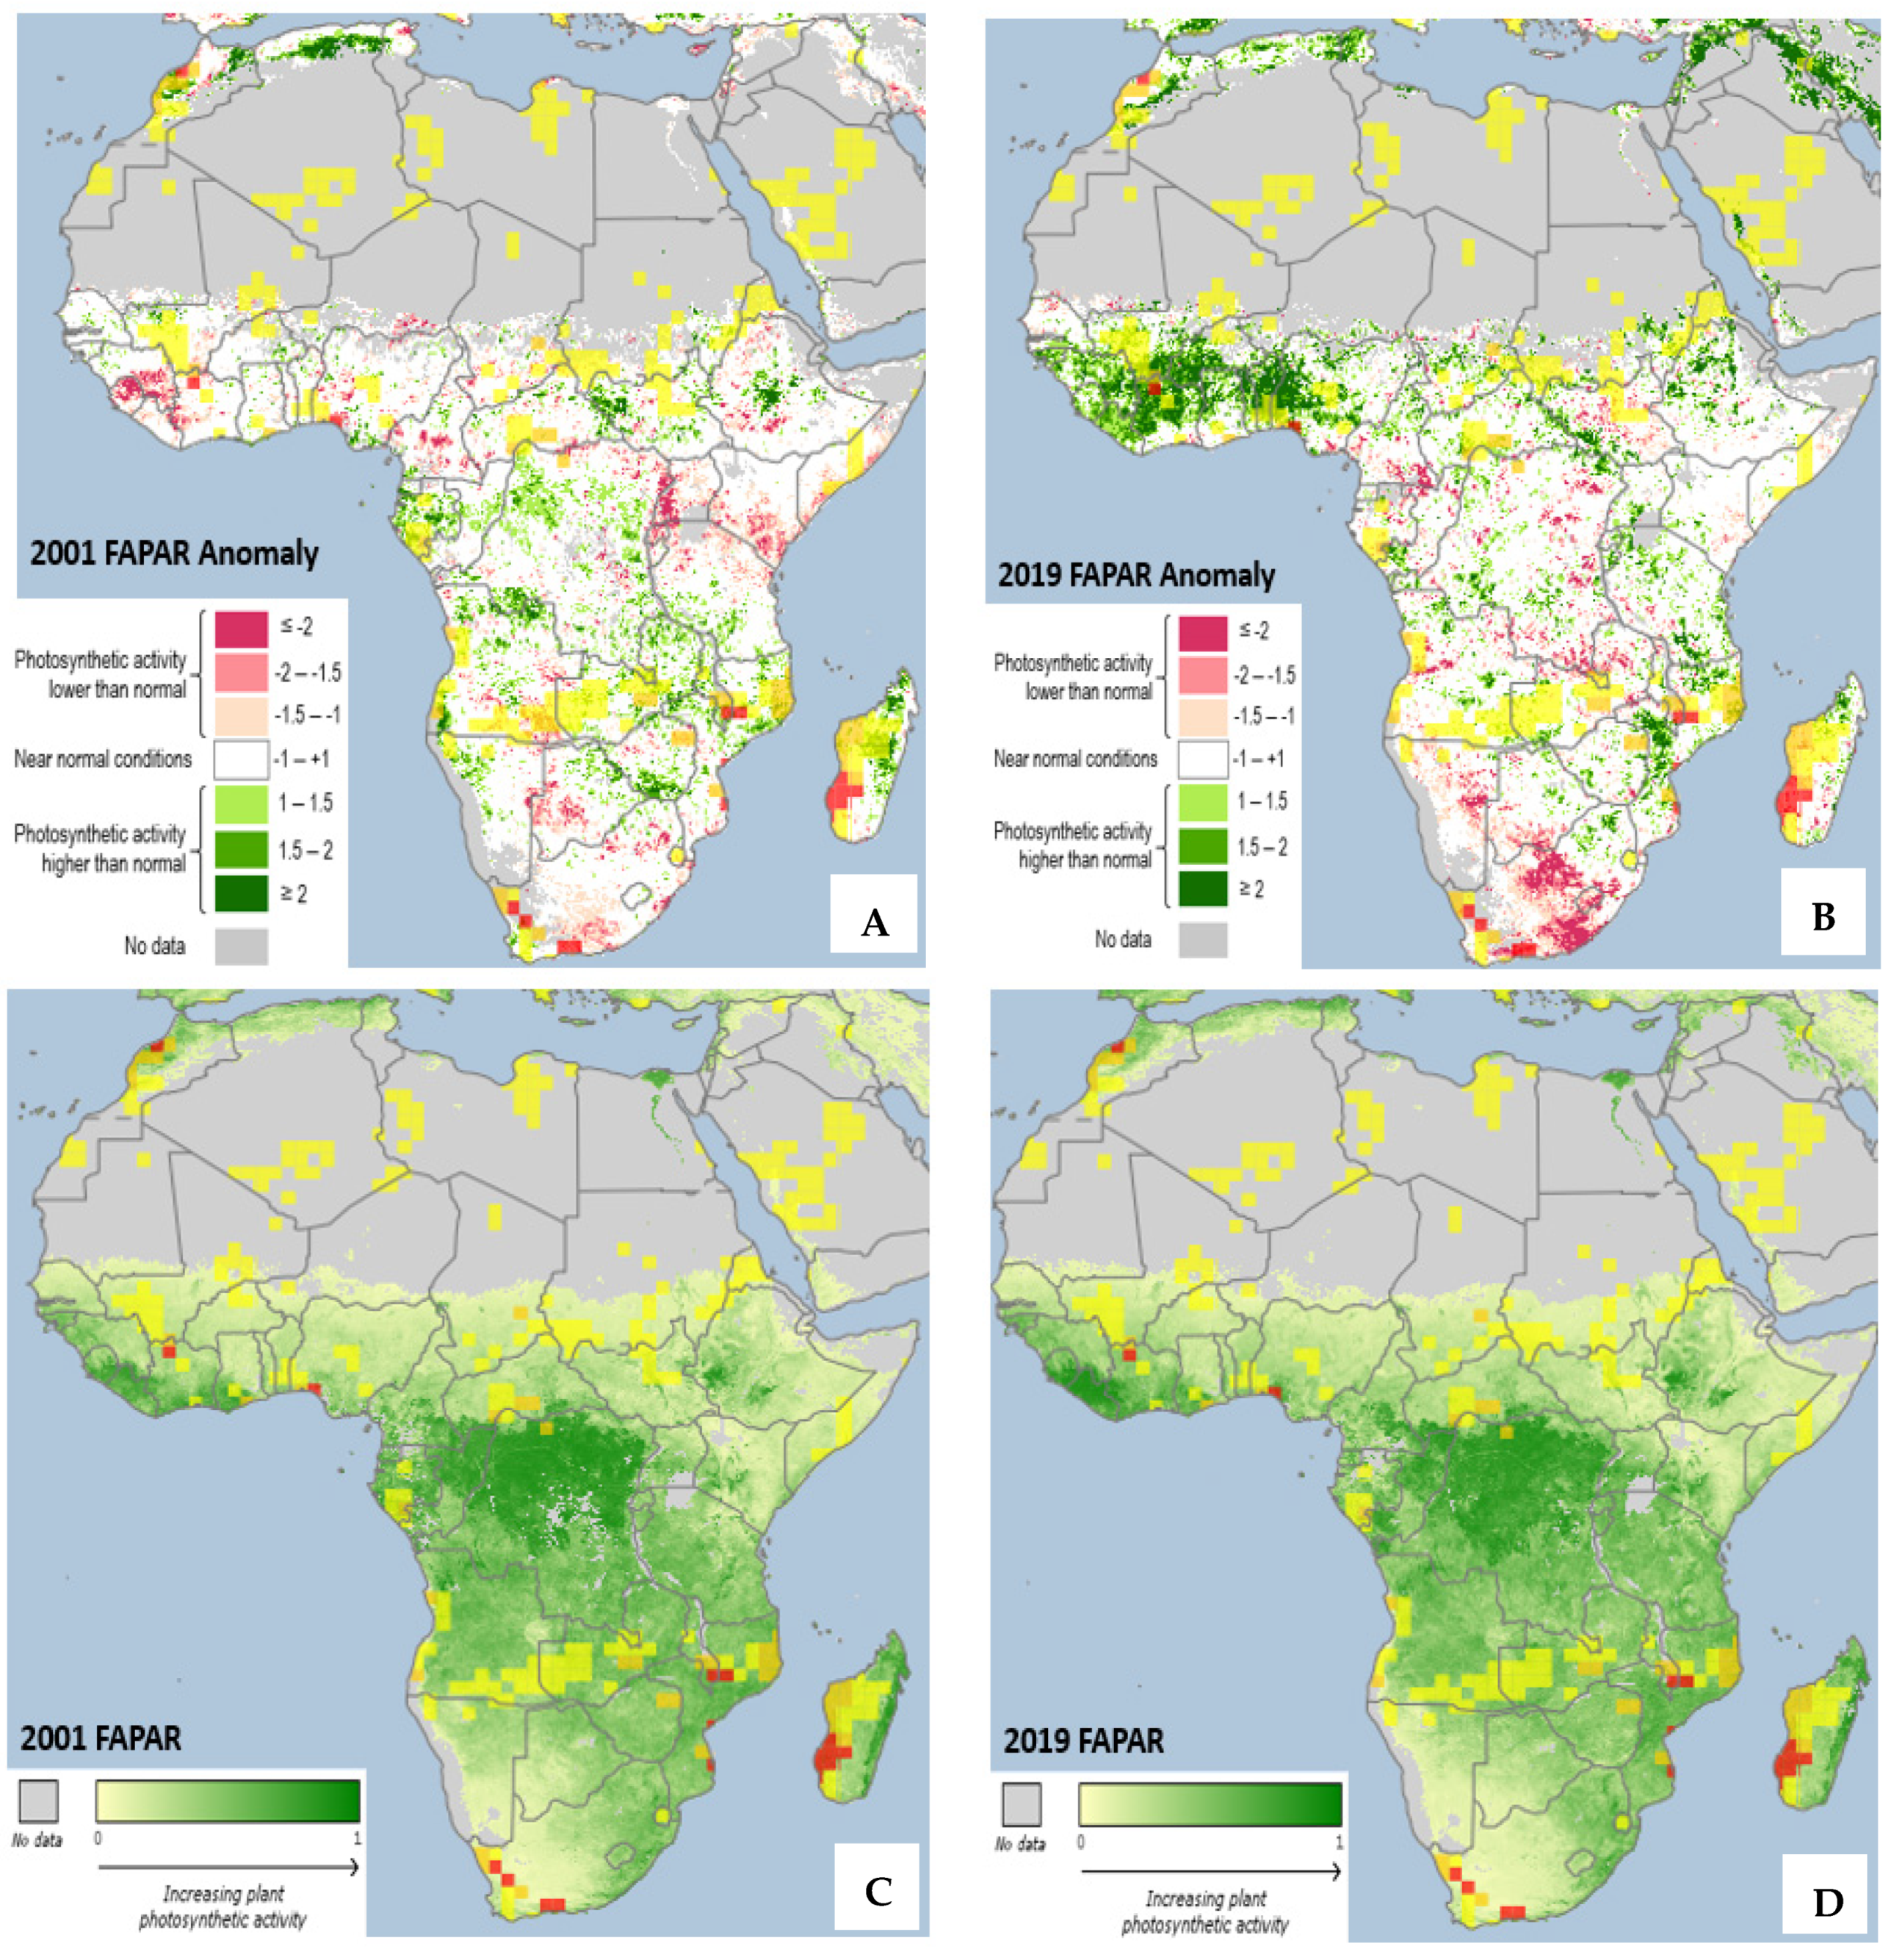
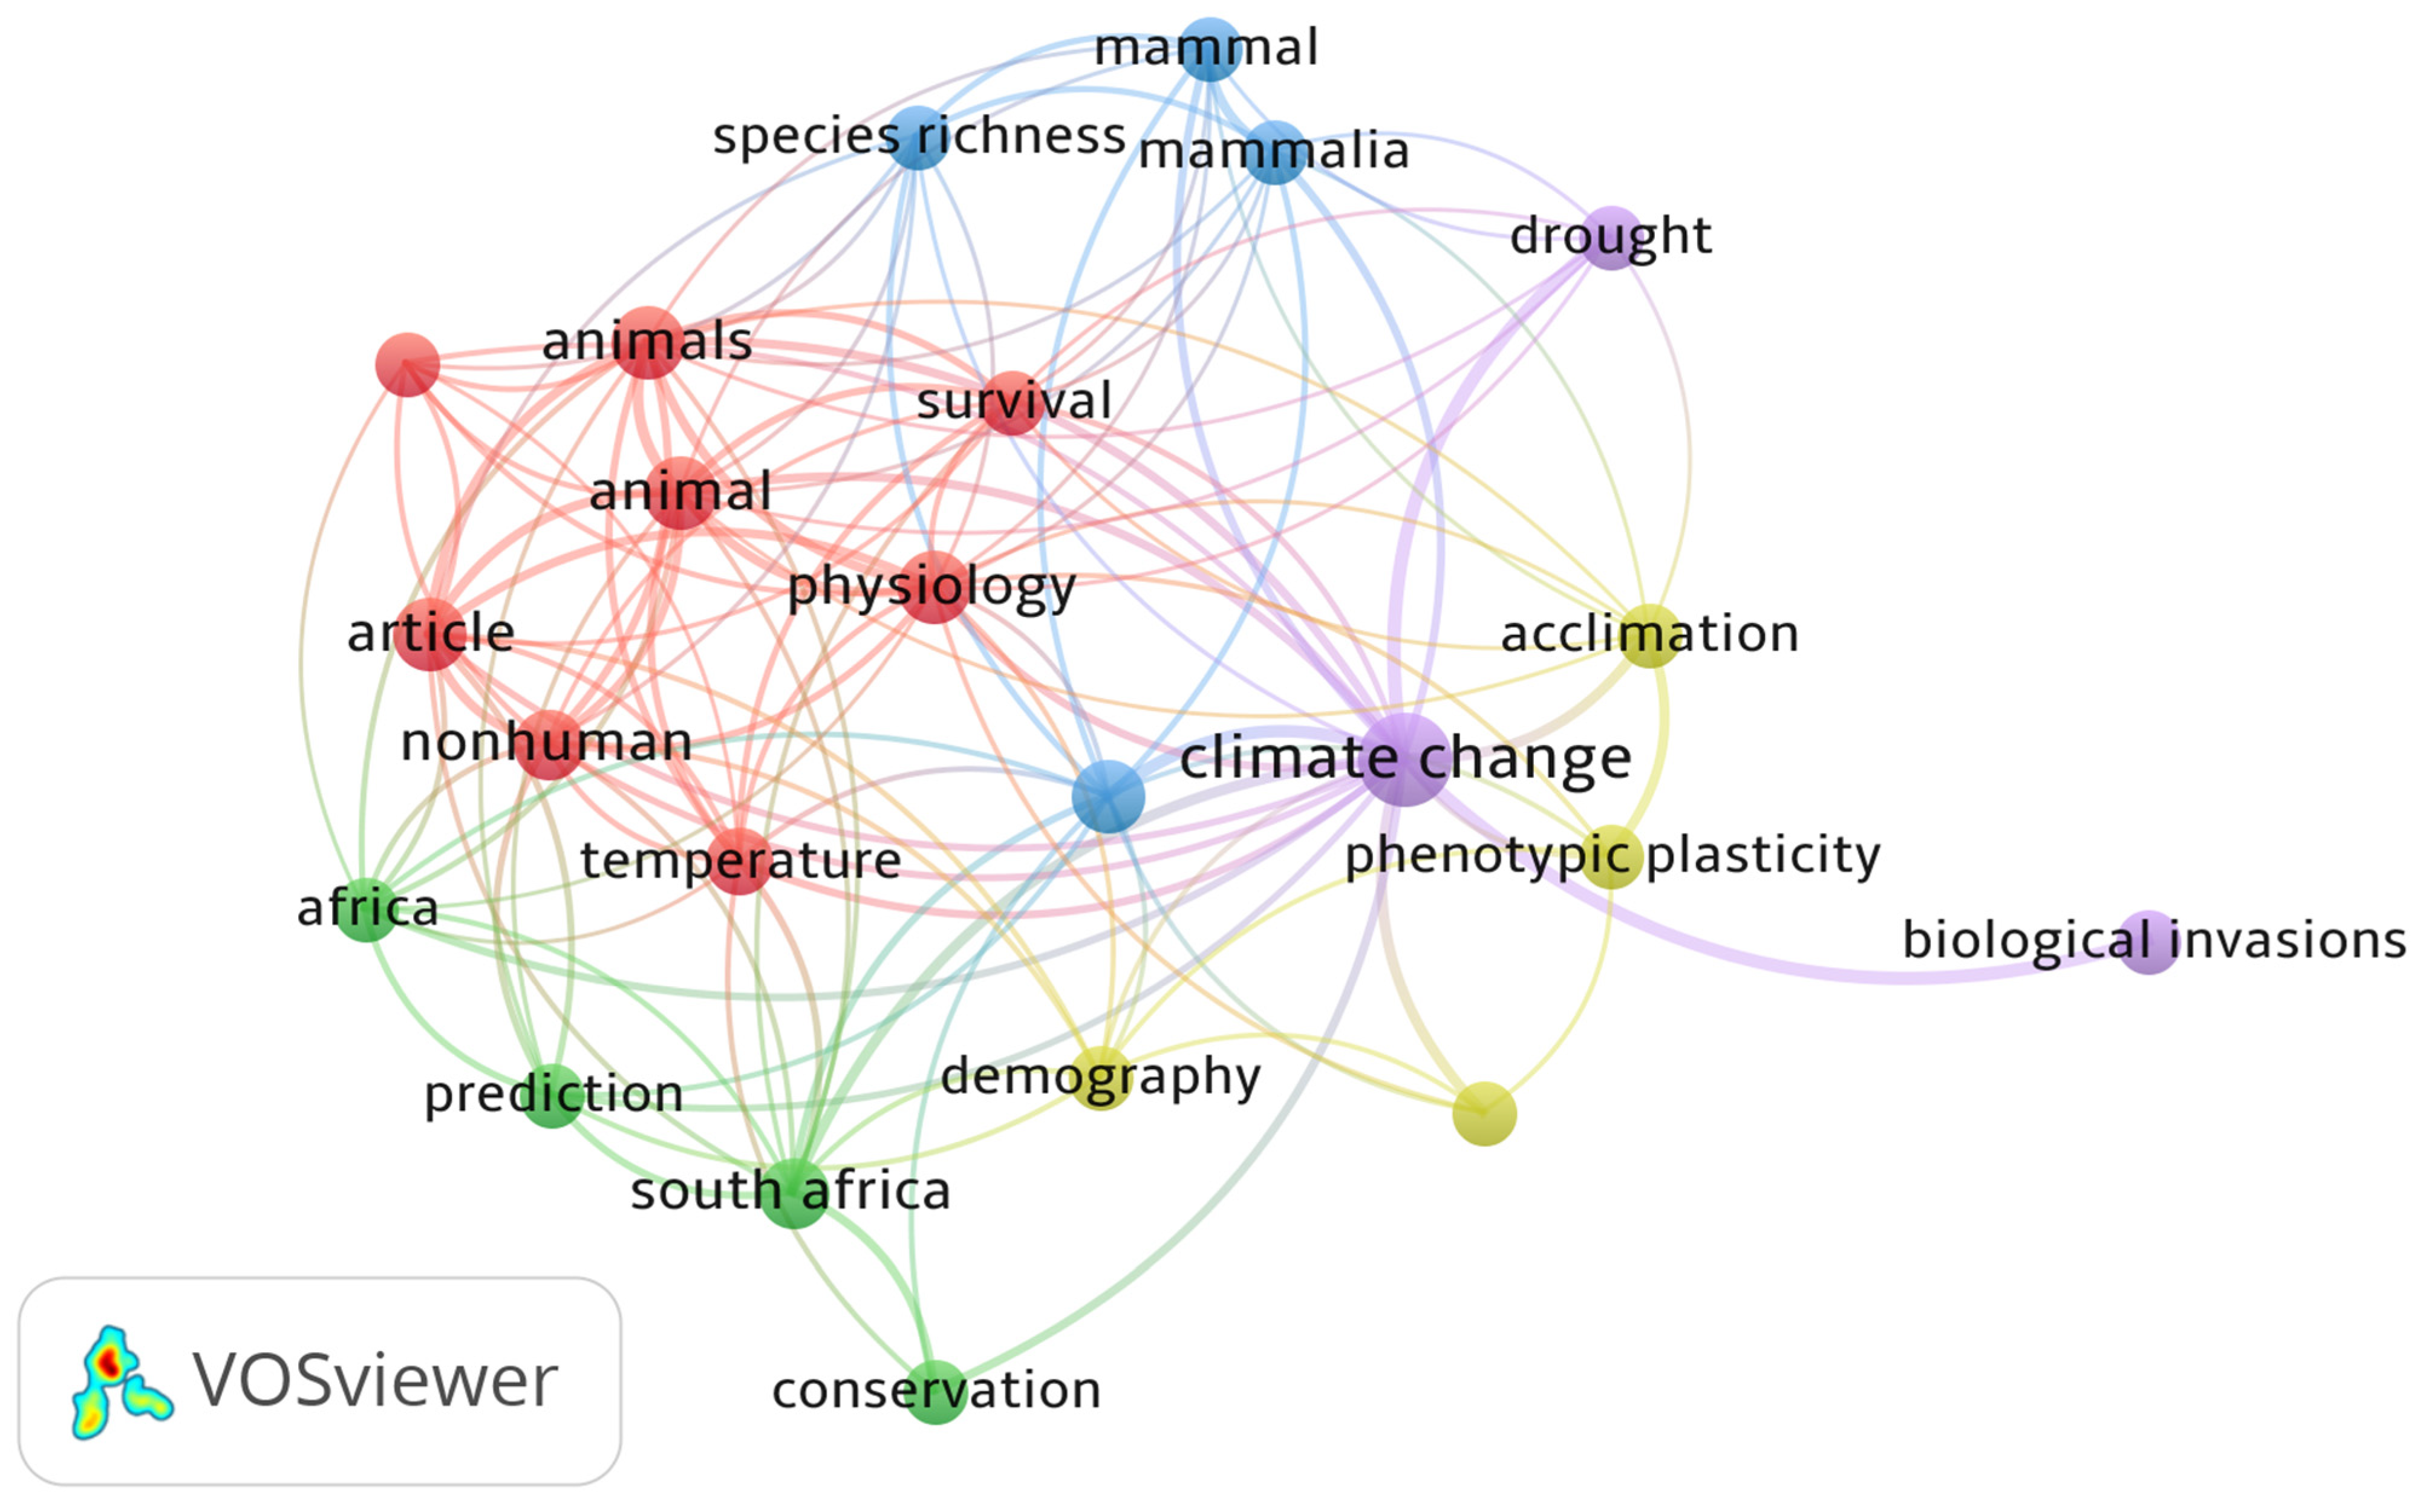
3.1. Vegetation Response to Climate Change

The information in Figure 1 presents the vegetation response to climate change based on the Fraction of Absorbed Photosynthetically Active Radiation (FAPAR) data and their anomalies for the years 2001 and 2019. Plant photosynthetic activities are vegetation biomarkers that appear in response to environmental stressors, especially climate-related events. The results from the analysis highlight the conditions of relative vegetation stress (negative anomalies) in extreme climatic conditions, such as drought or extreme heat, during the study period. Various vegetation conditions were identified: (1) photosynthetic activities are lower than normal, (2) near normal and (3) higher than normal.
In 2001, it was observed that there were variations in the spatial distribution of the vegetation response to climate-related factors. The north of the continent (Morocco and Tunisia) and Central Africa (South Sudan and Central Ethiopia) have higher-than-normal photosynthetic activity, whereas Cameroon, Kenya, Uganda, Burundi and part of Tanzania experienced lower-than-normal and near-normal conditions. The southern parts of the continent show a diverse range of photosynthetic activity from below normal, near normal to above normal. Zimbabwe, South Africa, Lesotho and Eswatini, among others, are examples of countries with diverse photosynthetic activity determined using data from FAPAR anomalies (Figure 1A).
Surprisingly, in western Africa (Nigeria, Benin, Togo, Ghana, Burkina Faso, Côte d’Ivoire, Liberia and Sierra Leone), vegetation photosynthetic activities seem to increase from the year 2001 to 2019. On the contrary, the photosynthetic activity of southern and Central African vegetation is reduced from 2001 to 2019 (Figure 1B). This is an indication and can be interpreted as showing increasing levels of drought. The northern and central parts of the continent remain unchanged in the year 2019 as compared to the photosynthetic activity in the year 2001. The variation in the distribution patterns, as stated above, may be caused by climate-related stressors [29,30] and anthropogenic activities [29]. The variation leading to a decrease in photosynthetic activities, as shown in Figure 1A,B, may be caused by the direct or indirect impact of the soil and belowground organisms, which could subsequently affect agriculture and, hereafter, threaten food security [31].
The observed FAPAR activity shown in Figure 1C,D reveals that there is no significant difference between the vegetation distribution pattern across the continent in 2001 and 2019 as presented (Figure 1C,D). The northern and warmer regions of the continent, however, show no photosynthetic activities.

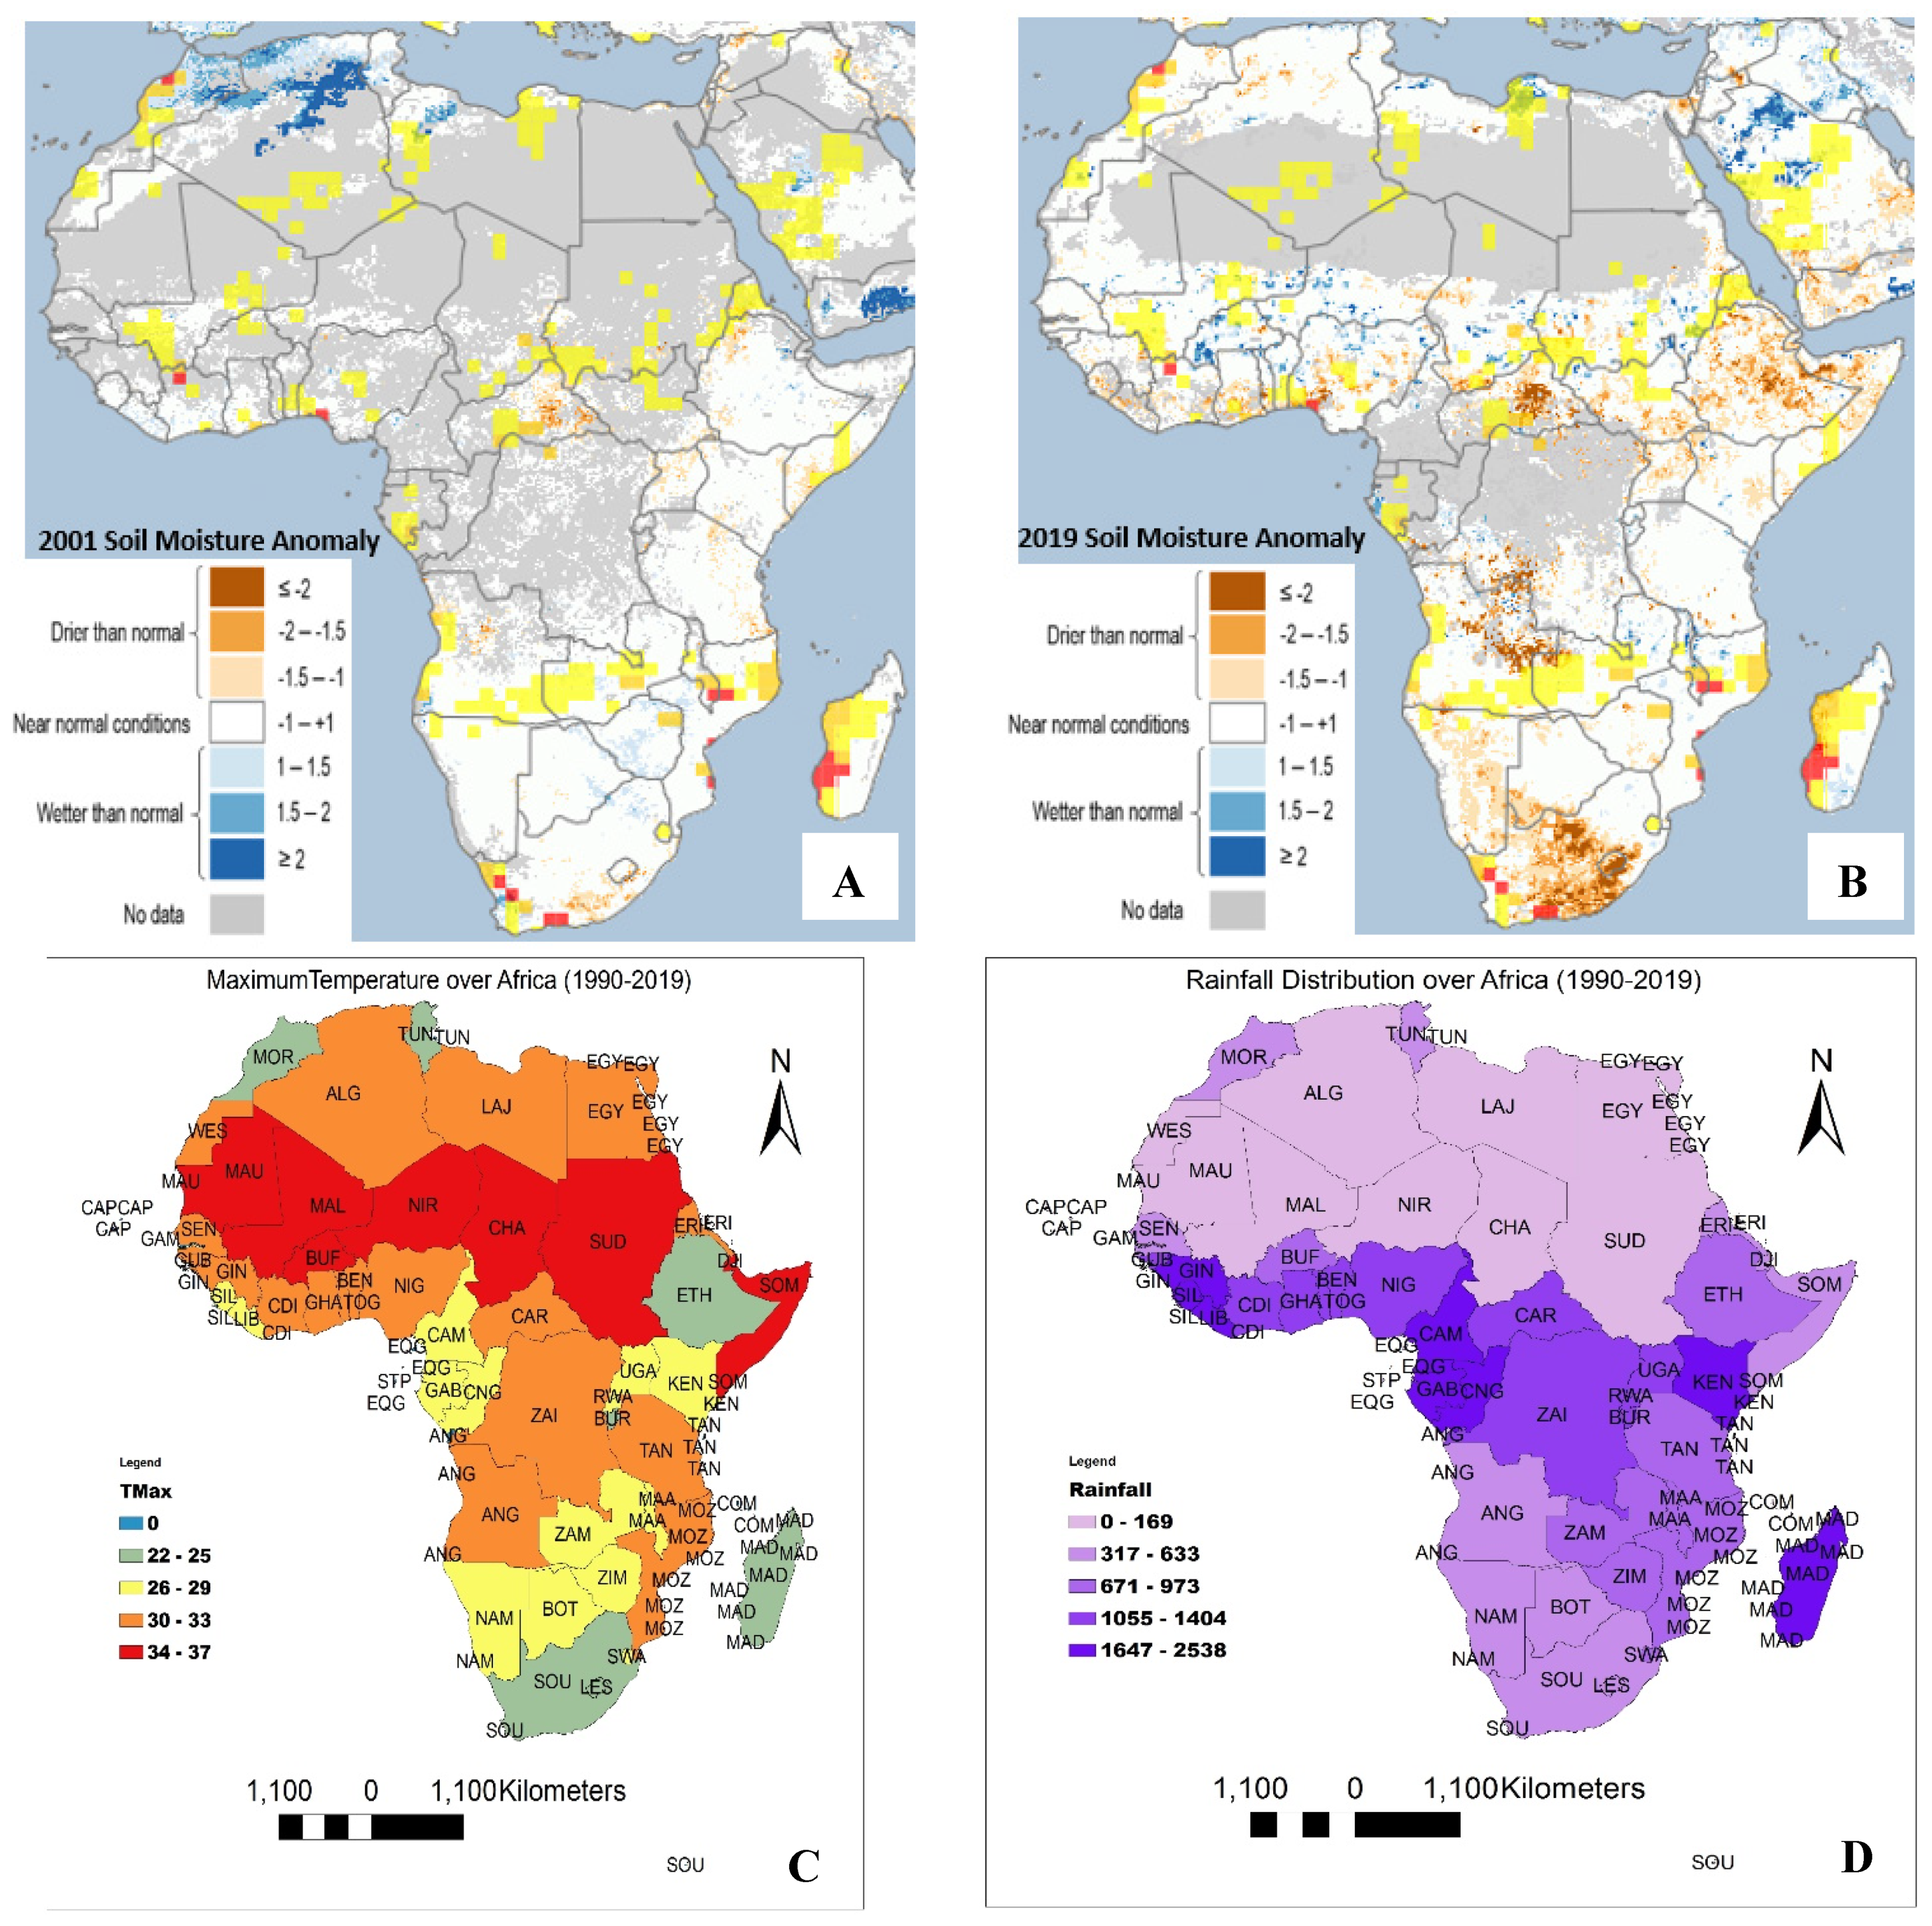
3.2. Soil Moisture Anomaly, Temperature and Rainfall Distribution

Soil moisture anomalies for the years 2001 and 2019 are represented in Figure 2A,B. The temperature and rainfall distribution in Africa in the year 1990 to 2019 are presented in Figure 2C,D. Soil moisture was evaluated in this study to assess the performance of belowground species with a preference for the earthworm, which could be used as a bioindicator for soil health assessments [32].
Earthworms show optimum growth and reproduction at 20–25% soil moisture, as reported by Berry and Jordan (2001) [33]. This range is considered to be normal and near normal at (−1 to 1) in this study. Soil moisture anomalies were categorized into: drier than normal (−1 to −2 and less), near normal (−1 to 1) and higher than normal (1 to 2 and higher). Figure 2A reveals that most countries in southern and eastern Africa have soil moisture that is ‘near normal’, and very few areas in these regions have soil moisture ‘wetter than normal (−2 to 1.5)’. Figure 2B reveals that southern and eastern Africa currently have lots of regions with soil moisture that is ‘drier than normal’. Central and western African regional data reveal that most countries have soils that were ‘drier than normal’ in the year 2019. Northern African regions, such as Morocco, Algeria, Tunisia and Libya, had some parts with soil that was ‘wetter than normal, (1–2)’ in the year 2001, but these areas became “near normal” in the year 2019. There is an obvious increase in the level of drought, as shown in Figure 2. The continuous decrease in soil moisture threatens belowground species; thus, soil with a lesser richness of belowground organisms may quickly lose the buffering capacity and resistance toward the detrimental effects of climate change [34]. Consequently, food production and food security could be severely negatively impacted.
Elevated temperature and less moisture reduce belowground species richness [33,35], wherein earthworms play a big role in buffering the warming of the belowground ecosystem [34]. In order to predict the prevalence of belowground species with a preference for the earthworm, the optimum temperature (20 °C) and soil moisture (20–25%) reported for earthworms [33,35] were used as a benchmark. The soil surface temperature and rainfall distributions were used to predict the soil species richness and soil health. Figure 2C,D show different variations across the continent. Figure 2C reveals that South Africa, Madagascar, Ethiopia, Burundi, Morocco and Tunisia have soil temperatures ranging from 22 to 25 °C; however, all these countries are close to the coastlines. This temperature range favours belowground species. It is worth noting that among these countries, southern Africa has a low rainfall of 317–633 mm annually (Figure 2D), which might reduce the soil moisture below 20%; hence, most of the soils may be unfavourable to soil species, particularly earthworms. The coastal countries, such as Cameroon, Gabon, Equatorial Guinea and Kenya, are probably likely to support a high diversity of belowground species due to the temperature (26 to 29 °C) and high amount of rainfall. Other coastal countries, including Senegal, Guinea Bissau, Sierra Leone, Liberia, Ghana, Nigeria, Eritrea and Djibouti, with temperatures below 33 °C, very high rainfall and high relative humidity, are also likely to support a moderate diversity of soil species. High soil biodiversity is beneficial to agriculture, particularly in countries with a high reliance on the climate for crop production [13]. The countries with temperatures of 34–37 °C, as shown in Figure 2C, and low rainfall (317–633 mm) annually (Figure 2D) are likely to experience seasonal or extended drought. They are the most vulnerable to the impact of climate change in Africa.

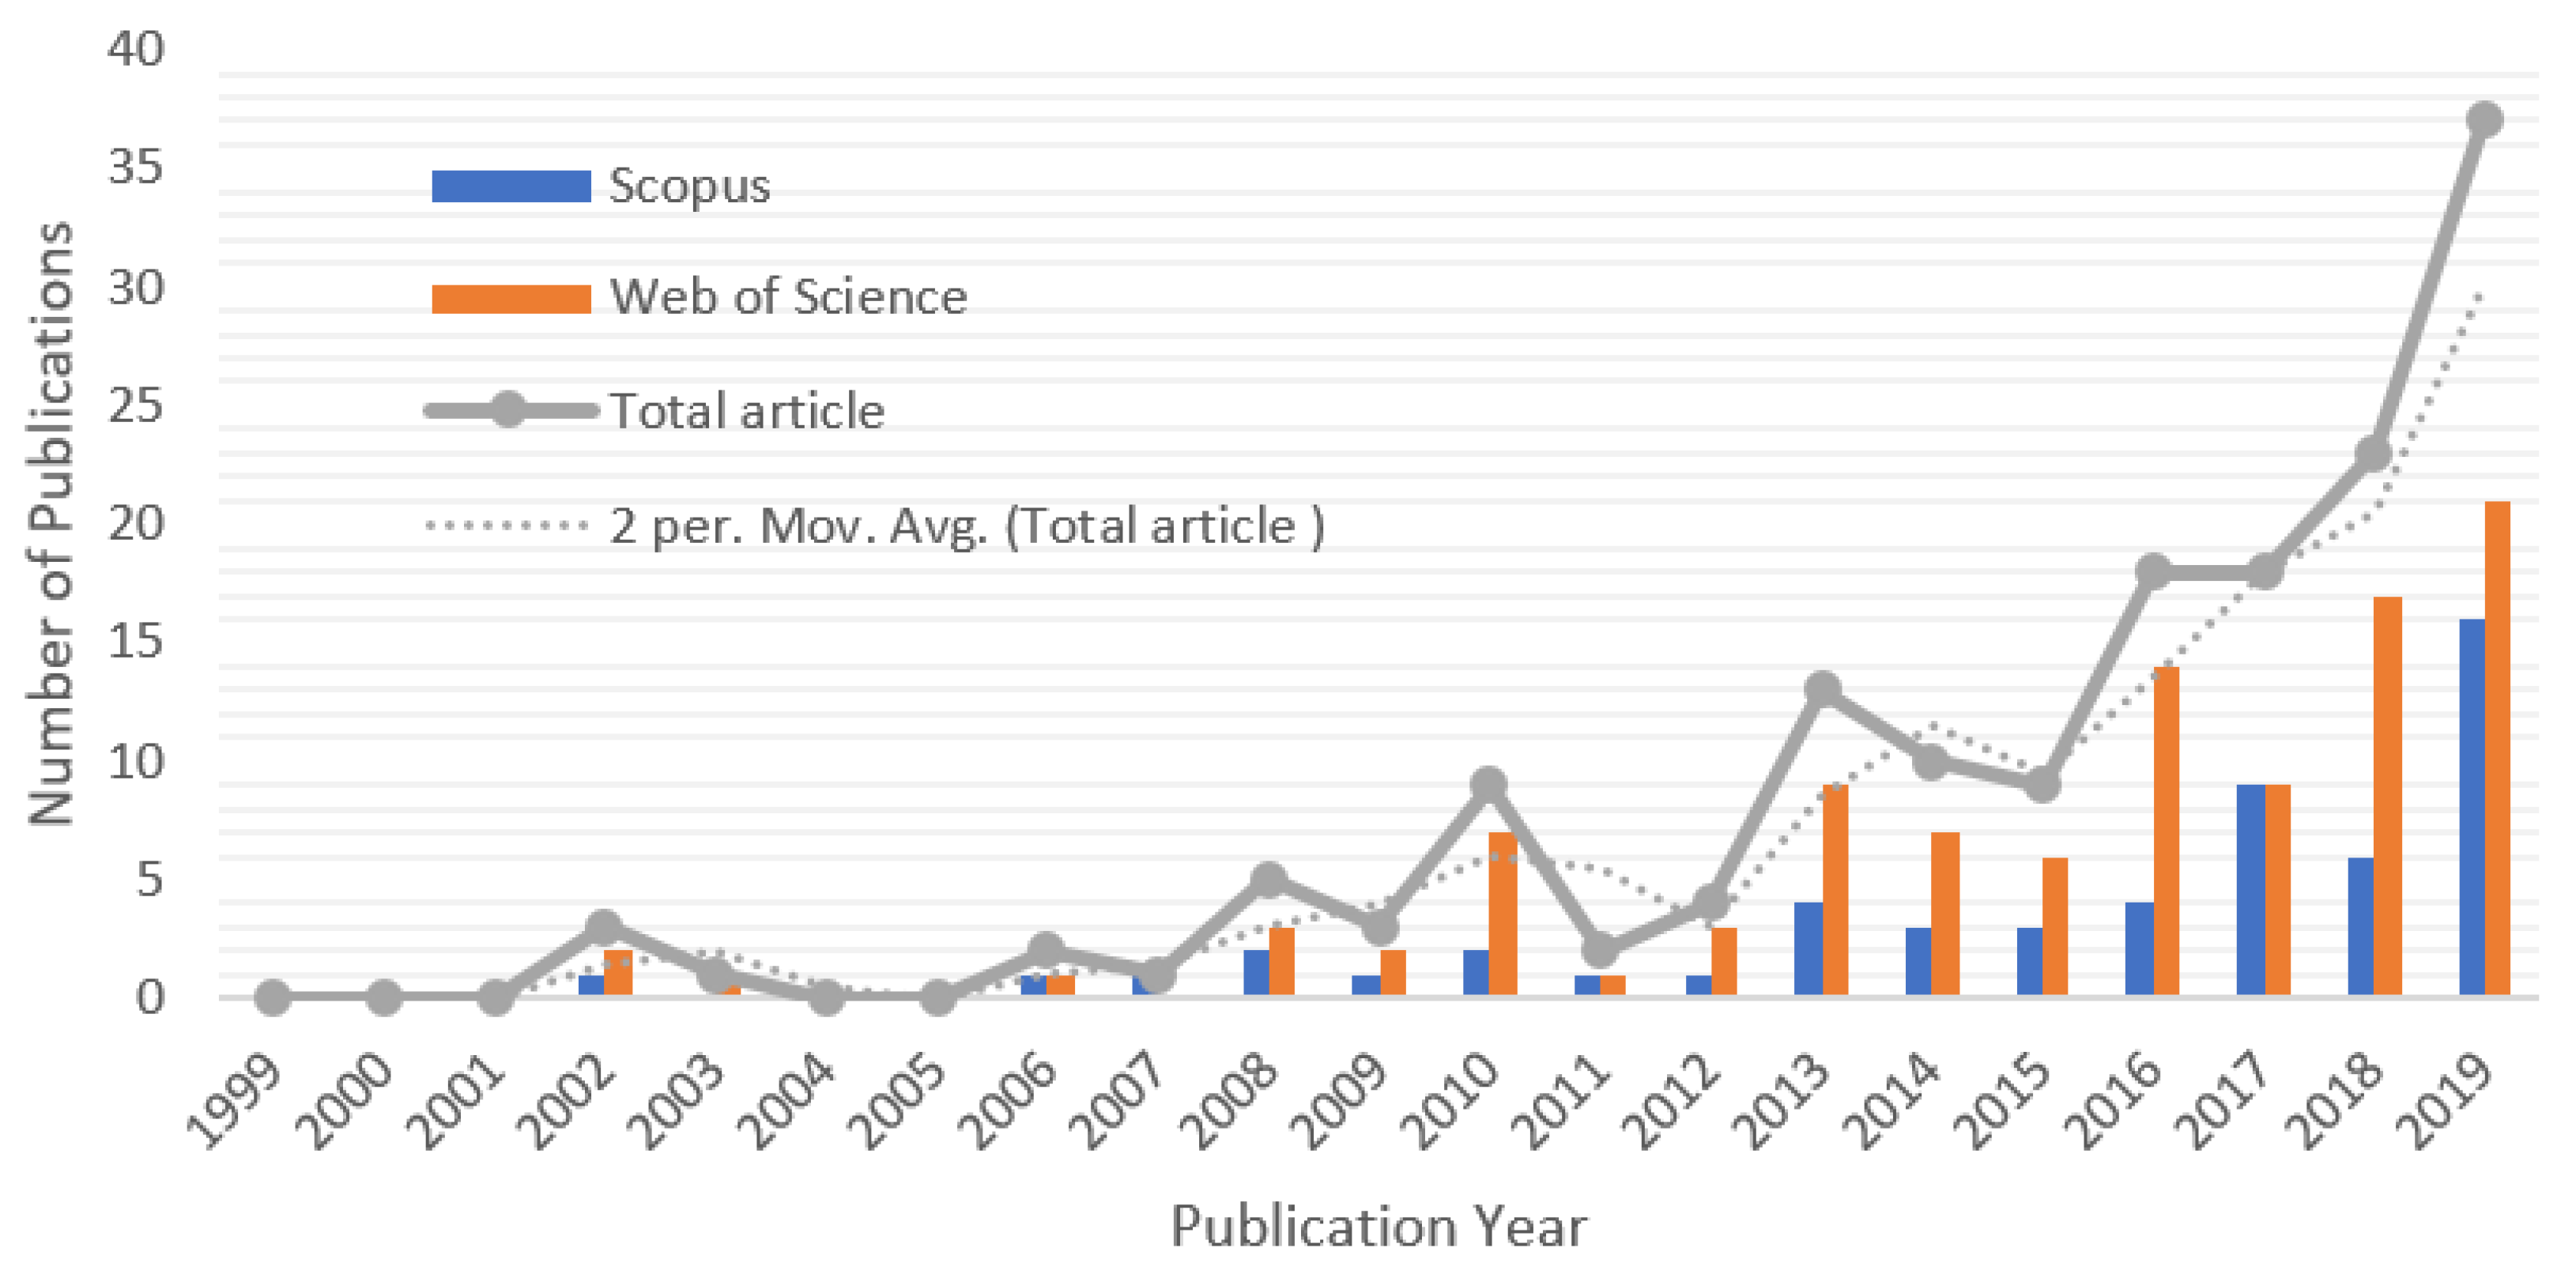
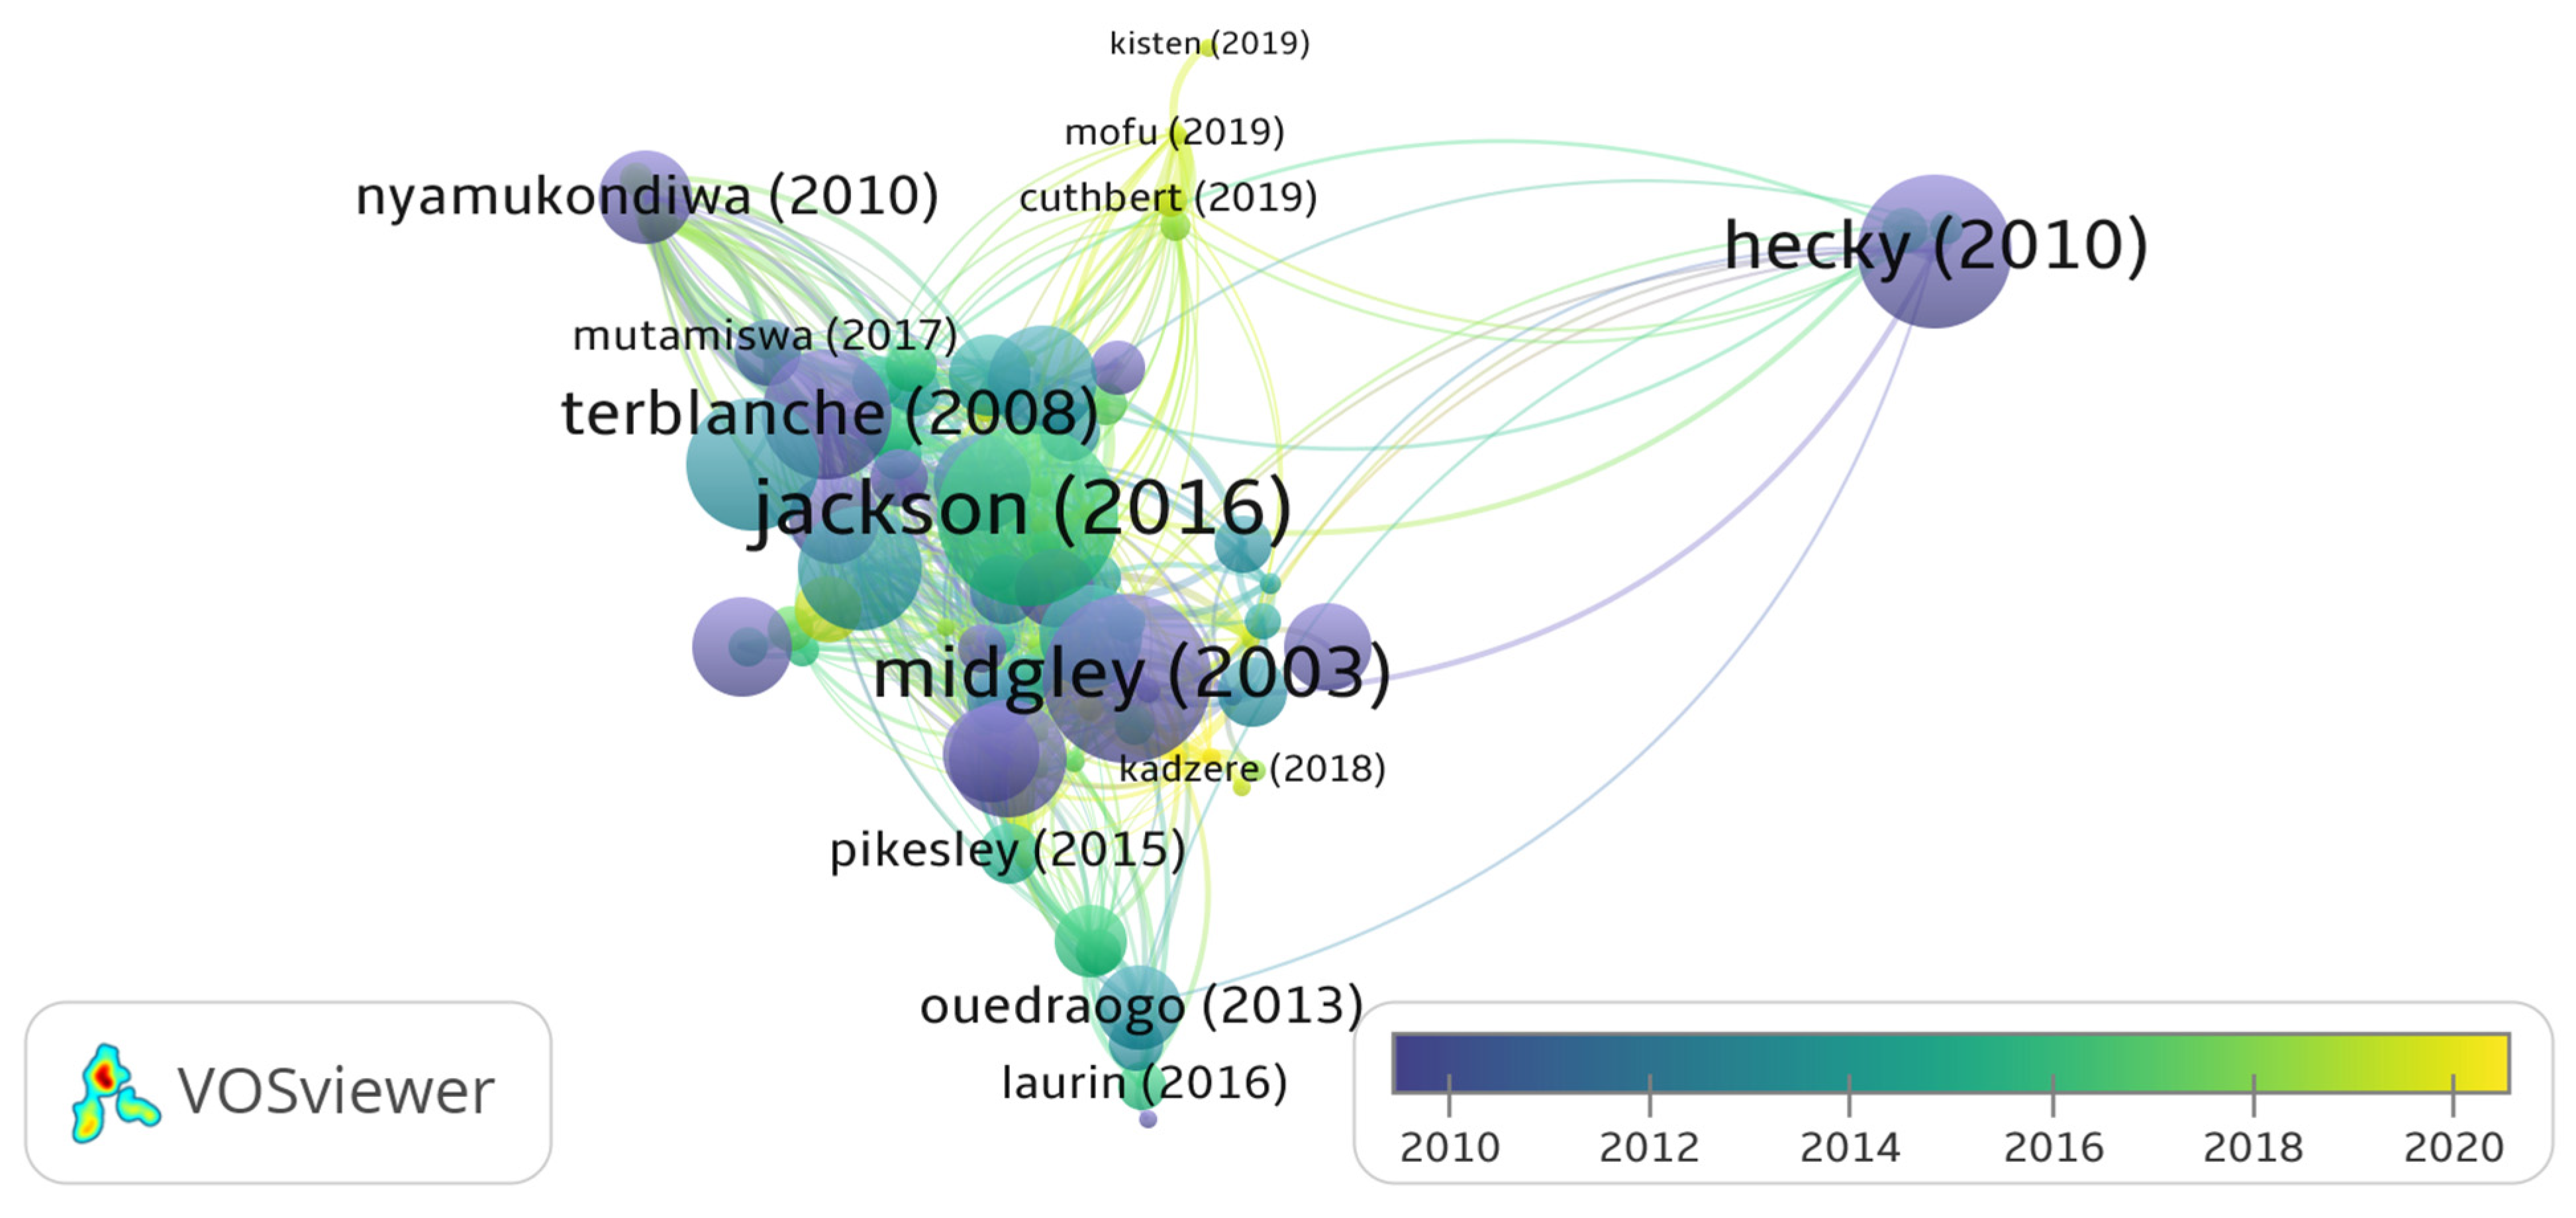
3.3. Progress of Research on African Climate Change from 1999 to 2019

Bibliometric studies have been a very useful tool for creating a structure from large amounts of information, deducing research impact, predicting research trends over time, quantifying scientific publications and identifying shifts in discipline boundaries [26]. In this study, a total of 55 and 103 articles met the inclusion criteria and were considered to be eligible for the study.
The articles from the two databases were merged and the duplicates were removed, resulting in a total of 150 articles from 112 publishers. There was a total of 692 contributing authors; 6 of the articles are single-authored, and the rest have an average number of authors of 4.61 per article. The articles received an average number of 27.85 citations (Table 1) each. This is an indication of the relevancy and impact of the articles. However, citation distributions for articles aged 5 years or more are highly skewed [36]. It was observed that articles aged 5 years old and above in this study contributed more to the reference distributions. The publications increase steadily each year, with an expected increase in the number of citations per article and the relevancy of climate change-related articles. Figure 3 shows the annual contributions of research tailored to African climate change in the two databases from 1999 to 2019. According to the data collected, there was a quiet time for researchers on climate change in Africa until 2008. The number of research outputs, however, increased rapidly from 2008 to 2019, indicating an exponential trend of awareness and rise in climate change-related research in Africa. It is noteworthy that the year 2019 published the highest number of scientific articles (n = 37), which could be due to an increase in awareness of climate change.

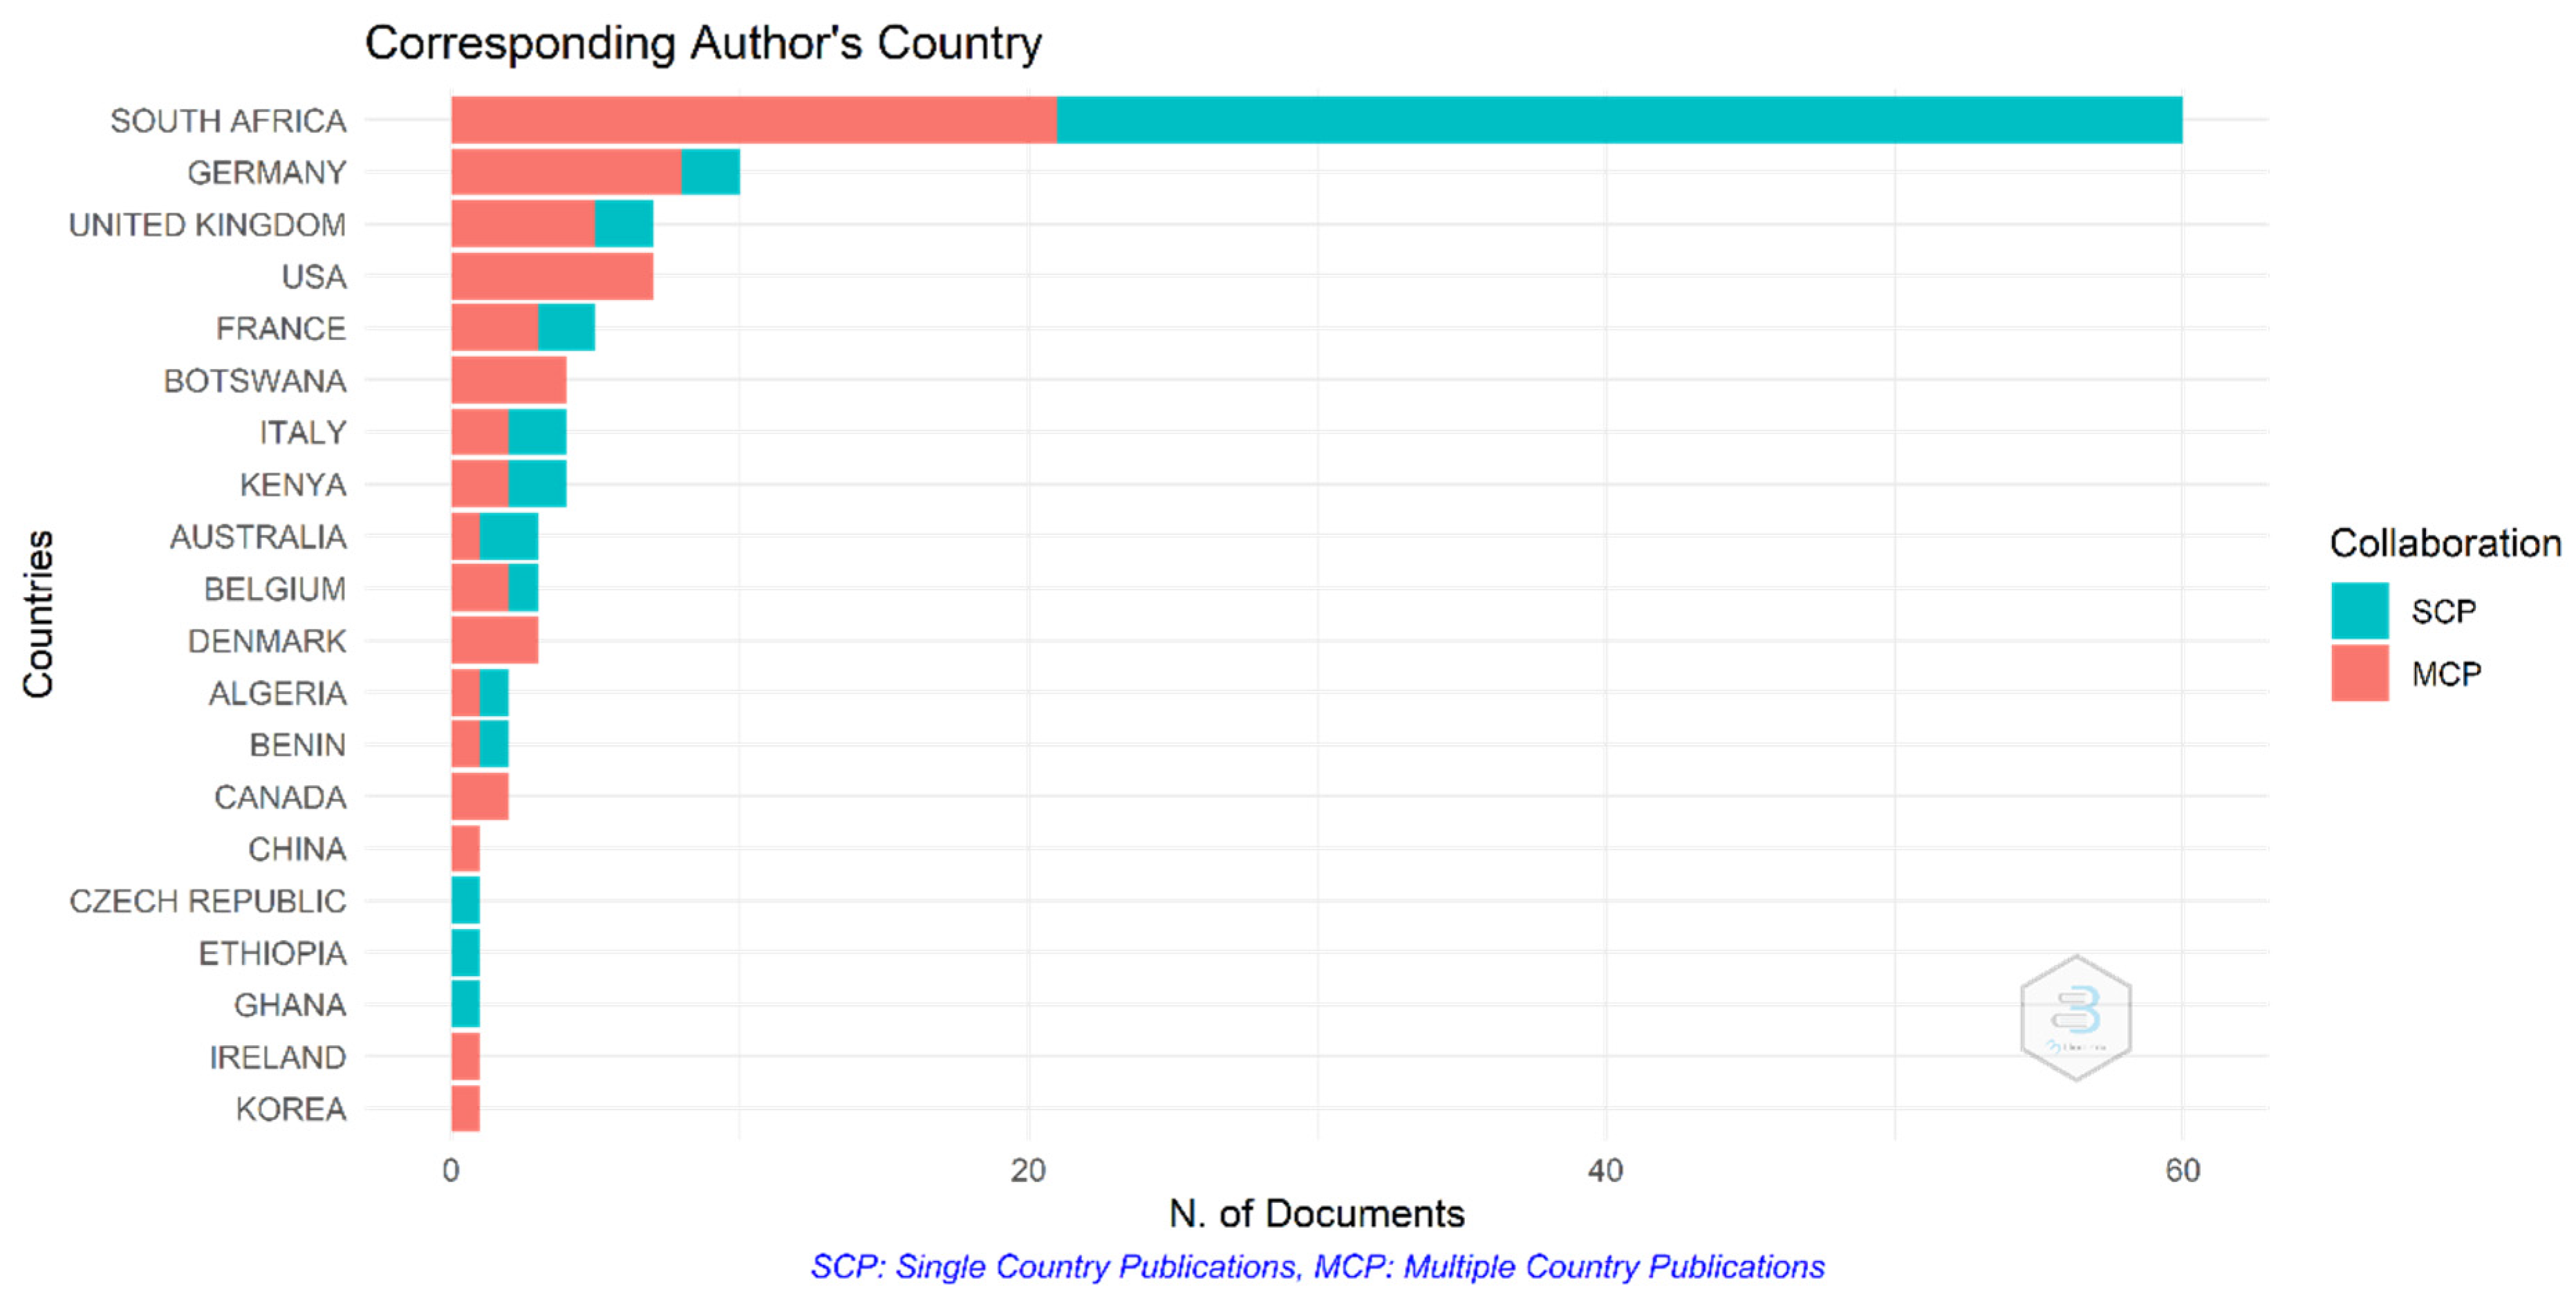
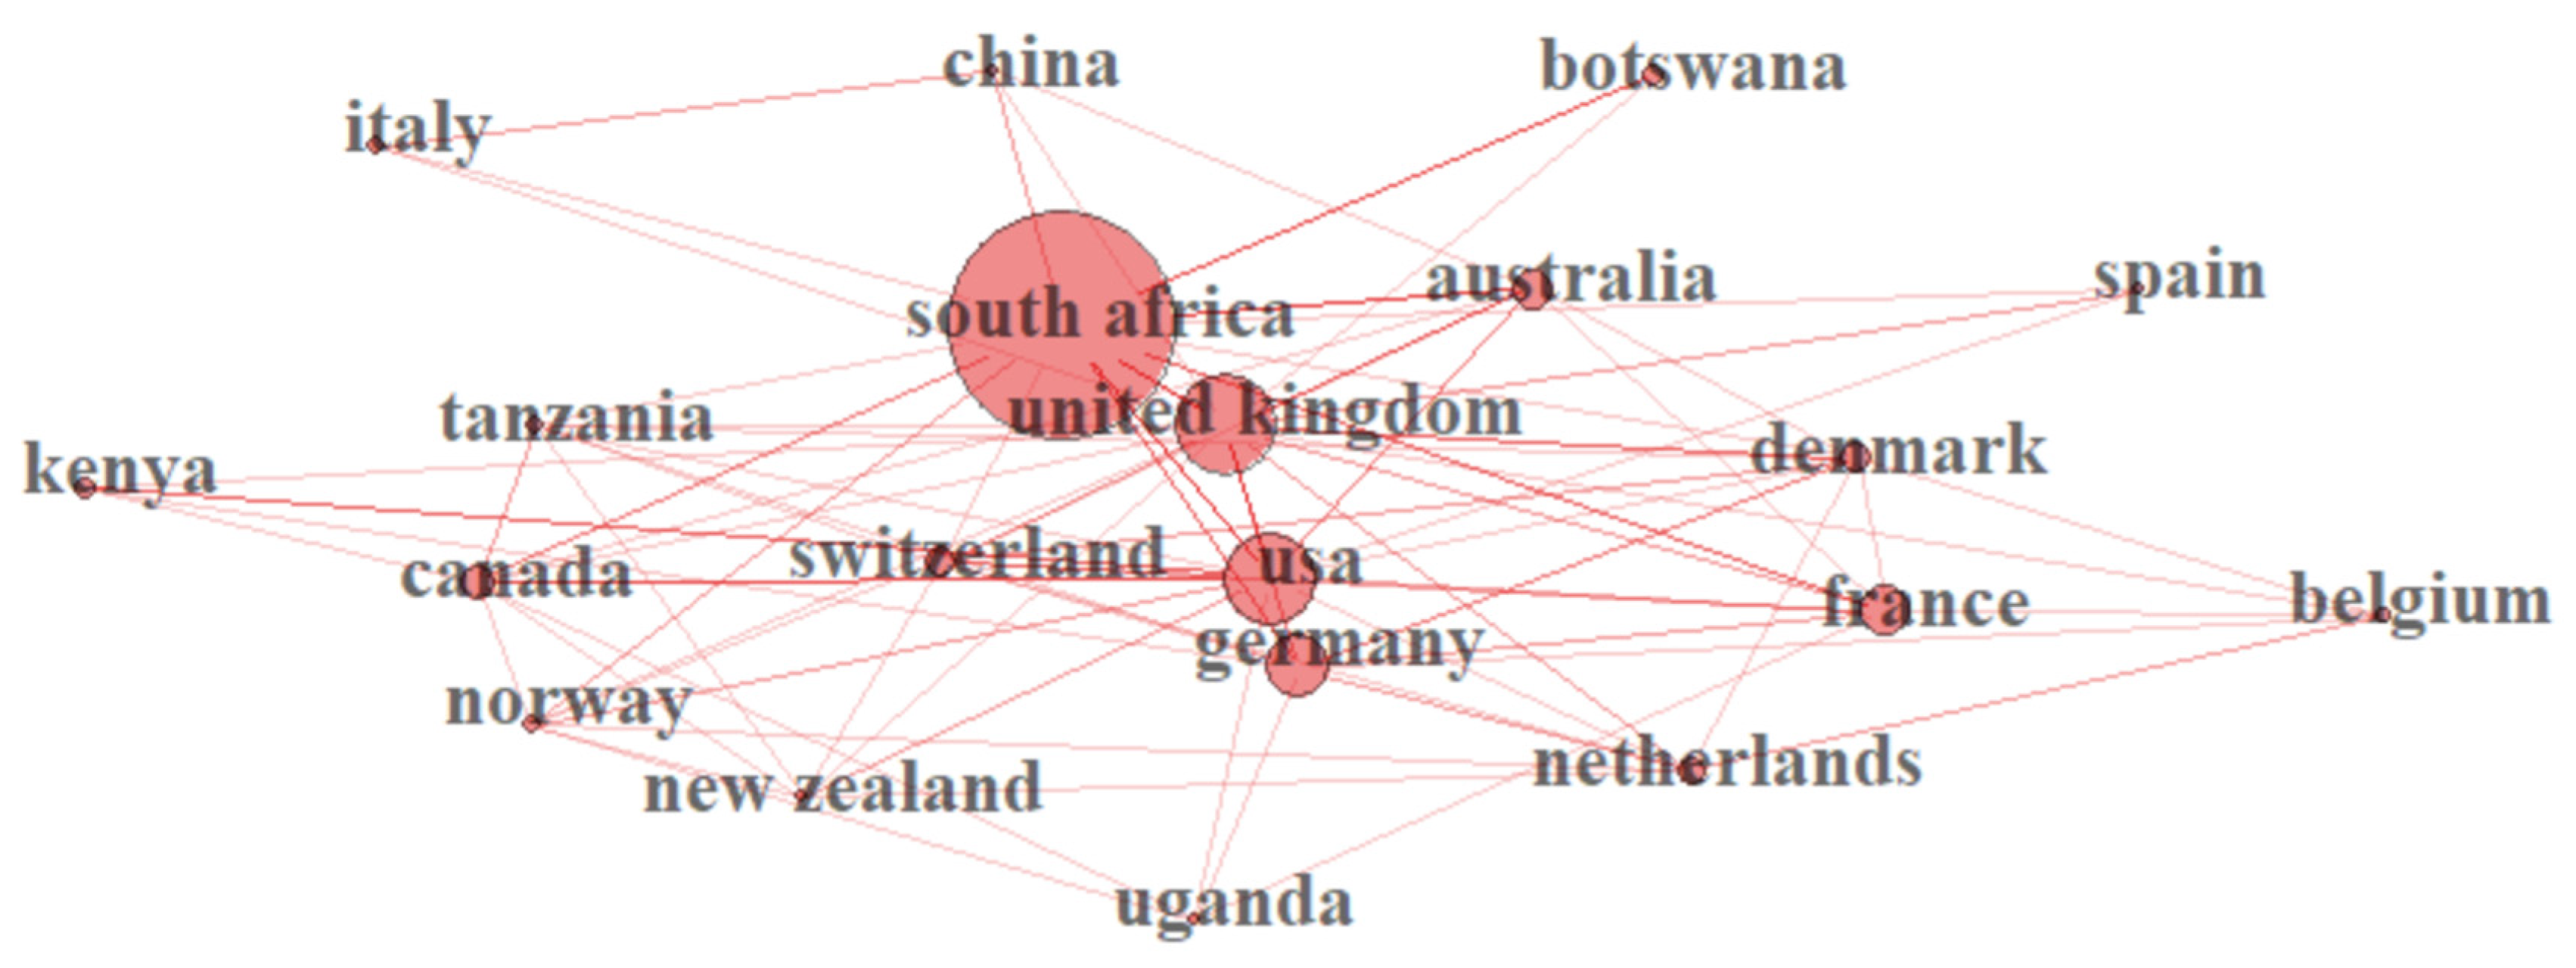
3.4. Most Productive Countries in Africa Regarding Climate Change

South Africa produced a total of 58 articles (38.6%) in the study period, among which 39 articles are Single-Country Publications (SCP) (Figure 4). Astonishingly, other countries outside Africa, including Germany, the United Kingdom, the United State of America and France, also partake in the study of climate change in Africa, with a total publication of 11, 7, 7 and 5 articles, respectively. However, African researchers are the major collaborators in these articles (Multiple-Country Publications (MCP)). Belgium surprisingly published three SCP on climate change in Africa within the study period (Figure 4). Kenya, Benin, Ethiopia, Ghana, Madagascar and a few other African countries also contributed to climate change-related articles within this study period (Figure 4).

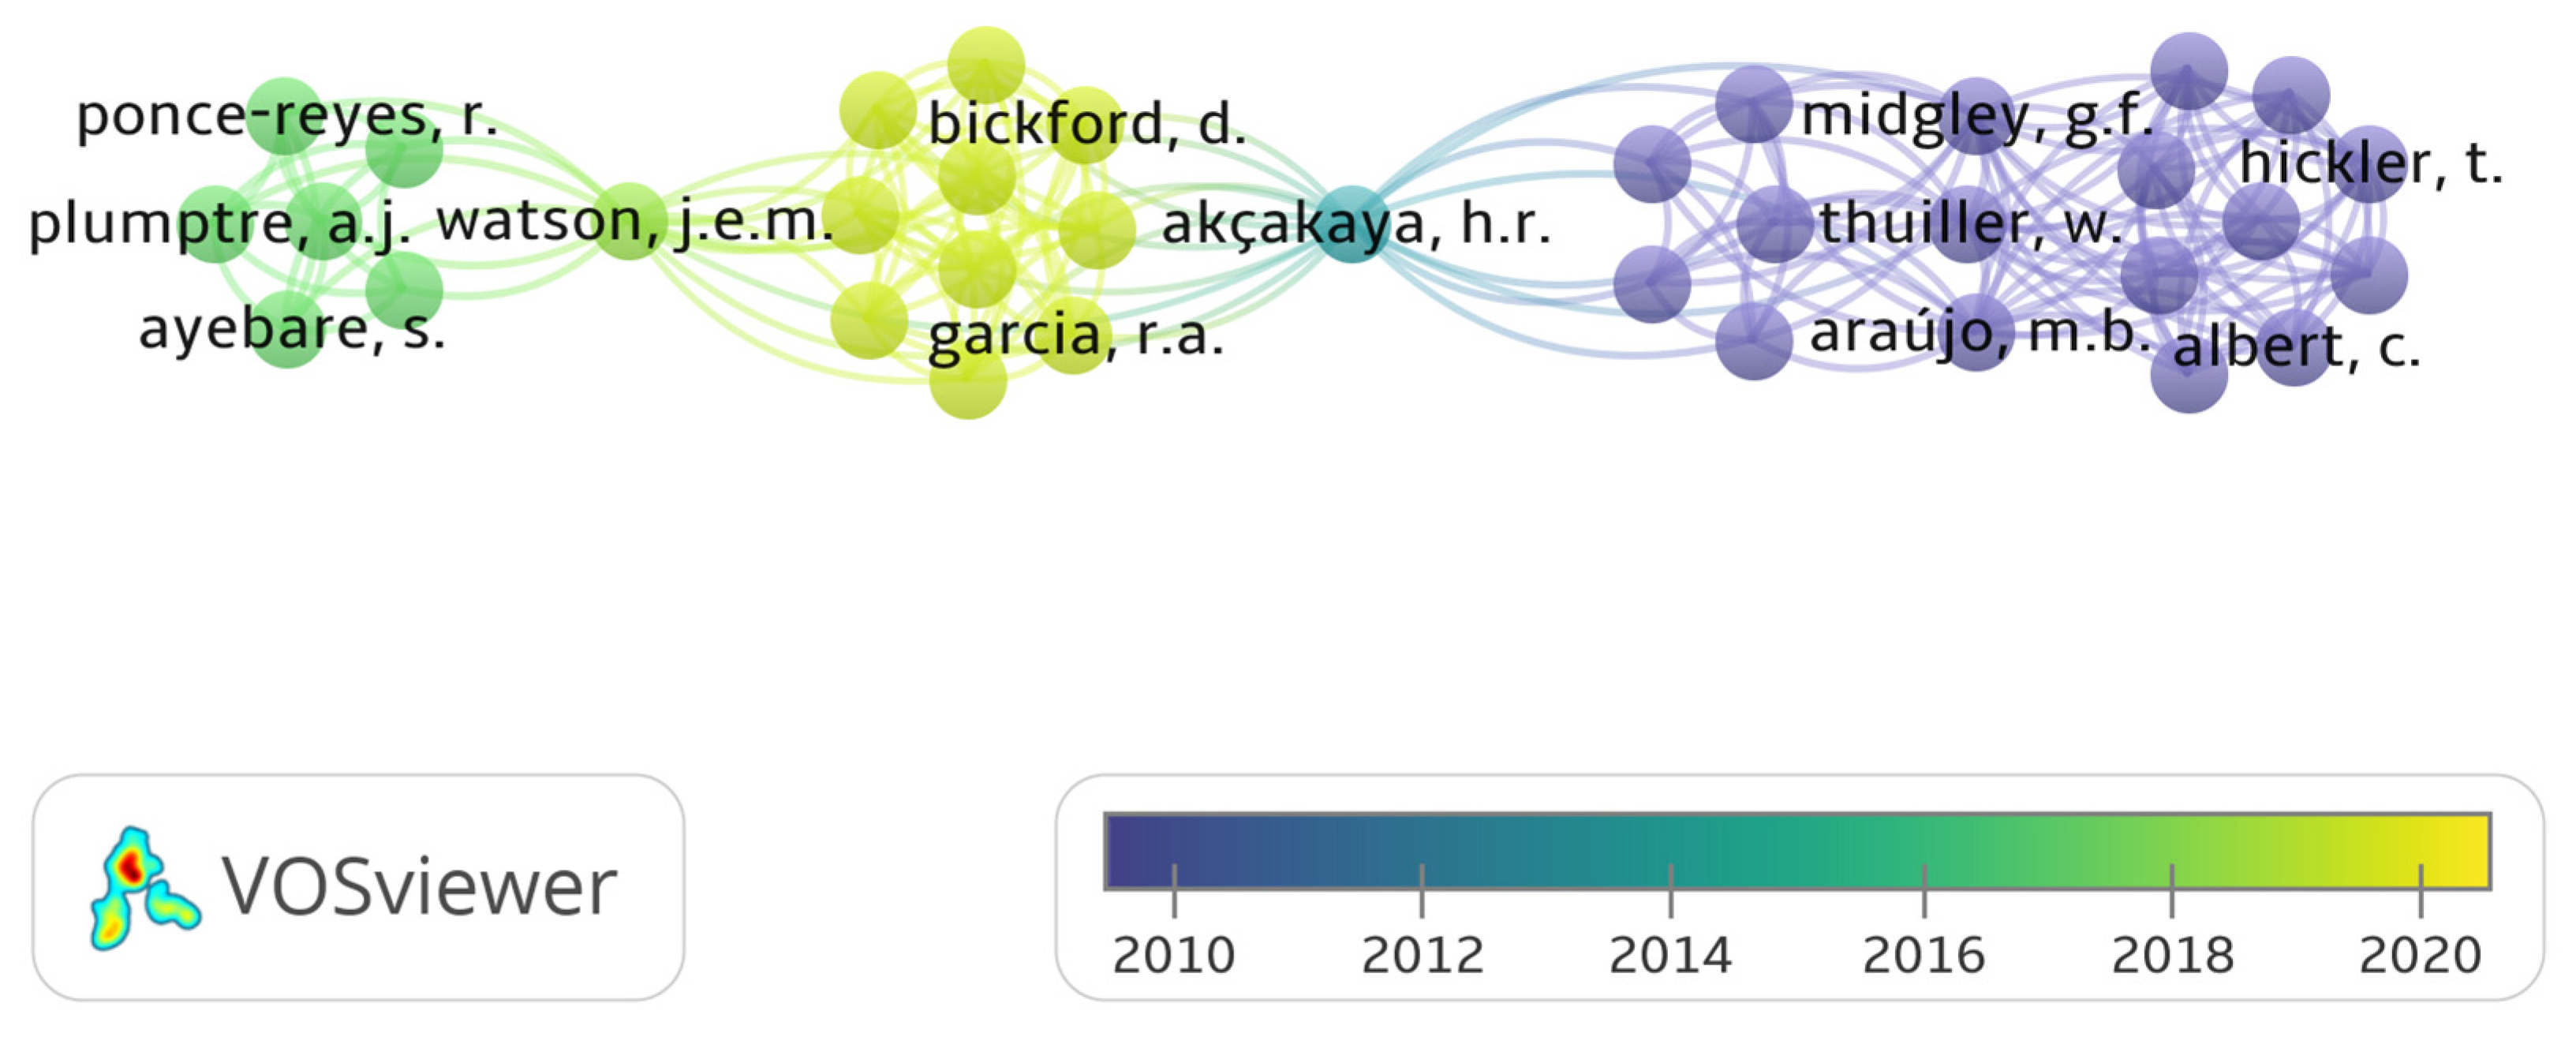
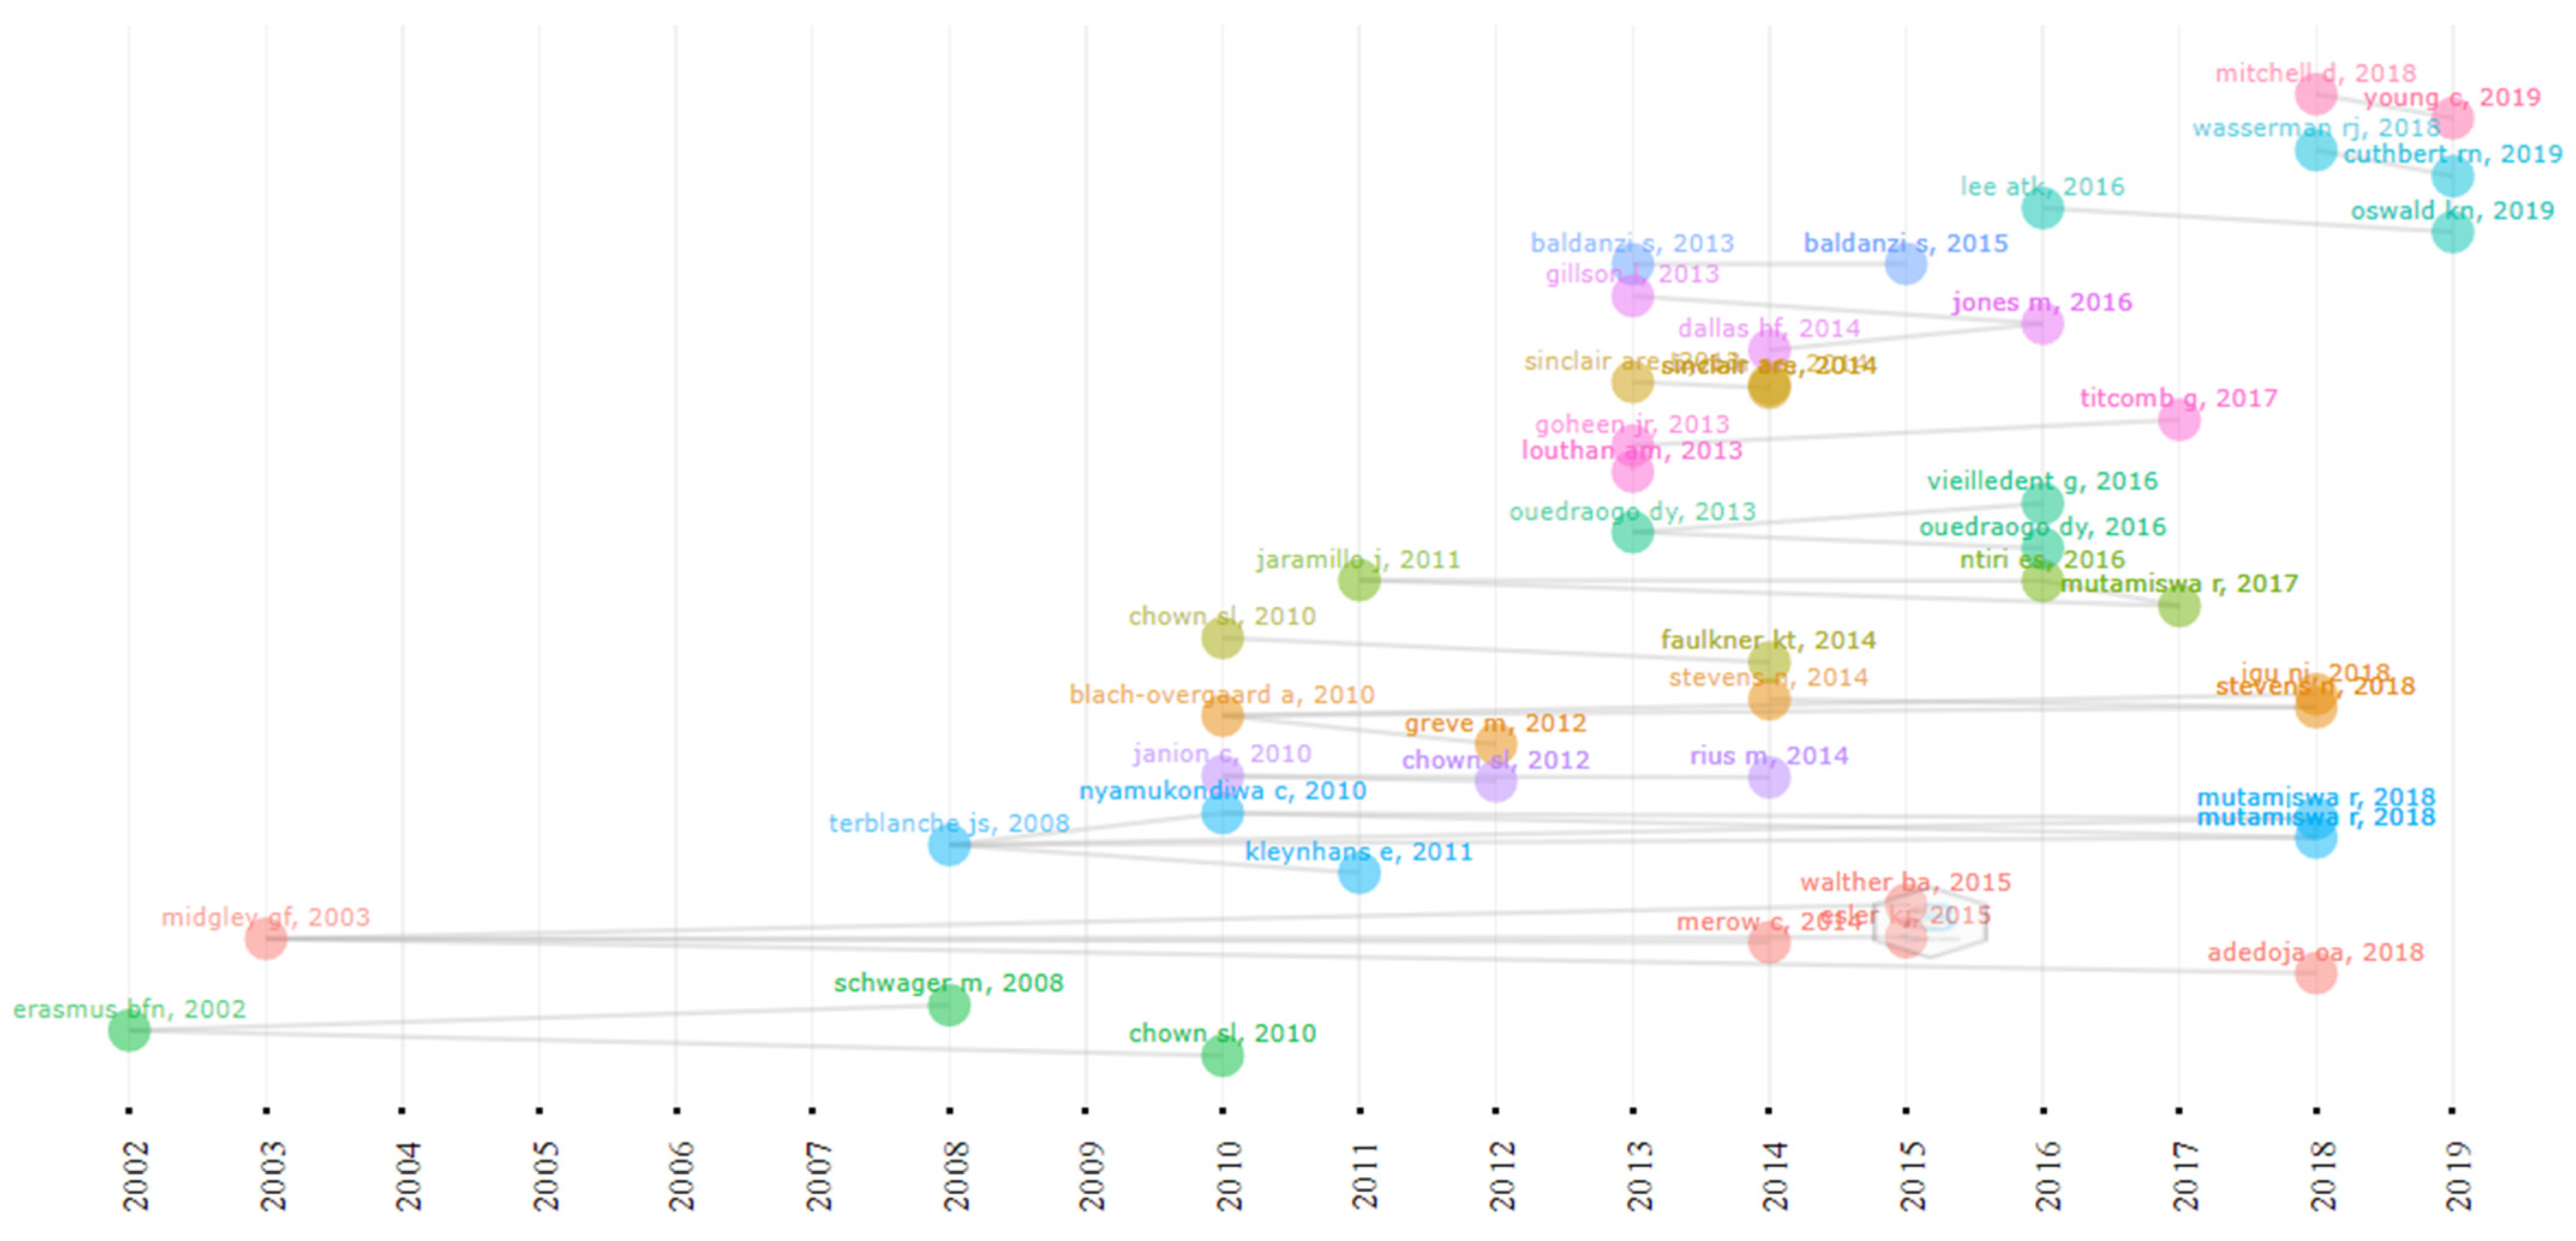
3.5. Distribution of Climate Change Publications and Citation Network

A total of 48 countries were identified in the bibliometric analysis of climate change papers in Africa in this study. The collaboration network was limited to the 20 most productive countries. South Africa is the most productive country (Table 1 and Figure 4) with the highest amount of collaboration (Figure 5). The bibliometric analysis reveals that South Africa is ranked first in most of the studied parameters, which might indicate the academic strength and research potential of the country. Germany, the United Kingdom and France are ranked high in research collaboration with African researchers on climate change, demonstrating their level of involvement. Figure 6 shows a co-authorship network that illustrates the top productive authors, presented in four clusters with different colours. The results reveal that co-authorship is stronger from the year 2010 to recent years, indicating better collaboration compared to previous years (Figure 6). Figure 7 illustrates the most frequent keywords in the analysed papers. The most frequently occurring keywords were arranged into four clusters: Cluster 1 (peach) consists of terms related to species and their responses to climate change. Cluster 2 (green) terms are related to species’ geographic distribution and adaptability. Cluster 3 (blue) is related to species distributions and biodiversity. Cluster 4 (yellow) has conservation-related terms and cluster 5 (purple) includes terms related to climate change and its impact. The relatedness of researchers’ work using bibliographic coupling networks is illustrated in Figure 8. The clusters are grouped around the publications of Midgley et al., (2003) [37], Travers et al., (2009) [38], Hecky et al., (2010) [39] and Jackson et al., (2016) [40], indicating research relatedness to different degrees. The relatedness of researchers’ work is determined by the level of cross-referencing between different authors [28].
The historiography (Figure 9) represents a chronological network of the most significant direct citations in the bibliographic data. Erasmus et al., (2002) [41] and Midgley et al., (2003) [37] begin the historiography with a paper each focusing on the conservation and protection of South African species that are vulnerable to climate change. Midgley et al., (2003) [37] reported on the biodiversity of species in the Cape Floristic region and their vulnerability to the effects of climate change in their study. Erasmus et al., (2002) [41] modelled the effect of elevated CO2 with an increase in temperature on 179 South African animal species. It was concluded that Flagship and Kruger National Park conservation may lose up to 66% of the species under extreme climate change conditions [41,42]. The two articles were authored by South African scientists, an indication of their long-term awareness of and research into climate change. The papers also have significant numbers of citations and contributed to the number of publications on climate change, as shown in Figure 3.

4. Responses of Climate in Fauna and Flora

The main factor assumed to underlie climate change is the rise in temperature due to elevated levels of greenhouse gases in the atmosphere. However, life on Earth would not have been possible without the greenhouse effect. The Earth’s surface temperature would be about −19 °C without GHGs [43]. Anthropogenic greenhouse gas (GHG) emissions contributed to the imbalance and increased GHGs in the Earth’s atmosphere that provokes extreme climate change. Soils also serve as an important source or sink for the three major GHGs. Nearly 20% of global carbon IV oxide emissions come from soils, as do at least one-third of global methane emissions and two-thirds of nitrous oxide (N2O) emissions [44]; hence, better land management and agricultural practices could help to combat global warming. Many field studies suggested that elevated CO2 leads to increased carbon assimilation in plants and carbon storage in soils; however, Carney et al., (2007) [45], in their research, observed that elevated CO2 levels do not necessarily lead to increases in soil carbon due to an equilibrium increase in soil microbial activity, resulting in rapid carbon turnover [45]. In 2012, it was reported that ambient concentrations of the three primary greenhouse gases (GHGs), including nitrous oxide (N2O), carbon IV oxide (CO2) and methane (CH4), increased by 41%, 160% and 20%, respectively, compared to pre-industrial levels [46], contributing to the current 1 °C increase in the average world temperature [47]. Atmospheric composition, temperature and moisture are the major climate change variables that affect the complex interactions of biotic and abiotic components of the ecosystem, resulting in changes that are difficult to predict. Organisms, particularly those with limited mobility, such as vegetation and belowground organisms, may likely show both behavioural and physiological changes to climate patterns, leading to long-term as well as large-scale responses, which could range from reduced genetic diversity to rising rates of extinction [4]. Brevik (2013) [48] found that Africa and South Asia stand the highest risk of food insecurity and deteriorating soil health due to soil organisms and vegetation being impacted by climate change [48].

4.1. Heat Stress Response

Changes in climatic factors, such as temperature, humidity and radiation, have been reported as potential threats to growth and increased stress levels for most organisms. Stress is described as the response of the body to stimuli that disrupt normal physiological balance or homeostasis, sometimes with negative effects [43]. It is the product of environmental factors that act on organisms, resulting in the disruption of the process of homeostasis, thereby leading to new adaptive responses that could either be harmful or beneficial to the organism. Guillot et al., (2019) [49] demonstrated, in their work, that soil microorganisms can considerably change their stoichiometry on exposure to heat stress [49]. Riah-Anglet et al., (2015) [50] also demonstrated that heat stress at 50 °C significantly reduced the total microbial biomass and fungal abundance in the soil of permanent grassland and arable cropping plots [50]. The negative consequences of climate change can result from the direct or indirect effects of the cumulative influence of alterations in air temperature, rainfall and the intensity and frequency of severe weather conditions [51]. Extreme weather conditions may have a wide biological impact on both plants and animals. Looking at these events from a physiological point of view, they can trigger significant physiological stress, decrease reproduction and perhaps result in mortality [52]. Riah-Anglet et al., (2015) [50] reveal that heat stress has a devastating effect on arable cropping land more than on permanent grassland due to the abundancy and high biodiversity of the microbial community in the latter [50]. Osborne et al., (2018) [53] found that the savanna biome covers more than 50% of the African continent. However, most African countries are losing their grasslands to land mismanagement, anthropogenic activities and climate change [53]. The combination could contribute to the extreme weather events in Africa, which can serve as a selective driver from an evolutionary standpoint and could also influence or even control the evolution of the physiological abilities and tolerance [54] of many species in the continent. Long-term exposure to heat stress with high intensity may negatively affect animal health, for instance, by triggering oxidative stress, metabolic changes, immune suppression and sometimes mortality [51]. Climate change may indirectly affect organisms by influencing microbial abundance and distribution, the spread of diseases [55] and food and water scarcity, which is already been reported in many parts of Africa [56]. Insects, which are economically important in agriculture, respond to global climate change by undergoing a decrease in their populations and changes in distribution compared to other taxa [57].

4.1.1. Heat Stress Responses at the Molecular Level: Oxidative Stress

Oxidative stress occurs as a result of the disruption in the levels of both pro-oxidants and antioxidants, which leads to the excessive production of reactive oxygen species (ROS) and free radicals, as well as a reduction in antioxidant resistance [58]. Heat stress has been reported to be responsible for the activation of oxidative stress in summer periods among livestock [58]. Oxidative stress can also be involved in many pathological states, such as parasite infections and other diseases [59]; however, food rich in natural antioxidants due to their accumulated secondary metabolites are linked with reducing the risks of some diseases and oxidative stress [60]. Increasing amounts of GHGs aggravate extreme changes in climatic conditions, such as floods, droughts and heat, which trigger oxidative stress and reactive oxygen species (ROS) in plants [43]. The accumulation of ROS causes oxidation, leading to cellular organelle dysfunction or even cell death. This becomes a huge challenge, particularly in agriculture. The major sources of ROS during stress conditions are enhanced photorespiration, the b-oxidation of fatty acids NADPH oxidase (NOX) production and abnormalities in the electron transport chains of mitochondria, as well as chloroplasts [43]. However, reactive oxygen species (ROS) are constantly produced by plants under normal conditions, but they are enhanced in response to different abiotic stress conditions. Among the most significant implications of climate change-related stresses at the molecular level is the response of ROS inside the cells in plants [61].

4.1.2. Cellular and Metabolic Responses to Heat Stress

Heat stress directly impacts both the flexibility and the resilience of cell membranes and disrupts receptors, along with transmembrane transport protein activities [62]. Unlike thermotolerant cells, an increase in the fluidity of cell membranes induced by heat has been observed in thermosensitive cells [63]. Cell membranes are also important targets of heat-induced cell death. This knowledge has helped us to better understand the variability in membrane potential, the rise in intracellular sodium and calcium levels and the increase in potassium flux during extreme conditions of heat [64]. It has been shown that heat stress causes several variations in the cytoskeletal structure, including the cell type, the mitotic apparatus as well as intracytoplasmic membranes, such as lysosomes and the endoplasmic reticulum. Moreover, protein synthesis, as well as DNA and ribonucleic acid (RNA) polymerization, is broken when exposed to heat stress. While protein and RNA synthesis quickly recover after exposure to heat, DNA synthesis stays impeded over a prolonged period [65], resulting in a favourable or unfavourable mutation. Research has shown that heat stress is not only responsible for protein denaturation; it is also responsible for its assembly into the nuclear matrix. That accumulation increases nucleic protein concentrations [66]. Thus, various molecular functions, such as DNA synthesis, repair and replication, nuclear enzymes and cell division, as well as functions of DNA polymerases, are altered [65]. Heat stress reduces protein deposition and production [66]. It induces protein catabolism (characterized by increased plasma uric acid levels) and reduces aspartic acid (Asp), tyrosine (Tyr), cysteine (Cys) and serine (Ser) plasma concentrations [67]. In animals, chronic heat exposure knocks down protein synthesis and reduces protein breakdown, with relatively low plasma levels of amino acids (particularly sulphur as well as branched-chain amino acids), elevated serum aspartic acid (Asp) and glutamic acid (Glu). Chronic heat stress also affects the lipid metabolism.
Global warming has led to strong heat waves that have severely impacted plants’ and animals’ growth and development. The changes that have been observed in different metabolic pathways in plants is unfavourable and reported to inhibit plant adaptive responses to different stress conditions [68]. Some animals respond to climate change with a behavioural, morphological or physiological alteration, hence adapting to the change, unlike plants. However, biomarkers have indicated that there are alterations in the protein and gene patterns of animals due to chronic exposure to heat and stress conditions [69]. Furthermore, climate change not only impacts plants and animals, but it also affects humans and the socio-economy of many countries, particularly African countries, where food insecurity is on the increase due to the changes.

5. Discussion

The results of this study revealed various thermal land surface and vegetation distributions between 1999 and 2019. Spatiotemporal distribution using FAPAR and MERRA-2 was used to examine soil moisture, temperature, rainfall distributions and their potential implications on vegetation and soil organisms. The earthworm, used as a sentinel in the study, has been proven to correlate with healthy soil and help in the buffering of heat stress caused by climate change [34]; hence, temperature, rainfall and soil moisture optimums for soil organisms [33] were used to assess the soil health. Land use and climate change predominantly influence soil properties, which subsequently determine the density and biomass of soil organisms [18]. Changes in vegetation and their potential impact on earthworm populations are presented in Figure 1. The spatial distribution of soil communities is typically complex, and their numbers vary with the influence of soil type, temperature, soil moisture, various abiotic interactions and land-use patterns [70]. In the study, the vegetation photosynthetic activities in many countries are quite consistent with the soil moisture and temperature. For instance, southern African countries, such as South Africa, Lesotho and Botswana, have a scattered distribution of vegetation and lower-than-normal photosynthetic activities, as indicated by the FAPAR data (Figure 1). This predicts the possibility of poor biodiversity of underground species, which correlates with vegetation in the region.
In the study, regions with a temperature higher than 30 °C, soil moisture less than 20%, low rainfall and lower than normal vegetative photosynthetic activities are predicted to be impacted by climate change. The most affected areas in these regards are Mauritania, Mali, Burkina Faso, Niger, Chad, Sudan and Somalia (Figure 1 and Figure 2). These countries are highly susceptible to the impact of climate change. Drought is on the increase and the soil in the region is losing its integrity. The above-mentioned countries need support programs that aid tree planting, soil amelioration and the increased use of irrigation for agriculture. However, according to our bibliometric analysis, these countries perform little or no research on climate change-related studies, which suggests that there is little action to combat climate change.
It has been established that temperature is one of the most important drivers of climate change because it influences biota activities and the processes of decomposition [71]. Species interactions in many communities have been reported to change due to temperature elevations caused by climate change [3,72]. Some studies have highlighted the possibility of a decline in some macro-detritivore species, including earthworms, due to elevated soil temperatures [72]; this, in turn, affected the vegetation at large. The interactions between temperature and soil moisture are crucial to soil health. The areas with high temperature and low soil moisture, as seen in Figure 2, have less vegetation and must have lost belowground species biodiversity. This could have been the situation in a few arid areas in Africa that have been recently going through extended droughts. The price of the combination of climate change and anthropogenic activities has been paid.
This study also demonstrates the trend of climate change research in Africa, from 1999 to 2019, and performed a comprehensive analysis of the most productive countries, the distribution of climate change publications and geographical information on vegetative responses to climate change in Africa. The responses of species to climate change are also discussed in this study.
The quality and quantity of scientific publications of a country could be a measure of its advancement in technology and research [73]. A rapid change in the number of publications, especially multi-author articles, supports scientific advancement. This bibliometric study analysed a selected set of published papers dealing with research on climate change in Africa and presents a multitude of quantitative data. The number of publications in climate change research increased steadily from 2006 and exhibited a doubling from 2016, as shown in this study (Figure 3). This exponential growth in the number of publications on climate change correlates with the increasing published related literature globally [74]. Publications in this field may have increased over time due to the obvious impact of climate change on vegetation [75], the increase in drought [10], accelerated global warming [76] and greater awareness of the possible severe impact of climate change on people’s livelihoods [12]. This publication growth may also have been stimulated by policymaking, education and awareness created by the Intergovernmental Panel on Climate Change (IPCC), the Environmental Protection Agency (EPA) and the United Nations Environment Programme (UNEP), among others.
Most African countries publish their research outputs on climate change in collaboration with countries such as Germany, the United Kingdom, the USA and France (Figure 4 and Figure 5). South Africa, however, has more single-country publications compared to other African countries. According to Haunschild et al., (2016) [74], the above-mentioned countries have contributed at least 1000 climate change papers each between 1980 and 2012. South Africa was reported to have published 2161 papers, among which 3.17% are in the top 1% of high-impact climate change papers between 1980 and 2012 [74]. The result of this study is consistent with previous bibliometric studies; thus, South Africa and the developed countries, such as Germany, the United Kingdom, the USA, France and Australia, have a high number of publications on climate change-related research with a high number of citations [77].
As shown in Figure 5 and Figure 6, the network nodes represent countries and authors, respectively, and the links represent collaboration and co-authorship [26]. Scientific research collaboration has increased globally, which may have been encouraged by government policies and private and government research agencies. Collaboration helps to develop a unified improved study model, integrated into multiple scientific disciplines [78,79]. This collaboration has helped many African scientists to put their fingerprints on climate change-related research (Figure 3, Figure 4, Figure 6 and Figure 7), resulting in a high number of Multiple-Country Publications (MCP). This study is a first attempt to evaluate research articles related to climate change and vegetation response in Africa. A coherent bibliometric study may be needed to analyse climate change publications in Africa from a quantitative and ecological perspective. Just like other bibliometric analyses, limitations, including the multiple expression of terms, discipline variation, differences in databases output and errors in the elimination of publications in other languages aside from English, cannot be excluded in this study. Thus, it is difficult to attain a perfect literature inclusion on the subject matter, even though the literature was screened manually.

6. Conclusions

The research output of African researchers in the field of climate change is growing at a corresponding rate to the global increase in related literature and this is expected to continue in the future. Climate changes, leading to dryer and warmer environmental conditions, are detrimental to underground species and vegetations. Thus, various climate change drivers, such as temperature, precipitation and soil moisture, have a significant influence on the photosynthetic activities of vegetation and soil health. This study concluded that there is an increasing amount of drought in Africa. African leaders must encourage tree planting programs, support agriculture with modern irrigation and fund research on climate change and heat stress-tolerant crops to combat the expected food crisis. Finally, the findings of this study provide a valuable basis for future research directions and research collaboration in the field of environmental study in climate change.

Author Contributions

O.A.I. conceived the idea and designed this work. O.A.I., P.O. and I.R.O. collected the data. O.A.I. processed, computed and analysed the bibliometric data. I.R.O. performed the computations of spatially based information and processed the GIS images. M.S.M. supervised the findings of this work. All authors contributed to the original draft preparation and editing of the manuscript. All authors have read and agreed to the published version of the manuscript.

Funding

This research received no external funding.

Institutional Review Board Statement

Not applicable.

Informed Consent Statement

Not applicable.

Conflicts of Interest

The authors declare no conflict of interest.

References

  1. Angert, A.L.; La Deau, S.L.; Ostfeld, R.S. Climate change and species interactions: Ways forward. Ann. N. Y. Acad. Sci. 2013, 1297, 1–7. [Google Scholar] [CrossRef] [PubMed]
  2. Niles, M.T.; Mueller, N.D. Farmer perceptions of climate change: Associations with observed temperature and precipitation trends, irrigation, and climate beliefs. Glob. Environ. Chang. 2016, 39, 133–142. [Google Scholar] [CrossRef] [Green Version]
  3. Gilman, S.E.; Urban, M.C.; Tewksbury, J.; Gilchrist, G.W.; Holt, R.D. A framework for community interactions under climate change. Trends Ecol. Evol. 2010, 25, 325–331. [Google Scholar] [CrossRef] [PubMed]
  4. Moritz, C.; Agudo, R. The future of species under climate change: Resilience or decline? Science 2013, 341, 504–508. [Google Scholar] [CrossRef] [PubMed]
  5. Vedder, O.; Bouwhuis, S.; Sheldon, B.C. Quantitative Assessment of the Importance of Phenotypic Plasticity in Adaptation to Climate Change in Wild Bird Populations. PLoS Biol. 2013, 11, 1001605. [Google Scholar] [CrossRef] [PubMed] [Green Version]
  6. Baron, J.S.; Hall, E.K.; Nolan, B.T.; Finlay, J.C.; Bernhardt, E.S.; Harrison, J.A.; Chan, F.; Boyer, E.W. The interactive effects of excess reactive nitrogen and climate change on aquatic ecosystems and water resources of the United States. Biogeochemistry 2013, 114, 71–92. [Google Scholar] [CrossRef]
  7. Salguero-GóMez, R.; Siewert, W.; Casper, B.B.; Tielbörger, K. A demographic approach to study effects of climate change in desert plants. Philos. Trans. R. Soc. B Biol. Sci. 2012, 367, 3100–3114. [Google Scholar] [CrossRef] [Green Version]
  8. Craine, J.M.; Ocheltree, T.W.; Nippert, J.B.; Towne, E.G.; Skibbe, A.M.; Kembel, S.W.; Fargione, J.E. Global diversity of drought tolerance and grassland climate-change resilience. Nat. Clim. Chang. 2013, 3, 63–67. [Google Scholar] [CrossRef]
  9. Hansen, A.J.; Neilson, R.P.; Dale, V.H.; Flather, C.H.; Iverson, L.R.; Currie, D.J.; Shafer, S.; Cook, R.; Bartlein, P.J. Global Change in Forests: Responses of Species, Communities, and Biomes: Interactions between climate change and land use are projected to cause large shifts in biodiversity. Bioscience 2001, 51, 765–779. [Google Scholar] [CrossRef]
  10. Allen, C.D.; Macalady, A.K.; Chenchouni, H.; Bachelet, D.; McDowell, N.; Vennetier, M.; Kitzberger, T.; Rigling, A.; Breshears, D.D.; Hogg, E.H.T.; et al. A global overview of drought and heat-induced tree mortality reveals emerging climate change risks for forests. For. Ecol. Manag. 2010, 259, 660–684. [Google Scholar] [CrossRef] [Green Version]
  11. Tylianakis, J.M.; Didham, R.K.; Bascompte, J.; Wardle, D.A. Global change and species interactions in terrestrial ecosystems. Ecol. Lett. 2008, 11, 1351–1363. [Google Scholar] [CrossRef] [PubMed]
  12. Conway, D.; Schipper, E.L.F. Adaptation to climate change in Africa: Challenges and opportunities identified from Ethiopia. Glob. Environ. Chang. 2011, 21, 227–237. [Google Scholar] [CrossRef]
  13. Roudier, P.; Sultan, B.; Quirion, P.; Berg, A. The impact of future climate change on West African crop yields: What does the recent literature say? Glob. Environ. Chang. 2011, 21, 1073–1083. [Google Scholar] [CrossRef] [Green Version]
  14. Masipa, T.S. The impact of climate change on food security in South Africa: Current realities and challenges ahead. Jamba J. Disaster Risk Stud. 2017, 9. [Google Scholar] [CrossRef] [Green Version]
  15. Baillie, J.E.; Hilton-Taylor, C.; Stuart, S.N. 2004 IUCN Red List of Threatened Species; A Global Species Assessment IUCN: Gland, Switzerland; Cambridge, UK, 2004. [Google Scholar]
  16. IUCN (International Union for Conservation of Nature). Red List of Threatened Species. Available online: https://www.iucnredlist.org/about/background-history (accessed on 3 August 2020).
  17. Bellard, C.; Bertelsmeier, C.; Leadley, P.; Thuiller, W.; Courchamp, F. Impacts of climate change on the future of biodiversity. Ecol. Lett. 2012, 15, 365–377. [Google Scholar] [CrossRef] [Green Version]
  18. Yin, R.; Siebert, J.; Eisenhauer, N.; Schädler, M. Climate change and intensive land use reduce soil animal biomass via dissimilar pathways. Elife 2020, 9, e54749. [Google Scholar] [CrossRef]
  19. Personnic, S.; Boudouresque, C.F.; Astruch, P.; Ballesteros, E.; Blouet, S.; Bellan-Santini, D.; Bonhomme, P.; Thibault-Botha, D.; Feunteun, E.; Harmelin-Vivien, M.; et al. An ecosystem-based approach to assess the status of a mediterranean ecosystem, the Posidonia oceanica seagrass meadow. PLoS ONE 2014, 9, e98994. [Google Scholar] [CrossRef] [Green Version]
  20. Thakur, M.P.; Milcu, A.; Manning, P.; Niklaus, P.A.; Roscher, C.; Power, S.; Reich, P.B.; Scheu, S.; Tilman, D.; Ai, F.; et al. Plant diversity drives soil microbial biomass carbon in grasslands irrespective of global environmental change factors. Glob. Chang. Biol. 2015, 21, 4076–4085. [Google Scholar] [CrossRef] [Green Version]
  21. Batjes, N.H.; Milne, E.; Williams, S. Map-based estimates of present carbon stocks of grazing lands in Sub-Sahara Africa. In Grazing Lands, Livestock and Climate Resilient Mitigation in Sub-Saharan Africa: The State of the Science; United States Agency for International Development (USAID): Washington, DC, USA, 2015; pp. 31–33, 97–100. [Google Scholar]
  22. Gelaro, R.; McCarty, W.; Suárez, M.J.; Todling, R.; Molod, A.; Takacs, L.; Randles, C.A.; Darmenov, A.; Bosilovich, M.G.; Reichle, R. The Modern Era Retrospective Analysis for Research and Applications, Version 2 (MERRA-2). J. Clim. 2017, 30, 5419–5454. [Google Scholar] [CrossRef]
  23. Zyoud, S.H.; Waring, W.S.; Al-Jabi, S.W.; Sweileh, W.M. Global cocaine intoxication research trends during 1975-2015: A bibliometric analysis of Web of Science publications. Subst. Abus. Treat. Prev. Policy 2017, 12, 6. [Google Scholar] [CrossRef] [Green Version]
  24. Larayetan, R.; Olisah, C.; Idris, O.A. Research Progression on Studies Related to Green Synthesis Nanoparticles: A Bibliometric Review. In Green Synthesis of Nanoparticles: Applications and Prospects; Springer: Singapore, 2020; pp. 1–22. [Google Scholar]
  25. Olisah, C.; Okoh, O.O.; Okoh, A.I. Global evolution of organochlorine pesticides research in biological and environmental matrices from 1992 to 2018: A bibliometric approach. Emerg. Contam. 2019, 5, 157–167. [Google Scholar] [CrossRef]
  26. Aria, M.; Cuccurullo, C. bibliometrix: An R-tool for comprehensive science mapping analysis. J. Informetr. 2017, 11, 959–975. [Google Scholar] [CrossRef]
  27. Orimoloye, I.R.; Ololade, O.O. Global trends assessment of environmental health degradation studies from 1990 to 2018. Environ. Dev. Sustain. 2020, 23, 1–14. [Google Scholar] [CrossRef]
  28. Perianes-Rodriguez, A.; Waltman, L.; van Eck, N.J. Constructing bibliometric networks: A comparison between full and fractional counting. J. Informetr. 2016, 10, 1178–1195. [Google Scholar] [CrossRef] [Green Version]
  29. Snyder, K.A.; Tartowski, S.L. Multi-scale temporal variation in water availability: Implications for vegetation dynamics in arid and semi-arid ecosystems. J. Arid Environ. 2006, 65, 219–234. [Google Scholar] [CrossRef]
  30. Orimoloye, I.R.; Ololade, O.O.; Mazinyo, S.P.; Kalumba, A.M.; Ekundayo, O.Y.; Busayo, E.T.; Akinsanola, A.A.; Nel, W. Spatial assessment of drought severity in Cape Town area, South Africa. Heliyon 2019, 5, e02148. [Google Scholar] [CrossRef] [PubMed] [Green Version]
  31. Kaur, P.; Bali, S.; Sharma, A.; Vig, A.P.; Bhardwaj, R. Effect of earthworms on growth, photosynthetic efficiency and metal uptake in Brassica juncea L. plants grown in cadmium-polluted soils. Environ. Sci. Pollut. Res. 2017, 24, 13452–13465. [Google Scholar] [CrossRef]
  32. Fouché, T.; Maboeta, M.; Claassens, S. Effect of Biofumigants on Soil Microbial Communities and Ecotoxicology of Earthworms (Eisenia andrei). Water Air Soil Pollut. 2016, 227, 1–11. [Google Scholar] [CrossRef]
  33. Berry, E.C.; Jordan, D. Temperature and soil moisture content effects on the growth of Lumbricus terrestris (Oligochaeta: Lumbricidae) under laboratory conditions. Soil Biol. Biochem. 2001, 33, 133–136. [Google Scholar] [CrossRef]
  34. Siebert, J.; Eisenhauer, N.; Poll, C.; Marhan, S.; Bonkowski, M.; Hines, J.; Koller, R.; Ruess, L.; Thakur, M.P. Earthworms modulate the effects of climate warming on the taxon richness of soil meso- and macrofauna in an agricultural system. Agric. Ecosyst. Environ. 2019, 278, 72–80. [Google Scholar] [CrossRef]
  35. Wever, L.A.; Lysyk, T.J.; Clapperton, M.J. The influence of soil moisture and temperature on the survival, aestivation, growth and development of juvenile Aporrectodea tuberculata (Eisen) (Lumbricidae). Pedobiologia 2001, 45, 121–133. [Google Scholar] [CrossRef]
  36. Albarrán, P.; Crespo, J.A.; Ortuño, I.; Ruiz-Castillo, J. The skewness of science in 219 sub-fields and a number of aggregates. Scientometrics 2011, 88, 385–397. [Google Scholar] [CrossRef] [Green Version]
  37. Midgley, G.F.; Hannah, L.; Millar, D.; Thuiller, W.; Booth, A. Developing regional and species-level assessments of climate change impacts on biodiversity in the Cape Floristic Region. Biol. Conserv. 2003, 112, 87–97. [Google Scholar] [CrossRef]
  38. Travers, M.; Shin, Y.-J.; Jennings, S.; Machu, E.; Huggett, J.A.; Field, J.G.; Cury, P.M. Two-way coupling versus one-way forcing of plankton and fish models to predict ecosystem changes in the Benguela. Ecol. Model. 2009, 220, 3089–3099. [Google Scholar] [CrossRef]
  39. Hecky, R.E.; Mugidde, R.; Ramlal, P.S.; Talbot, M.R.; Kling, G.W. Multiple stressors cause rapid ecosystem change in Lake Victoria. Freshw. Biol. 2010, 55, 19–42. [Google Scholar] [CrossRef] [Green Version]
  40. Jackson, M.C.; Loewen, C.J.G.; Vinebrooke, R.D.; Chimimba, C.T. Net effects of multiple stressors in freshwater ecosystems: A meta-analysis. Glob. Chang. Biol. 2016, 22, 180–189. [Google Scholar] [CrossRef]
  41. Erasmus, B.F.N.; Van Jaarsveld, A.S.; Chown, S.L.; Kshatriya, M.; Wessels, K.J. Vulnerability of South African animal taxa to climate change. Glob. Chang. Biol. 2002, 8, 679–693. [Google Scholar] [CrossRef]
  42. Chown, S.L.; McGeoch, M.A.; Marshall, D.J. Diversity and conservation of invertebrates on the sub-Antarctic Prince Edward Islands. Afr. Entomol. 2002, 10, 67–82. [Google Scholar]
  43. Cassia, R.; Nocioni, M.; Correa-Aragunde, N.; Lamattina, L. Climate change and the impact of greenhouse gasses: CO2 and NO, friends and foes of plant oxidative stress. Front. Plant Sci. 2018, 9, 273. [Google Scholar] [CrossRef]
  44. Amador, J.A.; Görres, J.H. Role of the anecic earthworm Lumbricus terrestris L. in the distribution of plant residue nitrogen in a corn (Zea mays)-soil system. Appl. Soil Ecol. 2005, 30, 203–214. [Google Scholar] [CrossRef]
  45. Carney, K.M.; Hungate, B.A.; Drake, B.G.; Megonigal, J.P. Altered soil microbial community at elevated CO2 leads to loss of soil carbon. Proc. Natl. Acad. Sci. USA 2007, 104, 4990–4995. [Google Scholar] [CrossRef] [PubMed] [Green Version]
  46. Stocker, T.F.; Qin, D.; Plattner, G.-K.; Tignor, M.M.B.; Allen, S.K.; Boschung, J.; Nauels, A.; Xia, Y.; Bex, V.; Midgley, P.M. Climate Change 2013: The Physical Science Basis: Summary for Policymakers Technical Summary Frequently Asked Questions, the Intergovernmental Panel on Climate Change. 2013. Available online: https://policycommons.net/artifacts/67690/climate-change-2013/ (accessed on 8 February 2022).
  47. IPCC. The IPCC Climate Change Report: Why It Matters to Everyone on the Planet. Available online: https://www.nrdc.org/stories/ipcc-climate-change-report-why-it-matters-everyone-planet (accessed on 19 October 2020).
  48. Brevik, E.C. The Potential Impact of Climate Change on Soil Properties and Processes and Corresponding Influence on Food Security. Agriculture 2013, 3, 398–417. [Google Scholar] [CrossRef] [Green Version]
  49. Guillot, E.; Hinsinger, P.; Dufour, L.; Roy, J.; Bertrand, I. With or without trees: Resistance and resilience of soil microbial communities to drought and heat stress in a Mediterranean agroforestry system. Soil Biol. Biochem. 2019, 129, 122–135. [Google Scholar] [CrossRef]
  50. Riah-Anglet, W.; Trinsoutrot-Gattin, I.; Martin-Laurent, F.; Laroche-Ajzenberg, E.; Norini, M.P.; Latour, X.; Laval, K. Soil microbial community structure and function relationships: A heat stress experiment. Appl. Soil Ecol. 2015, 86, 121–130. [Google Scholar] [CrossRef]
  51. Lacetera, N. Impact of climate change on animal health and welfare. Anim. Front. 2019, 9, 26–31. [Google Scholar] [CrossRef] [Green Version]
  52. Dowd, W.W.; King, F.A.; Denny, M.W. Thermal variation, thermal extremes and the physiological performance of individuals. J. Exp. Biol. 2015, 218, 1956–1967. [Google Scholar] [CrossRef] [Green Version]
  53. Osborne, C.P.; Charles-Dominique, T.; Stevens, N.; Bond, W.J.; Midgley, G.; Lehmann, C.E.R. Human impacts in African savannas are mediated by plant functional traits. New Phytol. 2018, 220, 10–24. [Google Scholar] [CrossRef]
  54. Denny, M.W.; Dowd, W.W. Biophysics, environmental stochasticity, and the evolution of thermal safety margins in intertidal limpets. J. Exp. Biol. 2012, 215, 934–947. [Google Scholar] [CrossRef] [Green Version]
  55. Lacetera, N.; Segnalini, M.; Bernabucci, U.; Ronchi, B.; Vitali, A.; Tran, A.; Guis, H.; Caminade, C.; Calvete, C.; Morse, A.; et al. Climate Induced Effects on Livestock Population and Productivity in the Mediterranean Area. Adv. Glob. Chang. Res. 2013, 51, 135–156. [Google Scholar]
  56. Mcnally, A.; Verdin, K.; Harrison, L.; Getirana, A.; Jacob, J.; Shukla, S.; Arsenault, K.; Peters-Lidard, C.; Verdin, J.P. Acute Water-Scarcity Monitoring for Africa. Water 2019, 11, 1968. [Google Scholar] [CrossRef] [Green Version]
  57. Sánchez-Guillén, R.A.; Córdoba-Aguilar, A.; Hansson, B.; Ott, J.; Wellenreuther, M. Evolutionary consequences of climate-induced range shifts in insects. Biol. Rev. 2016, 91, 1050–1064. [Google Scholar] [CrossRef] [PubMed]
  58. Ganaie, A.H.; Ghasura, R.S.; Mir, N.A.; Bumla, N.A.; Sankar, G.; Wani, S.A. Biochemical and physiological changes during thermal stress in bovines: A review. Iran. J. Appl. Anim. Sci. 2013, 3, 423–430. [Google Scholar]
  59. Idris, O.A.; Wintola, O.A.; Afolayan, A.J. Phytochemical and antioxidant activities of Rumex crispus L. in treatment of gastrointestinal helminths in Eastern Cape Province, South Africa. Asian Pac. J. Trop. Biomed. 2017, 7, 1071–1078. [Google Scholar] [CrossRef]
  60. Jimoh, M.A.; Idris, O.A.; Jimoh, M.O. Cytotoxicity, Phytochemical, Antiparasitic Screening, and Antioxidant Activities of Mucuna pruriens (Fabaceae). Plants 2020, 9, 1249. [Google Scholar] [CrossRef]
  61. Farnese, F.S.; Menezes-Silva, P.E.; Gusman, G.S.; Oliveira, J.A. When bad guys become good ones: The key role of reactive Oxygen species and Nitric Oxide in the plant responses to abiotic stress. Front. Plant Sci. 2016, 7, 471. [Google Scholar] [CrossRef] [PubMed] [Green Version]
  62. Belhadj Slimen, I.; Najar, T.; Ghram, A.; Abdrrabba, M. Heat stress effects on livestock: Molecular, cellular and metabolic aspects, a review. J. Anim. Physiol. Anim. Nutr. 2016, 100, 401–412. [Google Scholar] [CrossRef] [Green Version]
  63. Huey, R.B.; Kearney, M.R.; Krockenberger, A.; Holtum, J.A.M.; Jess, M.; Williams, S.E. Predicting organismal vulnerability to climate warming: Roles of behaviour, physiology and adaptation. Philos. Trans. R. Soc. B Biol. Sci. 2012, 367, 1665–1679. [Google Scholar] [CrossRef] [Green Version]
  64. Zhao, Q.L.; Fujiwara, Y.; Kondo, T. Mechanism of cell death induction by nitroxide and hyperthermia. Free Radic. Biol. Med. 2006, 40, 1131–1143. [Google Scholar] [CrossRef]
  65. McNutt, J.W.; Groom, R.; Woodroffe, R. Ambient temperature provides an adaptive explanation for seasonal reproduction in a tropical mammal. J. Zool. 2019, 309, 153–160. [Google Scholar] [CrossRef]
  66. Monaco, C.J.; McQuaid, C.D. Climate warming reduces the reproductive advantage of a globally invasive intertidal mussel. Biol. Invasions 2019, 21, 2503–2516. [Google Scholar] [CrossRef]
  67. Kurake, N.; Ishikawa, K.; Tanaka, H.; Hashizume, H.; Nakamura, K.; Kajiyama, H.; Toyokuni, S.; Kikkawa, F.; Mizuno, M.; Hori, M. Non-thermal plasma-activated medium modified metabolomic profiles in the glycolysis of U251SP glioblastoma. Arch. Biochem. Biophys. 2019, 662, 83–92. [Google Scholar] [CrossRef] [PubMed]
  68. Wani, S.H.; Kapoor, N.; Mahajan, R. Metabolic responses of medicinal plants to global warming, temperature and heat stress. In Medicinal Plants and Environmental Challenges; Springer International Publishing: Berlin/Heidelberg, Germany, 2017; pp. 69–80. ISBN 9783319687179. [Google Scholar]
  69. Sejian, V.; Bhatta, R.; Gaughan, J.B.; Dunshea, F.R.; Lacetera, N. Review: Adaptation of animals to heat stress. Animal 2018, 12, S431–S444. [Google Scholar] [CrossRef] [PubMed] [Green Version]
  70. Singh, S.; Singh, J.; Vig, A.P. Effect of abiotic factors on the distribution of earthworms in different land use patterns. J. Basic Appl. Zool. 2016, 74, 41–50. [Google Scholar] [CrossRef] [Green Version]
  71. Singh, J.; Schädler, M.; Demetrio, W.; Brown, G.G.; Eisenhauer, N. Climate change effects on earthworms—A review Europe PMC Funders Group. Soil Org. 2019, 91, 114–138. [Google Scholar] [CrossRef] [PubMed]
  72. Chen, I.C.; Hill, J.K.; Ohlemüller, R.; Roy, D.B.; Thomas, C.D. Rapid range shifts of species associated with high levels of climate warming. Science 2011, 333, 1024–1026. [Google Scholar] [CrossRef] [PubMed]
  73. Sun, J.; Guo, Y.; Scarlat, M.M.; Lv, G.; Yang, X.G.; Hu, Y.C. Bibliometric study of the orthopaedic publications from China. Int. Orthop. 2018, 42, 461–468. [Google Scholar] [CrossRef] [PubMed]
  74. Haunschild, R.; Bornmann, L.; Marx, W. Climate Change Research in View of Bibliometrics. PLoS ONE 2016, 11, e0160393. [Google Scholar] [CrossRef] [Green Version]
  75. Scheiter, S.; Higgins, S.I. Impacts of climate change on the vegetation of Africa: An adaptive dynamic vegetation modelling approach. Glob. Chang. Biol. 2009, 15, 2224–2246. [Google Scholar] [CrossRef]
  76. Goosse, H.; Kay, J.E.; Armour, K.C.; Bodas-Salcedo, A.; Chepfer, H.; Docquier, D.; Jonko, A.; Kushner, P.J.; Lecomte, O.; Massonnet, F.; et al. Quantifying climate feedbacks in polar regions. Nat. Commun. 2018, 9, 1–13. [Google Scholar] [CrossRef]
  77. Zyoud, S.H.; Waring, W.S.; Al-Jabi, S.W.; Sweileh, W.M.; Rahhal, B.; Awang, R. Intravenous Lipid Emulsion as an Antidote for the Treatment of Acute Poisoning: A Bibliometric Analysis of Human and Animal Studies. Basic Clin. Pharmacol. Toxicol. 2016, 119, 512–519. [Google Scholar] [CrossRef] [Green Version]
  78. Dangles, O.; Loirat, J.; Freour, C.; Serre, S.; Vacher, J.; Le Roux, X. Research on Biodiversity and Climate Change at a Distance: Collaboration Networks between Europe and Latin America and the Caribbean. PLoS ONE 2016, 11, e0157441. [Google Scholar] [CrossRef] [PubMed] [Green Version]
  79. Olisah, C.; Adams, J.B. Systematic mapping of organophosphate contaminant (OPC) research trends between 1990 and 2018. Environ. Geochem. Health 2020, 42, 3481–3505. [Google Scholar] [CrossRef] [PubMed]
Figure 1. FAPAR anomalies and FAPAR for the years 2001 and 2019. FAPAR: Fraction of Absorbed Photosynthetically Active Radiation. (1) Photosynthetic activities are lower than normal, (2) near normal and (3) higher than normal. (A) In 2001, there was a spatial distribution of vegetation with lower photosynthetic activity, majorly in the southern, western, and eastern parts of Africa. (B) From 2001 to 2019, the photosynthetic activity of vegetation increased in the southern and eastern African countries but decreased in the south. (C,D) represent FAPAR. There is no significant difference in the vegetation distribution pattern across African countries between 2001 and 2019.
Sustainability 14 04974 g001
Figure 2. (A) Soil moisture anomalies for the year 2001. (B) soil moisture anomalies for the year 2019. (C) Temperature from 1990 to 2019. (D) Rainfall distribution over Africa in the period from 1990 to 2019.
Sustainability 14 04974 g002
Figure 3. Annual number of scientific publications in Africa focusing on climate change. The combined column, line graph and trendline illustrate the number of climate change publications in the Scopus and ISI Web of Science (WoS) databases for the last two decades. The trendline indicates the rapid progress of research on climate change in Africa.
Sustainability 14 04974 g003
Figure 4. Twenty most productive countries in terms of scientific publications on climate change in Africa. The data were analysed using the corresponding author’s country.
Sustainability 14 04974 g004
Figure 5. Collaboration network of the most productive twenty countries on climate change study in Africa. The circles represent the country within or around the circle. The circle size and thickness of linked lines indicate the collaboration strength of a country. This network was compiled with R-project version 3.6.3.
Sustainability 14 04974 g005
Figure 6. Co-authorship network map (Fractional counting), 1999–2019. Out of 692 authors, 47 had at least 2 publications in the articles collected. For each of the authors, the total strength of the co-authorship links was calculated and the authors with the greatest link strength are presented.
Sustainability 14 04974 g006
Figure 7. Keywords co-occurrence (fractional counting). The minimum number of occurrences of keywords was set at 3. Out of 622 keywords, 24 met the threshold.
Sustainability 14 04974 g007
Figure 8. Bibliographic coupling (articles fractional counting). For each of the documents, the total strength of the bibliographic coupling was calculated. The articles with the greatest total link strength are represented in circles. The circle size, the thickness of linked lines and colours are proportional to the relatedness of researchers’ work.
Sustainability 14 04974 g008
Figure 9. Direct historical citation network of articles from 2002 to 2019.
Sustainability 14 04974 g009
Table 1. Summary of data collected from Scopus and WoS on African climate change (1999–2019).
DescriptionValue
Article127
Book chapter5
Review18
Total publications150
Sources (journals, books, etc.)112
Authors692
Author appearances813
Authors of single-authored documents5
Authors of multi-authored documents687
Single-authored documents6
Authors per document4.61
Average citations per document27.85
Collaboration index4.77
Keywords plus (ID)1099
Author’s keywords (DE)622
Most relevant keywordClimate change
Source with the highest number of articlesPlos one
Most productive countrySouth Africa
Most affiliated instituteStellenbosch University
Publisher’s Note: MDPI stays neutral with regard to jurisdictional claims in published maps and institutional affiliations.

