Article

Deep Learning-Based Projection of Occurrence Frequency of Forest Fires under SSP Scenario: Exploring the Link between Drought Characteristics and Forest Fires

1
Ministry of Environment, Han River Flood Control Office, Seoul 06501, Korea
2
International School of Urban Sciences, University of Seoul, Seoul 02504, Korea
3
Operational Systems Development Department, National Institute of Meteorological Research, Seogwipo-si 63568, Korea
*
Author to whom correspondence should be addressed.
Sustainability 2022, 14(9), 5494; https://0-doi-org.brum.beds.ac.uk/10.3390/su14095494
Submission received: 26 March 2022 / Revised: 29 April 2022 / Accepted: 29 April 2022 / Published: 3 May 2022
(This article belongs to the Special Issue Climate Change and Wildfires Risk Assessment)

Abstract

:
The occurrence frequency of forest fires (OF) can be estimated using drought features because droughts are affected by climatic conditions. Previous studies have improved OF estimation performance by applying the meteorological drought index to climatic conditions. It is anticipated that the temperature will rise in South Korea in the future and that drought will become severe on account of climate change. The future OF is expected to change accordingly. This study used the standard precipitation index, relative humidity, and wind speed as predictor variables for a deep-learning-based model to estimate the OF. Climate change scenarios under shared socioeconomic pathways were used to estimate future OF. As a result, it was projected that the OF in the summer season will increase in the future (2071–2100). In particular, there will be a 15% increase in July compared to the current climate. A decrease in relative humidity and increase in wind speed will also affect the OF. Finally, drought severity was found to be the most influential factor on the OF among the four drought characteristics (severity, duration, intensity, and inter-arrival), considering inter-model variability across all global climate models.

1. Introduction

With global climate change, the frequency and magnitude of forest fires continue to increase in South Korea and many other countries worldwide [1]. To simulate the mechanism of forest fires, various statistical models have been developed. These models consider precipitation and humidity as predictor variables for changes in forest fire regimes [2,3]. In addition, recent studies have analyzed the link between drought conditions and forest fire occurrence by adopting drought indicators, such as meteorological drought indices [4]. These indicators are significant because the occurrence and spread of forest fires strongly depend on drought conditions. Such conditions represent a shortage of surface water and soil moisture relative to others. Among drought indices, meteorological drought determines drought based on the shortage of accumulated precipitation [5,6,7]. The standard precipitation index (SPI) is a representative meteorological drought index [8]. It is calculated as the relative departure from the average accumulated monthly precipitation for a pre-determined previous period.
Forest fires are closely related to the shortage of soil moisture in surface hydrological variables. However, the meteorological drought index has been used as an alternative to represent soil moisture owing to a lack of data from actual observations [7]. In addition, the SPI or standardized precipitation evapotranspiration index (SPEI) [9] can reflect the effect of delayed weather conditions because it uses the accumulated value of climate variables. It is therefore useful in analyzing the relationship between climate and forest fires. Yoon and Won [10] revealed that the occurrence frequency of forest fires (OF) is related to the SPI. Drying facilitates the occurrence and spread of forest fires. For instance, OF is higher in the spring season in South Korea because spring is the driest season of the year there. Turco et al. [11] explored the linkage between the SPEI and forest fires. Sung et al. [7] enhanced the predictability of fire occurrence driven by a deep belief network (DBN) model using the SPI and the SPEI.
It is well known that forest fires not only depend on changes in climate conditions but also on human activities and land use [12,13,14,15,16]. Recent studies have identified an increase in OF due to changes in precipitation and temperature patterns caused by climate change [17,18,19]. Therefore, a reliable long-term projection of the OF is required because the OF projection can be leveraged for the empirically based deployment of firefighters and fire supplies as climate change adaptation measures [20]. To this end, an impact assessment of future OF based on climate change scenarios is required. Recently, shared socioeconomic pathway (SSP) scenarios based on the Coupled Model Intercomparison Project Phase 6 (CMIP6) have been released [21], and future climate patterns in South Korea are expected to change according to SSP scenarios [22,23,24].
It is expected that drought frequency in South Korea will increase owing to climate change [25,26,27]. Thus, it can be projected that the OF in the future will increase by reflecting an increase in the drought frequency. In previous studies, the drought severity was analyzed to reveal the connection between forest fires and droughts [25]. The present study focused not only on the severity but also on the duration of drought, that is, drought intensity and inter-arrival. For this purpose, climate variables (relative humidity, wind speed, and precipitation) were downscaled to the observation station scale from the raw data of 18 global climate models. In addition, a deep learning model with three predictor variables—relative humidity, wind speed, and SPI—was designed to predict the OF. The future projection time horizon was divided into three periods. Finally, this study explored the significant effect of drought on forest fires by comparing the projected OF and four drought characteristics.

2. Materials and Methods
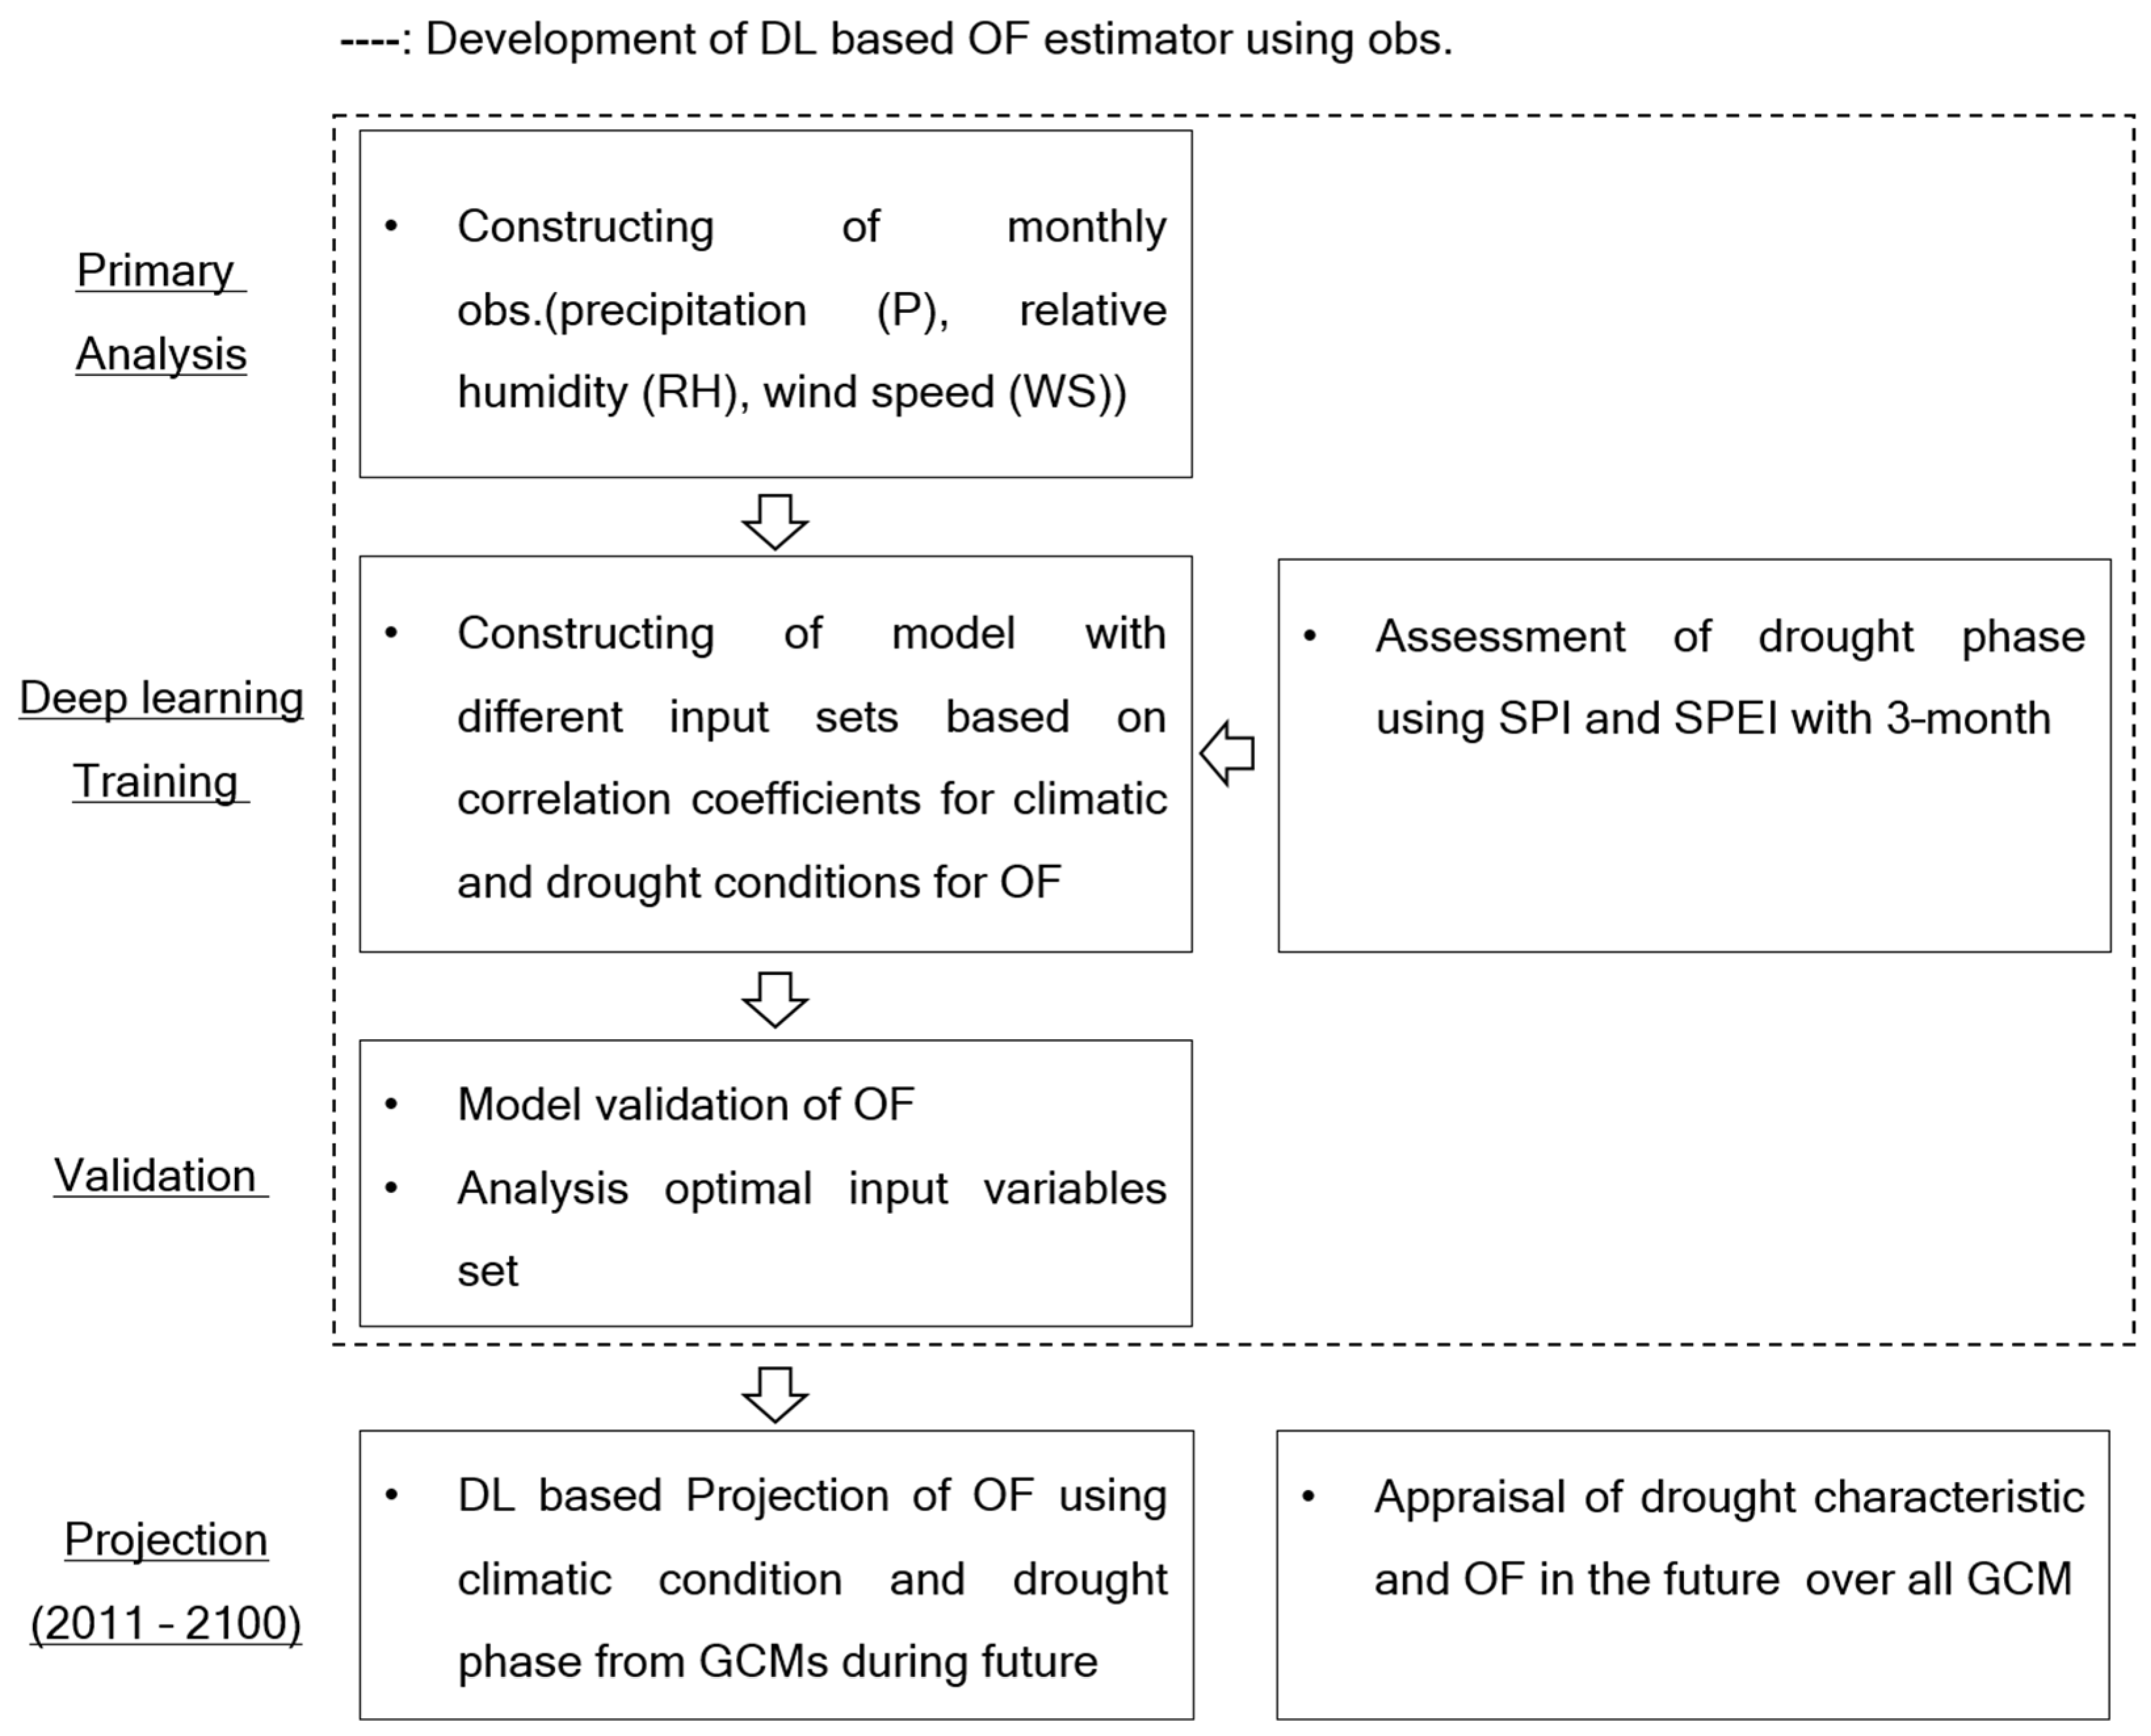
2.1. Procedure

This study projected the future OF using CMIP6 global climate models (GCMs) that were statistically downscaled to the locations of observation stations. Downscaled GCM data, monthly precipitation, relative humidity (RH), and wind speed (WS) series of the historical period were validated using the observation data. A deep learning model was developed to simulate OF with hydro-meteorological variables (RH, WS, and SPI3) as input data, considering the quantified relationship between OF and hydro-meteorological variables. Subsequently, the future OF was projected using the developed deep-learning model. Moreover, this study explored the relationship between future OF and drought characteristics to determine the drought characteristics’ influences on OF. The overall procedure of this study is illustrated in Figure 1.

2.2. Data

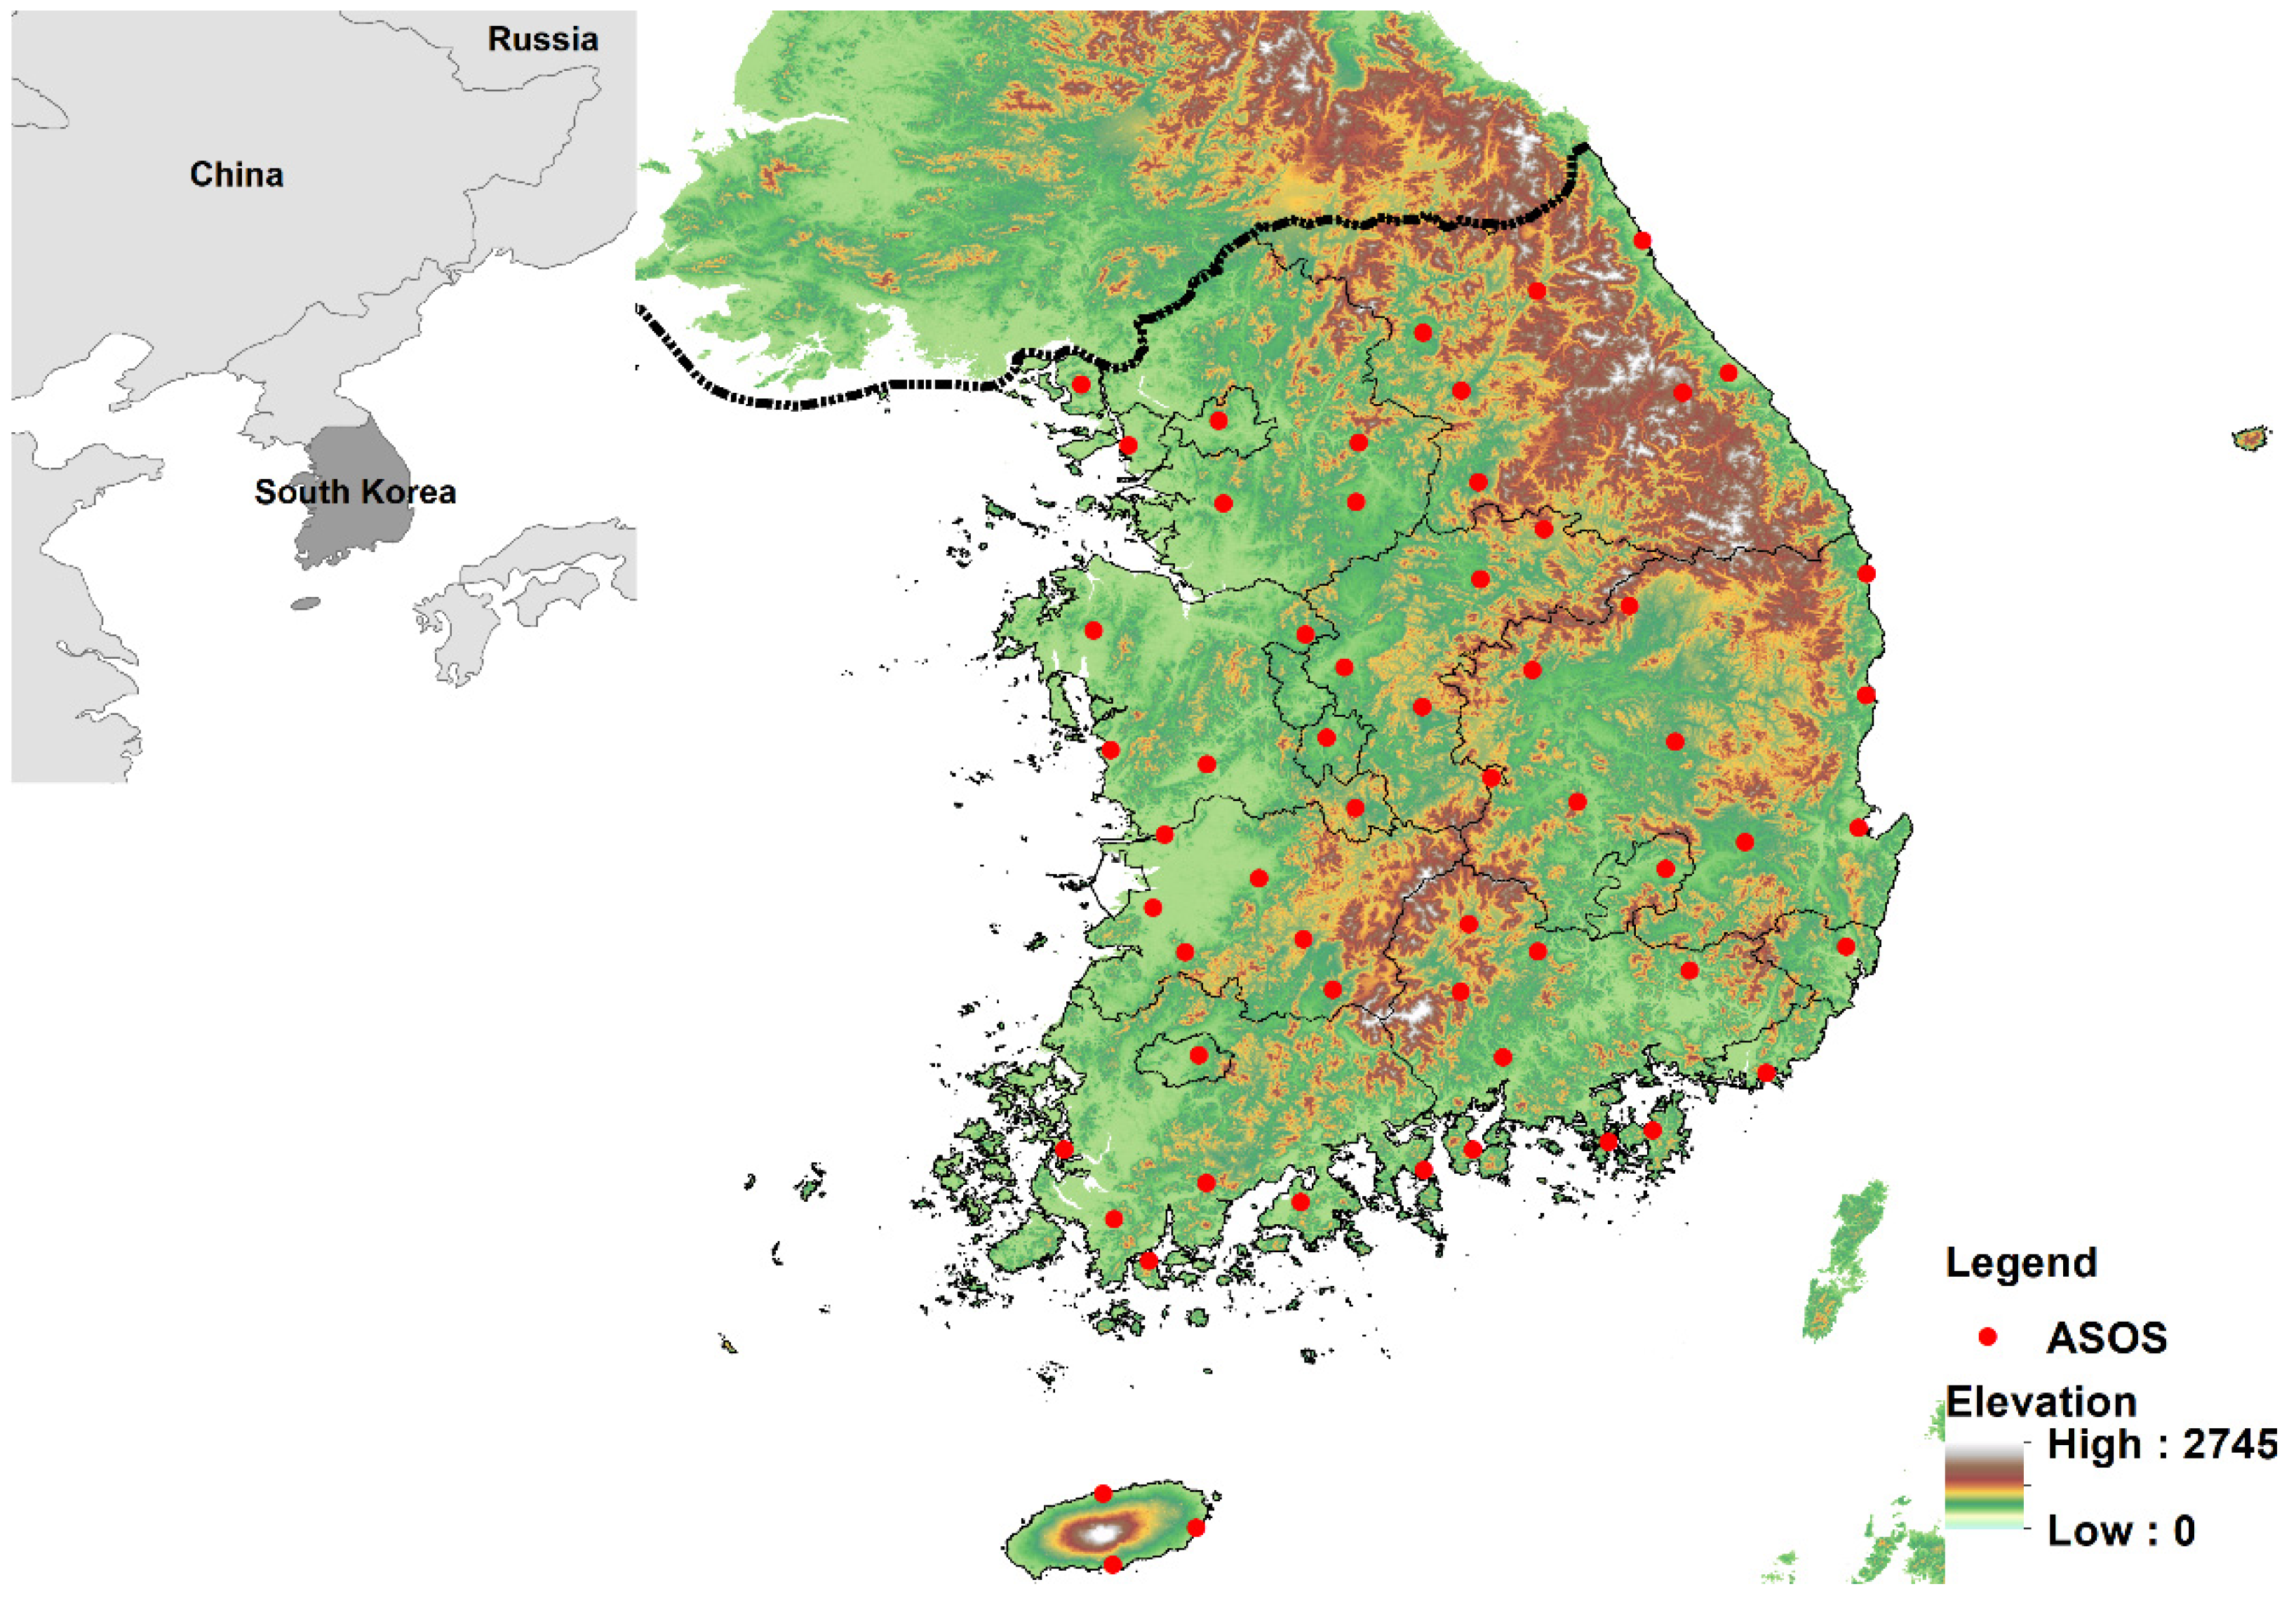
2.2.1. Application Sites and Observation Data

South Korea is geographically located at mid-latitudes and has complex climatic regimes with distinct seasonal changes. The East Asian monsoon brings warm and moist air masses over South Korea, which causes heavy rainfall during the summer season [28]. Meanwhile, South Korea is exposed to cold air masses from Siberia, which creates a considerably cold and dry climate during the winter season. Approximately two-thirds of South Korea is a mountainous region that is located in the north south direction along the eastern part of South Korea (Figure 2).
The observational data of RH and WS were provided by the Korea Meteorological Administration (KMA) from 1997 to 2019, and SPI3 was calculated using the observed precipitation provided by the KMA. The monthly mean RH was 67.4% and the lowest value was 58.7% in March. RH values were generally greater in summer (Figure 3a–c). The monthly mean of WS was 2 m/s, and the strongest WS value was 2.4 m/s, which occurred in March. In the case of the drought index, the three lowest SPI3 values were in 2000, 2001, and 2017 at −2.22, −2.57, and −1.73, respectively, which were determined to be more severe droughts than others. The observed OF data were provided by the Korea Forest Service (KFS), and the data were only available for the past 23 years (1997–2019). The average annual OF was 466.5 and the standard variation in the annual OF was 163.3. The OF in March and April was the highest, whereas it was relatively low from July to September (Figure 3d). As wildfires occurred the most frequently during the spring season, the relationship between OF and hydro-meteorological variables in the spring season was analyzed. RH showed the highest correlation (−0.7) with OF, and WS and SPI3 showed a linear relation with values of 0.5 and −0.5, respectively.

2.2.2. Climate Change Scenario Data

This study used the CMIP6 GCM data with SSP scenarios. In a comparison with the Representative Concentration Pathways (RCPs) of CMIP5, SSPs refer to global socio-economic change with greenhouse gas emissions up to 2100. SSPs are trajectories that evolve over time according to future developments in various fields, such as socio-economic, technical, energy-industrial, policy and governance, and the ecosystem. SSPs are categorized into five trajectories: (i) SSP119 denotes that the world is taking the Green Road, a sustainable path with a 1.9 W/m2 radiative forcing; (ii) SSP126 refers to fossil fuel use being minimized and eco-friendly sustainable economic growth being achieved; (iii) SSP245 denotes that climate change mitigation and socio-economic development are at an intermediate stage; (iv) SSP370 is passive in climate change mitigation policies and delays technology development; and (v) SSP585 assumes that the social structure is vulnerable to the high level of fossil fuel use, where it is assumed that indiscriminate development centered on cities will expand. In particular, SSP5 is confronted with high socioeconomic challenges to be addressed and low socioeconomic challenges for adaptation. Therefore, the SSP585 scenario, currently the only SSP scenario that results in a radiative forcing path as high as the highest RCP8.5, was used to examine the future change in OF.
In this study, 18 GCMs (Table 1) were spatially downscaled and systematic bias was corrected using the quantile mapping (QM) method with the observation data. QM corrects the systematic error of raw GCM data to fit the target cumulative distribution function (CDF) assuming that the statistical distribution of the target data is stationary. Observational data from 39 years (1972–2010) were used to develop the target CDF. For future projections, three future periods were analyzed under climate change scenarios: (i) early (F1: 2011–2040), (ii) mid-century (F2: 2041–2070), and (iii) late 21st century (F3: 2071–2100).

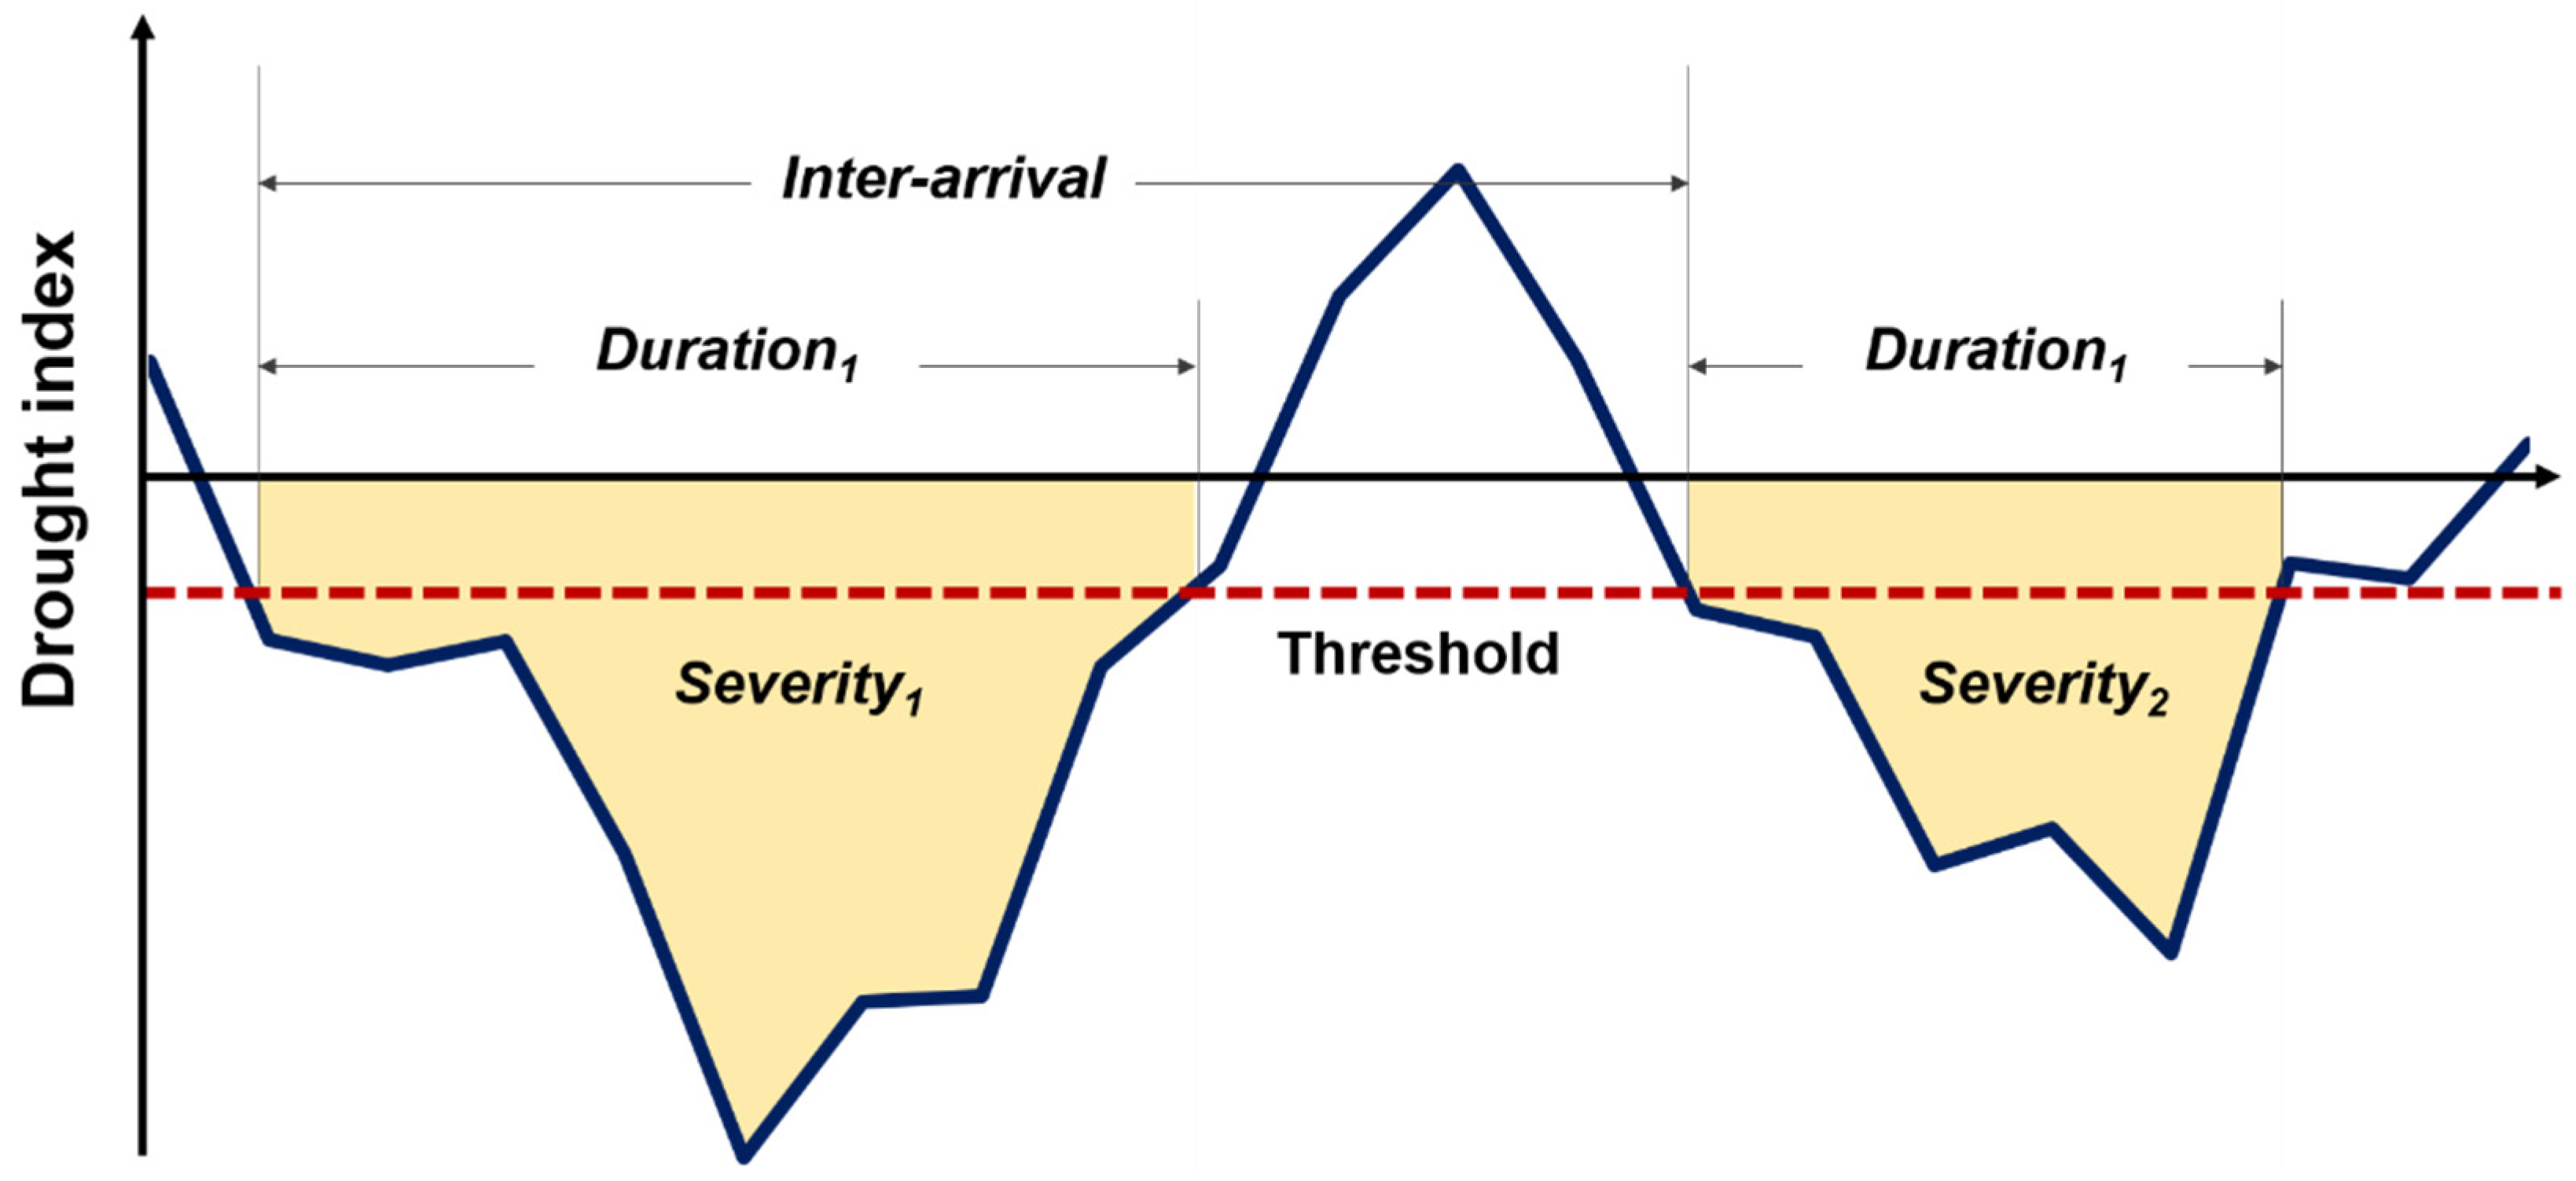
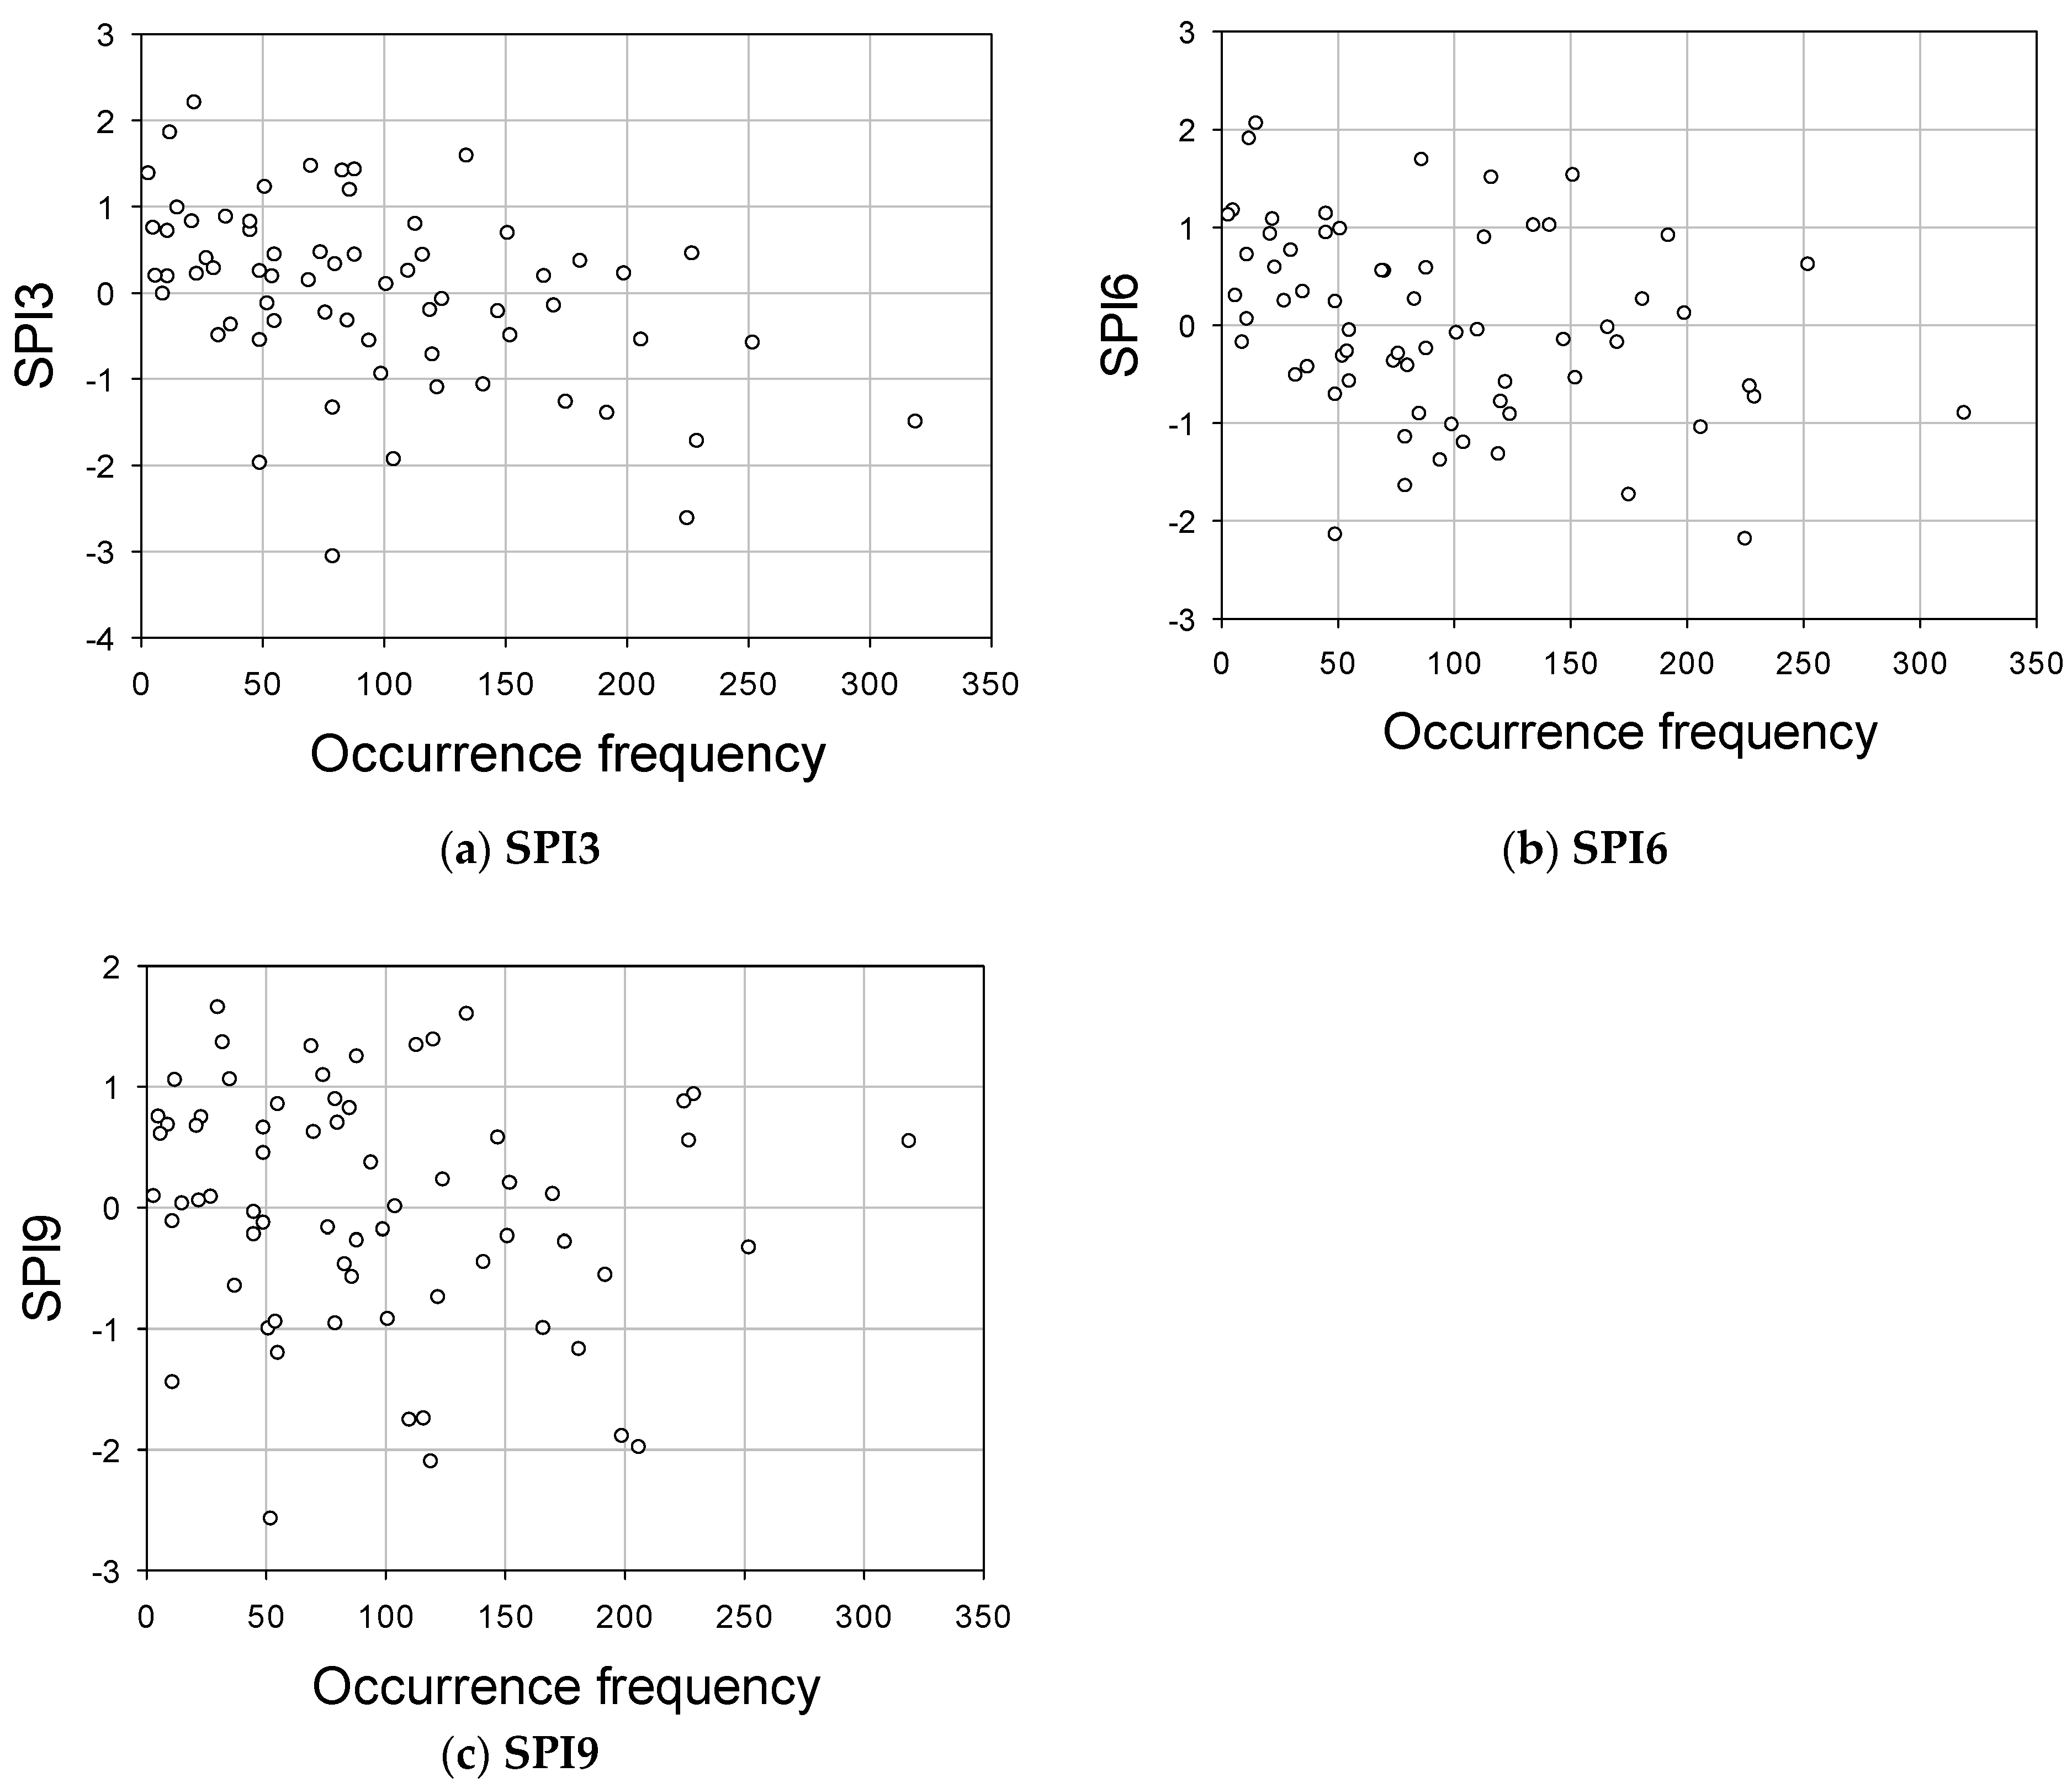
2.2.3. Standardized Precipitation Index

The SPI is one of the most widely applied meteorological drought indices over a range of timescales. It quantifies the accumulated observed precipitation as a standardized departure from normality using a selected probability distribution function [47]. The SPI employs the standardization of the probability distribution related to accumulated monthly precipitation. Regarding the probability distribution function, although Guttman [48] suggested a Pearson type-III (PT-III) as a proper probability distribution, any suitable distribution function can be adopted.
As mentioned, other drought indices, such as the SPI, the SPEI, and the PDSI, have been used in previous studies. Because there is no universal index, the choice of index is based on data availability. Although the definitions (and interpretations) of each index are different, most are characterized based on the run theory approach. The run theory [49] was introduced to recognize the characteristics of drought, such as duration, severity, intensity, and inter-arrival (as shown in Figure 4).
The SPI is generally created for different accumulation periods of one to 36 months. In the case of one- or three-month periods, short-term droughts were caused by a lack of precipitation during a short period of time. On the other hand, in the case of 12-month periods (SPI12), long-term drought caused by a persistent shortage of precipitation was evaluated. Many studies have assessed the relationship between forest fires and drought; for example, Sung et al. [7] indicated the role of the drought index in improving the performance of forest fire prediction using deep learning techniques. Thus, this study utilized a deep-learning-based model to estimate the OF with a drought index based on an analysis of the correlation between OF and SPI (Figure 5).

3. DBN-Based of Prediction Modeling

The deep belief network (DBN) is an unsupervised probabilistic deep learning algorithm composed of a few restricted Boltzmann machines that simply stake one another [50]. The DBN uses a greedy learning algorithm to train one layer at a time, starting with the bottom weight, the closest to the input layer. The DBN connects only between layers, and there is no connection between the units within a layer. The vanishing gradient problem, which occurs as the number of layers increases in conventional machine learning, was improved through pre-training in the DBN.
To estimate the OF, Sung et al. [7] suggested RH, WS, and SPI3 as the input data. Thus, this study used RH, WS, and SPI3 as the input data to develop a DBN-based model. The parameters in the DBN model, hidden units (10, 20, 30), learning rates (0.1, 0.5, and 0.9), epochs (100, 500, and 1000), and batch size (6, 12, and 24), were optimized using datasets from 1997 to 2013 and validated using data from the rest period from 2014 to 2019. The optimal values of the parameters were varied by the input datasets. The hidden unit, learning rate, epoch, and batch size were 10, 0.9, 500, and 12 for RH-WS-SPI3-AOF, and 10, 0.9, 1000, and 6 for RH-WS-AOF. The OF time series of both observations and the four DBN model-based estimations are shown in Figure 6.
The evaluation of the DBN model based on four different combinations of input data sets (RH-WS-SPI3-AOF, RH-WS-AOF, RH-AOF, WS-AOF) was conducted using three preference indices (root mean square error, RMSE; Nash–Sutcliff efficiency, NSE; and determination coefficient, R2) in Table 2. The acronyms in front of the AOF are independent variables, whereas AOF is the dependent variable of the DBN model. The RH-WS-SPI3-AOF and RH-WS-AOF matched the observations well; however, WS-AOF did not. The NSE and R2 values of RH-WS-SPI3-AOF were 0.837, and 0.855, which were superior to those of RH-WS-AOF, RH-AOF, and WS-AOF. The DBN model improved when the drought index was included. It was similarly explained in previous studies that RH and WS, including drought, caused OF.

4. Results

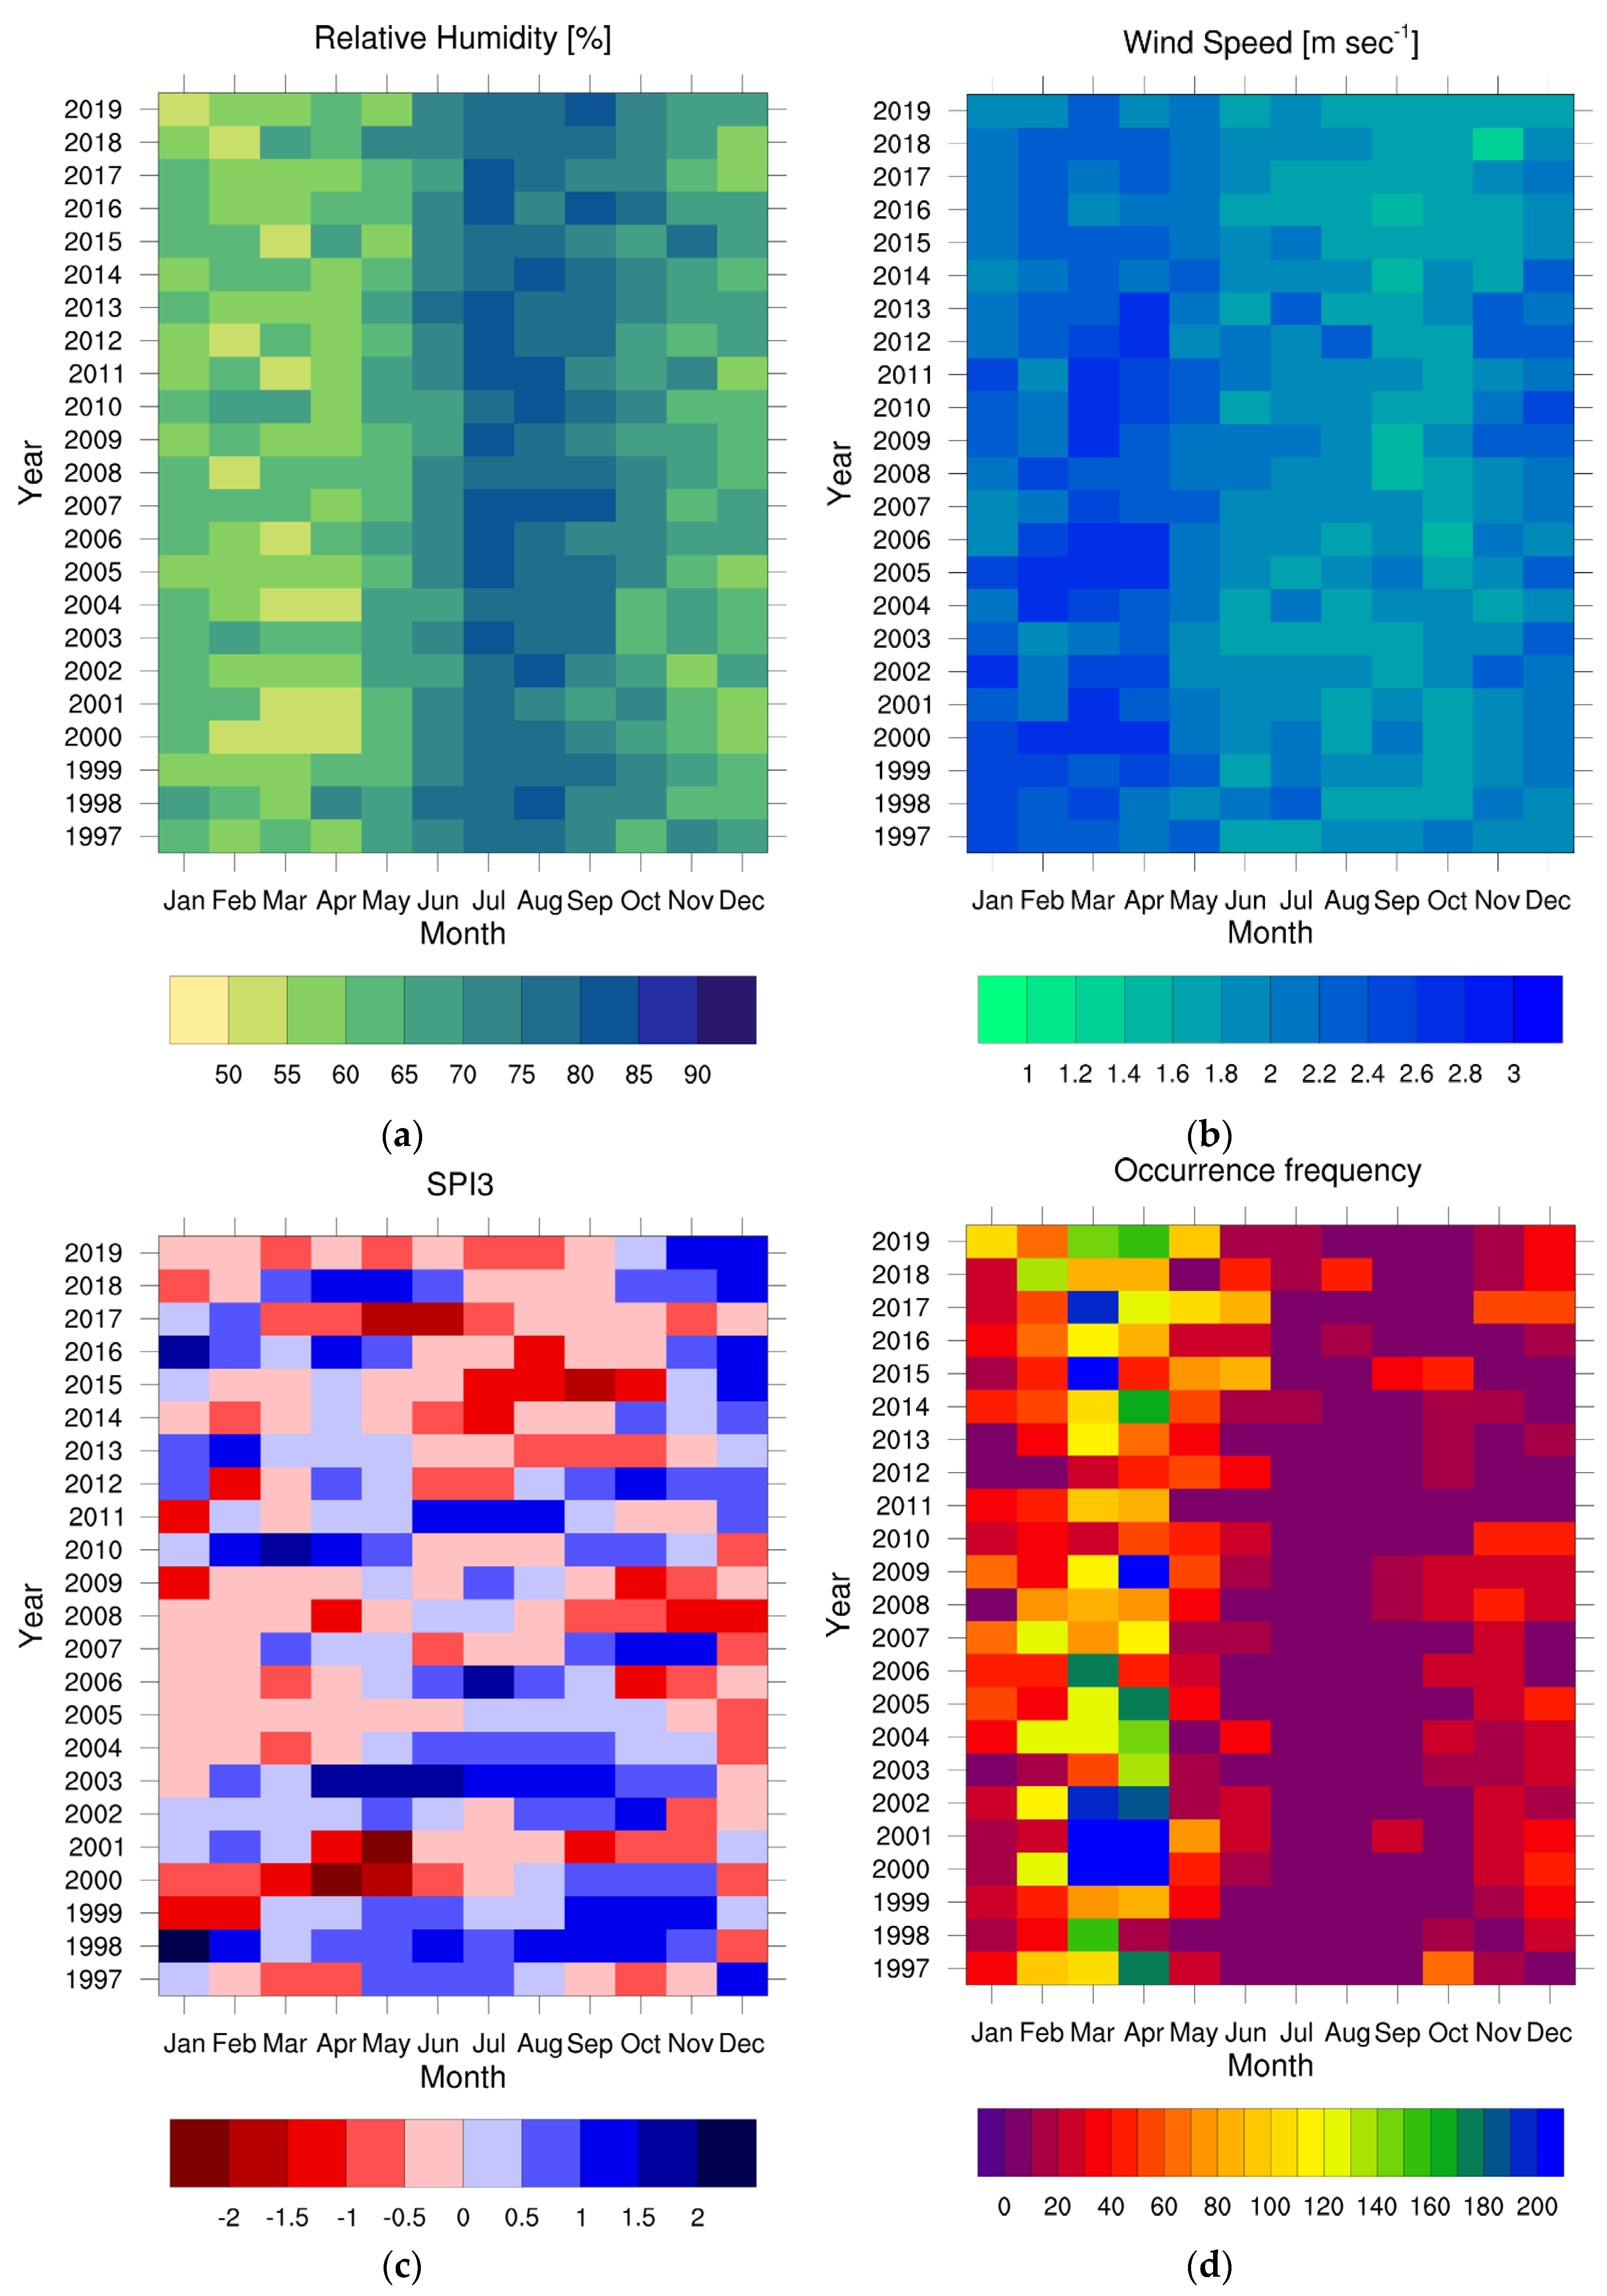
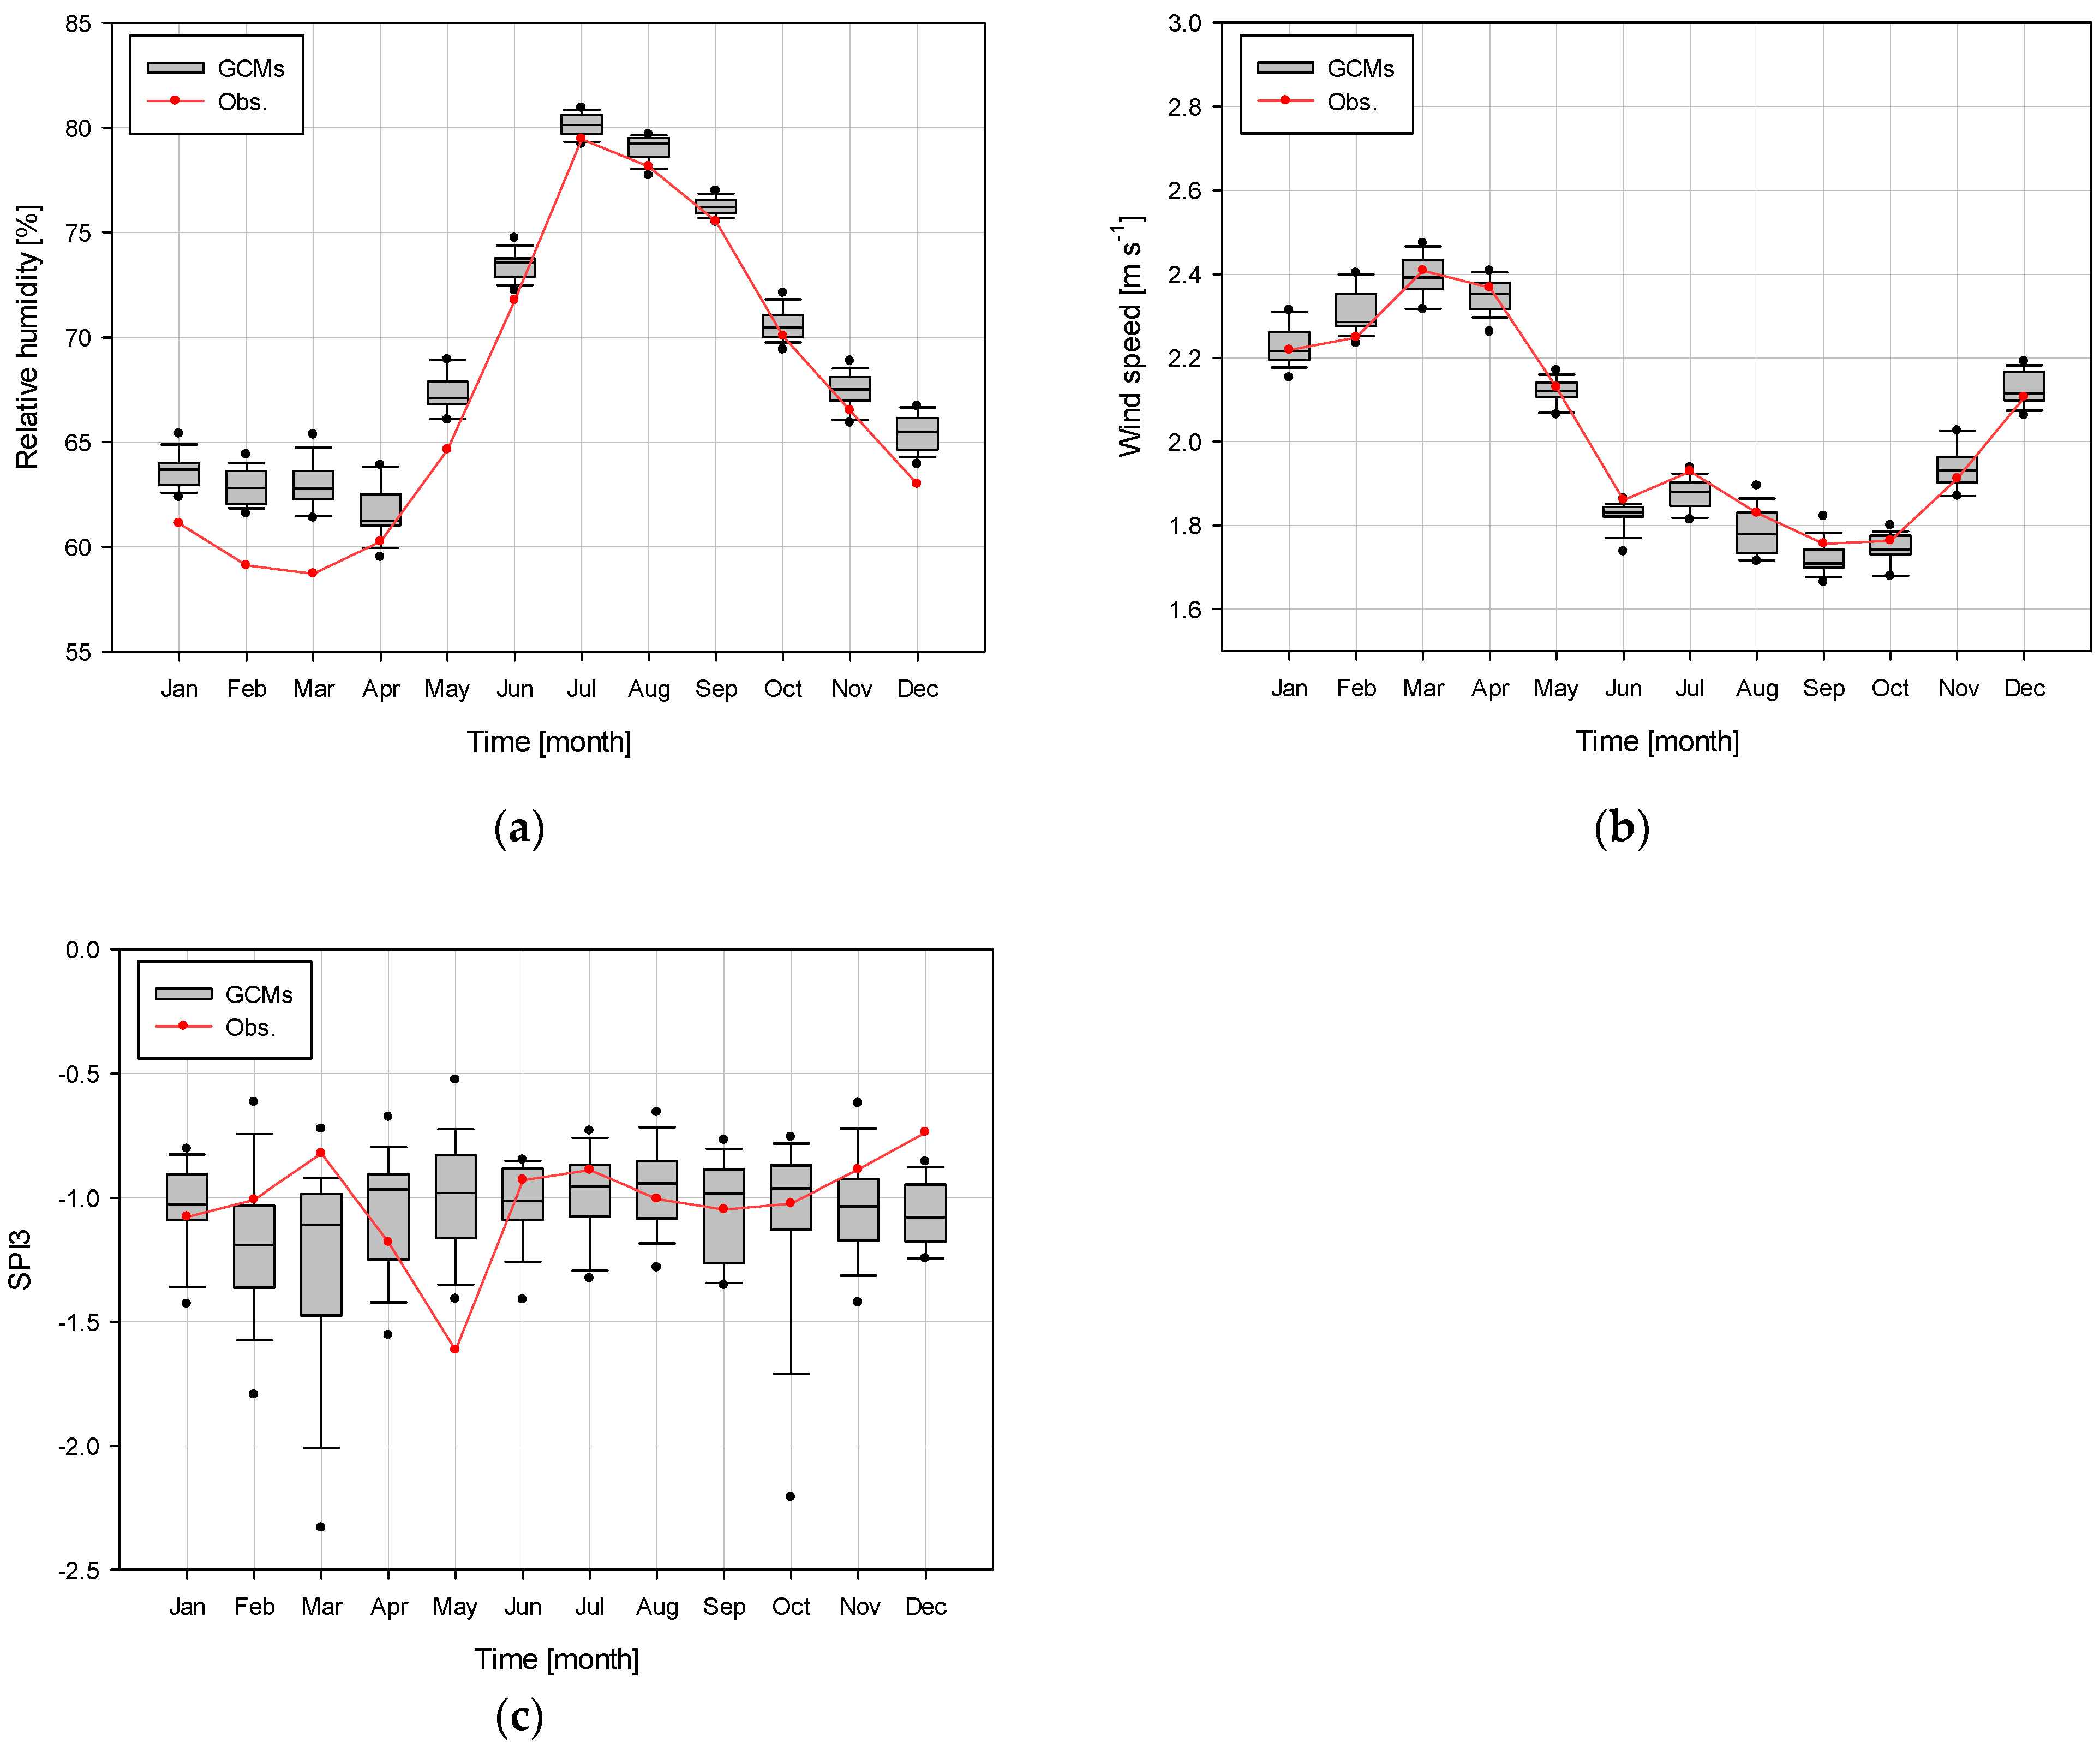
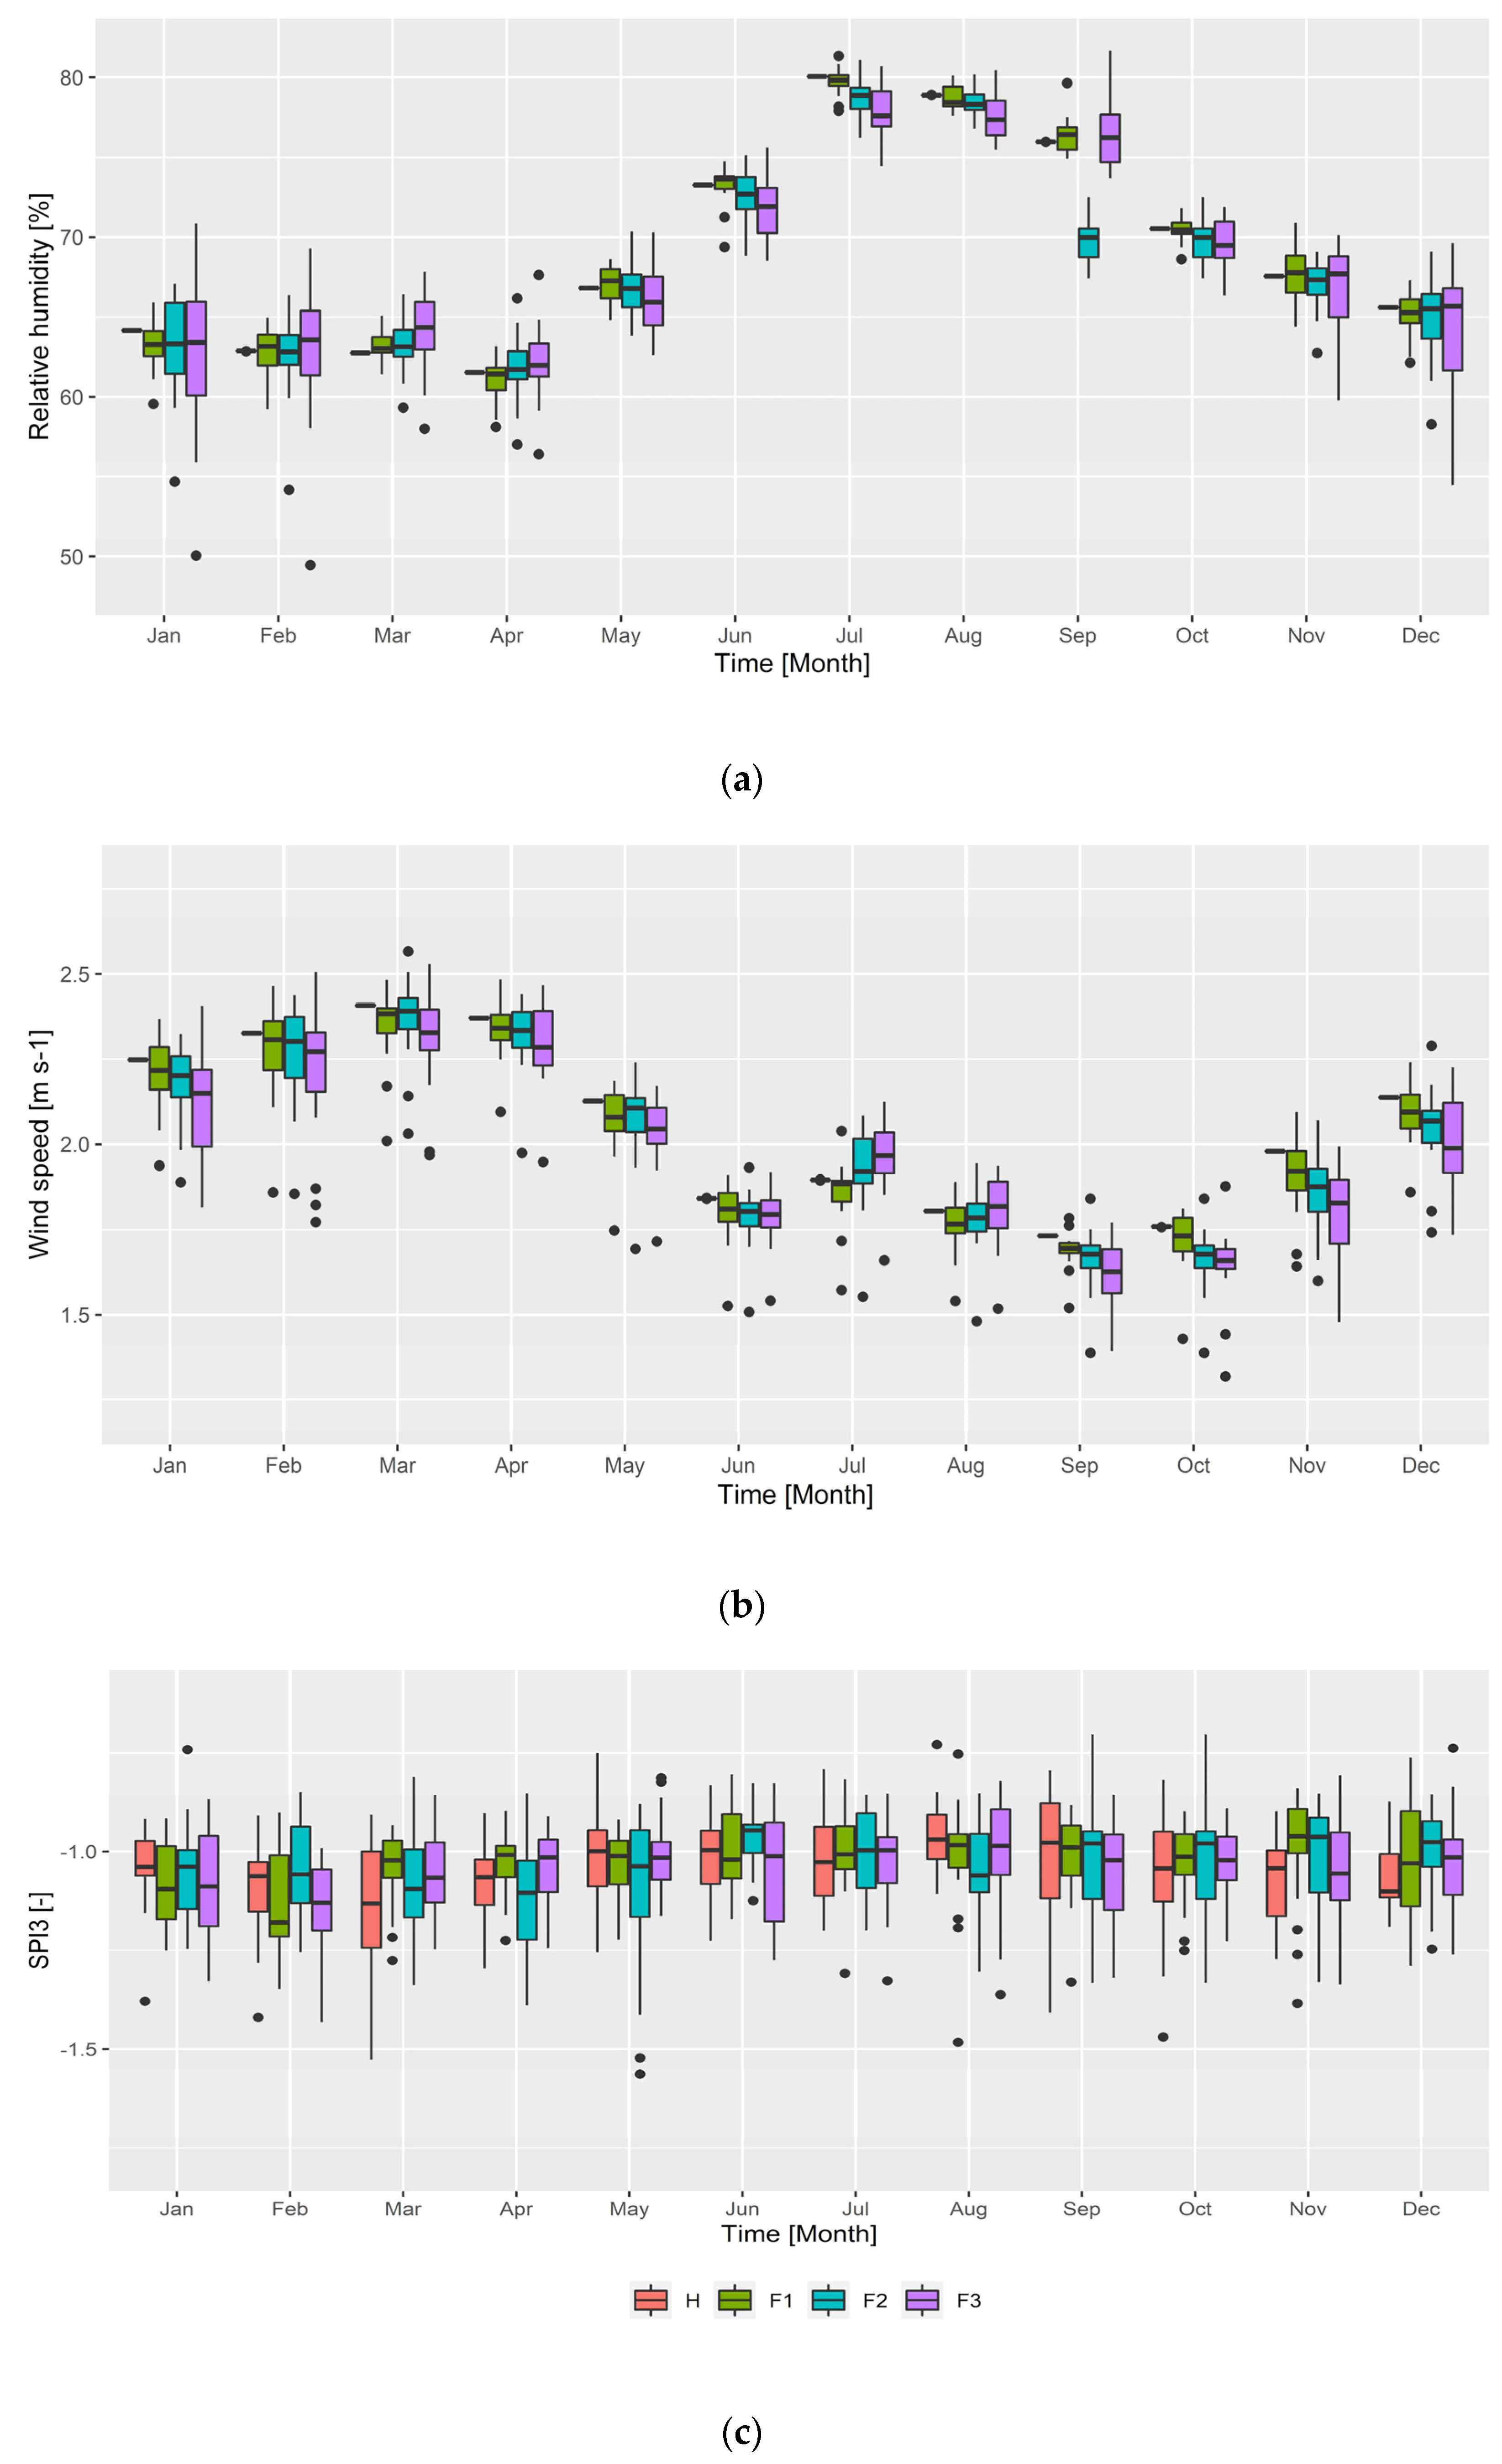
4.1. Projection of Hydro-Meteorological Variables
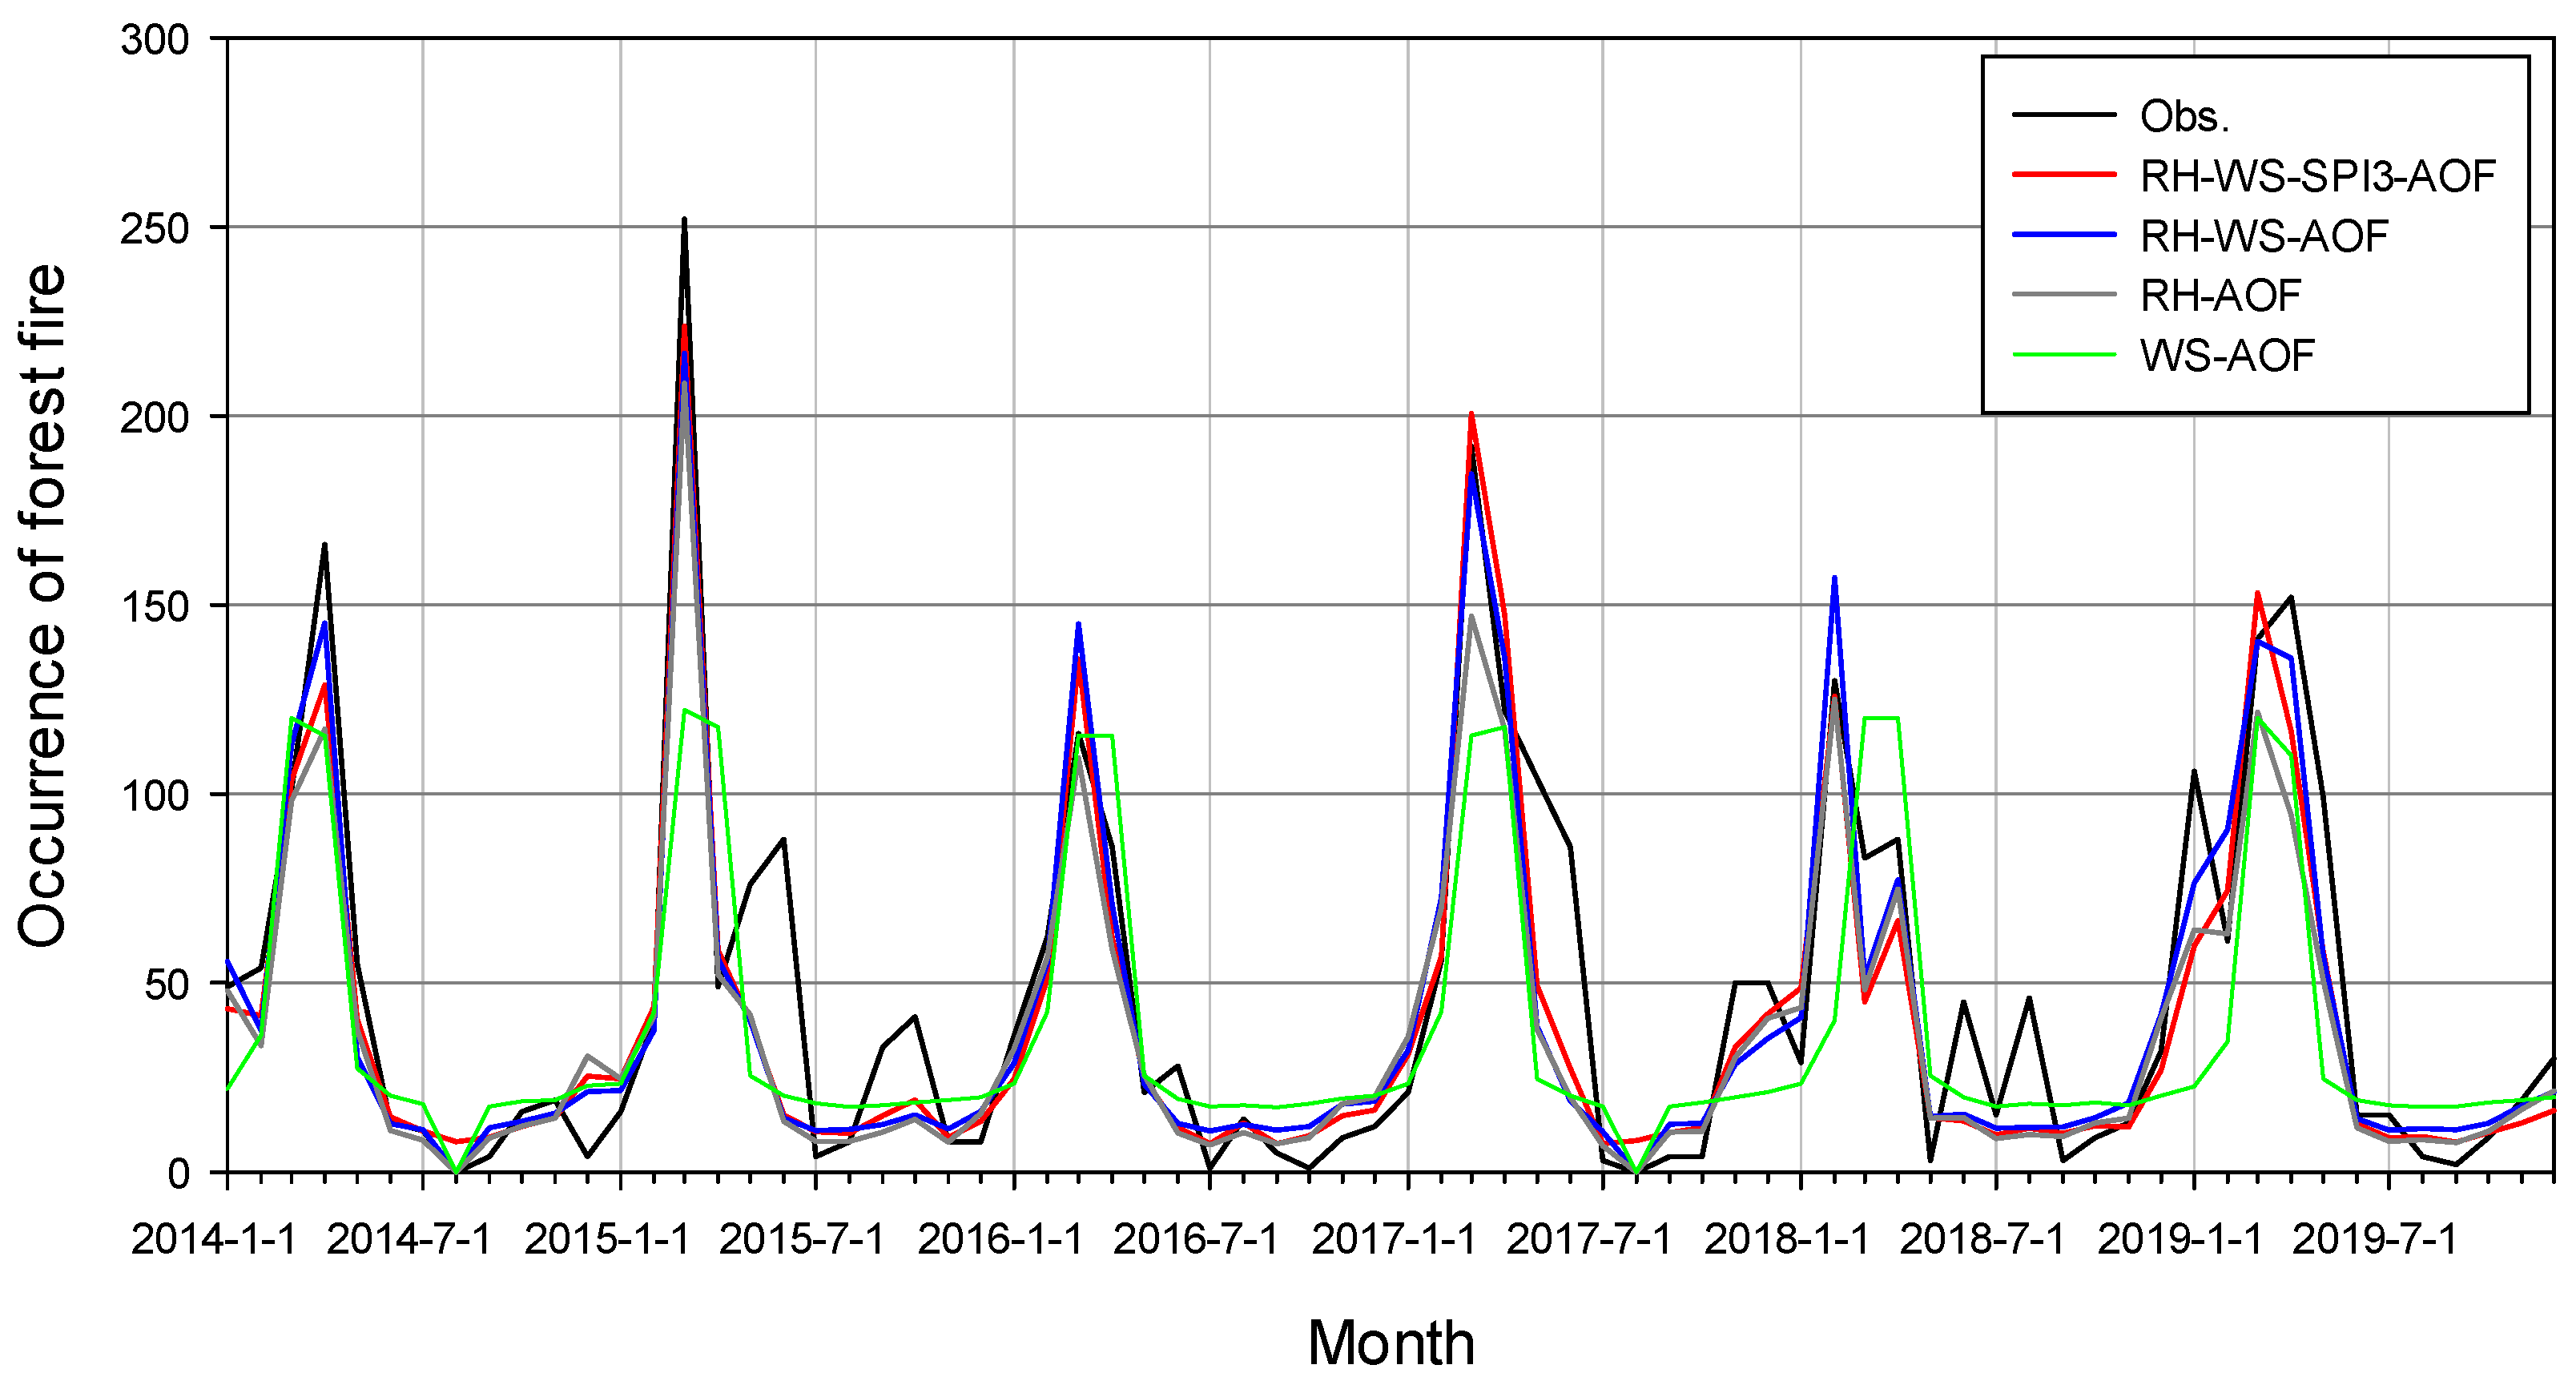
This study compared the simulated RH, WS, and SPI3 series with observations from 1997 to 2019. Overall, the RH values driven by the GCMs were overestimated; however, the monthly variability was well matched with the observations (as shown in Figure 7a). The inter-model variability (range of the box plots) was larger when RH was relatively low. The simulated monthly variabilities of WS were also well matched to the observations (as depicted in Figure 7b). In the case of SPI3, the value was examined only when it was less than or equal to −0.5. Although SPI3 was well matched with the observations, SPI3 (≤−0.5) in Figure 7c could not output close values to the observations in a few months, such as March and May. This finding indicates that the GCM-based SPI3, where it was less than or equal to −0.5, was weakly evaluated in the past climate.
Figure 8 shows the monthly variability and inter-model variability of RH, WS, and SPI3 in the historical period and the future periods (F1, F2, and F3). The average value of RH across GCMs in the spring season is 63.69% in the historical period and is projected to increase up to 63.78%, 63.95%, and 64.10% in the future periods F1, F2, and F3, respectively. The inter-model variability of RH will be increased in the future. On the other hand, the WS in spring is projected to slightly decrease by 0.98%, 0.98%, and 0.96% in the future periods F1, F2, and F3, respectively, compared to the historical period (2.37 m/s). The SPI3 for March and April is projected to increase, which means that the frequency of severe drought will decrease in the future. It is evident that the model uncertainty of SPI3 is greater owing to the large inter-model variability of precipitation.
In addition to the current variability of RH, WS, and SPI3, future changes in RH, WS, and SPI3 were projected using 18 CMIP6 GCMs. The future trend of RH was decreasing compared to the current trend; in particular, IPSL-CM6A-LR showed large decrement rates of −1.6%, −3.9%, and −8.8% for periods F1, F2, and F3, respectively. The WS trends indicated a decrease in the future, except for ACCESS-ESM1-5 and MRI-ESM2-0. The drought severity (defined as SPI3 values less than or equal to −0.5) of IPSL-CM6A-LR increased by 11.8% and 7.0% in periods F1 and F3, respectively. In addition, ACCESS-ESM1-5, EC-Earth3, and INM-CM4-8 showed increasing trends. Wildfires are prone to accelerate and spread when the RH is projected to decrease and WS and SPI3 are projected to increase in the future. Therefore, according to the projection of the IPSL-CM6A-LR model, it is projected that the OF will increase in the future compared to the current climate (as shown in Figure 9).

4.2. OF Projection

This study projected future changes in OF using DBN and hydro-meteorological variables as input data. The annual mean of the OF in the historic period was 569.3 (H), and the GCM ensemble mean in the future was 544.7 (F1), 540.9 (F2), and 530.8 (F3), expected to decrease due to climate change. In the spring season, the most frequent wildfire occurrence season, the future OF was projected to decrease by 5%, 7%, and 9% during the F1, F2, and F3 periods, respectively, compared with the current period. Although it was projected that the OF in the spring season would decrease, it had the highest OF compared to other seasons.
In contrast, the IPSL-CM6A-LR and EC-Earth3 models projected an increase in OF in the future. The inter-model variability of hydro-meteorological variables in the future period was enlarged owing to the different dynamics between models, which caused the large uncertainty of the future OF. The OF driven by the EC-Earth3 model was 531.4 in the current period, and 583.7 and 541.5 in the F1 and F2 periods, respectively. The OF driven by the IPSL-CM6A-LR model was also projected to increase by 5.0% in the F3 period according to the decrease in RH in future periods (as shown in Figure 10).
Wildfires in Korea occurred more frequently in spring (March to May) than in other seasons, and the same tendency was projected in the future. The OF in the spring season was projected to decrease in the future by 11%, 8%, and 2% in the F1, F2, and F3 periods, respectively, according to the increase in RH compared to the current period. However, it was projected that the future OF in the summer season (June to August) would increase by 15% compared to the current value. On the other hand, the OF in the autumn and winter seasons was projected to decrease compared to the current period.

5. Discussion

The OF is strongly associated with drought conditions, which imply soil dryness and a lack of precipitation [51,52]. Previous studies have introduced drought indices to estimate the OF. Sung et al. [7] improved the performance of the DBN model to estimate the OF by using the drought indices SPI and SPEI as input variables. Meteorological drought is defined as a continuation of lower precipitation than normal, and it can be characterized according to duration, intensity, and severity [7].
Therefore, this study investigated the relationship between the OF and drought characteristics. The annual drought characteristics (duration, severity, intensity, and inter-arrival) obtained from SPI3 using observed precipitation data were compared with the observed OF to determine their relationship. Figure 11 presents scatter plots between the OF and each drought characteristic. The correlation coefficients between the OF and each drought characteristic (duration, severity, intensity, and inter-arrival) are 0.49, 0.54, 0.47, and 0.16, respectively. The drought duration and severity are strongly correlated with the OF. The relationship between drought intensity and OF is also strong (0.47) and relates to drought duration. Nonetheless, because drought intensity is calculated by dividing the drought severity by the duration, it can be considered that the drought severity and duration are sufficient to explain the relationship of drought intensity to the OF.
The distinct change in future hydro-meteorology in Korea is associated with a high risk of drought due to a decrease in precipitation and increase in temperature [25,53]. Furthermore, as the dispersion between future scenarios becomes larger, that is, the inter-model variability across multiple GCMs and scenarios becomes wider, it is noted that there will be immense uncertainty in future projections under climate change. Thus, this study assessed the relationship between OF and drought characteristics based on the overall scenarios under CMIP6 GCMs and SSPs by considering inter-model variability.
Figure 12a shows the number of GCMs for each drought characteristic that has the strongest correlation between the OF and drought characteristics in historical and future periods. For instance, drought duration shows the strongest correlation with the OF among three GCMs. Similarly, the drought severity shows the greatest correlation with the OF in eight GCMs, and the drought intensity showed the greatest correlation with the OF in six GCMs, whereas inter-arrival has no predominant correlation with the OF in the historical period. In the F1 period, the numbers of GCMs that show the highest correlation between OF and duration, severity, intensity, and inter-arrival are five, five, five, and two, respectively. Similarly, the numbers of GCMs are zero, eleven, three, and four in the F2 period and six, seven, four, and one in the F3 period. In the case of drought severity, the majority of GCMs show the highest correlation with OF, as indicated clearly in the F2 period. In addition, drought severity and duration show a strong relationship with OF in the F3 period. Although there is large inter-model variability across multiple GCMs, the drought severity and duration can be predictors for the projection of the OF under changing climate conditions in the future. Therefore, persistent drought during a short-term period would be an influential factor in managing future OF.
The effects of drought characteristics on the OF were evaluated by examining the drought characteristics that had the strongest correlation with the OF in each period (H, F1, F2, and F3), as shown in Figure 12b. Drought severity shows a higher correlation with OF than other drought characteristics, which means that the largest number of GCMs shows the greatest correlation coefficient value with OF. The annual mean values of drought severity across the corresponding GCMs are −5.0, −4.7, −4.8, and −4.8 for the H, F1, F2, and F3 periods, respectively, which means that the drought severity will be weaker in the future. Moreover, drought duration has a greater effect on OF in the F3 period than in the other periods. Nonetheless, these results show that the OF will be affected not only by the severity of the drought but also by its intensity and duration. In the F2 and F3 periods, the effect of intensity will be reduced, yet it will show a strong relationship with the OF in the near future. Although these dependencies of drought characteristics on the OF vary across different future periods, it is clear that drought mitigation plans should focus on reducing the drought duration to reduce the OF in the future.

6. Conclusions

This study utilized a DBN-based model that quantifies climatic and drought conditions to project the OF in the future for South Korea. In particular, SSP scenarios were employed for quantification of the OF. The annual mean RH was projected to increase in the future, but it was projected to decrease during the summer season. Accordingly, it was projected that the OF will decrease compared to the current climate; however, it will relatively increase in summer. Moreover, the faster the wind speed, the faster the forest fire will spread. The wind speed in the summer is projected to increase, and the spread of forest fires will increase accordingly.
Most previous studies have quantified the relationship between drought severity and OF. In this study, the relationship between multivariate drought characteristics and OF was analyzed for the first time. The effects on OF were similar for drought duration and severity. To mitigate the risk of forest fires in the future, designing an approach to minimize the duration as well as the severity should be a research focus. Short- and long-term policies to mitigate drought risk through prevention should be implemented. According to the results of this study, there is a need for water resource management in forest basins to prevent drought conditions due to climate change. Therefore, it is necessary to secure sufficient water resources through integrated watershed management. It is also necessary to build a management system that can terminate a drought within a short period by leveraging secured water resources, even if a drought occurs in the forest watershed. Moreover, summer is a season with larger human activities, increasing the risk of accidental fires. Therefore, it is also necessary to consider external factors, such as human activities in the forest.
In this study, changes in the OF were projected based on the SSP585 scenario. In particular, we quantified inter-model variability across climate change scenarios and explored the relation between OF and characteristics of meteorological drought. As a future study, a water balance model might be adopted so that available water resources in the forest area can be quantified, and the relationship between available water resources and the OF can be analyzed. Furthermore, advanced technologies are required to minimize drought by managing available water resources.

Author Contributions

Conceptualization, J.H.S.; analysis and writing, J.H.S. and Y.R.; data collection, S.B.S.; figure drawing, Y.R.; typesetting, Y.R.; funding acquisition, S.B.S. All authors have read and agreed to the published version of the manuscript.

Funding

This study was supported by the National Research Foundation of Korea (NRF), grant number NRF-2021R1C1C1004492.

Institutional Review Board Statement

Not applicable.

Informed Consent Statement

Not applicable.

Data Availability Statement

Not applicable.

Acknowledgments

The authors would like to acknowledge the National Research Foundation of Korea for funding our research publication.

Conflicts of Interest

The authors declare no conflict of interest.

References

  1. Lan, Z.; Su, Z.; Guo, M.; Alvarado, E.C.; Guo, F.; Hu, H.; Wang, G. Are Climate Factors Driving the Contemporary Wildfire Occurrence in China? Forests 2021, 12, 392. [Google Scholar] [CrossRef]
  2. Clark, J.S. Fire and Climate Change during the Last 750 Yr in Northwestern Minnesota. Ecol. Monogr. 1990, 60, 135–159. [Google Scholar] [CrossRef]
  3. Pausas, J.G. Changes in Fire and Climate in the Eastern Iberian Peninsula (Mediterranean Basin). Clim. Change 2004, 63, 337–350. [Google Scholar] [CrossRef]
  4. Wang, X.; Parisien, M.-A.; Taylor, S.W.; Candau, J.-N.; Stralberg, D.; Marshall, G.A.; Little, J.M.; Flannigan, M.D. Projected Changes in Daily Fire Spread across Canada over the next Century. Environ. Res. Lett. 2017, 12, 025005. [Google Scholar] [CrossRef]
  5. Sung, J.H.; Seo, S.B. Estimation of River Management Flow Considering Stream Water Deficit Characteristics. Water 2018, 10, 1521. [Google Scholar] [CrossRef] [Green Version]
  6. Sung, J.H.; Kim, J.; Chung, E.-S.; Ryu, Y. Deep-Learning Based Projection of Change in Irrigation Water-Use under RCP 8.5. Hydrol. Processes 2021, 35, e14315. [Google Scholar] [CrossRef]
  7. Sung, J.H.; Ryu, Y.; Seong, K.-W. Deep Learning-Based Prediction of Fire Occurrence with Hydroclimatic Condition and Drought Phase over South Korea. KSCE J. Civ. Eng. 2022, 26, 2002–2012. [Google Scholar] [CrossRef]
  8. McKee, T.B.; Doesken, N.J.; Kleist, J. The Relationship of Drought Frequency and Duration to Time Scales. In Proceedings of the Eighth Conference on Applied Climatology, Anaheim, CA, USA, 17–22 January 1993; pp. 179–184. [Google Scholar]
  9. Vicente-Serrano, S.M.; Beguería, S.; López-Moreno, J.I. A Multiscalar Drought Index Sensitive to Global Warming: The Standardized Precipitation Evapotranspiration Index. J. Clim. 2010, 23, 1696–1718. [Google Scholar] [CrossRef] [Green Version]
  10. Yoon, S.-H.; Won, M.-S. Correlation Analysis of Forest Fire Occurrences by Change of Standardized Precipitation Index. J. Korean Assoc. Geogr. Inf. Stud. 2016, 19, 14–26. [Google Scholar] [CrossRef]
  11. Turco, M.; von Hardenberg, J.; AghaKouchak, A.; Llasat, M.C.; Provenzale, A.; Trigo, R.M. On the Key Role of Droughts in the Dynamics of Summer Fires in Mediterranean Europe. Sci. Rep. 2017, 7, 81. [Google Scholar] [CrossRef] [Green Version]
  12. Westerling, A.L.; Hidalgo, H.G.; Cayan, D.R.; Swetnam, T.W. Warming and Earlier Spring Increase Western U.S. Forest Wildfire Activity. Science 2006, 313, 940–943. [Google Scholar] [CrossRef] [PubMed] [Green Version]
  13. Westerling, A.L.; Turner, M.G.; Smithwick, E.A.H.; Romme, W.H.; Ryan, M.G. Continued Warming Could Transform Greater Yellowstone Fire Regimes by Mid-21st Century. Proc. Natl. Acad. Sci. USA 2011, 108, 13165–13170. [Google Scholar] [CrossRef] [PubMed] [Green Version]
  14. Morgan, P.; Heyerdahl, E.K.; Gibson, C.E. Multi-Season Climate Synchronized Forest Fires throughout the 20th Century, Northern Rockies, USA. Ecology 2008, 89, 717–728. [Google Scholar] [CrossRef] [PubMed] [Green Version]
  15. Chen, F.; Niu, S.; Tong, X.; Zhao, J.; Sun, Y.; He, T. The Impact of Precipitation Regimes on Forest Fires in Yunnan Province, Southwest China. Sci. World J. 2014, 2014, e326782. [Google Scholar] [CrossRef] [Green Version]
  16. Williams, A.P.; Abatzoglou, J.T. Recent Advances and Remaining Uncertainties in Resolving Past and Future Climate Effects on Global Fire Activity. Curr. Clim. Change Rep. 2016, 2, 1–14. [Google Scholar] [CrossRef] [Green Version]
  17. Piñol, J.; Terradas, J.; Lloret, F. Climate Warming, Wildfire Hazard, and Wildfire Occurrence in Coastal Eastern Spain. Clim. Change 1998, 38, 345–357. [Google Scholar] [CrossRef]
  18. Flannigan, M.D.; Stocks, B.J.; Wotton, B.M. Climate Change and Forest Fires. Sci. Total Environ. 2000, 262, 221–229. [Google Scholar] [CrossRef]
  19. McCoy, V.M.; Burn, C.R. Potential Alteration by Climate Change of the Forest-Fire Regime in the Boreal Forest of Central Yukon Territory. Arctic 2005, 58, 276–285. [Google Scholar] [CrossRef] [Green Version]
  20. Ma, S.; Liu, Q.; Zhang, Y. A Prediction Method of Fire Frequency: Based on the Optimization of SARIMA Model. PLoS ONE 2021, 16, e0255857. [Google Scholar] [CrossRef]
  21. Meinshausen, M.; Nicholls, Z.R.J.; Lewis, J.; Gidden, M.J.; Vogel, E.; Freund, M.; Beyerle, U.; Gessner, C.; Nauels, A.; Bauer, N.; et al. The Shared Socio-Economic Pathway (SSP) Greenhouse Gas Concentrations and Their Extensions to 2500. Geosci. Model. Dev. 2020, 13, 3571–3605. [Google Scholar] [CrossRef]
  22. Song, Y.H.; Chung, E.-S.; Shahid, S. Spatiotemporal Differences and Uncertainties in Projections of Precipitation and Temperature in South Korea from CMIP6 and CMIP5 GCMs. Int. J. Climatol. 2021, 41, 5899–5919. [Google Scholar] [CrossRef]
  23. Song, Y.H.; Nashwan, M.S.; Chung, E.-S.; Shahid, S. Advances in CMIP6 INM-CM5 over CMIP5 INM-CM4 for Precipitation Simulation in South Korea. Atmos. Res. 2021, 247, 105261. [Google Scholar] [CrossRef]
  24. Kim, J.H.; Sung, J.H.; Chung, E.-S.; Kim, S.U.; Son, M.; Shiru, M.S. Comparison of Projection in Meteorological and Hydrological Droughts in the Cheongmicheon Watershed for RCP4.5 and SSP2-4.5. Sustainability 2021, 13, 2066. [Google Scholar] [CrossRef]
  25. Sung, J.H.; Chung, E.-S.; Shahid, S. Reliability–Resiliency–Vulnerability Approach for Drought Analysis in South Korea Using 28 GCMs. Sustainability 2018, 10, 3043. [Google Scholar] [CrossRef] [Green Version]
  26. Kwon, M.; Sung, J.H. Changes in Future Drought with HadGEM2-AO Projections. Water 2019, 11, 312. [Google Scholar] [CrossRef] [Green Version]
  27. Ryu, Y.; Chung, E.-S.; Seo, S.B.; Sung, J.H. Projection of Potential Evapotranspiration for North Korea Based on Selected GCMs by TOPSIS. KSCE J. Civ Eng. 2020, 24, 2849–2859. [Google Scholar] [CrossRef]
  28. Chen, T.-C.; Wang, S.-Y.; Huang, W.-R.; Yen, M.-C. Variation of the East Asian Summer Monsoon Rainfall. J. Clim. 2004, 17, 744–762. [Google Scholar] [CrossRef]
  29. John, J.G.; Blanton, C.; McHugh, C.; Radhakrishnan, A.; Rand, K.; Vahlenkamp, H.; Wilson, C.; Zadeh, N.T.; Dunne, J.P.; Dussin, R.; et al. NOAA-GFDL GFDL-ESM4 Model Output Prepared for CMIP6 ScenarioMIP; Version 20180701; Earth System Grid Federation: Greenbelt, MD, USA, 2018. [Google Scholar] [CrossRef]
  30. Yukimoto, S.; Kawai, H.; Koshiro, T.; Oshima, N.; Yoshida, K.; Urakawa, S.; Tsujino, H.; Deushi, M.; Tanaka, T.; Hosaka, M.; et al. The Meteorological Research Institute Earth System Model Version 2.0, MRI-ESM2.0: Description and Basic Evaluation of the Physical Component. J. Meteorol. Soc. Japan. Ser. II 2019, 97, 931–965. [Google Scholar] [CrossRef] [Green Version]
  31. Voldoire, A.; Saint-Martin, D.; Sénési, S.; Decharme, B.; Alias, A.; Chevallier, M.; Colin, J.; Guérémy, J.-F.; Michou, M.; Moine, M.-P.; et al. Evaluation of CMIP6 DECK Experiments With CNRM-CM6-1. J. Adv. Modeling Earth Syst. 2019, 11, 2177–2213. [Google Scholar] [CrossRef] [Green Version]
  32. Séférian, R.; Nabat, P.; Michou, M.; Saint-Martin, D.; Voldoire, A.; Colin, J.; Decharme, B.; Delire, C.; Berthet, S.; Chevallier, M.; et al. Evaluation of CNRM Earth System Model, CNRM-ESM2-1: Role of Earth System Processes in Present-Day and Future Climate. J. Adv. Modeling Earth Syst. 2019, 11, 4182–4227. [Google Scholar] [CrossRef] [Green Version]
  33. Boucher, O.; Servonnat, J.; Albright, A.L.; Aumont, O.; Balkanski, Y.; Bastrikov, V.; Bekki, S.; Bonnet, R.; Bony, S.; Bopp, L.; et al. Presentation and Evaluation of the IPSL-CM6A-LR Climate Model. J. Adv. Modeling Earth Syst. 2020, 12, e2019MS002010. [Google Scholar] [CrossRef]
  34. Schupfner, M.; Wieners, K.-H.; Wachsmann, F.; Steger, C.; Bittner, M.; Jungclaus, J.; Früh, B.; Pankatz, K.; Giorgetta, M.; Reick, C.; et al. DKRZ MPI-ESM1. 2-HR Model Output Prepared for CMIP6 ScenarioMIP; Version 20190710; Earth System Grid Federation: Greenbelt, MD, USA, 2019. [Google Scholar] [CrossRef]
  35. Wieners, K.-H.; Giorgetta, M.; Jungclaus, J.; Reick, C.; Esch, M.; Bittner, M.; Gayler, V.; Haak, H.; de Vrese, P.; Raddatz, T.; et al. MPI-M MPI-ESM1. 2-LR Model Output Prepared for CMIP6 ScenarioMIP ssp585. Version 20190710; Earth System Grid Federation: Greenbelt, MD, USA, 2019. [Google Scholar] [CrossRef]
  36. Good, P. MOHC HadGEM3-GC31-LL Model Output Prepared for CMIP6 ScenarioMIP ssp585; Version 20200121; Earth System Grid Federation: Greenbelt, MD, USA, 2020. [Google Scholar] [CrossRef]
  37. Dix, M.; Bi, D.; Dobrohotoff, P.; Fiedler, R.; Harman, I.; Law, R.; Mackallah, C.; Marsland, S.; O’Farrell, S.; Rashid, H.; et al. CSIRO-ARCCSS ACCESS-CM2 Model Output Prepared for CMIP6 ScenarioMIP ssp585; Version 20200303; Earth System Grid Federation: Greenbelt, MD, USA, 2019. [Google Scholar] [CrossRef]
  38. Ziehn, T.; Chamberlain, M.; Lenton, A.; Law, R.; Bodman, R.; Dix, M.; Wang, Y.; Dobrohotoff, P.; Srbinovsky, J.; Stevens, L.; et al. CSIRO ACCESS-ESM1. 5 Model Output Prepared for CMIP6 ScenarioMIP ssp585; Version 20191115; Earth System Grid Federation: Greenbelt, MD, USA, 2019. [Google Scholar] [CrossRef]
  39. Swart, N.C.; Cole, J.N.S.; Kharin, V.V.; Lazare, M.; Scinocca, J.F.; Gillett, N.P.; Anstey, J.; Arora, V.; Christian, J.R.; Jiao, Y.; et al. CCCma CanESM5 Model Output Prepared for CMIP6 ScenarioMIP ssp585; Version 20190429; Earth System Grid Federation: Greenbelt, MD, USA, 2019. [Google Scholar] [CrossRef]
  40. Volodin, E.; Mortikov, E.; Gritsun, A.; Lykossov, V.; Galin, V.; Diansky, N.; Gusev, A.; Kostrykin, S.; Iakovlev, N.; Shestakova, A.; et al. INM INM-CM4-8 Model Output Prepared for CMIP6 ScenarioMIP; Version 20190603; Earth System Grid Federation: Greenbelt, MD, USA, 2019. [Google Scholar] [CrossRef]
  41. Volodin, E.; Mortikov, E.; Gritsun, A.; Lykossov, V.; Galin, V.; Diansky, N.; Gusev, A.; Kostrykin, S.; Iakovlev, N.; Shestakova, A.; et al. INM INM-CM5-0 Model Output Prepared for CMIP6 ScenarioMIP ssp585; Version 20190724; Earth System Grid Federation: Greenbelt, MD, USA, 2019. [Google Scholar] [CrossRef]
  42. EC-Earth Consortium (EC-Earth) EC-Earth-Consortium EC-Earth3 Model Output Prepared for CMIP6 CMIP Abrupt-4xCO2; Version 20200501; Earth System Grid Federation: Greenbelt, MD, USA, 2019. [CrossRef]
  43. Shiogama, H.; Abe, M.; Tatebe, H. MIROC MIROC6 Model Output Prepared for CMIP6 ScenarioMIP ssp585; Version 20191114; Earth System Grid Federation: Greenbelt, MD, USA, 2019. [Google Scholar] [CrossRef]
  44. Tachiiri, K.; Abe, M.; Hajima, T.; Arakawa, O.; Suzuki, T.; Komuro, Y.; Ogochi, K.; Watanabe, M.; Yamamoto, A.; Tatebe, H.; et al. MIROC MIROC-ES2L Model Output Prepared for CMIP6 ScenarioMIP ssp585; Version 20190823; Earth System Grid Federation: Greenbelt, MD, USA, 2019. [Google Scholar] [CrossRef]
  45. Seland, Ø.; Bentsen, M.; Oliviè, D.J.L.; Toniazzo, T.; Gjermundsen, A.; Graff, L.S.; Debernard, J.B.; Gupta, A.K.; He, Y.; Kirkevåg, A.; et al. NCC NorESM2-LM Model Output Prepared for CMIP6 ScenarioMIP ssp585; Version 20200218; Earth System Grid Federation: Greenbelt, MD, USA, 2019. [Google Scholar] [CrossRef]
  46. Byun, Y.-H.; Lim, Y.-J.; Shim, S.; Sung, H.M.; Sun, M.; Kim, J.; Kim, B.-H.; Lee, J.-H.; Moon, H. NIMS-KMA KACE1. 0-G Model Output Prepared for CMIP6 ScenarioMIP ssp585; Version 20200130; Earth System Grid Federation: Greenbelt, MD, USA, 2019. [Google Scholar] [CrossRef]
  47. Keyantash, J.; National Center for Atmospheric Research Staff (Eds.) The Climate Data Guide: Standardized Precipitation Index (SPI) 2018. Available online: https://climatedataguide.ucar.edu/climate-data/standardized-precipitation-index-spi (accessed on 10 May 2021).
  48. Guttman, N.B. Accepting the Standardized Precipitation Index: A Calculation Algorithm1. J. Am. Water Resour. Assoc. 1999, 35, 311–322. [Google Scholar] [CrossRef]
  49. Yevjevich, V.M. Objective Approach to Definitions and Investigations of Continental Hydrologic Droughts; (Hydrology paper no. 23); Colorado State University: Fort Collins, CO, USA, 1967; p. 19. [Google Scholar]
  50. Hinton, G.E.; Osindero, S.; Teh, Y.-W. A Fast Learning Algorithm for Deep Belief Nets. Neural Comput. 2006, 18, 1527–1554. [Google Scholar] [CrossRef] [PubMed]
  51. Silva Junior, C.H.L.; Anderson, L.O.; Silva, A.L.; Almeida, C.T.; Dalagnol, R.; Pletsch, M.A.J.S.; Penha, T.V.; Paloschi, R.A.; Aragão, L.E.O.C. Fire Responses to the 2010 and 2015/2016 Amazonian Droughts. Front. Earth Sci. 2019, 7, 97. [Google Scholar] [CrossRef]
  52. Jiménez-Muñoz, J.C.; Mattar, C.; Barichivich, J.; Santamaría-Artigas, A.; Takahashi, K.; Malhi, Y.; Sobrino, J.A.; van der Schrier, G. Record-Breaking Warming and Extreme Drought in the Amazon Rainforest during the Course of El Niño 2015–2016. Sci. Rep. 2016, 6, 33130. [Google Scholar] [CrossRef] [PubMed] [Green Version]
  53. Sung, J.H.; Baek, D.; Ryu, Y.; Seo, S.B.; Seong, K.-W. Effects of Hydro-Meteorological Factors on Streamflow Withdrawal for Irrigation in Yeongsan River Basin. Sustainability 2021, 13, 4969. [Google Scholar] [CrossRef]
Figure 1. Procedure of this study.
Sustainability 14 05494 g001
Figure 2. Elevation map of South Korea.
Sustainability 14 05494 g002
Figure 3. Monthly series of the observed climate variables and SPI3 (presented by color gradation): (a) relative humidity, (b) wind speed, (c) SPI3, and (d) OF for South Korea.
Sustainability 14 05494 g003
Figure 4. Concept of drought characteristics.
Sustainability 14 05494 g004
Figure 5. Relationship between SPI (3, 6, 9 months) and OF.
Sustainability 14 05494 g005
Figure 6. Comparison between the observed and estimated OF in the validation period.
Sustainability 14 05494 g006
Figure 7. Monthly averaged observed and simulated (a) relative humidity, (b) wind speed, and (c) SPI3 (≤−0.5) data from 1997–2010.
Sustainability 14 05494 g007
Figure 8. Monthly variability between GCMs of (a) relative humidity, (b) wind speed, and (c) SPI3 (≤−0.5) data in all periods (H, F1, F2, F3).
Sustainability 14 05494 g008
Figure 9. Percentile value of future projection of (a) relative humidity, (b) wind speed, and (c) SPI3 in F1 (2011–2040), F2 (2041–2070) and F3 (20712100) relative to the historical period (unit: %).
Sustainability 14 05494 g009
Figure 10. Seasonal variability between GCMs of OF in (a) winter, (b) spring, (c) summer, and (d) autumn.
Sustainability 14 05494 g010
Figure 11. Scatter plots of the observed OF and drought characteristics.
Sustainability 14 05494 g011
Figure 12. Impact of drought characteristics on the OF in the future. (a) Change in number of models with the strongest correlation coefficient for each drought characteristic. (b) Drought characteristics according to number of models with the strongest correlation coefficient.
Sustainability 14 05494 g012
Table 1. GCM list in this study.
InstituteGCMsResolutionReferences
Geophysical Fluid Dynamics Laboratory (USA)GFDL-ESM4360 × 180John et al. [29]
Meteorological Research Institute (Japan)MRI-ESM2-0320 × 160Yukimoto et al. [30]
Centre National de Recherches Meteorologiques (France)CNRM-CM6-124572 grids distributed over 128 latitude circlesVoldoire [31]
CNRM-ESM2-1Séférian [32]
Institute Pierre-Simon Laplace (France)IPSL-CM6A-LR144 × 143Boucher et al. [33]
Max Planck Institute for Meteorology (Germany)MPI-ESM1-2-HR384 × 192Schupfner et al. [34]
MPI-ESM1-2-LR192 × 96Wieners et al. [35]
Met Office Hadley Centre (UK)UKESM1-0-LL192 × 144Good et al. [36]
Commonwealth Scientific and Industrial Research Organisation, Australian Research Council Centre of Excellence for Climate System Science (Australia)ACCESS-CM2192 × 144Dix et al. [37]
Commonwealth Scientific and Industrial Research Organisation (Australia)ACCESS-ESM1-5192 × 145Ziehn et al. [38]
Canadian Centre for Climate Modelling and Analysis (Canada)CanESM5128 × 64Swart et al. [39]
Institute for Numerical Mathematics (Russia)INM-CM4-8180 × 120Volodin et al. [40]
INM-CM5-0180 × 120Volodin et al. [41]
EC-Earth-ConsortiumEC-Earth3512 × 256EC-Earth Consortium EC-Earth [42]
Japan Agency for Marine-Earth Science and Technology/Atmosphere and Ocean Research Institute/National Institute for Environmental Studies/RIKEN Center for Computational Science (Japan)MIROC6256 × 128Shiogama et al. [43]
MIROC-ES2L128 × 64Tachiiri et al. [44]
NorESM Climate Modeling Consortium consisting of CICERO (Norway)NorESM2-LM144 × 96Seland et al. [45]
National Institute of Meteorological Sciences/Korea Meteorological Administration (Korea)KACE-1-0-G192 × 144Byun et al. [46]
Table 2. Performance skills of the three-DBN model in the validation period (2014–2019).
ModelPerformance Indicators
NSERMSER2
RH-WS-SPI3-AOF0.8370.0650.855
RH-WS-AOF0.8280.0670.838
RH-AOF0.7870.0740.845
WS-AOF0.5370.1100.573
Publisher’s Note: MDPI stays neutral with regard to jurisdictional claims in published maps and institutional affiliations.

