
Applying a Coupled Hydrologic-Economic Modeling Framework: Evaluating Alternative Options for Reducing Impacts for Downstream Locations in Response to Upstream Development


Abstract
:1. Introduction
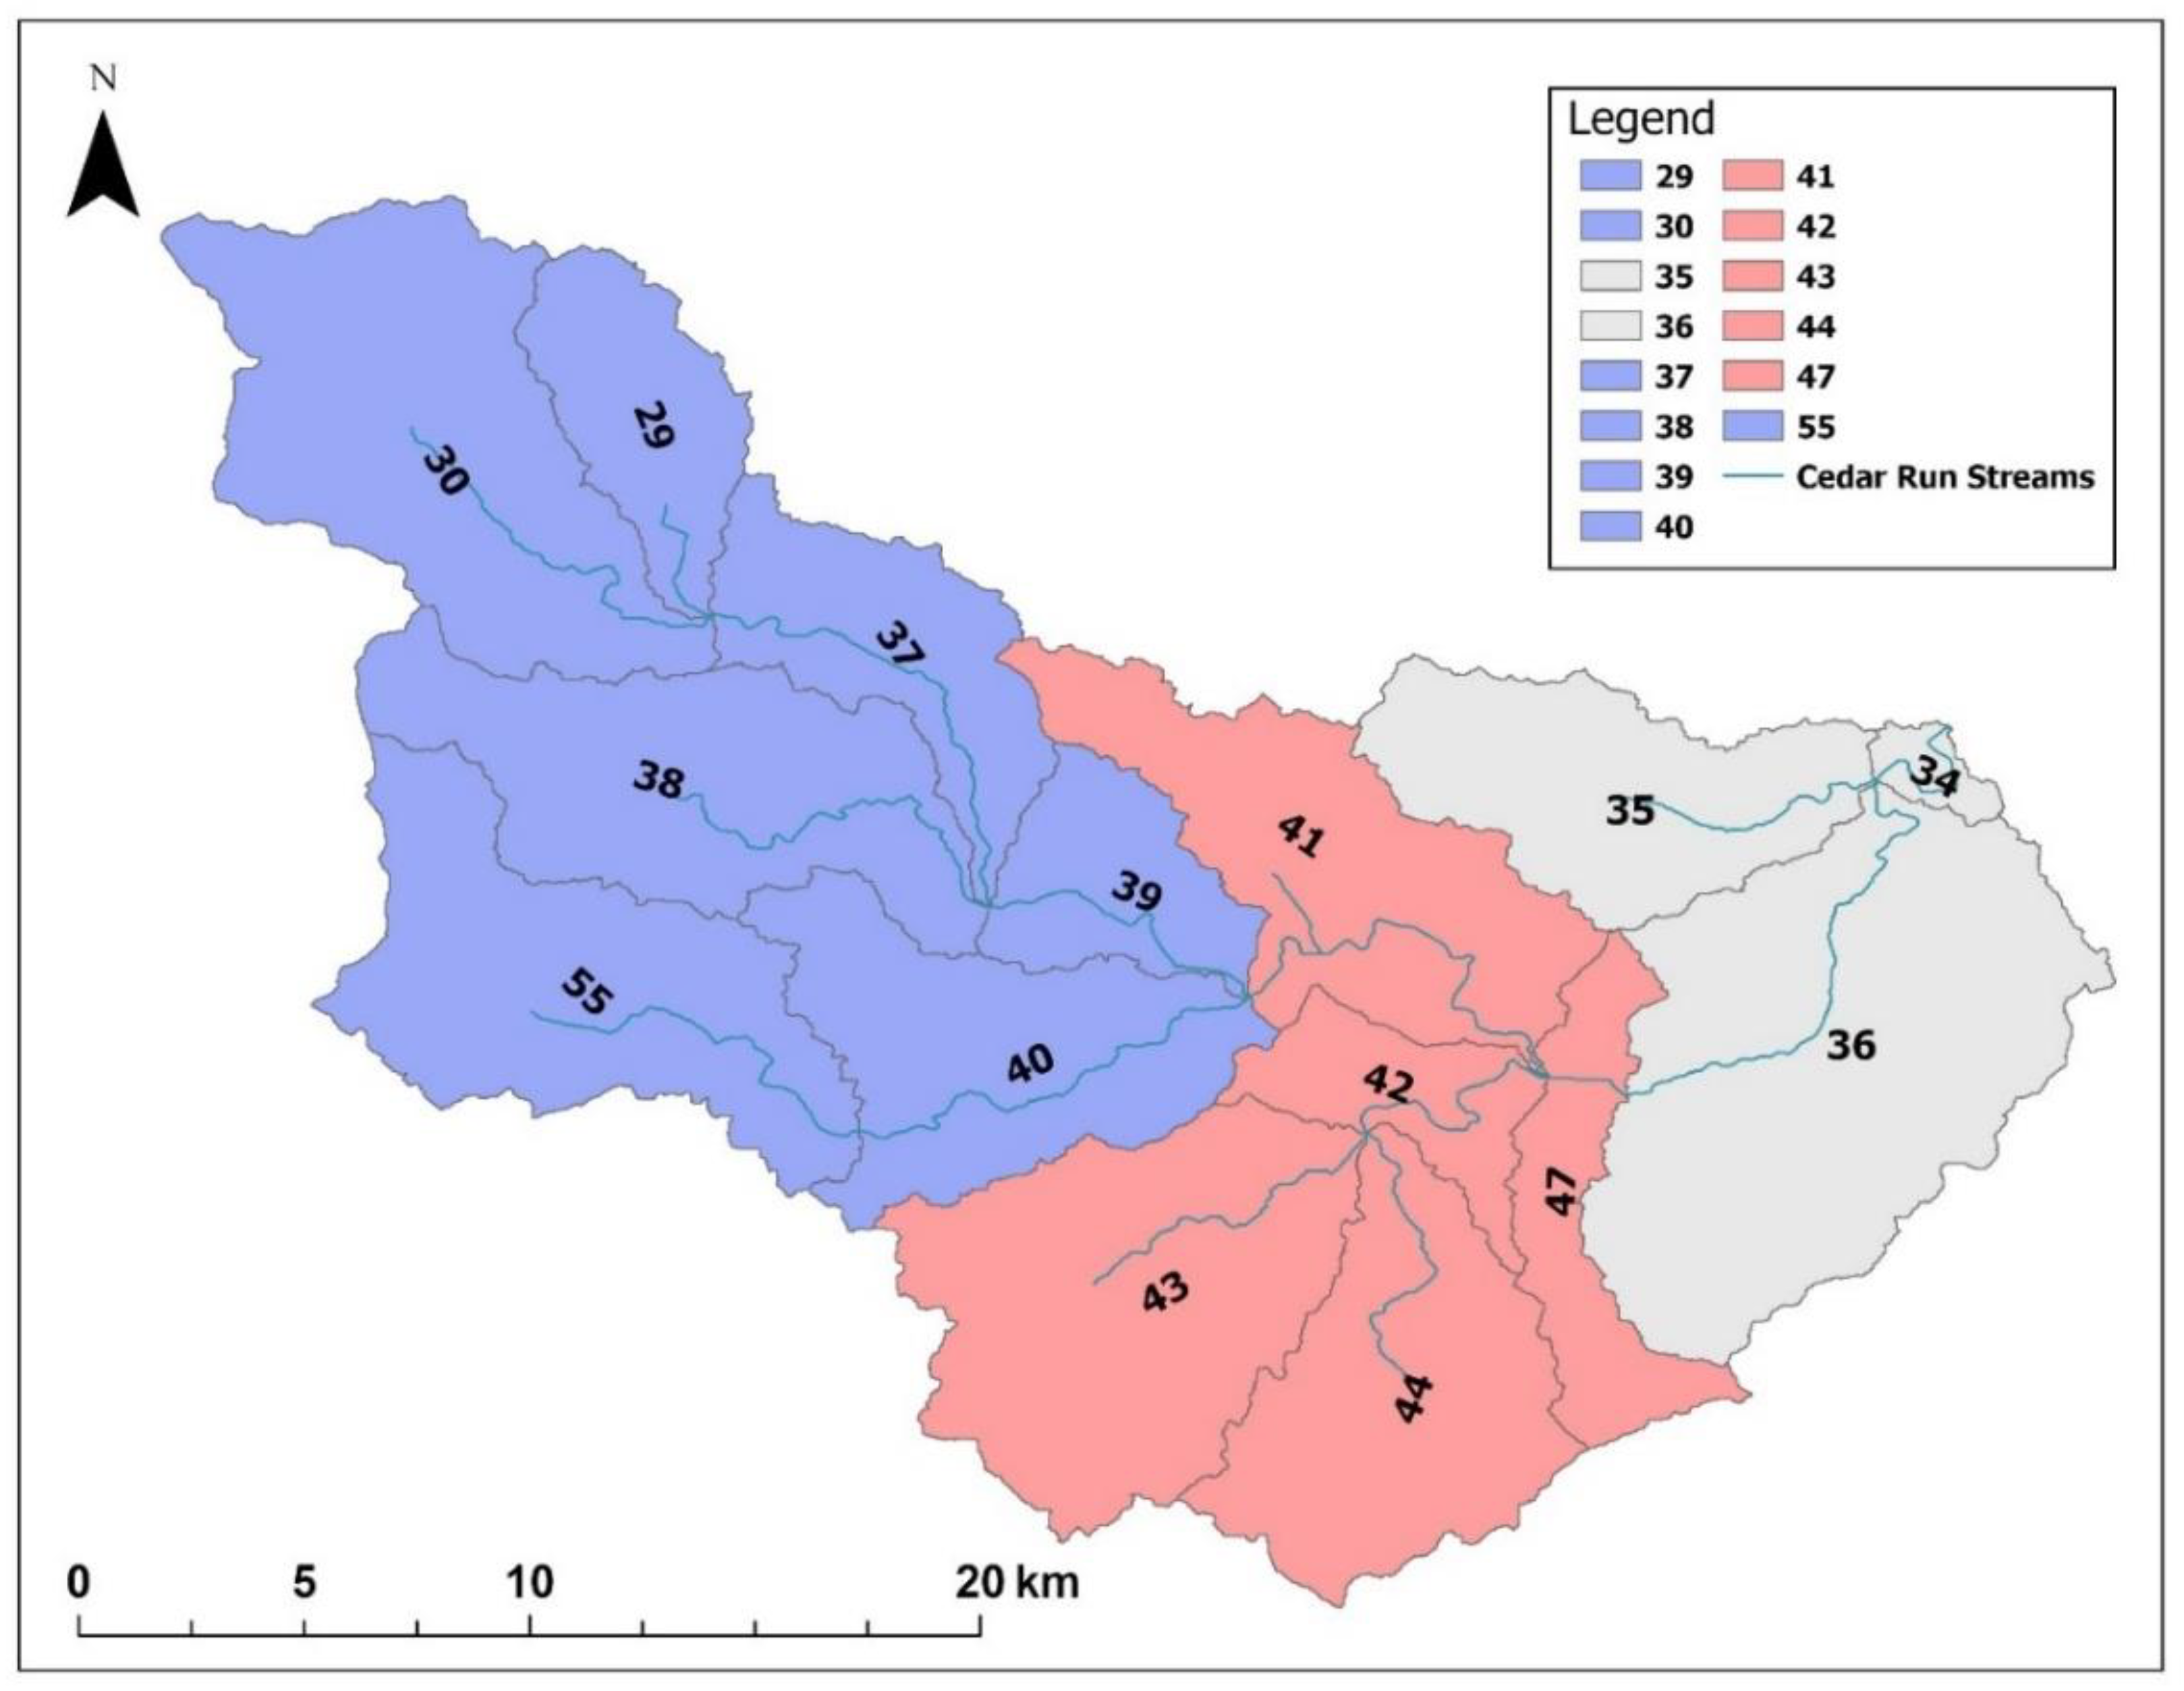
1.1. Study Location
1.2. Research Objectives
- Can RCOT’s selection among technologies for residential water use alleviate the downstream impacts on water quantity and nitrogen concentration caused by upstream residential build-up in Cedar Run Watershed and modeled using HSPF?
- Can RCOT’s selection among crops alleviate the downstream impacts on water quantity and nitrogen concentration caused by upstream agricultural intensification in Cedar Run Watershed and modeled using HSPF?
- Does coupling a distributed watershed model with a physically constrained, I-O model provide two-way feedback that captures the interactions between the watershed and economic systems at a level of spatial detail that expands the types of questions that may be addressed by either of the models coupled in this framework?
2. Materials and Methods
2.1. HSPF
2.2. RCOT
2.3. Building the Economic Database
2.4. Model Calibration and Validation
- Groundwater recession rate (AGWRC)
- Interflow recession rate (IRC)
- Index to soil infiltration capacity (INFILT)
- Index to lower zone evapotranspiration (LZETP)
- Lower zone soil moisture storage (LZSN)
- Upper zone soil moisture storage (UZSN)
- Interflow inflow parameter (INTFW)
2.5. Coupled Modular Framework
3. Scenarios
3.1. Residential Build-Up (S1 & S2)
- 35% decrease in water withdrawal requirements per unit of output.
- 90% decrease in water withdrawal requirements per unit of output
- 60% increase in water price
3.2. Agricultural Intensification (S3 & S4)
- 60% decrease in water withdrawal requirements per unit of output
- 20% decrease in nitrogen requirements per unit of output
- 13% decrease in labor requirements per unit of output
- 31% increase in land requirements per unit of output
- 16% increase in water withdrawal requirements per unit of output
- 40% increase in labor requirements per unit of output
- 92% decrease in land requirements per unit of output
- 48% decrease in water withdrawal requirements per unit of output
- 40% decrease in nitrogen requirements per unit of output
4. Results
5. Discussion
5.1. Conclusions
5.2. Future Work
Author Contributions
Funding
Institutional Review Board Statement
Informed Consent Statement
Data Availability Statement
Acknowledgments
Conflicts of Interest
References
- Leontief, W. Environmental Repercussions and the Economic Structure: An Input-Output Approach. Rev. Econ. Stat. 1970, 52, 262–271. [Google Scholar] [CrossRef]
- Sun, Z.; Tukker, A.; Behrens, P. Going global to local: Connecting top-down accounting and local impacts, a methodological review of spatially explicit input-output approaches. Environ. Sci. Technol. 2019, 53, 1048–1062. [Google Scholar] [CrossRef] [PubMed] [Green Version]
- Ploszaj, A.; Celinska-Janowicz, D.; Rok, J.; Zawalinska, K. Regional input-output studies: A systematic literature review. In Proceedings of the 18th Annual Conference on Global Economic Analysis, Melbourne, Australia, 17–19 June 2015; Global Trade Analysis Project (GTAP): Melbourne, VIC, Australia, 2015. [Google Scholar]
- Miller, E.R.; Blair, P.D. Many-region models: The multiregional approach. In Input-Output Analysis: Foundations and Extensions; Cambridge University Press: New York, NY, USA, 2009; pp. 87–101. [Google Scholar]
- Guo, S.; Shen, G.Q. Multiregional input-output model for China’s farm land and water use. Environ. Sci. Technol. 2015, 49, 403–414. [Google Scholar] [CrossRef]
- Duchin, F. A world trade model based on comparative advantage with m regions, n goods, and k factors. Econ. Syst. Res. 2005, 17, 141–162. [Google Scholar] [CrossRef]
- Juliá, R.; Duchin, F. World trade as the adjustment mechanism of agriculture to climate change. Clim. Chang. 2007, 82, 393–409. [Google Scholar] [CrossRef] [Green Version]
- Springer, N.P.; Duchin, F. Feeding Nine Billion People Sustainably: Conserving Land and Water through Shifting Diets and Changes in Technologies. Environ. Sci. Technol. 2014, 48, 4444–4451. [Google Scholar] [CrossRef]
- Dilekli, N.; Duchin, F. Prospects for Cellulosic Biofuel Production in the Northeastern United States: A Scenario Analysis. J. Ind. Ecol. 2015, 20, 120–131. [Google Scholar] [CrossRef]
- Daniels, P.L.; Lenzen, M.; Kenway, S.J. The ins and outs of water use—A review of multi-region input-output analysis and water footprints for regional sustainability analysis and policy. Econ. Syst. Res. 2011, 23, 353–370. [Google Scholar] [CrossRef]
- Harou, J.J.; Pulido-Velazquez, M.; Rosenberg, D.E.; Medellín-Azuara, J.; Lund, J.R.; Howitt, R.E. Hydro-economic models: Concepts, design, applications, and future prospects. J. Hydrol. 2009, 375, 627–643. [Google Scholar] [CrossRef] [Green Version]
- López-Morales, C.A.; Duchin, F. Economic implications of policy restrictions on water withdrawals from surface and underground sources. Econ. Syst. Res. 2014, 27, 154–171. [Google Scholar] [CrossRef]
- Lutter, F.; Pfister, S.; Giljum, S.; Wieland, H.; Mutel, C. Spatially explicit assessment of water embodied in European trade: A product-level multi-regional input-output analysis. Glob. Environ. Change 2016, 38, 171–182. [Google Scholar] [CrossRef] [Green Version]
- Booker, J.F.; Howitt, R.E.; Michelsen, A.M.; Young, R.A. Economics and the modeling of water resources and policies. Nat. Resour. Model. 2011, 25, 168–218. [Google Scholar] [CrossRef]
- Rephann, T.J. Fauquier County Cost of Community Services Study; Weldon Cooper Center for Public Service; University of Virginia: Charlottesville, VA, USA, 2015. [Google Scholar]
- Fauquier County Board of Supervisors, Chapter 8: Rural Land Use Plan. 2019. Available online: https://www.fauquiercounty.gov/home/showdocument?id=7216 (accessed on 29 November 2021).
- Baran, A.A. Integrated Model-Based Impact Assessment of Climate Change and Land Use Change on the Occoquan Watershed. In Civil Engineering; Virginia Polytechnic Institute and State University: Manassas, VA, USA, 2018. [Google Scholar]
- Xu, Z.; Godrej, A.N.; Grizzard, T.J. The hydrological calibration and validation of a complexly-linked watershed–reservoir model for the Occoquan watershed, Virginia. J. Hydrol. 2007, 345, 167–183. [Google Scholar] [CrossRef]
- State Water Control Board. 9VAC25-410 Occoquan Policy; Virginia Department of Water Quality, Ed.; Virginia Register of Regulations: Richmond, VA, USA, 2020. Available online: http://register.dls.virginia.gov/details.aspx?id=8108 (accessed on 29 November 2021).
- Amaya, M.; Baran, A.; Lopez-Morales, C.; Little, J.C. A Coupled Hydrologic-Economic Modeling Framework for Scenario Analysis. Front. Water 2021, 3. [Google Scholar] [CrossRef]
- Duchin, F.; Levine, S.H. Sectors may use multiple technologies simultaneously: The rectangular choice-of-technology model with binding factor constraints. Econ. Syst. Res. 2011, 23, 281–302. [Google Scholar] [CrossRef]
- Bent, B.G.C.; Zarriello, P.J.; Granato, G.E.; Masterson, J.P.; Walter, D.A.; Waite, A.M.; Church, P.E. Simulated effects of water withdrawals and land-use changes on streamflows and groundwater levels in the Pawcatuck River Basin, southwestern Rhode Island and southeastern Connecticut. In Investigations Report 2009–5127; United States Geological Survey: Reston, VA, USA, 2011; pp. 107–116. [Google Scholar]
- Xu, Z. A Complex, Linked Watershed-Reservoir Hydrology and Water Quality Model Application for the Occoquan Watershed, Virginia. In Civil and Environmental Engineering; Virginia Polytechnic Institute and State University: Blacksburg, VA, USA, 2005; p. 281. [Google Scholar]
- Bartlett, J.A. Heuristic Optimization of Water Reclamation Facility Nitrate Loads for Enhanced Reservoir Water Quality. In Civil and Environmental Engineering; Virginia Polytechnic Institute and State University: Blacksburg, VA, USA, 2013. [Google Scholar]
- Bicknell, B.R.; Imhoff, J.C.; Kittle, J.L., Jr.; Donigian, A.S., Jr.; Robert, C. Johanson. Hydrological Simulation Program—Fortran (HSPF) User’s Manual, 12th ed.; U. S. Environmental Protection Agency: Washington, DC, USA, 2001; p. 843.
- Lopez-Morales, C. Policies and technologies for sustainable use of water in Mexico: A scenario analysis. In Economics; Rensselaer Polytechnic Institute: Troy, New York, NY, USA, 2010; p. 128. [Google Scholar]
- Singh, S.; Compton, J.E.; Hawkins, T.R.; Sobota, D.J.; Cooter, E.J. A Nitrogen Physical Input-Output Table (PIOT) model for Illinois. Ecol. Model. 2017, 360, 194–203. [Google Scholar] [CrossRef]
- [Datasets and Excel Sheets] IMPLAN Group, LLC. IMPLAN 2011–2013 Fauquier County Data; IMPLAN Group LLC: Huntersville, NC, USA, 2016; Available online: https://implan.com (accessed on 9 May 2019).
- Miller, R.E.; Blair, P.D. The aggregation problem: Level of detail in input-output tables. In Input-Output Analysis: Foundations and Extensions; Cambridge University Press: New York, NY, USA, 2009; pp. 160–167. [Google Scholar]
- United States Census Bureau. North American Industry Classification System. United States; 2017. Available online: https://www.census.gov/naics/ (accessed on 10 May 2021).
- Hickey, H.E. Water Supply System Concepts. In Water Supply Systems and Evaluation Methods; U.S. Fire Administration: Emmitsburg, MD, USA, 2008. [Google Scholar]
- [GIS Shape Files] Fauquier County GIS Office. Fauquier County Zoning GIS Data; Warrenton, VA, USA; 2014. Available online: https://www.fauquiercounty.gov/government/departments-a-g/gis-mapping/gis-data (accessed on 10 May 2021).
- [GIS Shape Files] Virginia Geographic Information Network. Land Cover Dataset: Bay Area 2. United States. 2016. Available online: https://ftp.vgingis.com/download_2/land_cover/Bay_Area_2/ (accessed on 10 May 2021).
- Blackhurst, M.; Hendrickson, C.; Vidal, J.S. Direct and indirect water withdrawals for U.S. industrial sectors. Environ. Sci. Technol. 2010, 44, 2126–2130. [Google Scholar] [CrossRef]
- [Excel Format] United States Geological Survey. Estimated Use of Water in the United States County-Level Data for 2010. United States; 2010. Available online: https://water.usgs.gov/watuse/data/2010/index.html (accessed on 10 May 2021).
- Law, N.; Band, L.; Grove, M. Nitrogen input from residential lawn care practices in suburban watersheds in Baltimore county, MD. J. Environ. Plan. Manag. 2004, 47, 737–755. [Google Scholar] [CrossRef]
- Solakian, J.; Maggioni, V.; Lodhi, A.; Godrej, A. Investigating the use of satellite-based precipitation products for monitoring water quality in the Occoquan Watershed. J. Hydrol. Reg. Stud. 2019, 26, 100630. [Google Scholar] [CrossRef]
- Lodhi, A.G.; Godrej, A.; Sen, D.; Angelotti, R.; Brooks, M. A decision support system for indirect potable reuse based on integrated modeling and futurecasting. J. Water Reuse Desalinat. 2019, 9, 263–281. [Google Scholar] [CrossRef]
- Lodhi, A.G.; Godrej, A.N.; Sen, D.; Baran, A.A. URUNME: A generic software for integrated environmental modeling. Environ. Model. Softw. 2020, 134, 104737. [Google Scholar] [CrossRef]
- Smakhtin, V.; Revenga, C.; Doll, P. Taking into account environmental water requirements in global-scale water resources assessments. In Comprehensive Assessment Research Report 2; Iwmi: Colombo, Sri Lanka, 2004. [Google Scholar]
- Tucker, A.J. Water Supply Planning for Landscape Irrigation in Virginia. In Environmental Design and Planning; Virginia Polytechnic Institute and State University: Blacksburg, VA, USA, 2009. [Google Scholar]
- Springer, N.P.; Duchin, F.; Levine, S.H. WTM/EXIOPOL Package Version 2.0; Rensselaer Polytechnic Institute: Troy, NY, USA, 2011. [Google Scholar]
- Scrieciu, S.S. The inherent dangers of using computable general equilibrium models as a single integrated modelling framework for sustainability impact assessment. A critical note on Böhringer and Löschel (2006). Ecol. Econ. 2007, 60, 678–684. [Google Scholar] [CrossRef]
- Settre, C.; Connor, J.; Wheeler, S.A. Reviewing the Treatment of Uncertainty in Hydro-economic Modeling of the Murray–Darling Basin, Australia. Water Econ. Policy 2017, 3, 1650042. [Google Scholar] [CrossRef]
- Duchin, F.; Levine, S.H. The rectangular sector-by-technology model: Not every economy produces every product and some products may rely on several technologies simultaneously. J. Econ. Struct. 2012, 1, 3. [Google Scholar] [CrossRef] [Green Version]
- Little, J.C.; Hester, E.T.; Carey, C.C. Assessing and Enhancing Environmental Sustainability: A Conceptual Review. Environ. Sci. Technol. 2016, 50, 6830–6845. [Google Scholar] [CrossRef]
- Little, J.C.; Hester, E.T.; Elsawah, S.; Filz, G.M.; Sandu, A.; Carey, C.C.; Iwanaga, T.; Jakeman, A.J. A tiered, system-of-systems modeling framework for resolving complex socio-environmental policy issues. Environ. Model. Softw. 2018, 112, 82–94. [Google Scholar] [CrossRef]
- Iwanaga, T.; Wang, H.-H.; Hamilton, S.H.; Grimm, V.; Koralewski, T.E.; Salado, A.; Elsawah, S.; Razavi, S.; Yang, J.; Glynn, P.; et al. Socio-technical scales in socio-environmental modeling: Managing a system-of-systems modeling approach. Environ. Model. Softw. 2020, 135, 104885. [Google Scholar] [CrossRef]
- Bi, C.; Little, J.C. Integrated assessment across building and urban scales: A review and proposal for a more holistic, multi-scale, system-of-systems approach. Sustain. Cities Soc. 2022, 82, 103915. [Google Scholar] [CrossRef]
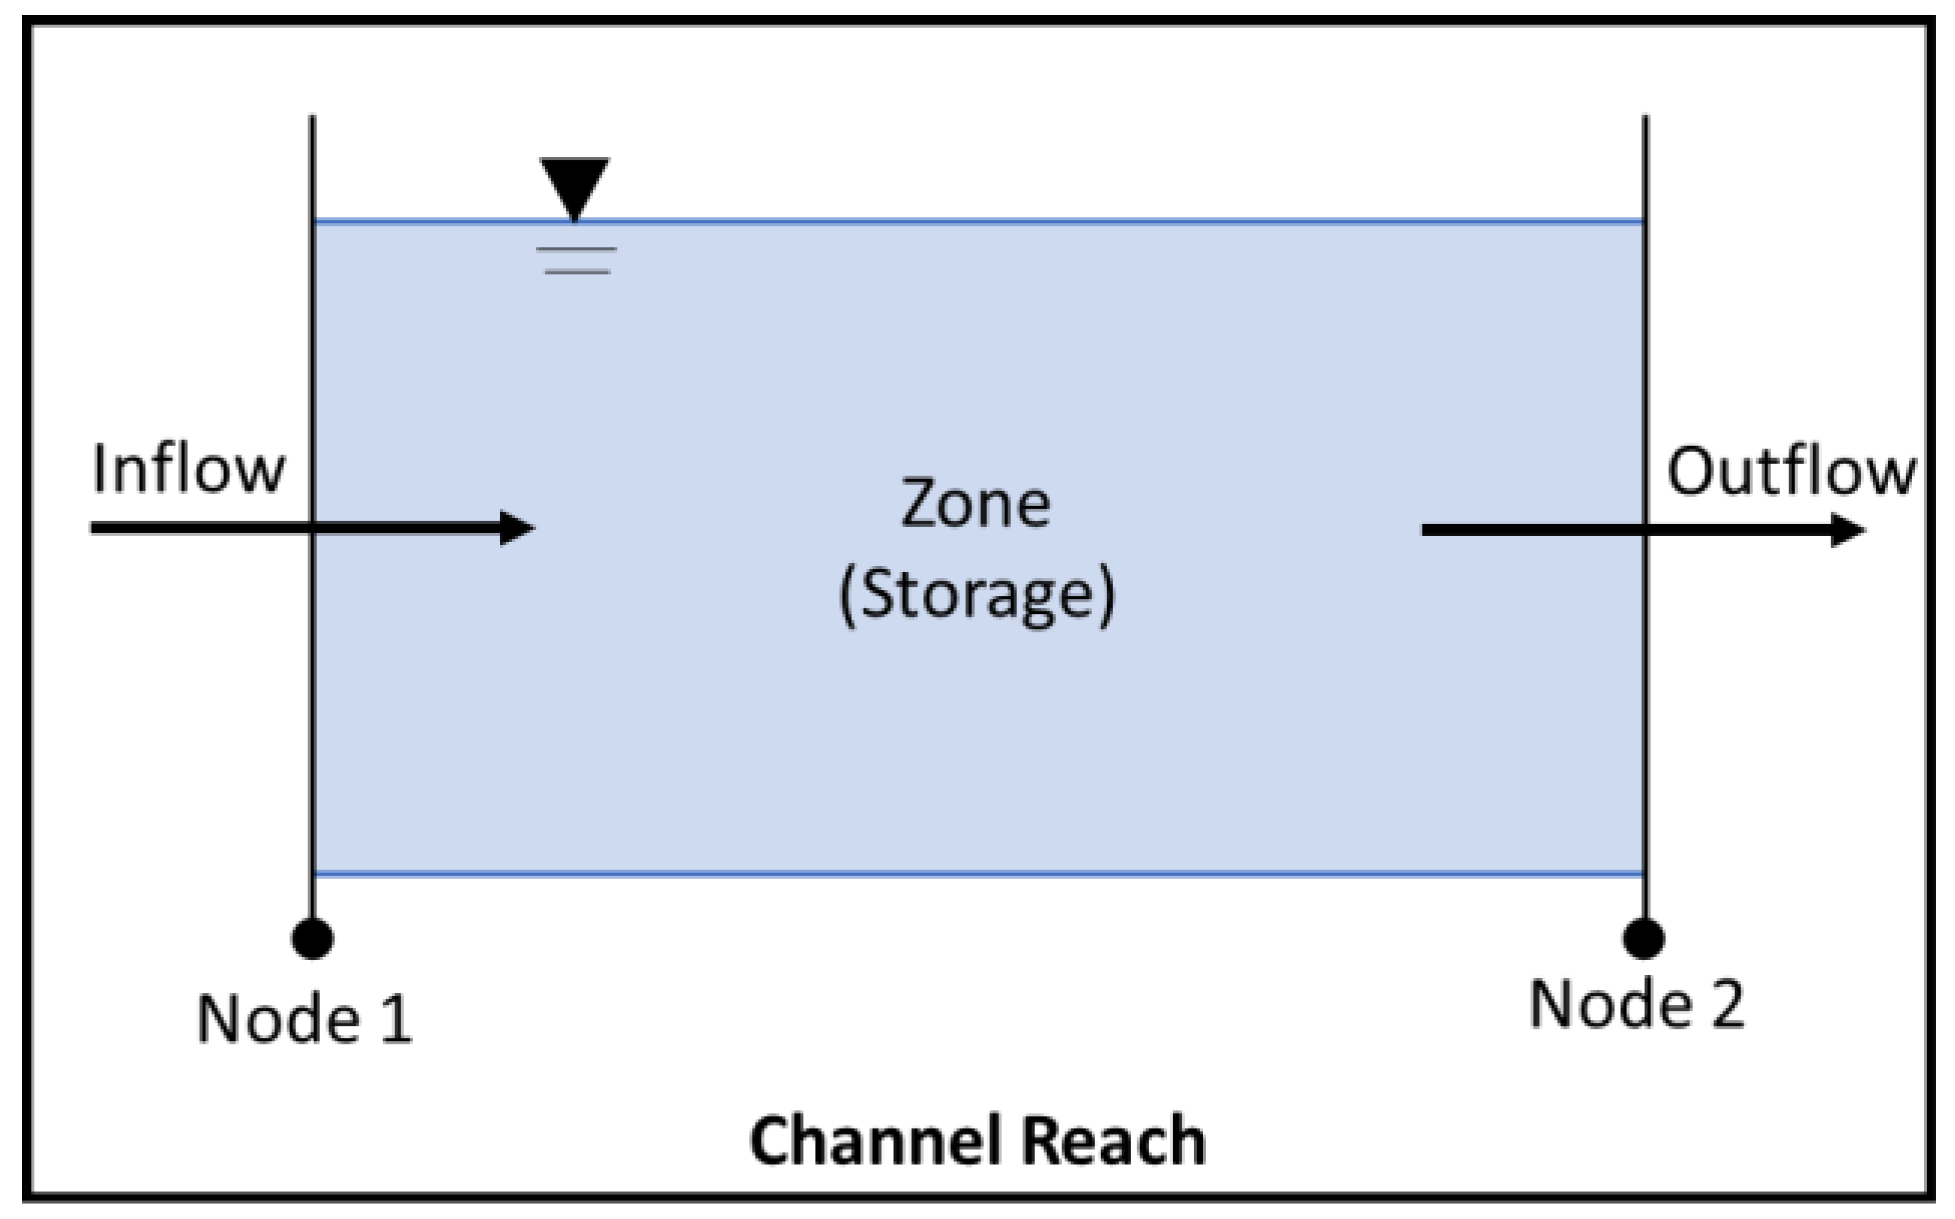
 refers to water level.
refers to water level.
refers to water level.


| Scenario Name | S1 | S2 | S3 | S4 |
|---|---|---|---|---|
| Scenario Description | Upstream Residential Build-Up | Upstream Residential Build-Up | Upstream Agricultural Intensification | Upstream Agricultural Intensification |
| New Technologies added to this Sector: | Residential Sector | Residential Sector | Crop Farming | Crop Farming |
| Technology #1 | Standard Technology | Standard Technology | Farming w/ Irrigation | Reclamation Water |
| Technology #2 | ET-Based Irrigation Scheduling | Oilseed, Grain & Hay Farming | ||
| Technology #3 | Rainwater Harvesting | Vegetable & Fruit Farming |
| Scenario | S1 | S2 | S3 | S4 |
|---|---|---|---|---|
| Jobs | 180 | 180 | 7.7 | 12 |
| Water Withdrawn | 220 | 170 | 320 | 170 |
| Nitrogen Applied | 61 | 61 | 240 | 120 |
| Cropland | −2.4 | −2.4 | 270 | −58 |
| Segment | S1 | S2 | S3 | S4 | |
|---|---|---|---|---|---|
| Downstream | 41 | 24 | 19 | 35 | 19 |
| 42 | 0.0 | 0.0 | 0.0 | 0.0 | |
| 43 | 0.0 | 0.0 | 0.0 | 0.0 | |
| 44 | 0.0 | 0.0 | 0.0 | 0.0 | |
| 47 | 17 | 13 | 25 | 12 |
| Segment | Baseline | S1 | S2 | S3 | S4 | |
|---|---|---|---|---|---|---|
| Downstream | 41 | 0.6 | 2.3 | 2.2 | 6.5 | 2.9 |
| 42 | 0.6 | 0.6 | 0.6 | 0.6 | 0.6 | |
| 43 | 0.5 | 0.6 | 0.6 | 0.6 | 0.5 | |
| 44 | 0.5 | 0.5 | 0.5 | 0.5 | 0.5 | |
| 47 | 0.6 | 1.8 | 1.8 | 4.2 | 2.0 |
Publisher’s Note: MDPI stays neutral with regard to jurisdictional claims in published maps and institutional affiliations. |
© 2022 by the authors. Licensee MDPI, Basel, Switzerland. This article is an open access article distributed under the terms and conditions of the Creative Commons Attribution (CC BY) license (https://creativecommons.org/licenses/by/4.0/).
Share and Cite
Amaya, M.; Duchin, F.; Hester, E.; Little, J.C. Applying a Coupled Hydrologic-Economic Modeling Framework: Evaluating Alternative Options for Reducing Impacts for Downstream Locations in Response to Upstream Development. Sustainability 2022, 14, 6630. https://0-doi-org.brum.beds.ac.uk/10.3390/su14116630
Amaya M, Duchin F, Hester E, Little JC. Applying a Coupled Hydrologic-Economic Modeling Framework: Evaluating Alternative Options for Reducing Impacts for Downstream Locations in Response to Upstream Development. Sustainability. 2022; 14(11):6630. https://0-doi-org.brum.beds.ac.uk/10.3390/su14116630
Chicago/Turabian StyleAmaya, Maria, Faye Duchin, Erich Hester, and John C. Little. 2022. "Applying a Coupled Hydrologic-Economic Modeling Framework: Evaluating Alternative Options for Reducing Impacts for Downstream Locations in Response to Upstream Development" Sustainability 14, no. 11: 6630. https://0-doi-org.brum.beds.ac.uk/10.3390/su14116630