
Development of Rural Areas in Ukraine in the Context of Decentralization: An Empirical Study


1
Department of Finance, National University of Life and Environmental Sciences of Ukraine, 03041 Kyiv, Ukraine
2
Department of Economics and Finance, Jan Kochanowski University of Kielce, 25-001 Kielce, Poland
3
Department of Finance, National University of Food Technologies, 03041 Kyiv, Ukraine
4
Department of Finance, Warsaw University of Life Sciences in Warsaw—SGGW, 02-787 Warsaw, Poland
*
Author to whom correspondence should be addressed.
Sustainability 2022, 14(11), 6730; https://0-doi-org.brum.beds.ac.uk/10.3390/su14116730
Submission received: 4 May 2022
/
Revised: 26 May 2022
/
Accepted: 27 May 2022
/
Published: 31 May 2022
(This article belongs to the Collection Sustainable Development of Rural Areas and Agriculture)
Abstract
:Decentralization in Ukraine was actualized due to the inability of the local self-government system to satisfy the needs of the rural population in public services for the comprehensive development of a person, their self-realization, and the protection of their constitutional rights. The purpose of this empirical study is to examine development of rural areas in Ukraine in the context of decentralization. The methodology used was exploratory qualitative in nature and used a multiple case study, wherein data analysis were applied. We have found that the first result of decentralization in 2015–2018 is a slowdown in the decline of the proportion of the rural population, in the rate of decline of the available rural population, and the employment rate of the rural population. Our study refutes the hypothesis that the rural development targets, which were defined at the beginning of decentralization and fixed in the current legislation, have been achieved. Rural development targets have not been achieved, and economic modeling shows that there are no prospects for achieving them in the near future. The research results presented in the paper are of considerable importance for developing economic policy and the social development of rural areas, by addressing the needs of these rural areas.
1. Introduction
In 2013, the European Commission issued a communication, ‘‘Empowering local authorities in partner countries for enhanced governance and more effective development outcomes” [1]. In this document, the European Union (EU) embraces a larger view of the role of local authorities—as key representatives of local polities in a given territory, not just managerial agents of the state—and of the instrumental value of decentralization as a vehicle to create space for the development of local authorities. The communication also commits the EU to promoting territorial development. This ambition was reflected in the next programming cycle of both thematic and geographic budget lines of EU development cooperation [2]. Ukraine has been declared as a European vector of development, so the introduction of decentralization has become part of regional development, including in rural areas.
The top relevance for the present work is how decentralization affects the development of rural territories and their economies. The research in the scientific literature on the topic of decentralization usually concentrates on the impact of this process on accountability, economic freedom, and political and civil liberties [3]; technological innovation and green development efficiency [4]; environmental pollution [5,6,7]; economic growth [8,9,10,11,12,13,14]; government and corruption [15,16,17,18]; regional disparities [19,20,21,22], etc. The research in the scientific literature also concerns the influence of decentralization on social development by decentralizing budget expenditures [23,24,25,26,27]. While fiscal decentralization in education and housing appears to have a negative effect on well-being, this effect is positive in the cases of health and culture, and in recreation [25].
The main disadvantage of the system for developing rural areas in Ukraine that determined the necessity of decentralization was regional disparities. Rodríguez-Pose A. and Ezcurra R. studied the relationship between decentralization and the evolution of regional disparities in 26 countries, including 19 developed (Australia, Austria, Belgium, Canada, Denmark, Finland, France, Germany, Hungary, Ireland, Italy, the Netherlands, Norway, Portugal, Spain, Sweden, Switzerland, the United Kingdom, and the United States) and 7 developing states (Brazil, Bulgaria, Mexico, Poland, Romania, South Africa, and Thailand). Decentralization in high-income countries has, if anything, been linked with a reduction of regional inequality. In low- and medium-income countries, fiscal decentralization has been associated with a significant rise in regional disparities, for which the positive effects of political decentralization have been unable to compensate [21]. The main finding of the empirical examination is that different institutional settings of fiscal decentralization in developing countries can affect the distribution of income and ethnic inequality. Developing countries can actually improve the distribution of income and development of rural areas [28].
Fiscal decentralization is proxied by the share of total government revenue spent by subnational governments and was a factor in reinforcing citizens’ support for European integration [29]. Regional disparities remain the typical phenomenon in European countries, particularly in Serbia [30], Romania, Bulgaria, Croatia, Latvia, and Estonia [31], as well as in Poland [32]. Ezcurra R. and Pascual P. studied for the first time the relationship between fiscal decentralization and regional disparities in a set of European Union countries. Their findings reveal that the devolution of fiscal power to subnational governments is negatively correlated with the level of regional inequality within the sample countries [19].
The results of the analysis of decentralization and regional development in Western Europe show that greater fiscal decentralization is associated with lower interpersonal income inequality, but, as regional income rises, further decentralization is connected to a lower decrease in inequality. This finding is robust for the measurement and definition of income inequality, as well as for weighting the spatial units by the number of the population [33].
To solve the problem of the development of rural areas in Europe and the forming of social capital as driving forces for the revitalization of rural communities in the early 1990s, the EU started elaborating on alternative programs and documents. One such program was the LEADER, that is, the ”Liaison Entre Actions de Développement de l’Économie Rurale” [34]. It was realized by 2800 local action groups (LAG), which included about 61% of the rural population in the EU. The program has indeed raised the quality of life in rural areas by satisfying social needs and facilitating investments in non-productive but essential projects, such as training programs, innovation support, and knowledge transfer [22,35,36,37,38]. The example of Romania demonstrated the positive impact of the realization of the LEADER program in eliminating the existing economic disparities in the rural regions. Consequently, the program reduced the gap between those in rural regions and the more developed groups [22].
The rural communes of Eastern Poland are characterized by significant disproportions in terms of financial standing. Dziekański P., Prus P. determined the level of social and economic development and financial potential of rural communes in Eastern Poland in 2009–2018 and concluded that there was an increase in the diversity of units in the studied area [39].
Scientists have made a significant contribution to this topic by studying the practices of different countries. Firstly, consider the experience of decentralization in Europe. Salmon researched the decentralization reform in France (1982–1983) and emphasized that one of the important positive results of decentralization is the improvement of business activity level among the regional economic subjects, thanks to the expansion of access to new technologies and, as a result, the activation of innovative development in the relevant territory and state as a whole [40].
Parker examines the rationale for a specific rural focus in poverty reduction programs and reviews recent attempts to encourage rural development. He discusses the role which decentralization could play in rural development programs and concludes that decentralization has not consistently reduced poverty [41]. Critically evaluated experience of Greece and its rural development seems to maintain its primarily state-emanated design and implementation, i.e., that no significant changes in rural development have taken place. Decentralization failed to contribute to the development of rural areas [42].
The decentralization reform in Tanzania (1972) has had positive impacts on reducing spatial inequalities and on rural development. Equitable allocations of development inputs and the provision of social services to villages through decentralization have resulted in increased popular participation in local-level planning in agriculture and the construction of social service facilities, increased spatial interactions through the hierarchical planning process, and greatly increased access to social services, especially healthcare, a clean water supply, and primary education [43]. During the last decades, the central government of China decentralized the considerable autonomy of land development to local governments to encourage the latter to adopt their advantages in local information for economic growth. The local government pursues more development-oriented targets, such as collecting fiscal revenues and boosting economic growth [44]. Fiscal decentralization helped to reduce the income gap and promoted income equality in 31 Chinese provinces [45].
Therefore, the lack of unified conclusions on the general effectiveness of decentralization and its influence on rural development requires further research.
In addition, the approaches of scientists to determine the degree of rural development and its change under the influence of decentralization will be grouped as follows:
- (1)
- (2)
- (3)
Zekic S., Kleut Z., Matkovski B. are representatives of the first approach to the identification of rural development. Rural territory (X1), rural population (X2), rural GDP (gross domestic product) (X3), rural employment (X4), agriculture share in GDP (X5), average economic farm size (X6), labor productivity in agriculture (X7), farmers with other gainful activity (X8), medium or high educational attainment (X9), GDP per capita (X10), internet users (per 100 people) (X11), and environmental protection expenditure (EUR per capita) (X12) are indicators of rural areas [47].
Jurjević Ž., Zekić S., Ðokić D., Matkovski B. used a limited set of variables. These are as follows: the share of employees in the primary sector in the total number of employees; gross domestic product (GDP) per capita; primary sector share in total gross value added; total labor productivity (total GVA of all activities per employee); and labor productivity in the primary sector. The selection of variables was determined by the availability of data in the database used [31].
Dziekanski P. and other Polish scientists focused on 40 variables in financial potential, entrepreneurial potential, infrastructural potential, demographic potential, and the labor market, as well as environmental potential [39,48].
Shcherbak V., Ganushchak-Yefimenko L., Nifatova O., Fastovets N., Plysenko H., Lutay L., Tkachuk V., and Ptashchenko O. are representatives of the second approach to the identification of rural development. The methodological approach of Ukrainian scientists on how to define the indicators of sustainable development (including economic, socio-demographic, labor, and environmental domains) of rural areas was proposed. The article proposes a factor model (1) of the system for monitoring the status of socio-economic development of rural areas.
where In1 is gross regional product per capita, In2 is the profitability level of the main types of agricultural products, In3 is the specific weight of certified products in the total volume of products, In4 is investments in fixed assets of agricultural (farmer) enterprises located in the region, In5 is the share of processing industries in gross regional product, In6 is the import ratio of major groups of food products and non-food products, In8 is the labor force participation rate in rural areas, In9 is the volume of output sold for export by industries, In10 is the population with substandard income in % of the total population, In11 is the share of healthcare, education, culture, sports, and social policy expenditures, and In15 is he coverage of rural children by preschool facilities [49].
Y development = 1/7.563611 × (0.872618In1 + 0.76648In2 + 0.669841In3 − 0.52384In6) + 1/1.821988 × (0.783417In4 + 0.794634In5 + 0.910793In9) + 1/1.417022 × (0.887676In8 − 0.817369In10) + 1/1.232333 × (0.817369In11 + 0.670549In15),
Patil S.V., Khomiuk N., Bochko O., Pavlikha N., Demchuk A., Stashchuk O., Shmatkovska T., Naumenko N., Michalek J., and Zarnekow N. are representatives of the third approach to the identification of rural development. Banakar V. and Patil S.V. developed a conceptual model of the Rural Development Index for India. In understanding the present level of rural area development, there is a need to assess rural areas from five dimensions, namely economy, education, health, environment, and disposable income [52].
The difference between the two methods is as follows: the indices (Banakar V., Patil S.V. [52]) are based on single indicators that do not allow them to comprehensively identify the state of rural development; the indices (Tae-Hwa K. and Seung-Ryong Y. [55]) are based on a system of indicators. For example, the Education Cause Index is composed of indicators related to factors that lead to positive effects on the educational level of rural residents. The Education Cause Index is calculated based on the number of educational facilities, educators, and illiteracy eradication campaigns. Rural residents’ educational level improves when educational facilities are improved. The number of pupils per class in primary, secondary, and upper secondary schools are used as indicators to show the condition of educational facilities. Rural residents’ educational level improves when the number of teachers is increased. The number of pupils per teacher in primary, secondary, and upper secondary schools are used as indicators of teachers’ availability.
Khomiuk N., Bochko O., Pavlikha N., Demchuk A., Stashchuk O., Shmatkovska T., and Naumenko N. substantiated a formula of the index of sustainable development of rural areas of Ukraine on private indicators of social, environmental, and economic systems. The peculiarity of the Formula (2) is the possibility to calculate the index of sustainable development of rural areas of Ukraine for the state as a whole.
where a0, a1, a2, a3 are the parameters of model, Iru is the integral index, Irursoc is the index of social sphere development, Irurecon is the index of economic situation, and Irurecol is the index of ecological situation [56].
Irur = a0 + a1 × Irursoc + a2 × Irurecon + a3 × Irurecol,
To assess the relative importance of various domains of rural development, Michalek J. and Zarnekow N. subdivided all partial coefficients/variables describing different aspects of rural development into the following 6 main groups: economic (292 variables in Poland; 102 variables in Slovakia), social (337 variables in Poland; 187 variables in Slovakia), environmental (199 variables in Poland; 20 variables in Slovakia), demographic (70 variables in Poland; 13 variables in Slovakia), administrative (122 variables in Poland; 13 variables in Slovakia), and infrastructural (69 variables in Poland; 19 variables in Slovakia [51], as shown in Table A1 in Appendix A).
Due to the scientific achievements of Michalek J. and Zarnekow N., we can see the application of the entropy weight method. Jiang L., Luo J., Zhang C., Tian L., Liu Q., Chen G., and Tian Y. also apply the entropy weight method to determine the indicator’s weight in the index system, based on the amount of available information provided by each indicator (Table A2 in Appendix B). The “entropy weight” theory is an objective weighting method, in which the weight of each indicator can be calculated according to its variation degree, which avoids the influence of human subjectivity on the results and, to some extent, makes up for the limits of inter-correlations between indicators [53].
Cadona L., Umburanas R., Vieira P., and Dourado Neto D. substantiated the calculation of the Sustainable Rural Development Index (SRDI) in order to characterize, in rural areas, the economic (EDI), social (SDI), and environmental (ADI) development through three primary indices, seven secondary indices (gross domestic product index in rural areas, per capita income level in rural areas, life expectancy index, education index, employment index, legal reserve index, permanent preservation area index) and seven parameters. The secondary indices were computed using the mean values of different parameters, by district, through normalized variables (range from 0 to 1) [54].
The purpose of this article is the empirical study of the development of rural areas in Ukraine in the context of decentralization. This article developed the following working hypotheses, derived from the main purpose of the study. We set out the hypotheses as follows.
Hypothesis 1 (H1).
Increasing the level of rural development, which is confirmed by the positive dynamics of the main indicators of rural development and achieving the target level of rural development.
Hypothesis 2 (H2).
Positive impact of decentralization on the development of rural areas of Ukraine by reducing inequality in rural development.
2. Materials and Methods
Our study suggests five principles for constructing a Rural Development Index (IRD). First, an index should be located within the range (0 ≤ IRD ≤ 1) and satisfy the limits so that it can be clearly analyzed and compared.
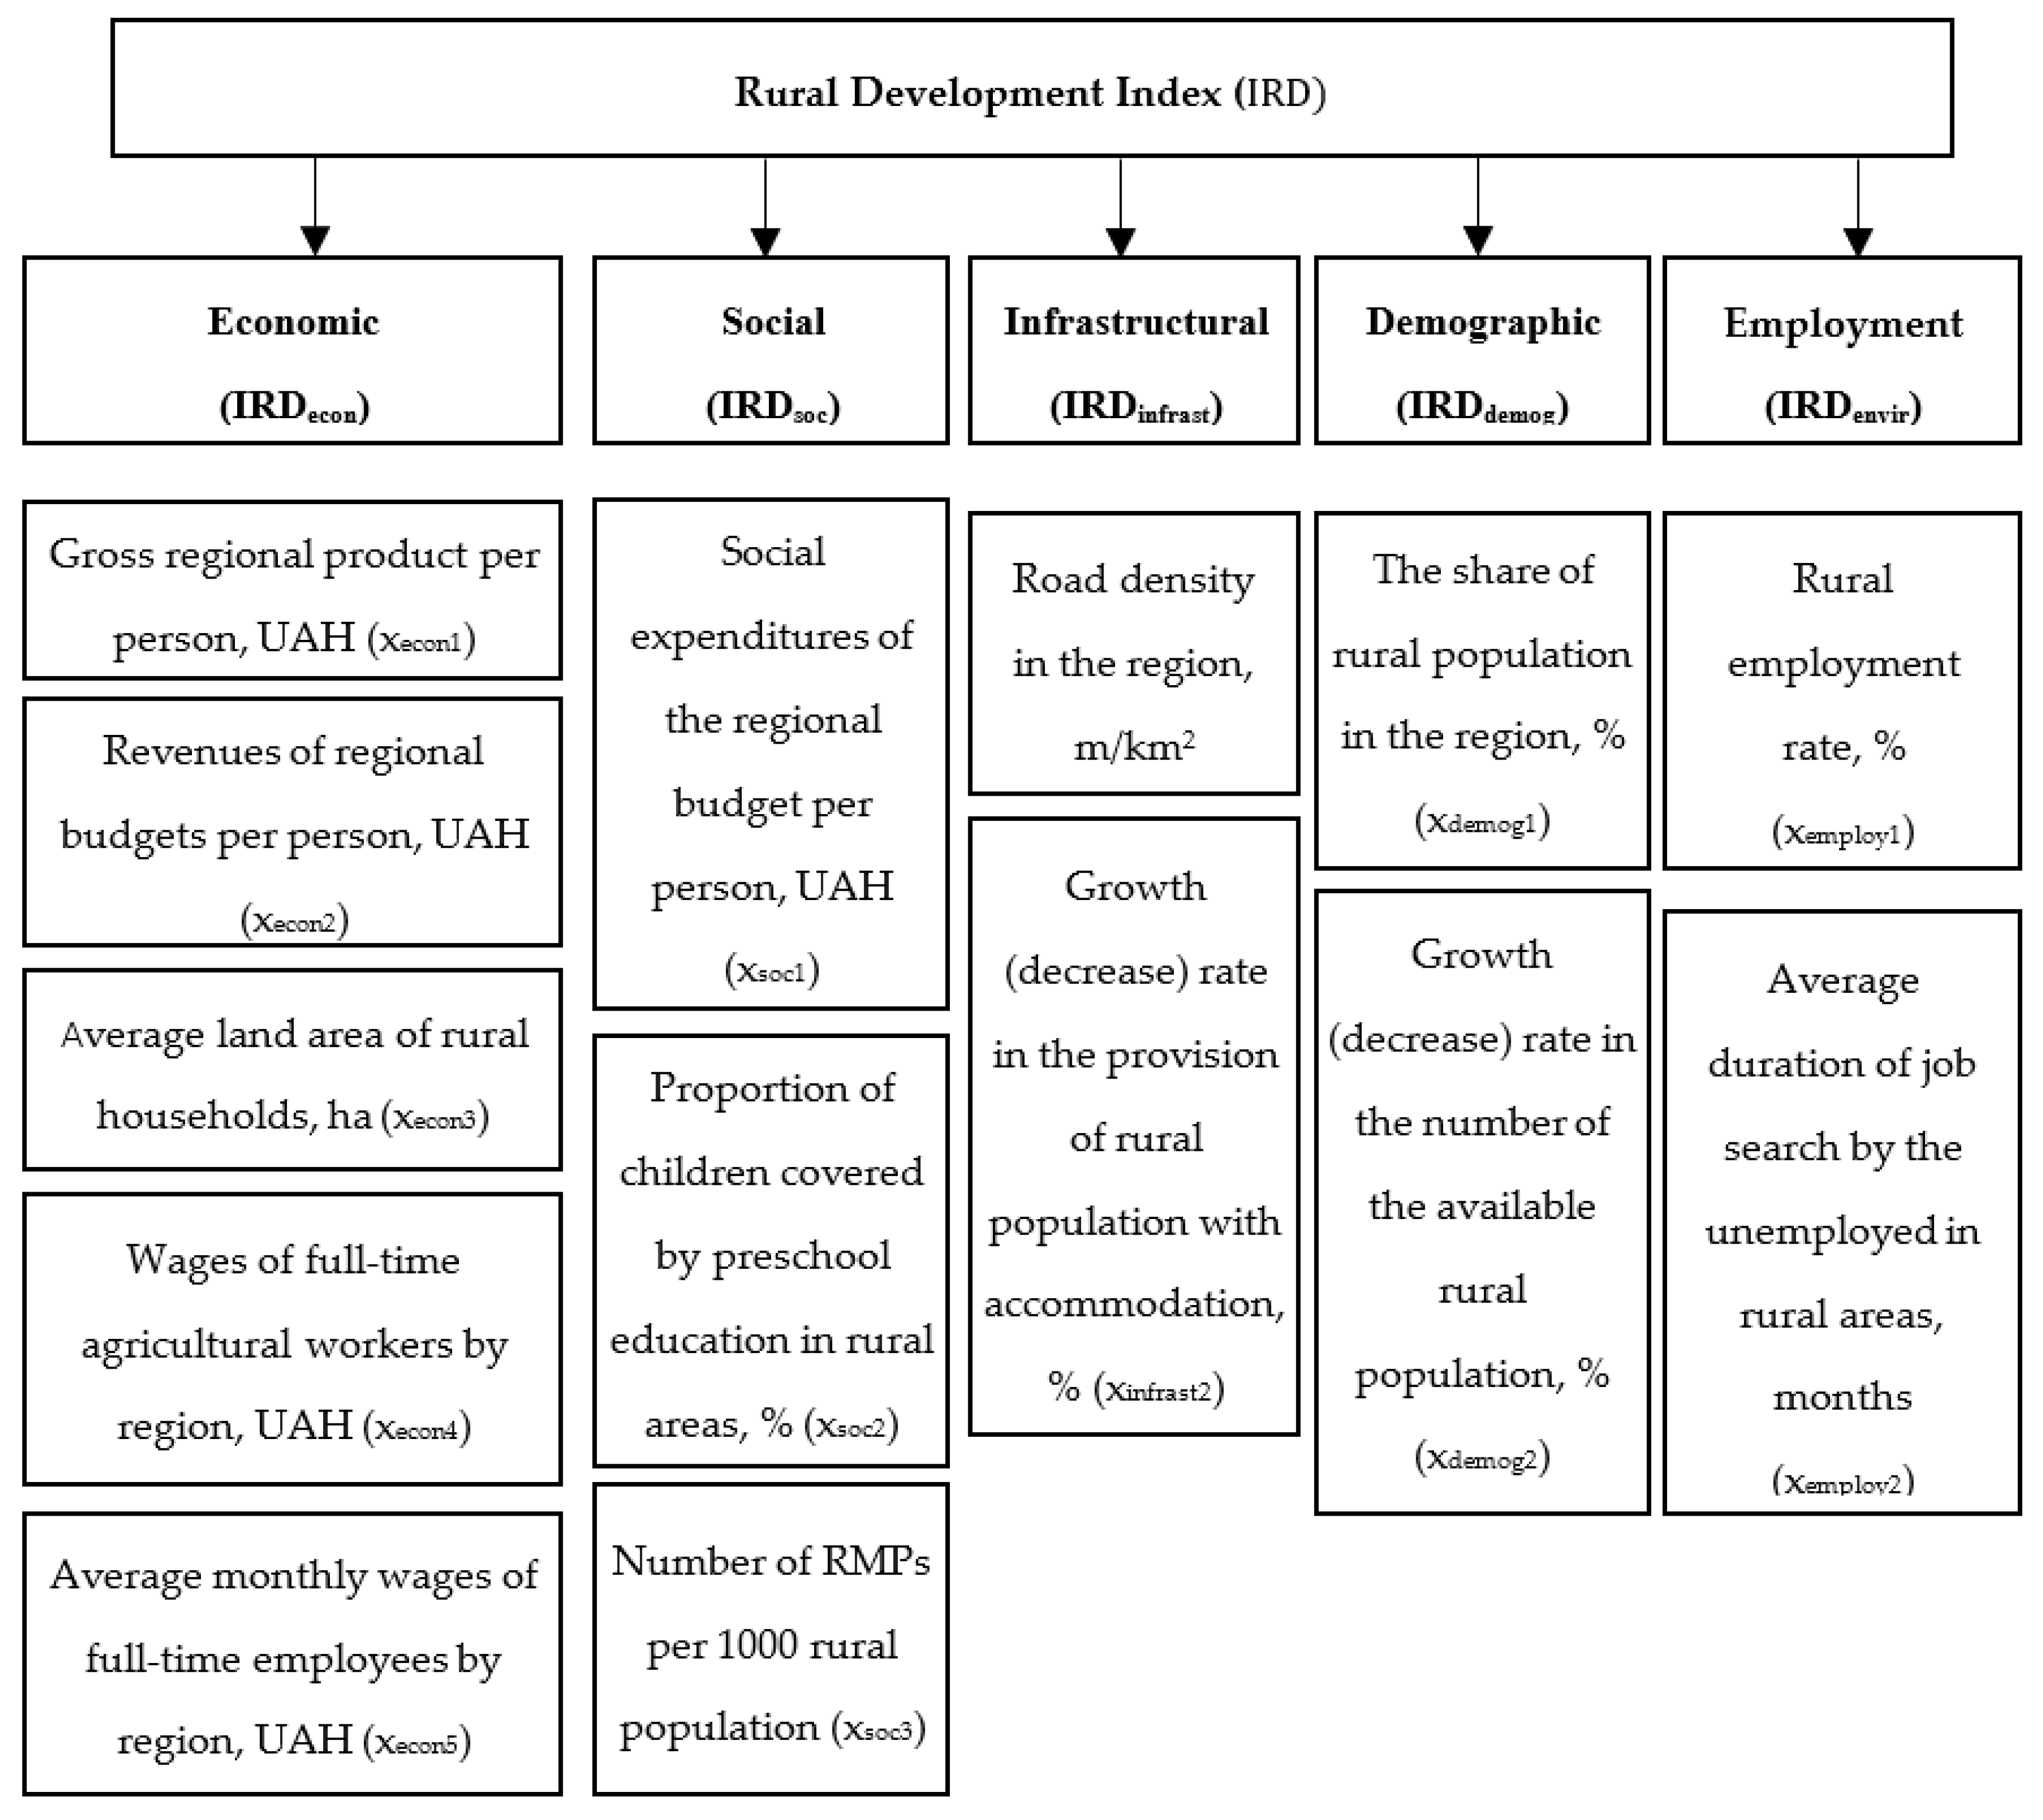
Second, the indicators should be independent and not duplicated (independence). Third, representative indicators that fully reflect certain characteristics of each domain shall be meticulously selected to construct the index (completeness). To identify the Rural Development Index, 14 relative indicators were selected that characterize the economic, social, infrastructural, demographic, and employment aspects of regional development (Figure 1). The selection of indicators of the Rural Development Index was based on a analysis of the literature [31,39,46,47,48,49,50,51,52,53,54,55,56], and on an assessment of the availability of reliable values for each indicator.
Indicators of the economic condition of rural areas are not publicly available, so they will be replaced with the following indicators of regional development: gross regional product, regional budget revenues, wages of full-time agricultural workers, average monthly wages of full-time employees.
Indicators of social development in rural areas are limited to the proportion of children in preschool education (a similar indicator for secondary education is not published) and the availability of rural medical posts, as well as social expenditures of regional budgets. Social expenditures include expenditures of consolidated regional budgets on education, health, social protection and social security, culture and art, physical culture, and sports.
Indicators of the infrastructural development of rural areas are limited to the indicator of road density and the provision of the rural population with accommodation.
Demographic indicators of rural areas are limited to the share of the rural population and the rate of growth (decrease) of the available rural population, taking into account the natural increase (decrease) and migration gain (decrease).
Employment indicators in rural areas are limited to the indicators of the rural employment rate and average duration of job search by the unemployed in rural areas.
Fourth, an index should be composed of data characterized by credibility and quality. For the empirical study, data from the State Statistics Service of Ukraine (to calculate the representative indicators xecon1, xecon3, xecon4, xecon5, xsoc2, xinfrast1, xinfrast2, xdemog1, xdemog2, xemploy1, xemploy2), the Ministry of Finance of Ukraine (to calculate the representative indicators xecon2, xsoc1), and the Ministry of Health of Ukraine (to calculate the representative indicator xsoc3) were used.
Fifth, the process to calculate an index should be clear and scientifically sound. The Rural Development Index (IRD) for the Ukrainian regions is calculated according to the following steps:
(1) Data standardization. The system evaluating the rural development level consists of indicators, and the attribute of indicators is positive (all indicators except xemploy2) and negative (xemploy2). To ensure the comparison of original data and different scalar dimensions, a maximum value standardization process was applied to the data [53], and the data standardization formula is as follows:
where x′ is the index after standardization, x is the actual value of the rural development, and max (x) and min (x) are the maximum and minimum values of the rural development.
Positive index: x′ = (x − min (x))/(max (x) − min (x)),
Negative index: x′ = (max (x) − x)/(max (x) − min (x)),
(2) Weight determination. The determination of the index weight involves taking into account such a condition as the lack of publication of some of the indicators of rural development. Accordingly, regional development and rural development indicators are taken into account to determine the Rural Development Index. Indicators of rural development are given greater importance (xecon3, xsoc2, xsoc3, xinfrast2, xdemog1, xdemog2, xemploy1, xemploy2), while the importance of regional development indicators is given 15% less weight (xecon1, xecon2, xecon4, xecon5, xsoc1, xinfrast1). Thus, the authors identified the greater importance of the indicators characterizing rural development. The indicators describing the development in a certain region (xecon1, xecon2, xecon4, xecon5, xsoc1, xinfrast1) received the rank 0.85, while the indicators characterizing the rural development (xecon3, xsoc2, xsoc3, xinfrast2, xdemog1, xdemog2, xemploy1, xemploy2) achieved the rank 1.
Finally, the intermediate index is calculated as follows:
IRDecon = 0.19 x′econ1 + 0.19 x′econ2 + 0.24 x′econ3 + 0.19 x′econ4 + 0.19 x′econ5,
IRDsoc = 0.3 x′soc1 + 0.35 x′soc2 + 0.35 x′soc3,
IRDinfrast = 0.46 x′infrast1 + 0.54 x′infrasr2,
IRDdemog = 0.50 x′demog1 + 0.50 x′demog2,
IRDemploy = 0.50 x′employ1 + 0.50 x′employ2,
(3) Rural Development Index. According to the authors, the definition of the Rural Development Index is based on the equality of all components of regional development (economic, social, infrastructural, demographic, and employment). With this approach, the Rural Development Index is defined as the following arithmetic mean:
IRD = 0.20 IRDecon + 0.20 IRDsoc + 0.20 IRDinfrast + 0.20 IRDdemog + 0.20 IRDemploy,
The level of regional development is differentiated by the following ranks: very low (0 ≤ IRD < 0.25), low (0.25 ≤ IRD < 0.50), medium (0.50 ≤ IRD < 0.75), very good (0.75 ≤ IRD < 1), excellent (IRD = 1).
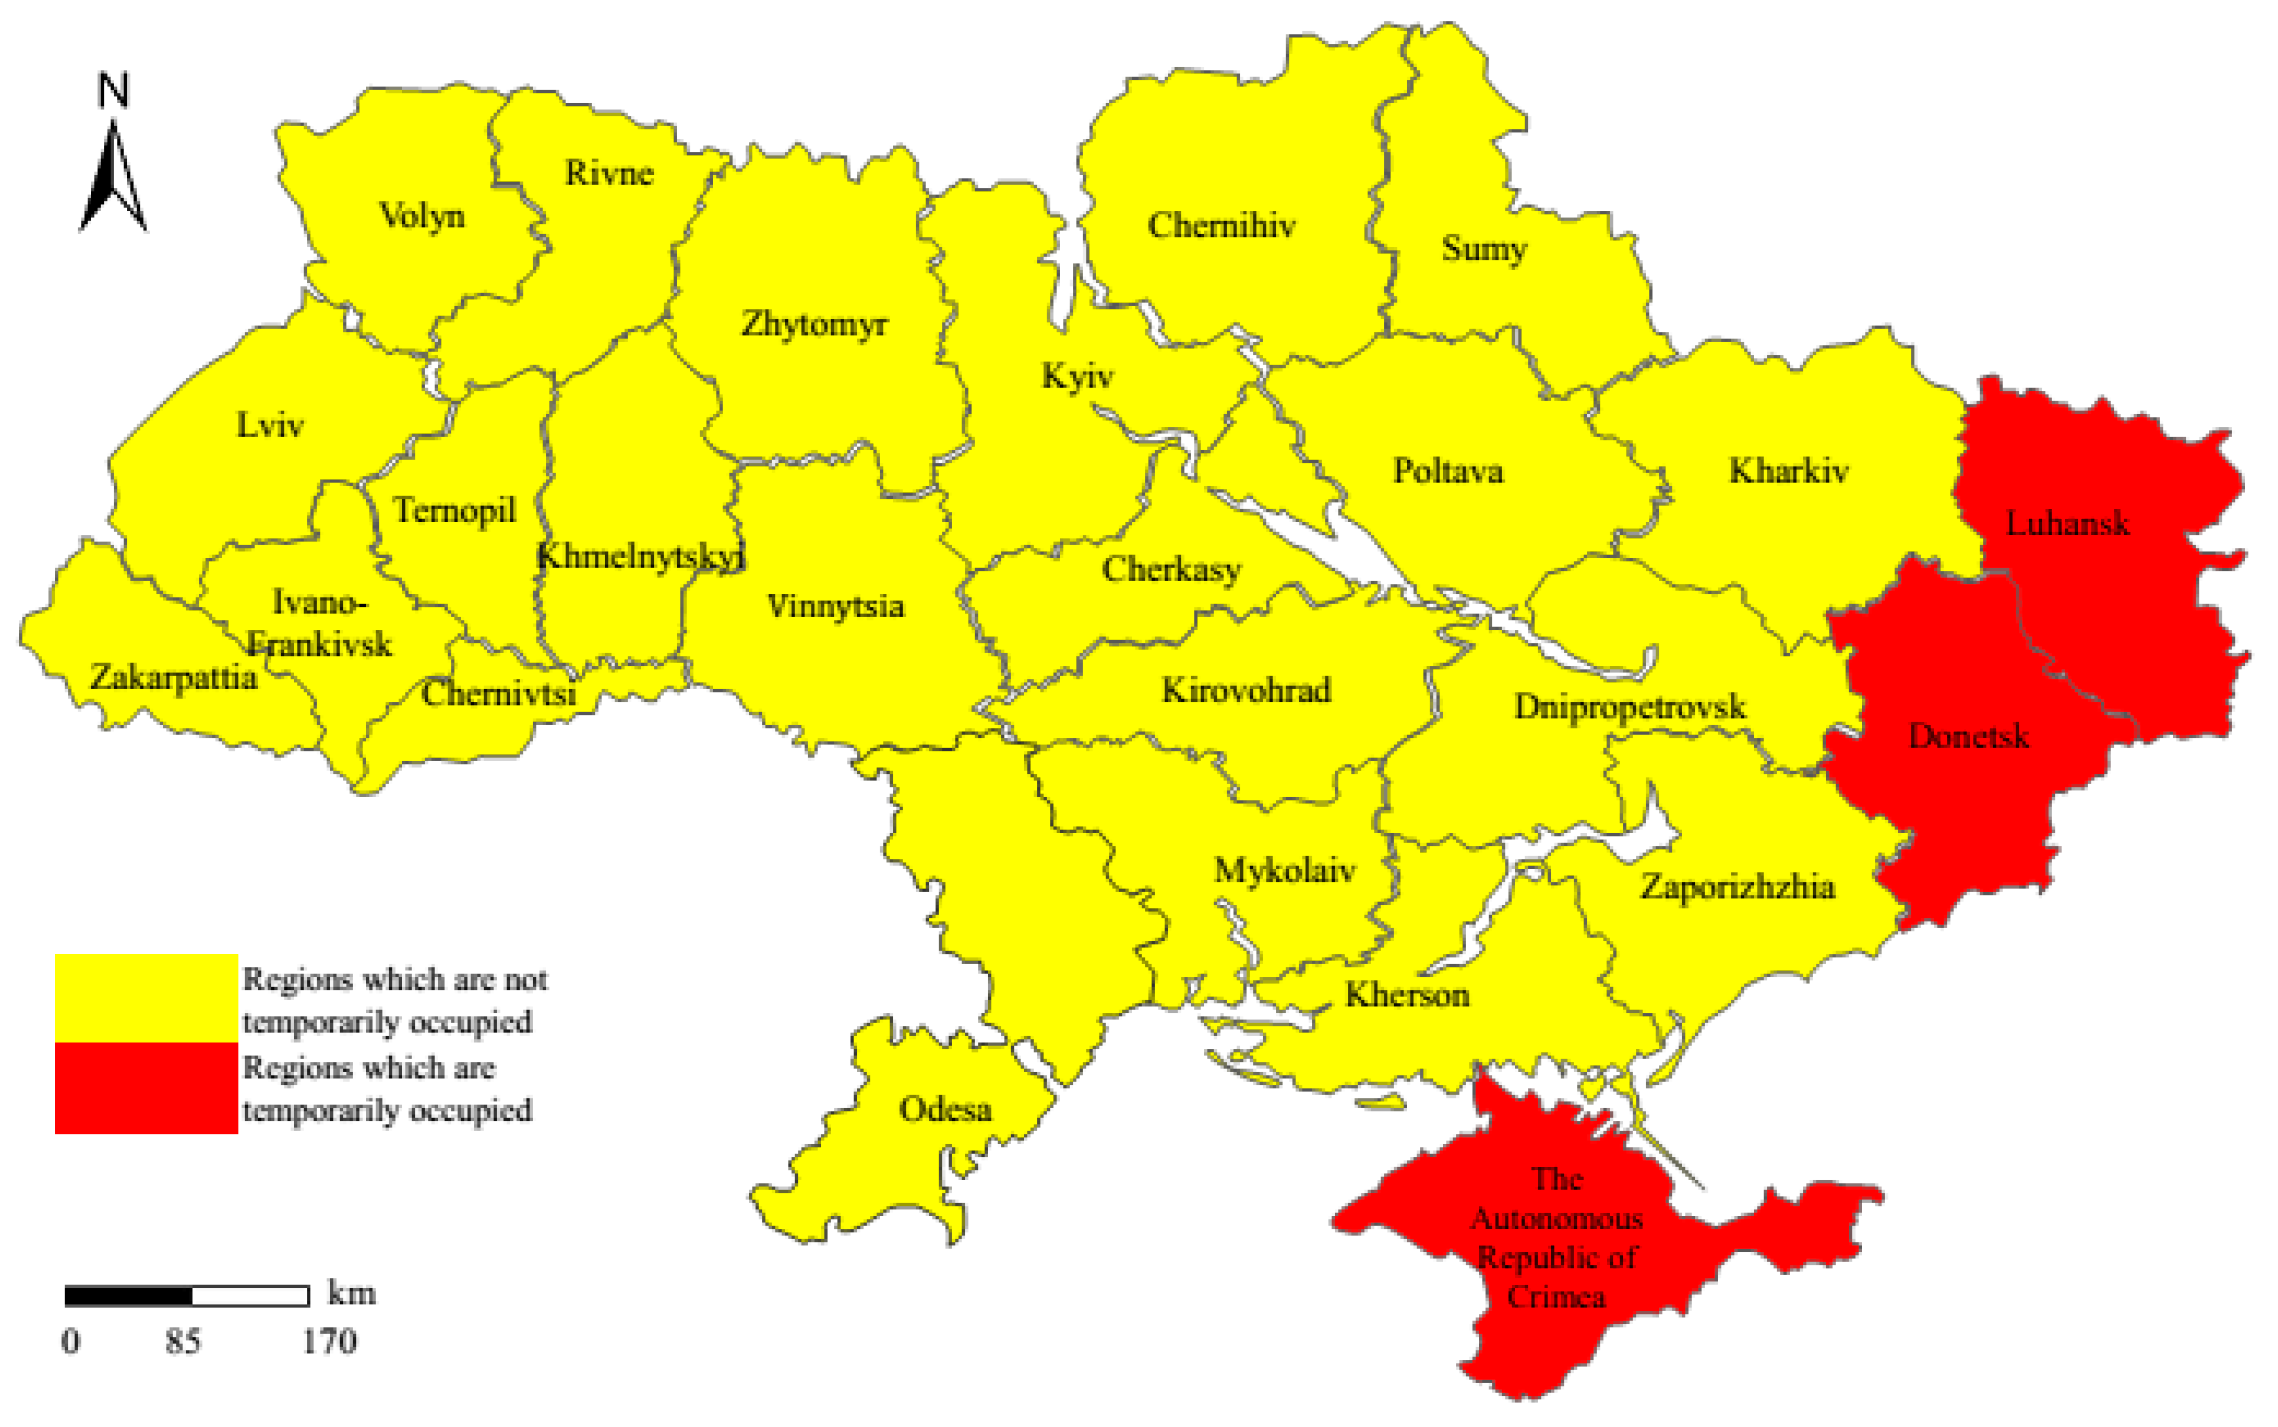
This paper contains data on Ukrainian villages. The study was conducted for 2012–2018, which allows to draw the conclusions about the effectiveness of decentralization in Ukraine. In 2012–2013, the rural development analysis covers 25 regions, in 2014–2020, it covers 24 regions or 22 regions (Figure 2). It is explained by the occupation of part of the territory of Ukraine and the inability to obtain statistical data or low reliability of the data.
3. Results
3.1. Hypothesis 1
A pragmatic approach to decentralization should be adopted, based on an in-depth analysis of political, social, and economic conditions in the country [57].
To prove/deny Hypothesis 1, rural development was determined according to the indicators described in the authors’ Rural Development Index.
Based on the results shown in Table 1, decentralization in Ukraine in the medium term period (2015–2020) did not have a significant positive impact on key indicators of rural development. On the contrary, during the decentralization period, the proportion of the rural population, the rural employment rate decrease, and the rate of the available rural population decrease exceeded the rate of decrease in the period before decentralization. The proportion of children in preschool education should be considered as the exception, as the indicator xsoc2 was stable and exceeded the indicator in 2014 by 1%.
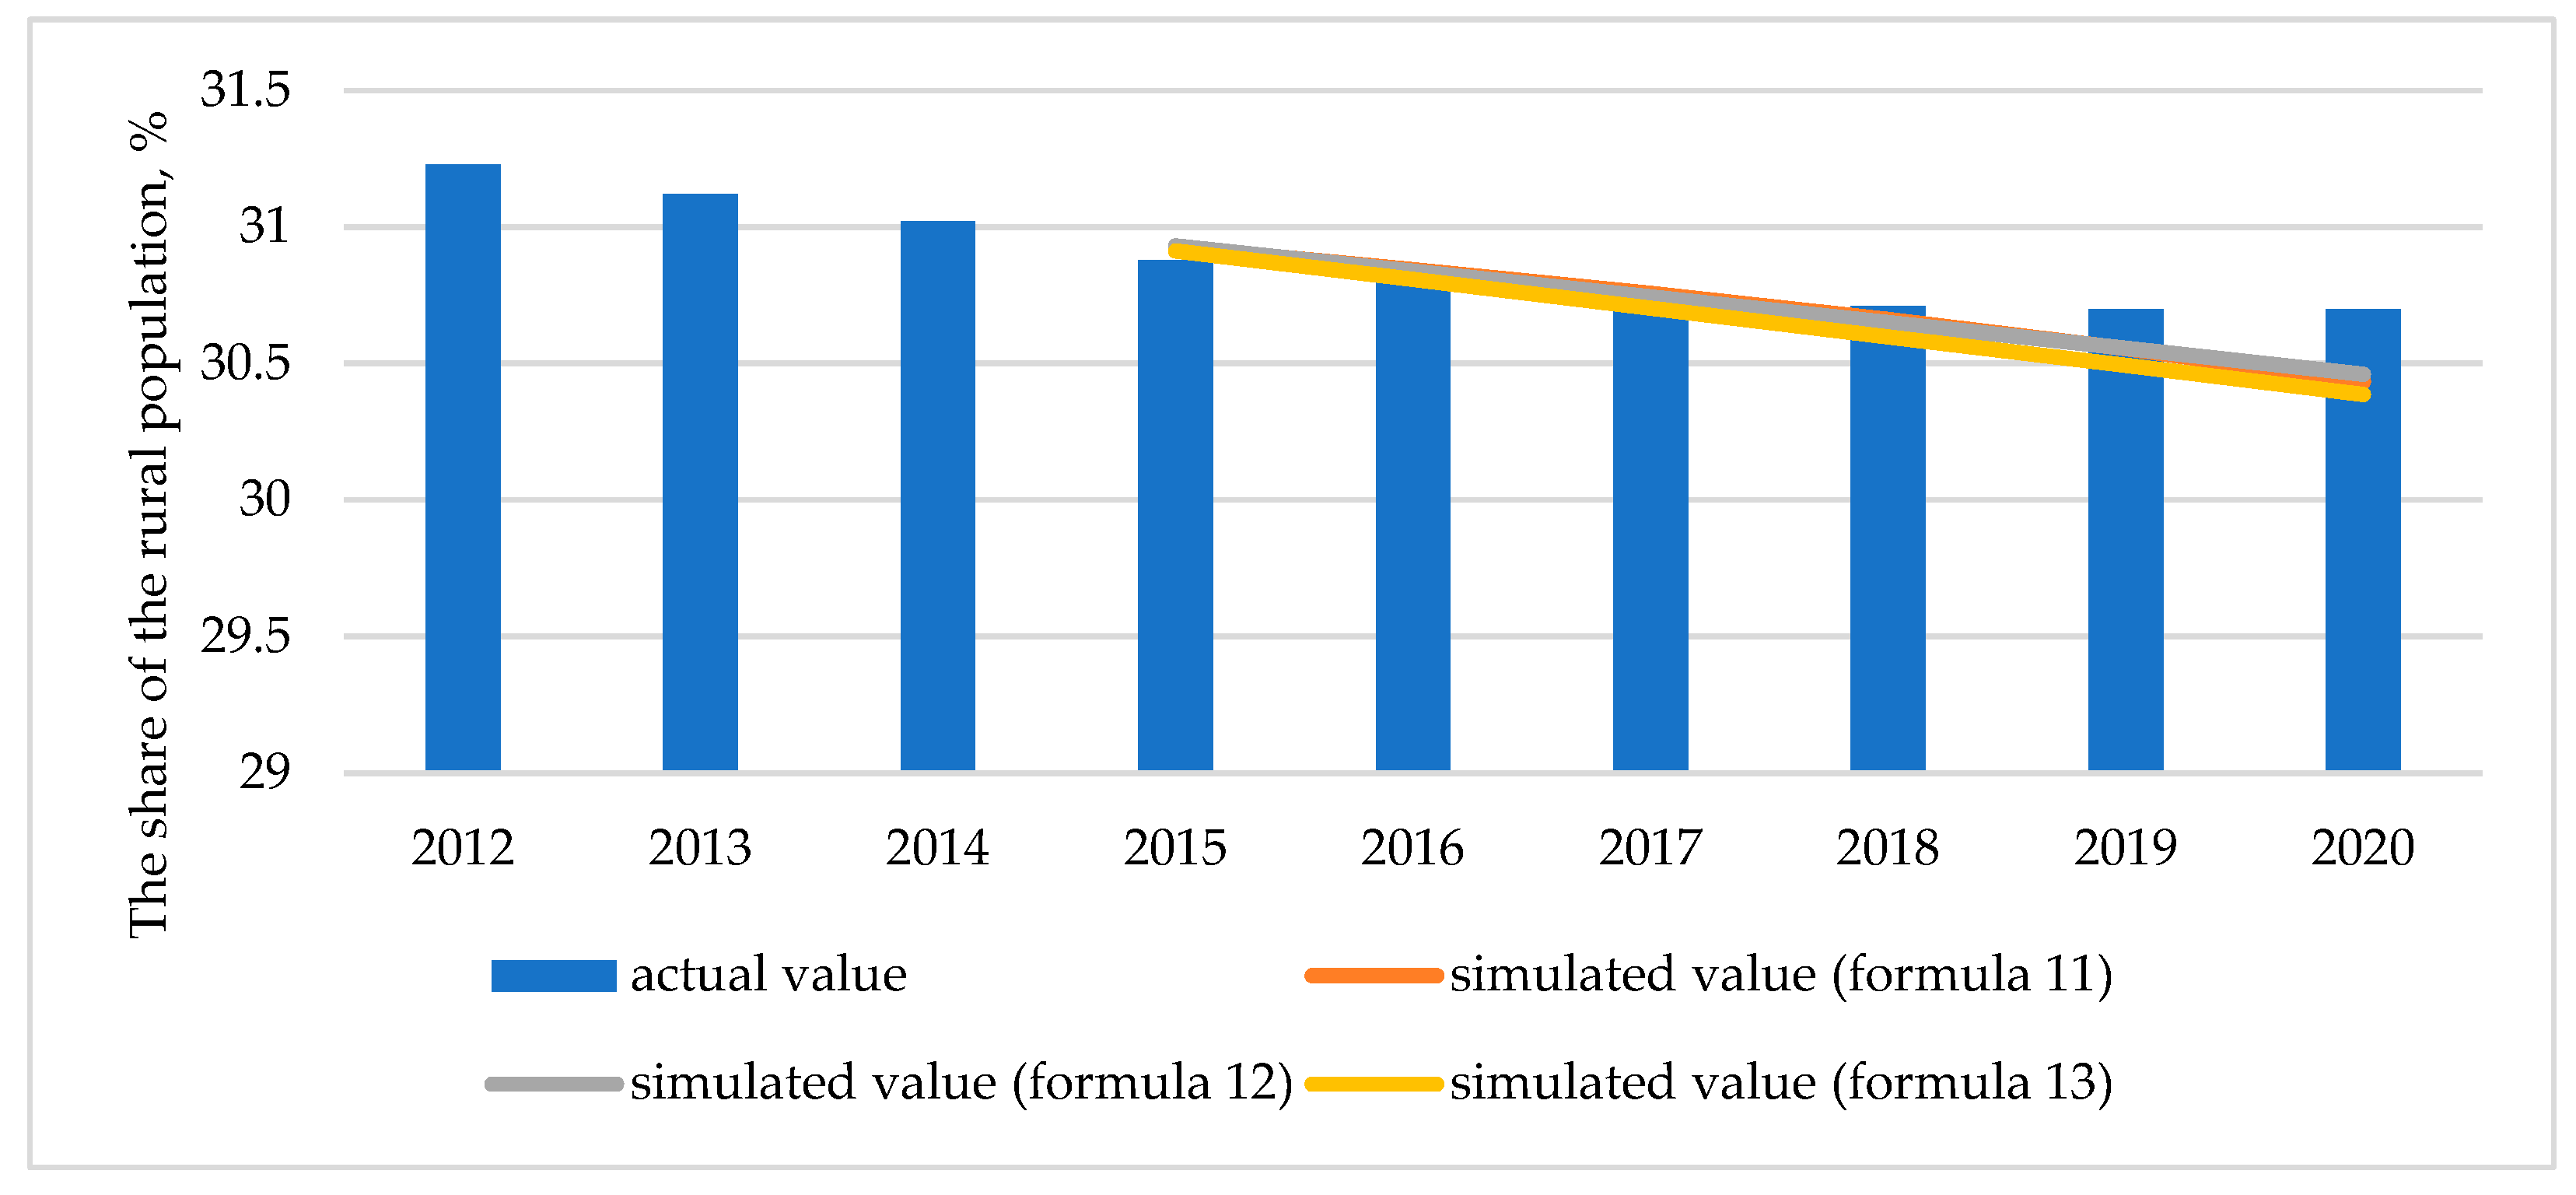
Thus, according to the state statistical data, the decrease in the main indicators of rural development in Ukraine has been proved. Using regression models in economic and mathematical modeling [59], the simulated indicators of the proportion of rural population xdemog1 based, on long-term models, as in Formulas (11) and (12), and the medium-term model, as in Formula (13), were determined.
xdemog1 2005–2014 = −0.0006 t 3 + 0.0195 t 2 − 0.2934 t + 32.59, R2 = 0.9973,
xdemog1 2010–2014 = −0.094 t + 31.496, R2 = 0.9959,
xdemog1 2012–2014 = −0.105 t + 31.333, R2 = 0.9992,
Figure 3 shows the results of the regression analysis and proves that in the long term and medium term the proportion of the rural population decreased by 0.10 annually. The introduction of decentralization has reduced the rate of decline in the share of the rural population and the actual indicators were higher than the simulated values.
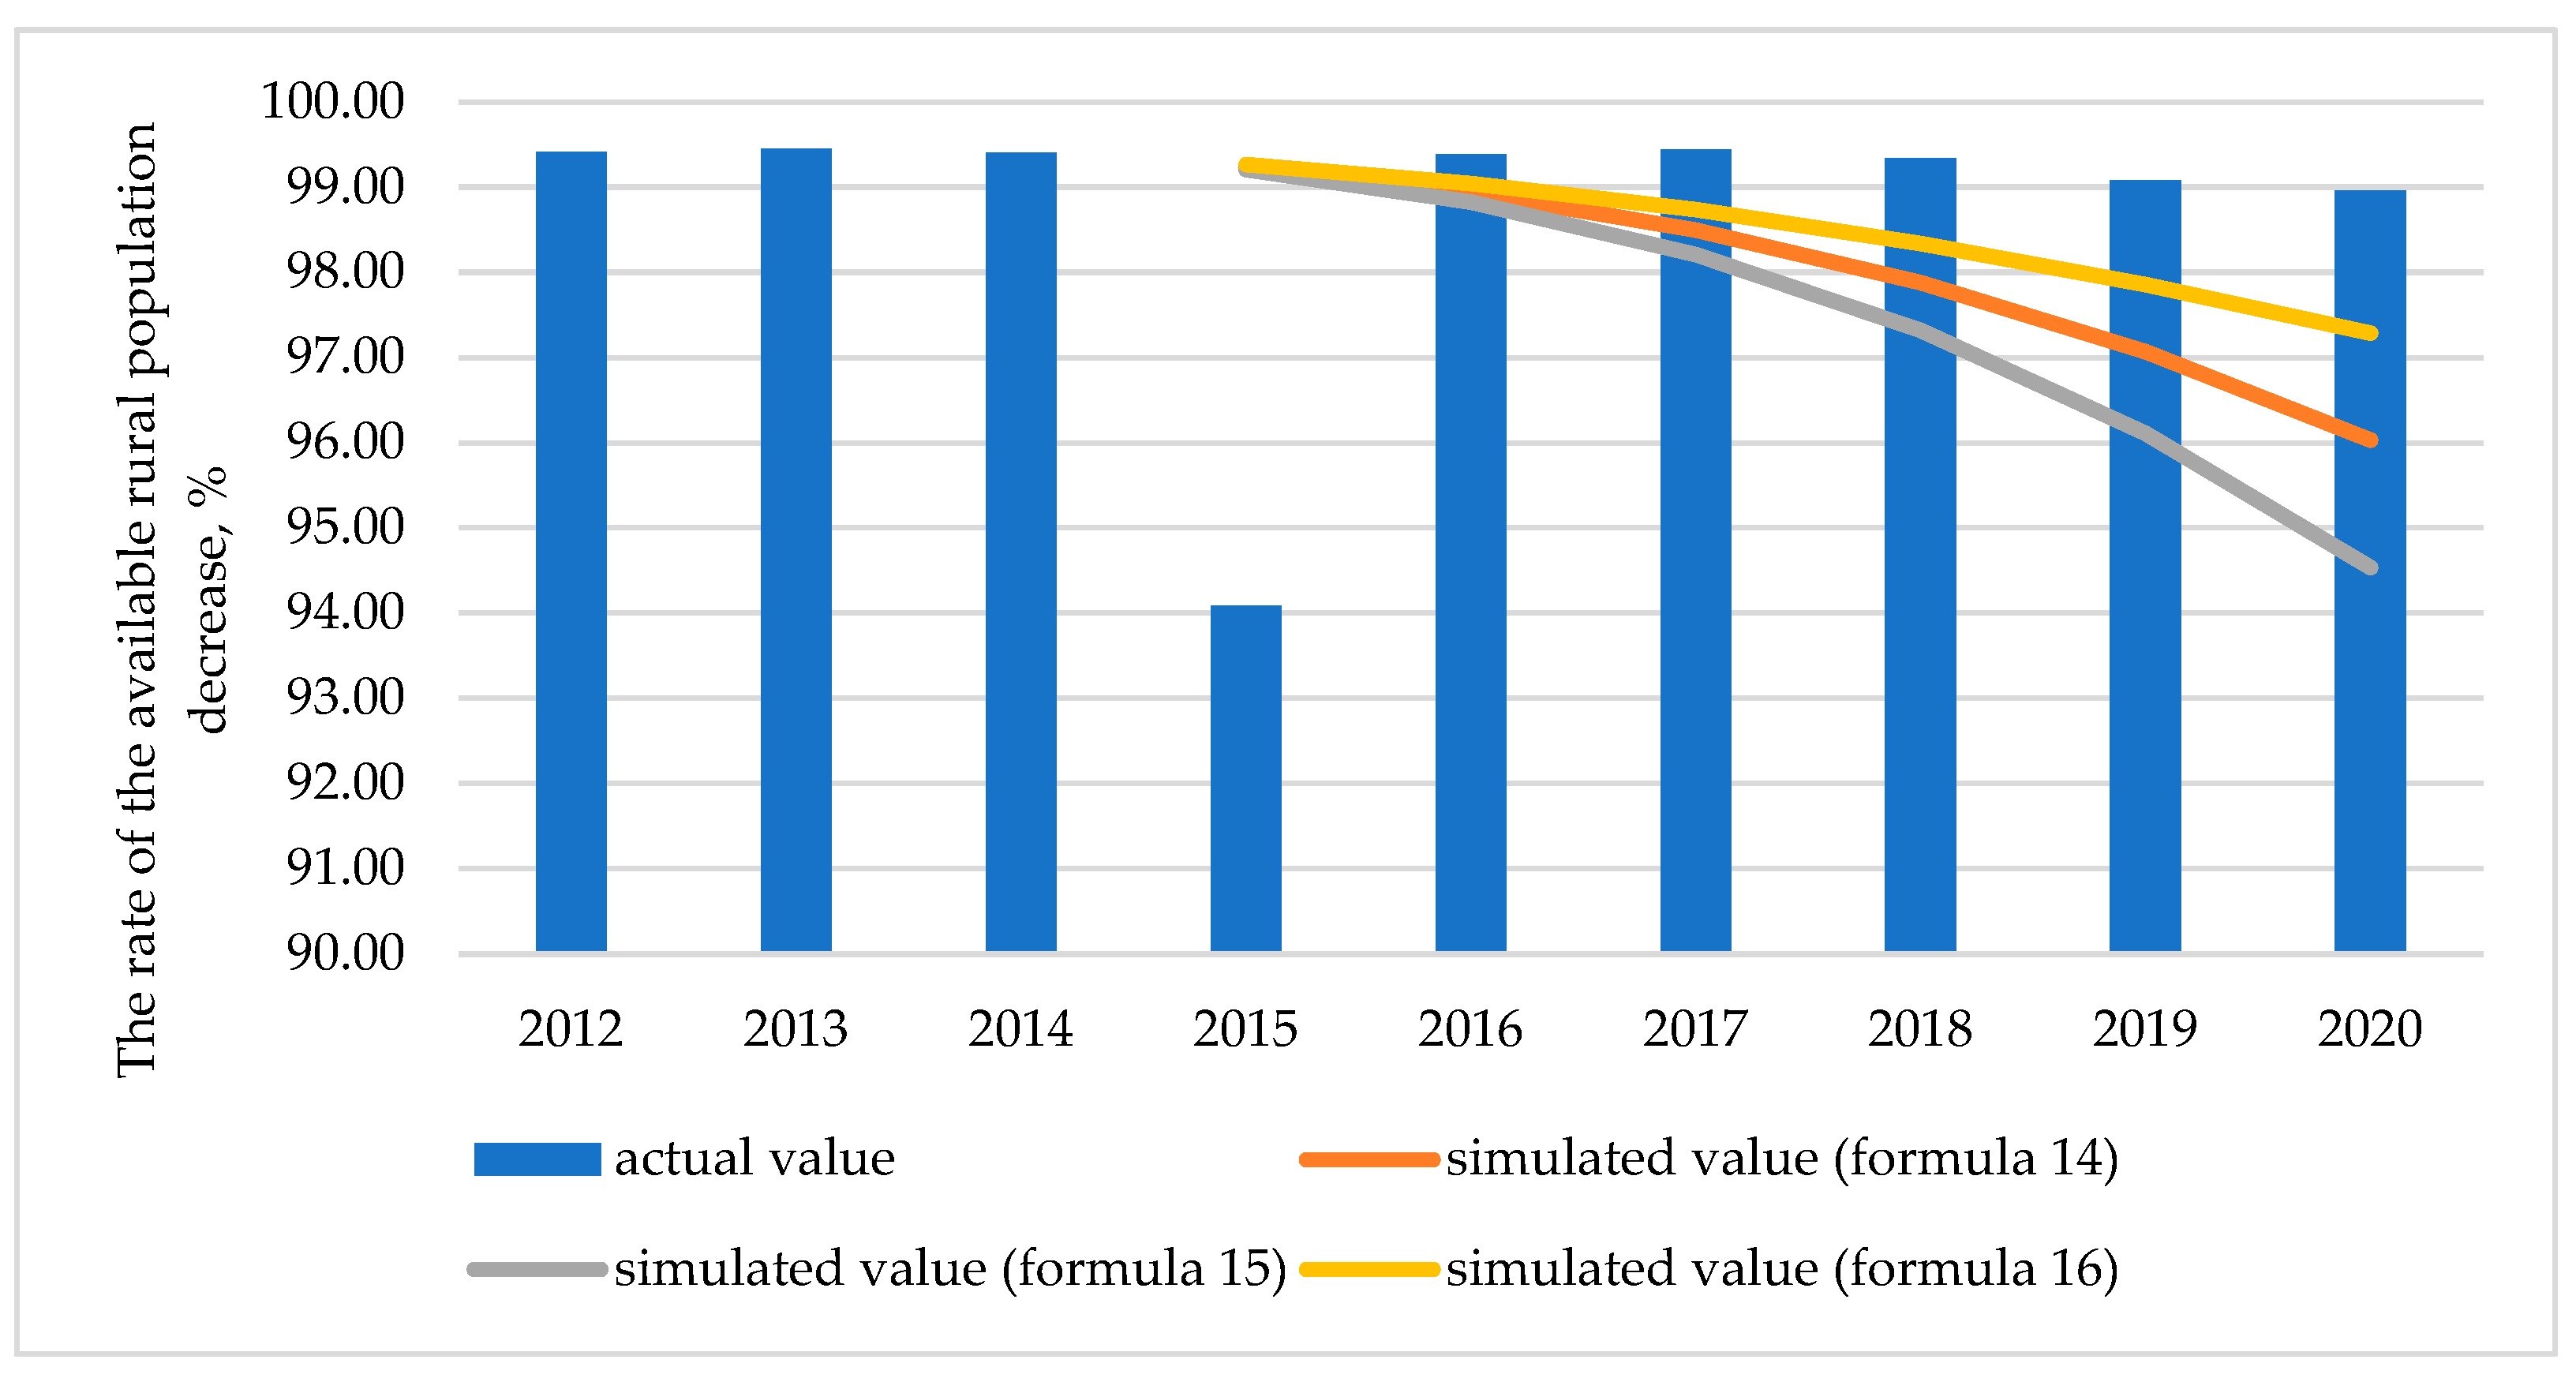
The rate of the available rural population decrease indicates an annual decrease in the rural population due to such factors as natural movement and migratory movement. Figure 4 shows the results of the long-term and medium-term regression analysis (Formulas (14)–(16)) and identifies the simulated values of the rate of the available rural population decrease during the decentralization period, as follows: 2015—99.2–99.3%, 2016—98.8–99.0%, 2017—98.2–98.7%, 2018—97.3–98.3%, 2019—96.1–97.1%, and 2020—94.5–97.2%.
xdemog2 2005–2014 = −0.0025 t 3 + 0.0339 t 2 − 0.0044 t + 98.588, R2 = 0.9997,
xdemog2 2010–2014 = −0.0023 t 3 + 0.004 t 2 − 0.136 t + 99.112, R2 = 0.9944,
xdemog2 2012–2014 = −0.0427 t 2 + 0.1651 t + 99.291, R2 = 1.00,
The actual rate of the available rural population decrease in 2015–2020 was lower, indicating a slowdown in the rate of the available rural population decrease. Similar studies have been conducted to show the rural employment rate.
The first advantage of the introduction of decentralization was identified as a slowdown in the rate of decrease of the main demographic and employment indicators of rural development, namely the proportion of the rural population, the rate of the available rural population decrease, and the rural employment rate. Other indicators did not change significantly with the introduction of decentralization.
To prove/deny Hypothesis 1, the definition of rural development according to the indicators described in the Rural Development Concept (Table 2) was also carried out. It is worth noting that, in 2015, the Government of Ukraine adopted the Rural Development Concept to create the necessary organizational, legal, and financial prerequisites for rural development via the following methods: the diversification of economic activities; increasing the level of real income from agricultural and non-agricultural activities in rural areas; achieving guaranteed social standards and improving living conditions of rural populations; environmental protection, conservation, and restoration of natural resources in rural areas; preservation of the rural population as a bearer of Ukrainian identity, culture and spirit; creating conditions for empowering territorial communities of the village and settlement to solve available problems in rural areas; and bringing legislation in the sphere of rural development in line with EU standards [60].
To assess the effectiveness of measures developed in the Rural Development Concept, critical indicators are defined. Based on the results shown in Table 2, the dynamics of individual indicators are contrary to the Rural Development Concept [60].
The first task of the Rural Development Concept is to increase the rural population. However, in fact, the population decreased between 2012–2014 (the average annual decrease was about 100,000 people), and the decrease continued in 2015–2020, albeit with less intensity (the average annual decrease was about 80,000 people). Thus, according to the Rural population indicator, the following can be summarized: the rural population increase was not achieved, but since 2015 the intensity of its decrease has reduced.
The second task of the Rural Development Concept is to raise the level of wages in agriculture. Since 2015, there has been an increase in wages in agriculture, an annual increase of 40 euros, as in Formula (17). To substantiate the conclusion about the increase of wages in agriculture, the rate of wages growth in agriculture and the economy of Ukraine in general shall be compared. In 2016, the rate of wage growth in agriculture was 1.27 against 1.24 in the economy as a whole. In 2017, the growth rate was 1.44 against 1.37; in 2018, the growth rate was 1.25 against 1.25; in 2019, the growth rate was 1.17 against 1.18; in 2020, the growth rate was 1.26 against 1.21. Thus, according to the “The level of wages in agriculture” indicator, the following can be summarized: the Rural Development Concept increased the level of wages in agriculture and fulfilled this condition of rural development.
Salary agric2015–2020 = 40.22 t + 83.33, R2 = 0.9653,
The third task of the Rural Development Concept is to increase the number of jobs in rural areas by 1,000,000. According to Table 2, in 2020, we observe a decrease in jobs in rural areas by 1.5 million against 2013. The implementation of the main provisions of the Rural Development Concept did not contribute to the implementation of the fourth task of the Rural Development Concept, namely increasing the number of employed rural population. As of 2020, the share of the employed rural population was 93% of the level in 2015. The dynamics of the employed rural population in 2015–2020, described by Formula (18), indicates an average annual decrease by about 2%. Factors that caused this negative trend are changes in the structure of agricultural production (the volume of agricultural production in crop production, being a less labor-consuming branch, has recently increased, whereas animal production has decreased), reduction in the sphere of agricultural work application, disproportion of the conjuncture of rural labor markets, deficit of job vacancies, low labor productivity, low level of earnings, decrease in the economically active rural population, deformation of its age structure, etc. [61].
Employment rural population 2015–2020 = 0.0199 t + 1.0228, R2 = 0.9517,
We can say that, in the absence of changes in rural development and in the absence of incentives for agricultural entrepreneurship, the number of the employed rural population will decrease by 15.7% by 2025, against an increase of 50% growth in accordance with the Rural Development Concept.
The fifth task of the Rural Development Concept, which is to increase the share of income of rural households from entrepreneurship and self-employment up to 15% by 2025, is at risk, as the actual share of income of rural households from entrepreneurship and self-employment in 2020 was 2.7 times smaller. Income of rural households from entrepreneurial activity and self-employment are inferior in terms of wages to income from the sale of agricultural products and pensions.
To prove/deny Hypothesis 1 about the positive impact of decentralization on the socio-economic development of rural areas, the fiscal results of decentralization shall be defined. Fiscal decentralization in Ukraine is characterized by reforming the administrative-territorial system, increasing the revenues of rural and district budgets, and transferring authority to implement budget expenditures. Due to the transfer of fiscal rights to rural settlements, united territorial community budgets and district budgets increased their share in the consolidated budget of Ukraine to 7.8% in 2018 against 4.2% in 2015.
Ukrainians generally approve of decentralization reform, although their attitudes have fluctuated over the years. The main problems are in the people’s fear of change, distrust in authorities, and disproportionate regional development [62].
Thus, Hypothesis 1 on increasing the level of rural development has not been proven, which is confirmed by the negative dynamics of the main indicators of rural development and the lack of prospects for achieving a critical level of indicators approved by the Rural Development Concept. The advantages of decentralization include slowing the deterioration of rural development due to increased financial resources for rural and settlement budgets and slowing down the rate of decrease of such indicators as the share of rural population, the rate of the available rural population decrease, and rural employment.
3.2. Hypothesis 2
To prove/deny Hypothesis 2 on reducing the differentiation of rural development, the level of variation of indicators on which the Rural Development Index is based will be determined, as well as the Rural Development Index (IRD).
The variation coefficient (V) introduced by Karl Pearson over 100 years ago is one of the most important and widely used moment-based summary statistics [63]. The variation coefficients of rural development indicators show that the level of regional development differentiation has decreased due to the introduction of decentralization. First of all, it is worth noting the reduction of inequality in social expenditures of regional budgets due to fiscal decentralization and the reformation of the system of inter-budget transfers (Budget Code of Ukraine [64] and the Law of Ukraine “On Amendments to the Budget Code of Ukraine as to inter-budget relations reform” [65]). Due to the regulation of inter-budget relations and the introduction of a subvention for the implementation of state social protection programs (the main goal of which is to provide social assistance to certain categories of citizens and subsidies), educational subvention (the main goal of which is to finance primary schools, gymnasiums, specialized education facilities, colleges, and vocational schools), medical subvention (the main goal of which is to finance general hospitals, maternity hospitals, outpatient clinics and dispensaries, as well as emergency care centers, etc.), the level of social expenditures is as close as possible to unification in 2015–2020.
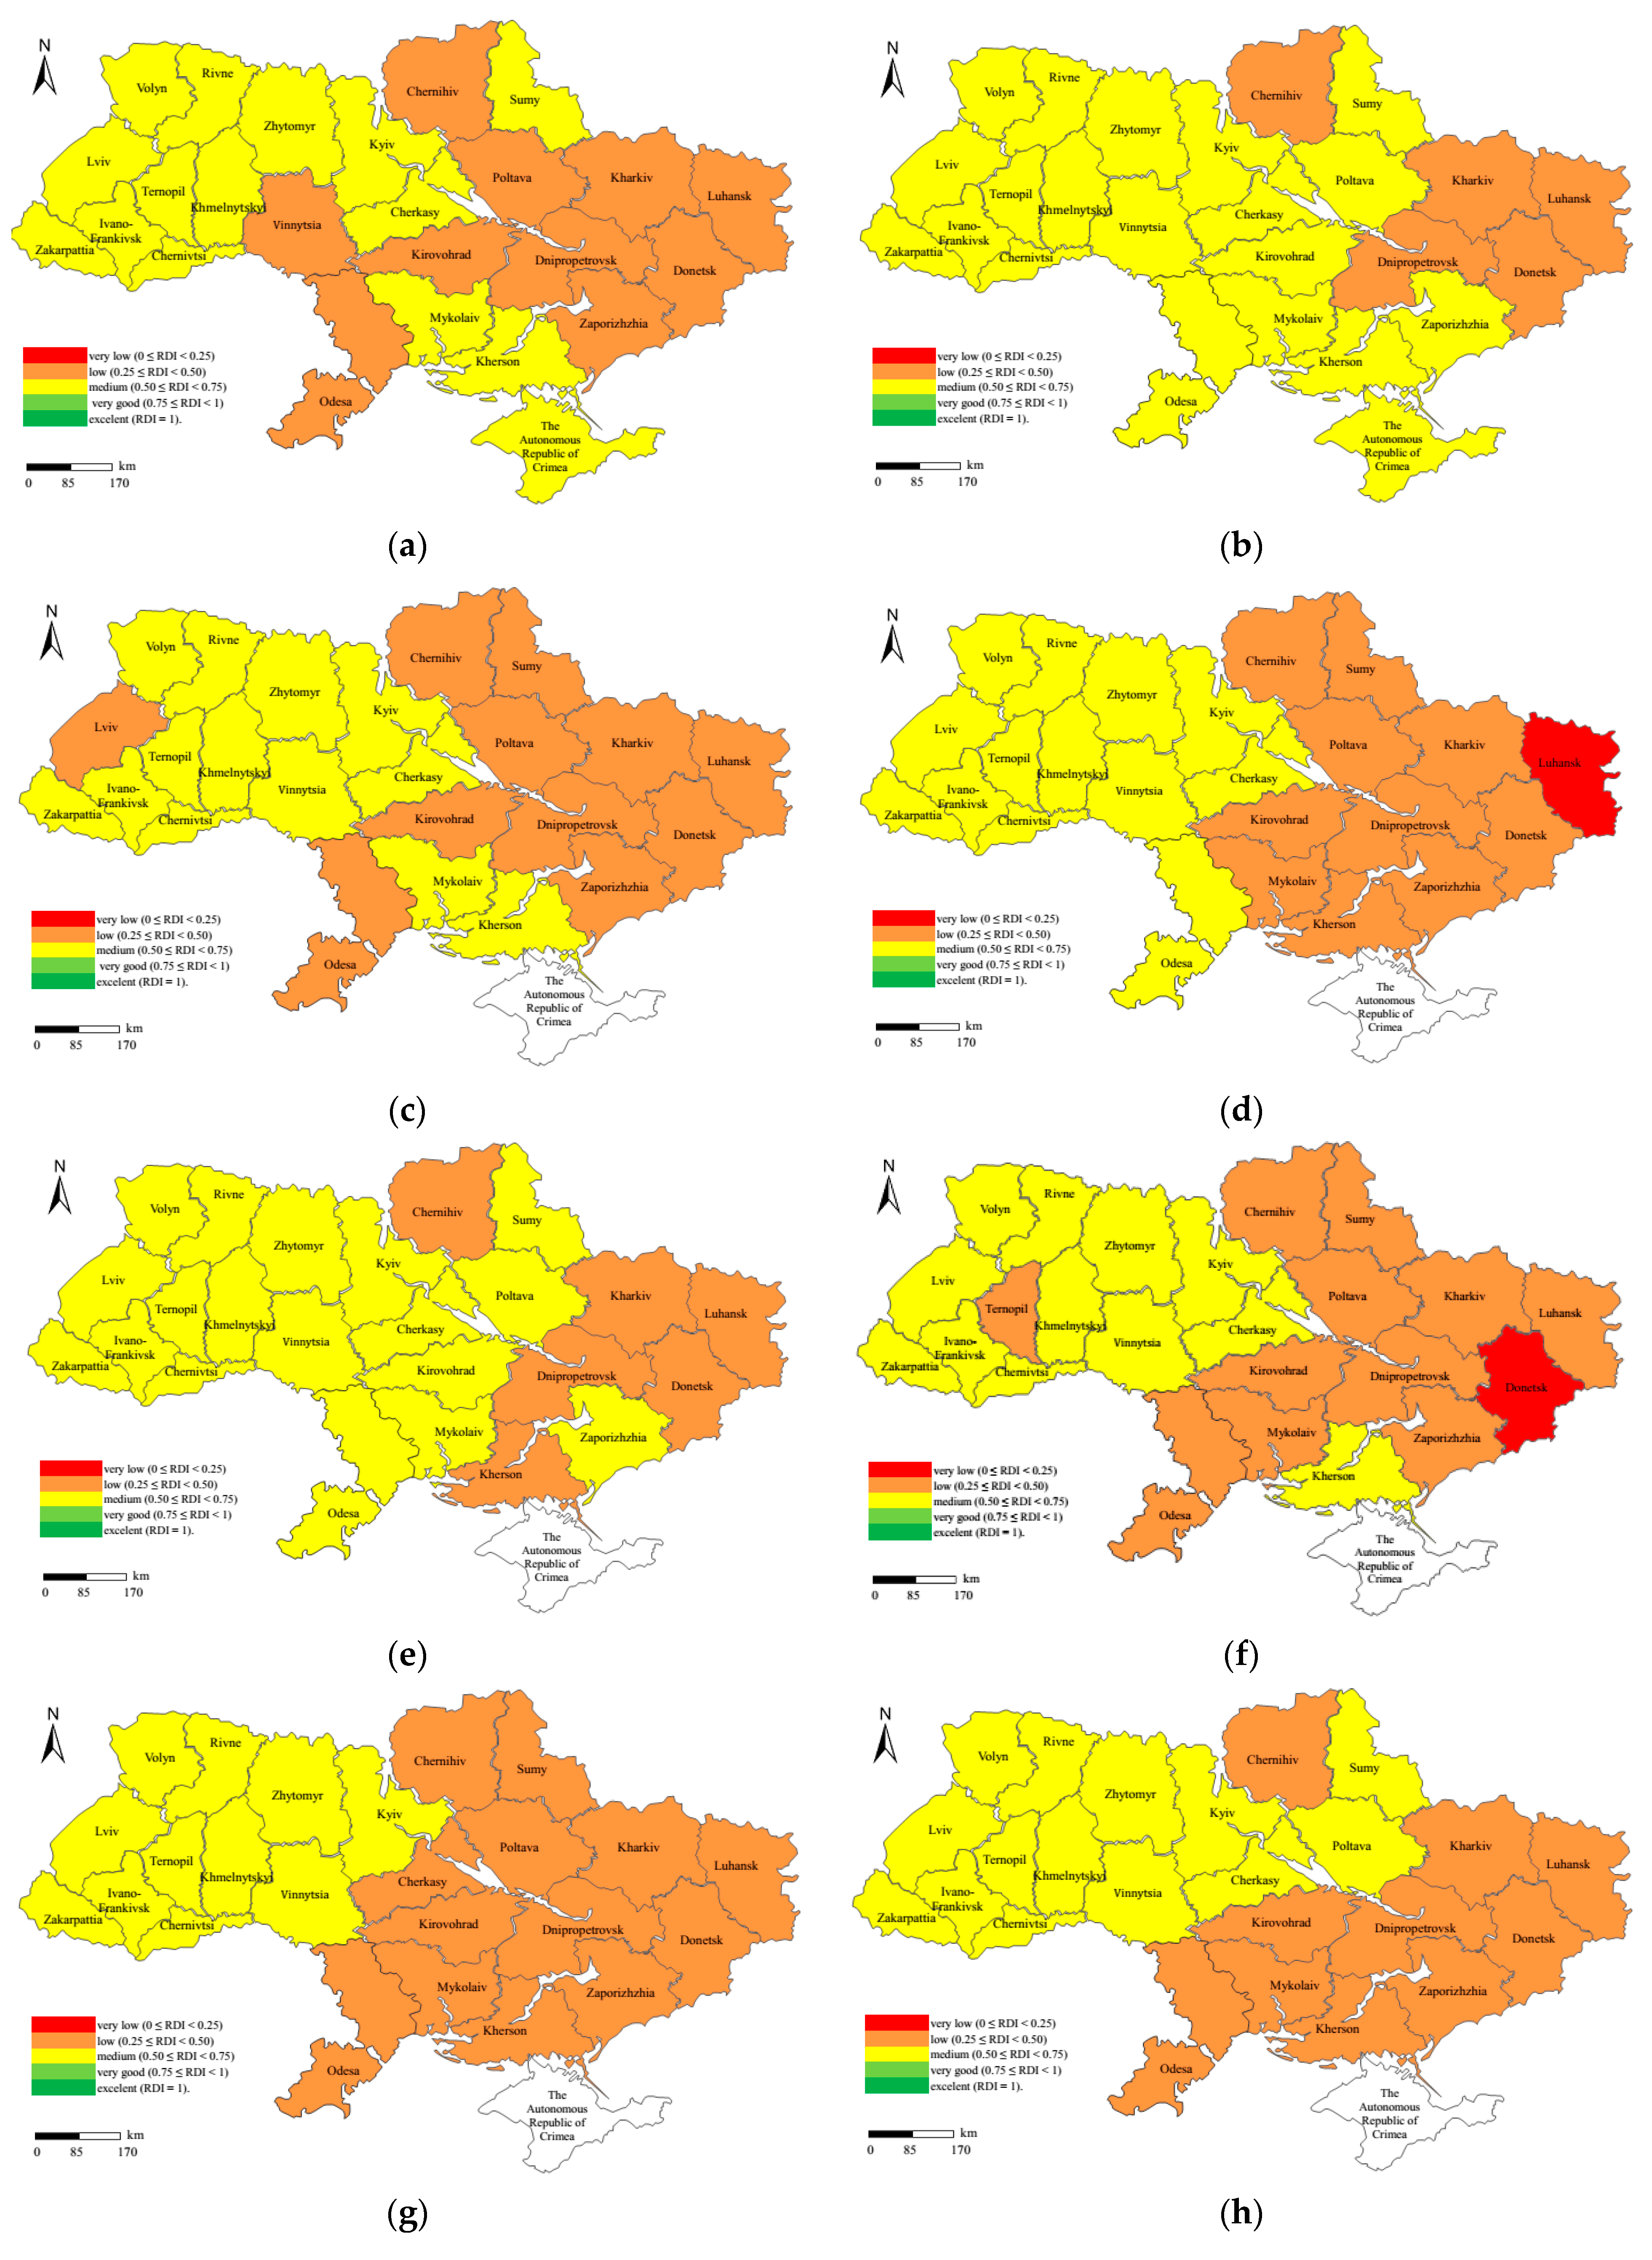
Table 3, Table 4, Table 5, Table 6 and Table 7 show the results obtained from the analysis of the components of the Rural Development Index (IRDecon, IRDsoc, IRDinfrast, IRDdemog, IRDemploy) for the regions of Ukraine.
The top five regions by economic component of Rural Development Index (IRDecon, Table 3) are the Dnipropetrovsk, Zaporizhzhia, Kyiv, Mykolaiv, Poltava regions. These regions have the highest indicators of gross regional product per capita (the Dnipropetrovsk region in 2012–2014 and the Poltava region in 2015–2020), regional budget revenues per capita (the Dnipropetrovsk region in 2015, the Kyiv region in 2017, 2019, 2020, and the Poltava region in 2016 and 2018), wages (the Donetsk region in 2012–2013 and 2019–2020, the Dnipropetrovsk region in 2014–2015, and the Kyiv region in 2016–2018). The regions that had very low values of the economic component of the Rural Development Index included the Zakarpattia, Ternopil, and Chernivtsi regions. The correlation coefficient IRDecon, according to the data of 2020 against 2014, indicates a slight change in the economic component of IRDecon = 0.9103, which shows that the Poltava, Vinnytsia, and Zakarpattia regions took advantage of decentralization and increased their economic potential.
Table 4 show the results obtained in the social component of the Rural Development Index (IRDsoc) analysis. The regions that provided high social living standards are the Zhytomyr, Volyn, Khmelnytskyi, Cherkasy, and Kyiv regions. During this period, there have been positive changes in ensuring social and regional development in the direction of reducing regional differences in the financing of social expenditures. It should be noted that the proportion of children in preschool educational institutions in rural areas has not changed, and was about 39%, which is 1.5 times less than the proportion of children in preschool educational institutions in cities [71].

Table 4.
Social component of the Rural Development Index (IRDsoc), [66,68,71,72] and our own calculation.
| Regions | The Period before Decentralization | The Period during Decentralization | Difference 2020 vs. 2014 | |||||||
|---|---|---|---|---|---|---|---|---|---|---|
| 2012 | 2013 | 2014 | 2015 | 2016 | 2017 | 2018 | 2019 | 2020 | ||
| The Autonomous Republic of Crimea | 0.32 | 0.36 | ||||||||
| Vinnytsia region | 0.36 | 0.55 | 0.54 | 0.57 | 0.63 | 0.65 | 0.48 | 0.75 | 0.67 | −0.02 |
| Volyn region | 0.72 | 0.72 | 0.72 | 0.71 | 0.68 | 0.67 | 0.53 | 0.79 | 0.69 | −0.09 |
| Dnipropetrovsk region | 0.26 | 0.38 | 0.35 | 0.40 | 0.39 | 0.41 | 0.30 | 0.44 | 0.42 | 0.05 |
| Donetsk region | 0.27 | 0.33 | 0.25 | 0.25 | 0.23 | 0.22 | 0.21 | 0.22 | 0.22 | −0.03 |
| Zhytomyr region | 0.77 | 0.78 | 0.77 | 0.76 | 0.81 | 0.78 | 0.77 | 0.81 | 0.75 | −0.06 |
| Zakarpattia region | 0.49 | 0.47 | 0.46 | 0.43 | 0.40 | 0.41 | 0.29 | 0.60 | 0.53 | −0.05 |
| Zaporizhzhia region | 0.46 | 0.42 | 0.40 | 0.43 | 0.31 | 0.27 | 0.23 | 0.49 | 0.46 | 0.03 |
| Ivano-Frankivsk region | 0.32 | 0.28 | 0.28 | 0.27 | 0.33 | 0.32 | 0.20 | 0.48 | 0.43 | 0.02 |
| Kyiv region | 0.67 | 0.60 | 0.60 | 0.68 | 0.73 | 0.76 | 0.65 | 0.81 | 0.81 | 0.13 |
| Kirovohrad region | 0.66 | 0.66 | 0.63 | 0.70 | 0.72 | 0.70 | 0.55 | 0.71 | 0.64 | −0.04 |
| Luhansk region | 0.22 | 0.21 | 0.03 | 0.03 | 0.02 | 0.02 | 0.02 | 0.02 | 0.02 | −0.02 |
| Lviv region | 0.33 | 0.32 | 0.33 | 0.33 | 0.36 | 0.39 | 0.26 | 0.50 | 0.45 | 0.02 |
| Mykolaiv region | 0.60 | 0.66 | 0.66 | 0.65 | 0.80 | 0.66 | 0.49 | 0.59 | 0.47 | −0.23 |
| Odesa region | 0.35 | 0.32 | 0.32 | 0.29 | 0.25 | 0.35 | 0.20 | 0.48 | 0.45 | 0.00 |
| Poltava region | 0.47 | 0.54 | 0.52 | 0.61 | 0.72 | 0.69 | 0.56 | 0.71 | 0.65 | 0.03 |
| Rivne region | 0.54 | 0.64 | 0.61 | 0.61 | 0.60 | 0.59 | 0.46 | 0.76 | 0.69 | −0.01 |
| Sumy region | 0.70 | 0.69 | 0.68 | 0.75 | 0.85 | 0.78 | 0.62 | 0.70 | 0.63 | −0.08 |
| Ternopil region | 0.54 | 0.51 | 0.52 | 0.52 | 0.62 | 0.62 | 0.44 | 0.77 | 0.71 | 0.03 |
| Kharkiv region | 0.31 | 0.32 | 0.32 | 0.31 | 0.36 | 0.42 | 0.33 | 0.45 | 0.41 | 0.03 |
| Kherson region | 0.65 | 0.63 | 0.63 | 0.60 | 0.60 | 0.61 | 0.49 | 0.71 | 0.62 | −0.09 |
| Khmelnytskyi region | 0.77 | 0.75 | 0.73 | 0.77 | 0.79 | 0.77 | 0.61 | 0.83 | 0.73 | −0.09 |
| Cherkasy region | 0.73 | 0.65 | 0.65 | 0.73 | 0.79 | 0.76 | 0.59 | 0.80 | 0.72 | −0.03 |
| Chernivtsi region | 0.48 | 0.43 | 0.43 | 0.38 | 0.40 | 0.44 | 0.30 | 0.58 | 0.51 | −0.05 |
| Chernihiv region | 0.63 | 0.62 | 0.64 | 0.69 | 0.73 | 0.75 | 0.61 | 0.76 | 0.69 | 0.02 |
Fiscal decentralization, in accordance with the set tasks and priorities, should contribute to the effective financing of social expenditures, but in the medium-term it failed to achieve a positive social effect in terms of education and healthcare of the rural population. The Kyiv, Poltava, and Kharkiv regions used the advantages of decentralization to improve the social development of the rural population. As shown by the experience of financial decentralization in Argentina, Spain, Italy, and Canada, the effect of the reform is moderate and mostly positive (in Argentina, budget decentralization helped reduce child mortality, while in Canada there was an improvement in public health [73].
The infrastructural component of rural development combines the roads and the provision of the rural population with accommodation. According to Table 5, the highest level of infrastructure was in the Volyn, Kyiv, Lviv, Ternopil, Chernivtsi, and Ivano-Frankivsk regions. Accordingly, the western regions have a high level of infrastructure (road coverage) than the southern regions, which have a low level of infrastructure. Fiscal decentralization provided for the transfer of rights to finance the construction and reconstruction of roads to the local government, as well as the creation of the State Road Fund [64]. Since 2015, this opportunity has primarily been used by the Vinnytsia (+20 km per 1000 km2), Volyn (+20 km per 1000 km2), Sumy (+20 km per 1000 km2), Chernihiv (+14 km per 1000 km2), Kharkiv (+10 km per 1000 km2), and Lviv (+9 km per 1000 km2) regions.
Table 5.
Infrastructural component of the Rural Development Index (IRDinfrast), [66,74] and our own calculation.
| Regions | The Period before Decentralization | The Period during Decentralization | Difference 2020 vs. 2014 | |||||||
|---|---|---|---|---|---|---|---|---|---|---|
| 2012 | 2013 | 2014 | 2015 | 2016 | 2017 | 2018 | 2019 | 2020 | ||
| The Autonomous Republic of Crimea | 0.43 | 0.16 | ||||||||
| Vinnytsia region | 0.46 | 0.87 | 0.44 | 0.40 | 0.72 | 0.46 | 0.53 | 0.59 | 0.85 | 0.45 |
| Volyn region | 0.49 | 0.77 | 0.50 | 0.58 | 0.77 | 0.60 | 0.79 | 0.47 | 0.82 | 0.48 |
| Dnipropetrovsk region | 0.33 | 0.76 | 0.31 | 0.28 | 0.57 | 0.27 | 0.39 | 0.42 | 0.68 | 0.40 |
| Donetsk region | 0.40 | 0.29 | 0.49 | 0.72 | −0.11 | |||||
| Zhytomyr region | 0.33 | 0.75 | 0.32 | 0.30 | 0.58 | 0.34 | 0.39 | 0.43 | 0.70 | 0.43 |
| Zakarpattia region | 0.42 | 0.71 | 0.38 | 0.31 | 0.55 | 0.38 | 0.50 | 0.41 | 0.69 | 0.43 |
| Zaporizhzhia region | 0.29 | 0.68 | 0.19 | 0.21 | 0.52 | 0.22 | 0.26 | 0.39 | 0.50 | 0.32 |
| Ivano-Frankivsk region | 0.54 | 0.82 | 0.60 | 0.34 | 0.80 | 0.50 | 0.64 | 0.40 | 0.78 | 0.39 |
| Kyiv region | 0.84 | 0.84 | 0.84 | 0.83 | 0.77 | 0.69 | 0.83 | 0.49 | 0.83 | 0.34 |
| Kirovohrad region | 0.21 | 0.68 | 0.18 | 0.21 | 0.47 | 0.20 | 0.18 | 0.35 | 0.53 | 0.35 |
| Luhansk region | 0.10 | 0.17 | 0.37 | 0.12 | 0.41 | 0.18 | 0.08 | 0.54 | 0.37 | 0.01 |
| Lviv region | 0.66 | 0.98 | 0.77 | 0.71 | 0.87 | 0.71 | 0.75 | 0.60 | 0.99 | 0.42 |
| Mykolaiv region | 0.15 | 0.55 | 0.07 | 0.08 | 0.37 | 0.09 | 0.08 | 0.21 | 0.47 | 0.42 |
| Odesa region | 0.31 | 0.67 | 0.20 | 0.45 | 0.54 | 0.49 | 0.34 | 0.35 | 0.62 | 0.45 |
| Poltava region | 0.38 | 0.81 | 0.37 | 0.33 | 0.61 | 0.34 | 0.39 | 0.41 | 0.30 | −0.03 |
| Rivne region | 0.38 | 0.69 | 0.39 | 0.39 | 0.61 | 0.43 | 0.47 | 0.45 | 0.64 | 0.39 |
| Sumy region | 0.41 | 0.75 | 0.29 | 0.32 | 0.58 | 0.28 | 0.35 | 0.47 | 0.72 | 0.46 |
| Ternopil region | 0.61 | 0.93 | 0.71 | 0.51 | 0.78 | 0.55 | 0.77 | 0.68 | 0.89 | 0.37 |
| Kharkiv region | 0.33 | 0.79 | 0.31 | 0.33 | 0.56 | 0.35 | 0.33 | 0.58 | 0.75 | 0.46 |
| Kherson region | 0.09 | 0.50 | 0.06 | 0.04 | 0.00 | 0.54 | 0.07 | 0.02 | 0.47 | 0.45 |
| Khmelnytskyi region | 0.49 | 0.90 | 0.48 | 0.43 | 0.71 | 0.45 | 0.52 | 0.59 | 0.93 | 0.50 |
| Cherkasy region | 0.39 | 0.75 | 0.29 | 0.29 | 0.57 | 0.34 | 0.46 | 0.40 | 0.66 | 0.40 |
| Chernivtsi region | 0.65 | 0.92 | 0.73 | 0.57 | 0.78 | 0.53 | 0.60 | 0.58 | 0.89 | 0.37 |
| Chernihiv region | 0.26 | 0.62 | 0.14 | 0.19 | 0.47 | 0.21 | 0.21 | 0.35 | 0.55 | 0.43 |
Table 6 shows the demographic component of rural development. We have substantiated the following two indicators of the demographic component of rural development: the share of rural population in the region and the rate of the available rural population growth (decrease). The first indicator (xdemog1) shows the possibility of identifying the following two groups of regions: regions with a predominantly rural population (the Zakarpattia, Ivano-Frankivsk, Rivne, Chernivtsi, and Ternopil regions), a high share of rural population (over 40%, as in the Vinnytsia, Volyn, Zhytomyr, Khmelnytskyi, and Cherkasy regions), and regions with a low share of rural population (the Dnipropetrovsk, Zaporizhzhia, Kyiv, Kirovohrad, Luhansk, Lviv, Mykolaiv, Odesa, Poltava, Sumy, Kharkiv, Kherson, and Chernihiv regions).
Table 6.
Demographic component of the Rural Development Index (IRDdemog), [66,75,76] and our own calculation.
| Regions | The Period before Decentralization | The Period during Decentralization | Difference 2020 vs. 2014 | |||||||
|---|---|---|---|---|---|---|---|---|---|---|
| 2012 | 2013 | 2014 | 2015 | 2016 | 2017 | 2018 | 2019 | 2020 | ||
| The Autonomous Republic of Crimea | 0.73 | 0.76 | ||||||||
| Vinnytsia region | 0.61 | 0.62 | 0.61 | 0.58 | 0.46 | 0.41 | 0.47 | 0.46 | 0.47 | −0.15 |
| Volyn region | 0.75 | 0.77 | 0.77 | 0.75 | 0.70 | 0.61 | 0.66 | 0.66 | 0.70 | −0.09 |
| Dnipropetrovsk region | 0.36 | 0.36 | 0.28 | 0.27 | 0.23 | 0.13 | 0.09 | 0.18 | 0.19 | −0.16 |
| Donetsk region | 0.20 | 0.18 | 0.20 | 0.06 | 0.18 | 0.10 | 0.15 | 0.16 | 0.16 | −0.04 |
| Zhytomyr region | 0.55 | 0.53 | 0.52 | 0.50 | 0.46 | 0.39 | 0.43 | 0.44 | 0.44 | −0.12 |
| Zakarpattia region | 1.00 | 1.00 | 1.00 | 0.93 | 0.94 | 0.78 | 0.81 | 0.82 | 0.84 | −0.16 |
| Zaporizhzhia region | 0.41 | 0.43 | 0.34 | 0.29 | 0.25 | 0.16 | 0.21 | 0.27 | 0.27 | −0.13 |
| Ivano-Frankivsk region | 0.87 | 0.86 | 0.83 | 0.80 | 0.72 | 0.64 | 0.67 | 0.70 | 0.72 | −0.12 |
| Kyiv region | 0.60 | 0.65 | 0.63 | 0.67 | 0.73 | 0.73 | 0.73 | 0.77 | 0.77 | 0.11 |
| Kirovohrad region | 0.42 | 0.43 | 0.42 | 0.40 | 0.41 | 0.27 | 0.31 | 0.32 | 0.34 | −0.11 |
| Luhansk region | 0.21 | 0.24 | 0.20 | 0.23 | −0.08 | |||||
| Lviv region | 0.68 | 0.68 | 0.64 | 0.64 | 0.65 | 0.50 | 0.55 | 0.55 | 0.56 | −0.11 |
| Mykolaiv region | 0.49 | 0.50 | 0.43 | 0.36 | 0.31 | 0.35 | 0.30 | 0.34 | 0.39 | −0.09 |
| Odesa region | 0.64 | 0.66 | 0.64 | 0.60 | 0.51 | 0.42 | 0.46 | 0.50 | 0.54 | −0.13 |
| Poltava region | 0.47 | 0.46 | 0.45 | 0.42 | 0.34 | 0.33 | 0.34 | 0.41 | 0.43 | −0.06 |
| Rivne region | 0.90 | 0.90 | 0.89 | 0.89 | 0.86 | 0.66 | 0.69 | 0.70 | 0.74 | −0.16 |
| Sumy region | 0.32 | 0.28 | 0.25 | 0.25 | 0.23 | 0.20 | 0.19 | 0.24 | 0.25 | −0.05 |
| Ternopil region | 0.74 | 0.74 | 0.72 | 0.71 | 0.60 | 0.54 | 0.55 | 0.59 | 0.62 | −0.11 |
| Kharkiv region | 0.31 | 0.36 | 0.31 | 0.27 | 0.24 | 0.07 | 0.15 | 0.24 | 0.23 | −0.14 |
| Kherson region | 0.59 | 0.60 | 0.58 | 0.54 | 0.47 | 0.38 | 0.42 | 0.46 | 0.47 | −0.14 |
| Khmelnytskyi region | 0.50 | 0.50 | 0.49 | 0.47 | 0.42 | 0.36 | 0.38 | 0.42 | 0.45 | −0.07 |
| Cherkasy region | 0.55 | 0.53 | 0.50 | 0.51 | 0.33 | 0.60 | 0.39 | 0.41 | 0.42 | −0.11 |
| Chernivtsi region | 0.85 | 0.85 | 0.85 | 0.79 | 0.78 | 0.70 | 0.71 | 0.74 | 0.75 | −0.11 |
| Chernihiv region | 0.25 | 0.25 | 0.21 | 0.20 | 0.20 | 0.20 | 0.20 | 0.24 | 0.24 | −0.01 |
The second indicator, which is the rate of the available rural population growth (decrease) (xdemog2), shows the direction and intensity in the rural population change. The rural population increased in The Autonomous Republic of Crimea (2012 and 2013), as well as in the Zakarpattia region (2012–2014 and 2016), the Kyiv region (2015–2020), the Lviv region (2016), the Odesa region (2014), the Rivne region (2012–2016), and the Cherkasy region (2017).
The employment component of the Rural Development (Table 7) is formed on the basis of the rural employment rate. The rural employment rate was high (over 60%) at the beginning of decentralization in the Kherson, Rivne, Sumy, Chernihiv, and Mykolaiv regions, while during the implementation of decentralization a high rate was maintained only in the Sumy, Kherson, and Chernivtsi regions.
Table 7.
Employment component of the Rural Development Index (IRDemploy), [68,70] and our own calculation.
| Regions | The Period before Decentralization | The Period during Decentralization | Difference 2020 vs. 2014 | |||||||
|---|---|---|---|---|---|---|---|---|---|---|
| 2012 | 2013 | 2014 | 2015 | 2016 | 2017 | 2018 | 2019 | 2020 | ||
| The Autonomous Republic of Crimea | 0.89 | 0.84 | ||||||||
| Vinnytsia region | 0.51 | 0.74 | 0.50 | 0.43 | 0.52 | 0.47 | 0.48 | 0.24 | 0.57 | 0.06 |
| Volyn region | 0.77 | 0.54 | 0.51 | 0.28 | 0.30 | 0.22 | 0.08 | 0.30 | 0.38 | −0.16 |
| Dnipropetrovsk region | 0.14 | 0.11 | 0.18 | 0.60 | 0.46 | 0.32 | 0.38 | 0.33 | 0.44 | 0.22 |
| Donetsk region | 0.58 | 0.31 | 0.30 | 0.10 | 0.16 | 0.12 | 0.10 | 0.28 | 0.32 | 0.02 |
| Zhytomyr region | 0.82 | 0.78 | 0.51 | 0.61 | 0.69 | 0.68 | 0.62 | 0.79 | 0.73 | 0.20 |
| Zakarpattia region | 0.50 | 0.50 | 0.58 | 0.75 | 0.70 | 0.67 | 0.64 | 0.59 | 0.60 | −0.02 |
| Zaporizhzhia region | 0.39 | 0.69 | 0.55 | 0.56 | 0.73 | 0.37 | 0.46 | 0.48 | 0.49 | −0.09 |
| Ivano-Frankivsk region | 0.60 | 0.50 | 0.67 | 0.47 | 0.59 | 0.57 | 0.62 | 0.55 | 0.56 | −0.14 |
| Kyiv region | 0.32 | 0.43 | 0.31 | 0.65 | 0.56 | 0.29 | 0.38 | 0.52 | 0.55 | 0.19 |
| Kirovohrad region | 0.49 | 0.35 | 0.04 | 0.43 | 0.49 | 0.20 | 0.13 | 0.45 | 0.31 | 0.23 |
| Luhansk region | 0.78 | 0.70 | 0.52 | 0.30 | 0.83 | 0.79 | 0.67 | 0.80 | 0.88 | 0.36 |
| Lviv region | 0.63 | 0.30 | 0.25 | 0.21 | 0.42 | 0.33 | 0.37 | 0.55 | 0.51 | 0.22 |
| Mykolaiv region | 0.73 | 0.74 | 0.68 | 0.77 | 0.77 | 0.49 | 0.61 | 0.53 | 0.65 | −0.04 |
| Odesa region | 0.73 | 0.73 | 0.48 | 0.71 | 0.76 | 0.53 | 0.71 | 0.52 | 0.56 | 0.06 |
| Poltava region | 0.20 | 0.18 | 0.21 | 0.14 | 0.26 | 0.27 | 0.13 | 0.40 | 0.32 | 0.08 |
| Rivne region | 0.93 | 0.88 | 0.86 | 0.87 | 0.85 | 0.62 | 0.71 | 0.70 | 0.75 | −0.11 |
| Sumy region | 0.87 | 0.89 | 0.76 | 0.42 | 0.73 | 0.63 | 0.92 | 0.72 | 0.74 | −0.02 |
| Ternopil region | 0.57 | 0.64 | 0.40 | 0.40 | 0.25 | 0.17 | 0.35 | 0.55 | 0.33 | −0.12 |
| Kharkiv region | 0.73 | 0.61 | 0.38 | 0.51 | 0.37 | 0.56 | 0.39 | 0.29 | 0.29 | −0.13 |
| Kherson region | 1.00 | 0.97 | 0.90 | 0.64 | 0.89 | 0.86 | 0.71 | 0.75 | 0.74 | −0.16 |
| Khmelnytskyi region | 0.73 | 0.59 | 0.43 | 0.45 | 0.47 | 0.53 | 0.54 | 0.55 | 0.60 | 0.13 |
| Cherkasy region | 0.72 | 0.68 | 0.64 | 0.46 | 0.54 | 0.25 | 0.30 | 0.50 | 0.42 | −0.24 |
| Chernivtsi region | 0.77 | 0.89 | 0.62 | 0.68 | 1.00 | 0.75 | 0.75 | 0.91 | 0.89 | 0.25 |
| Chernihiv region | 0.85 | 0.70 | 0.68 | 0.35 | 0.60 | 0.51 | 0.47 | 0.47 | 0.47 | −0.22 |
A confirmation of employment problems in rural areas is the longer job search period than in cities. The positive effect of decentralization should help reduce the duration of job searches. This effect of decentralization has been proven in the Dnipropetrovsk, Odesa, and Sumy regions. In these regions, the job search period is reduced by two months. In the Zhytomyr, Zakarpattia, and Kirovohrad regions, the job search period is reduced by one month.
Table 8 shows the statistical characteristics of the Rural Development Index, which indicate the presence of fluctuations and contradictions in rural development in the regions of Ukraine.
First, the average and median of the Rural Development Index during the decentralization period increased in 2014–2016 and decreased in the following two years, which indicates that most regions in 2016 were at the medium level (0.50 ≤ IRD <0.75), while in 2017–2018 they were at the low level (0.25 ≤ IRD < 0.50) In 2019–2020, they were at the medium level (0.50 ≤ IRD < 0.75).
4. Discussion
The ambiguity of decentralization for the development of rural areas in Ukraine relates to positive and negative consequences. The implementation of fiscal decentralization has resulted in the greater interest of local governments in increasing revenues to local budgets by transferring the right to receive more tax revenues and non-tax revenues, finding contingency local budgets, and improving the efficiency of tax administration and fees [23]. The positive consequences of decentralization for the development of rural areas in Ukraine include the activation of self-governance to ensure the sustainable development of rural areas [77,78], an increase in the effectiveness of budgetary funds use [79,80,81,82], improvement of horizontal alignment [83], and the transition of land and other natural resources to communal ownership, ensuring their efficient exploitation [84].
The unsolved problems and potential risks for the development of rural areas are the strengthening of the uneven development of rural areas, including local communities; increasing risks of making incorrect management decisions regarding the activities of the rural community due to inadequate qualifications of officials; the growth of corruption at the local level through the expansion of the powers of local governments; unwillingness of the richer, already established communities to associate with poorer territorial communities; loss of state control [56].
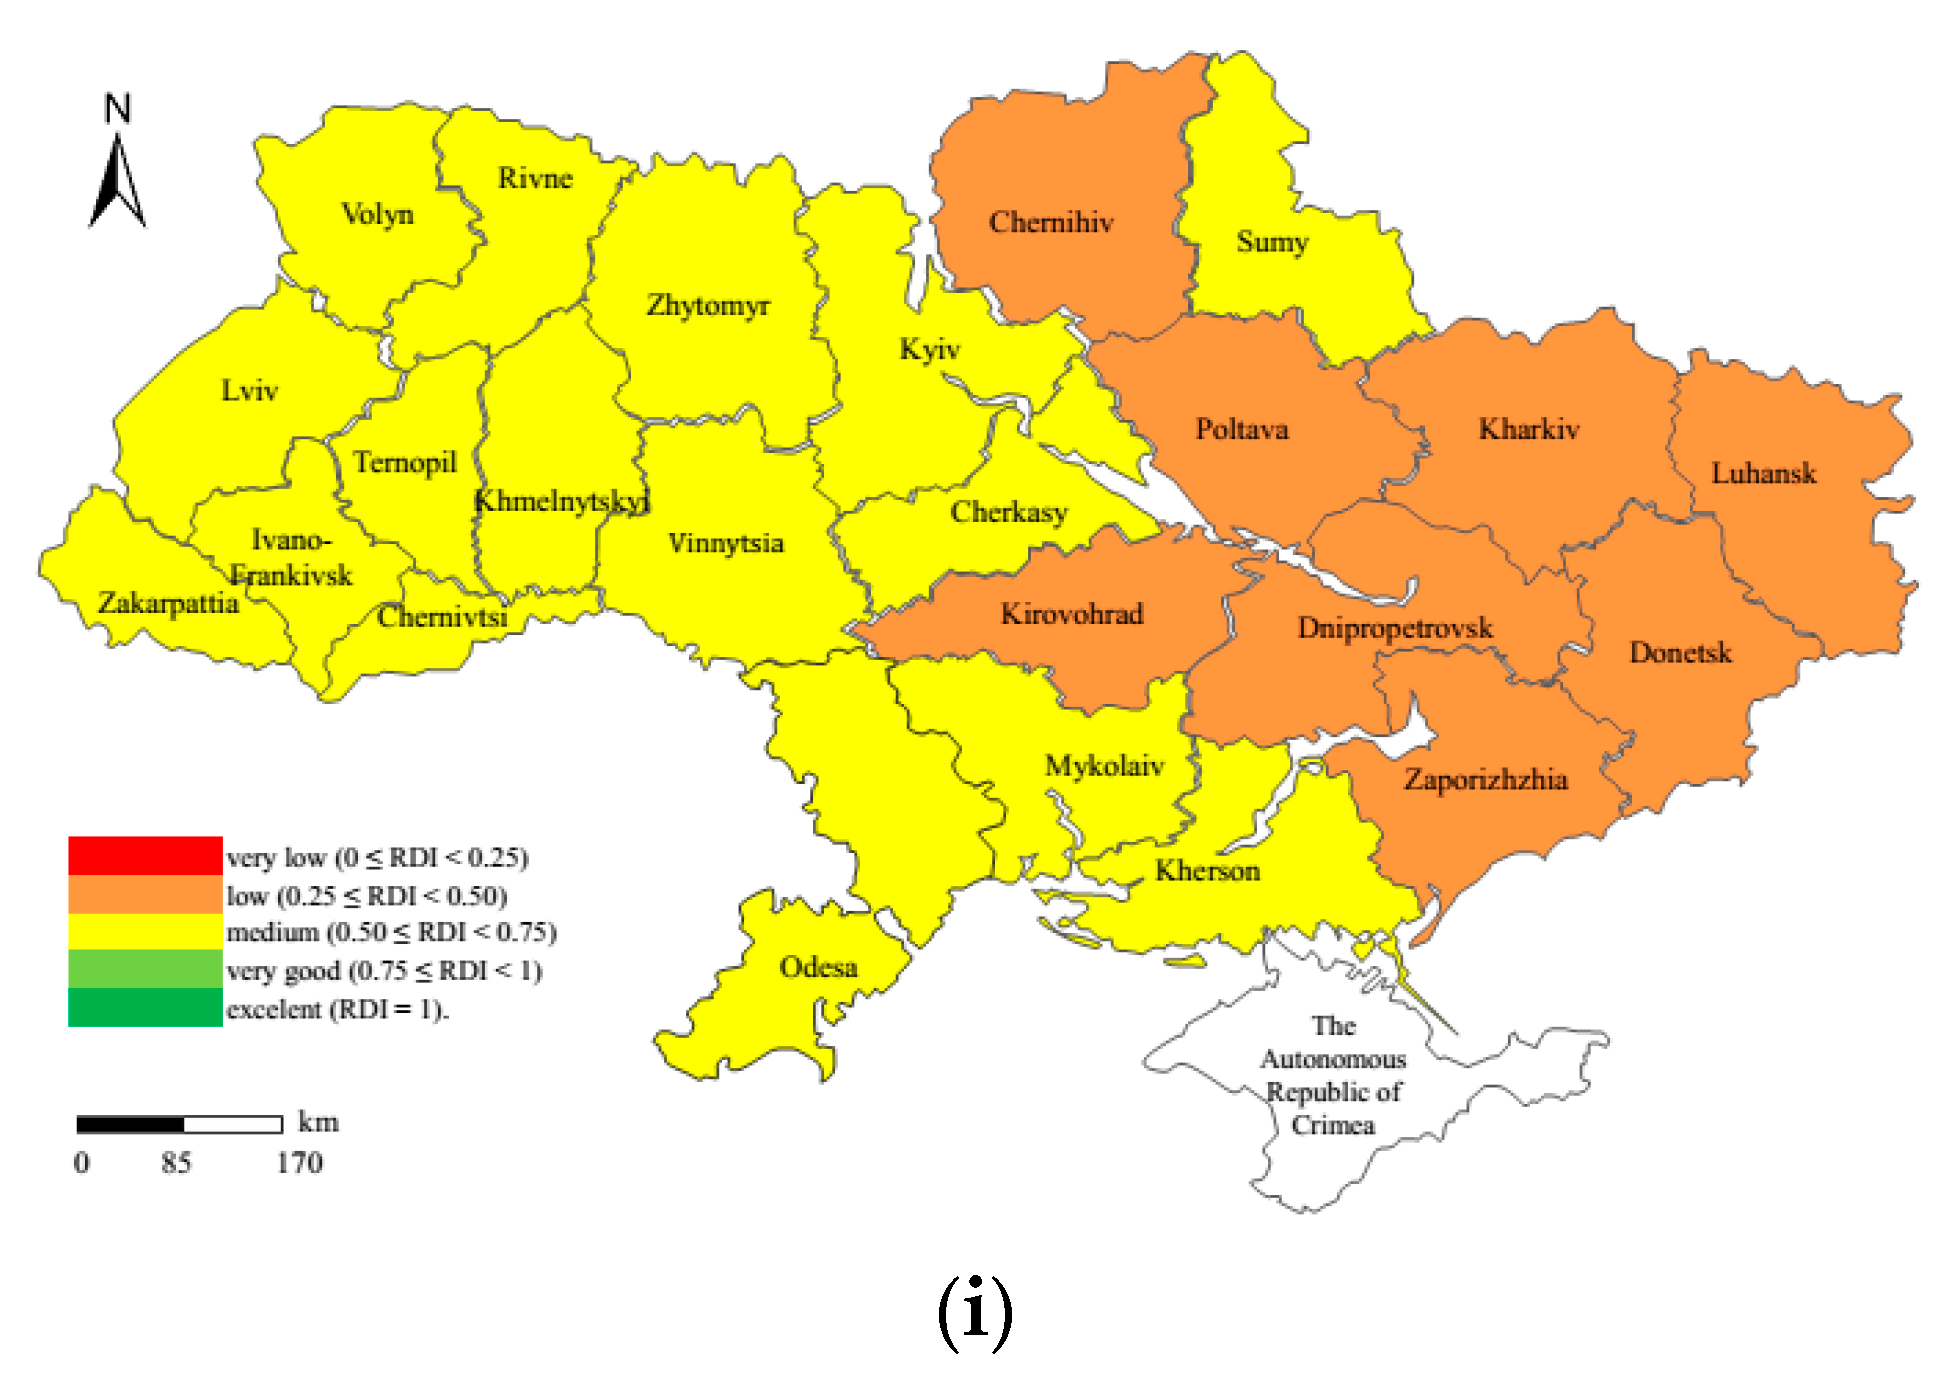
Most regions of Ukraine took advantage of decentralization opportunities and maintained a medium level of rural development. It should be noted, first of all, that the Lviv region, Odesa region, and Sumy region improved the level of the rural development and reached the medium level (Figure 5). Secondly, the average, median, maximum, and minimum of the Rural Development Index have some single common dynamics, which is described by an increased level of indicators in 2016 and a decreased level in 2017–2018. In 2019–2020 there was an increase of the average, median, maximum, and minimum of the Rural Development Index. This trend can be explained by the rapid increase of indicators in some regions.
Third, the development of rural regions of Ukraine took place under a low level of inequality of socio-economic development, which is confirmed by the value of standard deviation and variation coefficient of the Rural Development Index (Table 8). In 2016, the standard deviation and variation coefficient acquired the minimum value for the years studied, and was increasing in 2017–2018, but this does not pose a threat to the implementation of decentralization measures.
Finally, we believe that, according to the empirical analysis data, it is possible to determine the reserves for improving rural development by regions that are as close as possible to a very good level, as follows:
- The Kyiv region—increasing social expenditures from the regional budget; ensuring access to health care facilities;
- The Rivne region—increasing gross regional product per capita; social expenditures from the regional budget; wages, provision of preschool education; ensuring access to health care facilities;
- The Zhytomyr region—increasing gross regional product per capita; wages, provision of accommodation in rural areas, slowing down the rate of rural population decrease,
- The Ivano-Frankivsk region—increasing gross regional product per capita; increasing regional budget revenues; social expenditures from the regional budget; wages and rural employment rate, provision of preschool education; ensuring access to health care facilities; slowing down the rate of rural population decrease;
- The Volyn region—increasing gross regional product per capita; wages and rural employment rate, provision of preschool education; slowing down the rate of rural population decrease;
- The Chernihiv region—increasing gross regional product per capita; increasing regional budget revenues; social expenditures from the regional budget; wages, access to health care facilities; provision of accommodation in rural areas;
- The Chernivtsi region—increasing gross regional product per capita; increasing regional budget revenues; social expenditures from the regional budget; wages, access to health care facilities; provision of accommodation in rural areas, slowing down the rate of rural population decrease.
- Third, the maximum of the Rural Development Index did not change in 2018 and was equal to the level of 2014, which corresponds to the medium level. None of the regions of Ukraine meets high standards of rural development (very good level or excellent level) by all components of rural development.
- The Lviv region—increasing gross regional product per capita; increasing regional budget revenues; social expenditures from the regional budget; provision of preschool education; ensuring access to health care facilities;
- The Sumy region—increasing gross regional product per capita; social expenditures from the regional budget; wages, provision of accommodation in rural areas, slowing down the rate of rural population decrease,
- The Ternopil region—increasing gross regional product per capita; increasing regional budget revenues; social expenditures from the regional budget; wages and rural employment rate, provision of preschool education; slowing down the rate of rural population decrease.
5. Conclusions
The development of rural areas of Ukraine is crucial for the development of the state and regions, as well as for the population, since about a third of the population of Ukraine lives in rural areas. Modern development of rural areas in Ukraine is specified by the implementation of decentralization measures, including the creation of appropriate material, financial, and organizational conditions to ensure that the local governments will exercise their own and delegated powers, the introduction of a mechanism of state control over the decisions of local governments and the quality of public services, and the maximum involvement of the population in managerial decisions.
In this paper, we conducted an empirical study of rural development in Ukraine, based on the authors’ Rural Development Index on the basis of 14 indicators that allow for a comprehensive identification of rural development. The excellence of the authors’ Rural Development Index is in the consistency, independence, and uniqueness of coefficients, and in its adaptability to statistical information of the State Committee of Statistics in Ukraine. At the same time, the adaptability to statistical data of the State Committee of Statistics in Ukraine limits its application in other countries with restricted informational compliance and public awareness. The conducted empirical study allows us to conclude that the first result of decentralization in 2015–2020 is a slowdown in the rate of rural population decrease, the rate of the existing rural population decrease, and the level of rural employment. Second, our study shows that rural development targets have not been met, and our simulation shows that there are no prospects for achieving them in the near future.
Third, a positive result of decentralization is the increase in the level of rural development in terms of ensuring a low level of inequality in rural development by region.
Thus, our analysis contributes to a better understanding of the advantages and disadvantages of decentralization in Ukraine to ensure the development of rural areas and possible ways to improve rural development based on a retrospective analysis.
The perspective for future investigation is the justification for the instruments and measures of rural development according to the transformation of financial support for rural areas.
Author Contributions
Conceptualization, N.D., N.W., S.B. and M.W.; methodology, N.D. and M.W.; writing—review and editing, N.D., N.W., S.B. and M.W.; visualization, S.B.; supervision, N.W.; project administration, N.W. All authors have read and agreed to the published version of the manuscript.
Funding
This research received no external funding and was funded by the Warsaw University of Life Sciences in Warsaw—SGGW and Jan Kochanowski University in Kielce, statutory researches.
Institutional Review Board Statement
Not applicable.
Informed Consent Statement
Not applicable.
Data Availability Statement
Data is contained within the article.
Conflicts of Interest
The authors declare no conflict of interest.
Appendix A
Table A1.
Significance of individual RD domains.
| RD Domain | Relative Weight | Partial Variables | |
|---|---|---|---|
| Highest Weight (+) | Lowest Weight (−) | ||
| Slovakia | |||
| Environmental | 1 | Municipal waste in tonnes per capita; % of households by consumption of drinking water; % parks in communal verdure | % of permanent pastures in agricultural land; public sewage system availability |
| Infrastructural | 0.88 | % of residential telephone lines; local communication lines per km2 | Telephone lines per capita; cable TV per capita |
| Economic | 0.83 | % enterprises of total legal entities; % real estate, lease and commercial activities of total number of business entities | % non-profit organisations of total legal entities; % agriculture, hunting and fishing of total legal entities; % cooperatives of total legal entities |
| Demographic | 0.49 | % working age population; population growth | Mortality rate under 1 year per 1000 live births; mortality rate under 28 days per 1000 live births |
| Social | 0.31 | Sport stadiums per km2; swimming pools per km2 | % unemployed women of total unemployed persons; primary schools per capita |
| Administrative | −0.39 | Post offices per km2; central government authorities per capita | % urban territory of municipality area; % public administration, defence, etc. of total subjects |
| Poland | |||
| Demographic | 1 | % females aged 30–39 of total population: actual Irving population aged 30–39 of total population | % males of working-age population; % over working-age persons of total population: |
| Social | 0.56 | New residential buildings (usable floor space of dwelling units per km2); new single-family residential buildings | Library collection in volumes per 1000 population: registered unemployed by age (25–34 years) of total unemployed: Registered unemployed of total population |
| Infrastructural | 0.55 | Gas consumption from gas-line system: electricity consumption per capita: % local (gmina) utility and environmental expenditures of total expenditures | % wages in local (gmina) expenditures; % public entities in utility expenditures; length of water supply system per capita |
| Economic | 0.53 | % group 3 taxpayers (the highest income group) of total taxpayers: % private sector in service sector | % group 1 taxpayers (the lowest income group) of total taxpayers: % public sector in service sector |
| Environmental | 0.28 | Natural monuments (natural attractions) per km2; generated sediment in tons of dry mass per km2 | % biological treatment plants of total municipal facilities; total number of treatment plants per 1000 population |
| Administrative | 0.07 | % councillors with tertiary education level; % councillors aged 25–29 of total councillors | Local self-government bodies per 1000 population: organisational units controlled by powiat government |
Appendix B
Table A2.
Evaluation index system of rural development level.
| Systems | Indicators | Weight |
|---|---|---|
| Rural Settlement (0.271) | Permanent population (person) | 0.320 |
| Population density (person/m2) | 0.132 | |
| Building area (m2) | 0.381 | |
| Distance between administrative village and new urban district government (km) | 0.147 | |
| Rural land (0.220) | Distance between administrative village and central city government (km) | 0.12 |
| Proportion of cultivated land area (%) | 0.264 | |
| Cultivated land area per capita (m2/person) | 0.236 | |
| Proportion of construction land area (%) | 0.245 | |
| Proportion of garden area (%) | 0.255 | |
| Rural industry (0.253) | Total number of primary industry enterprises | 0.165 |
| Total registered capital of primary industry enterprises (100 million yuan) | 0.136 | |
| Total number of secondary industry enterprises | 0.134 | |
| Total registered capital of secondary industry enterprises (100 million yuan) | 0.179 | |
| Total number of tertiary industry enterprises | 0.154 | |
| Total registered capital of tertiary industry enterprises (100 million yuan) | 0.232 | |
| Rural human settlement environment (0.256) | Proportion of forest and grass area (%) | 0.107 |
| Proportion of water area (%) | 0.103 | |
| Road density (m/km2) | 0.117 | |
| Number of hospitals (health centers) | 0.109 | |
| Number of social welfare facilities | 0.188 | |
| Number of cultural and leisure facilities | 0.190 | |
| Ratio of teachers to students in primary and secondary schools (%) | 0.091 | |
| Number of commercial service facilities, outlets | 0.095 |
References
- European Commission. Empowering Local Authorities in Partner Countries for Enhanced Governance and More Effective Development Outcomes. Available online: https://ec.europa.eu/europeaid/sites/devco/files/communication-local-authorities-in-partner-countries-com2013280-20130515_en_4.pdf (accessed on 11 March 2022).
- European Union. Supporting Decentralisation, Local Governance and Local Development through a Territorial Approach. Available online: https://op.europa.eu/en/publication-detail/-/publication/030cde3f-c109-11e6-a6db-01aa75ed71a1 (accessed on 1 March 2022).
- Bojanic, A.N. The Impact of Fiscal Decentralization on Accountability, Economic Freedom, and Political and Civil Liberties in the Americas. Economies 2018, 6, 8. [Google Scholar] [CrossRef] [Green Version]
- Zhu, Y.; Zhou, X.; Li, J.; Wang, F. Technological Innovation, Fiscal Decentralization, Green Development Efficiency: Based on Spatial Effect and Moderating Effect. Sustainability 2022, 14, 4316. [Google Scholar] [CrossRef]
- Zhou, C.; Zhang, X. Measuring the Efficiency of Fiscal Policies for Environmental Pollution Control and the Spatial Effect of Fiscal Decentralization in China. Int. J. Environ. Res. Public Health 2020, 17, 8974. [Google Scholar] [CrossRef] [PubMed]
- Guo, S.; Wen, L.; Wu, Y.; Yue, X.; Fan, G. Fiscal Decentralization and Local Environmental Pollution in China. Int. J. Environ. Res. Public Health 2020, 17, 8661. [Google Scholar] [CrossRef]
- Chen, X.; Liu, J. Fiscal Decentralization and Environmental Pollution: A Spatial Analysis. Discret. Dyn. Nat. Soc. 2020, 2020, 9254150. [Google Scholar] [CrossRef] [Green Version]
- Bojanic, A.N. The Impact of Fiscal Decentralization on Growth, Inflation, and Inequality in the Americas. Cepal. Rev. 2018, 124, 57–77. [Google Scholar] [CrossRef] [Green Version]
- Baskaran, T.; Feld, T.P. Fiscal Decentralization and Economic Growth in OECD Countries: Is there a Relationship. Public Financ. Rev. 2012, 41, 421–445. [Google Scholar] [CrossRef]
- Davoodi, H.; Zou, H. Fiscal decentralization and economic growth: A cross-country study. J. Urban Econ. 1998, 43, 244–257. [Google Scholar] [CrossRef]
- Digdowiseiso, K. Is Fiscal Decentralization Growth Enhancing? A Cross-Country Study in Developing Countries over the Period 1990–2014. Economies 2022, 10, 62. [Google Scholar] [CrossRef]
- Filippetti, A.; Agnese, S. Decentralization and economic growth reconsidered: The role of regional authority. Environ. Plan. C Gov. Policy 2016, 34, 1793–1824. [Google Scholar] [CrossRef]
- Gemmel, N.; Kneller, R.; Sanz, I. Fiscal Decentralization and Economic Growth: Spending versus Revenue Decentralization. Econ. Inq. 2013, 51, 1915–1931. [Google Scholar] [CrossRef]
- Iimi, A. Decentralization and economic growth revisited: An empirical note. J. Urban Econ. 2005, 57, 449–461. [Google Scholar] [CrossRef]
- Altunbas, Y.; Thornton, J. Fiscal Decentralization and Governance. Public Financ. Rev. 2012, 40, 66–85. [Google Scholar] [CrossRef] [Green Version]
- Fisman, R.; Gatti, R. Decentralization and corruption: Evidence across countries. J. Public Econ. 2002, 83, 325–345. [Google Scholar] [CrossRef] [Green Version]
- Kyriacou, A.P.; Roca-Sagalés, O. Fiscal and political decentralization and government quality. Environ. Plan. C Gov. Policy 2011, 29, 204–223. [Google Scholar] [CrossRef]
- Huynh, C.M.; Tran, H.N. Moderating effects of corruption and informality on the fiscal decentralization-economic growth nexus: Insights from OECD countries. Ann. Public Coop. Econ. 2021, 92, 355–373. [Google Scholar] [CrossRef]
- Ezcurra, R.; Pascual, P. Fiscal decentralization and regional disparities: Evidence from several European Union countries. Environ. Plan. A Econ. Space 2008, 40, 1185–1201. [Google Scholar] [CrossRef]
- Lessmann, C. Fiscal decentralization and regional disparity: Evidence from cross-section and panel data. Environ. Plan. A Econ. Space 2009, 41, 2455–2473. [Google Scholar] [CrossRef] [Green Version]
- Rodríguez-Pose, A.; Ezcurra, R. Does decentralization matter for regional disparities? A cross-country analysis. J. Econ. Geogr. 2010, 10, 619–644. [Google Scholar]
- Olar, A.; Jitea, M.I. Counterbalancing the Development Territorial Disparities in the Implementation of the CommunityLed Local Development EU Approach in Romania. Land 2021, 10, 970. [Google Scholar] [CrossRef]
- Davydenko, N.; Boiko, S.; Buriak, A.; Demianenko, I. Development of rural areas through fiscal decentralization. In Proceedings of the 2021 International Conference “Economic science for rural development”, Jelgava, Latvia, 11–14 May 2021; pp. 102–114. [Google Scholar] [CrossRef]
- Faguet, J.P.; Sanchez, F. Decentralization and access to social services in Colombia. Public Choice 2014, 160, 227–249. [Google Scholar] [CrossRef] [Green Version]
- Letelier, S.L.E.; Sáez-Lozano, J.L. Expenditure Decentralization: Does It Make Us Happier? An Empirical Analysis Using a Panel of Countries. Sustainability 2020, 12, 7236. [Google Scholar] [CrossRef]
- Storonyanska, I.; Hrynchyshyn, I.; Dub, A.; Horga, I. Fiscal decentralization in Europe in the context of social protection development. Econ. Ann. 2019, 175, 24–28. [Google Scholar] [CrossRef] [Green Version]
- Sujarwoto, S.; Tampubolon, G. Decentralisation and Citizen Happiness: A Multilevel Analysis of Self-rated Happiness in Indonesia. J. Happiness Stud. 2015, 16, 455–475. [Google Scholar] [CrossRef]
- Digdowiseiso, K.; Murshed, S.M.; Bergh, S.I. How Effective is fiscal decentralization for inequality reduction in developing countries? Sustainability 2022, 14, 505. [Google Scholar] [CrossRef]
- Tselios, V.; Rodríguez-Pose, A. Did Decentralisation Affect Citizens’ Perception of the European Union? The Impact during the Height of Decentralisation in Europe. Economies 2020, 8, 38. [Google Scholar] [CrossRef]
- Gajić, A.; Krunić, N.; Protić, B. Classification of Rural Areas in Serbia: Framework and Implications for Spatial Planning. Sustainability 2021, 13, 1596. [Google Scholar] [CrossRef]
- Jurjević, Ž.; Zekić, S.; Ðokić, D.; Matkovski, B. Regional Spatial Approach to Differences in Rural Economic Development: Insights from Serbia. Land 2021, 10, 1211. [Google Scholar] [CrossRef]
- Churski, P.; Herodowicz, T.; Konecka-Szydłowska, B.; Perdał, R. Spatial Differentiation of the Socio-Economic Development of Poland–“Invisible” Historical Heritage. Land 2021, 10, 1247. [Google Scholar] [CrossRef]
- Tselios, V.; Rodríguez-Pose, A.; Pike, A.; Tomaney, J.; Torrisi, G. Income inequality, decentralization and regional development in Western Europe. Environ. Plan. 2012, 44, 1278–1301. [Google Scholar] [CrossRef] [Green Version]
- European Commission. The LEADER Approach. A Basic Guide, 2006. ENRD Home Page. The European Network for Rural Development (ENRD). Available online: https://enrd.ec.europa.eu/sites/default/files/fms/pdf/2B953E0A-9045-2198-8B09-ED2F3D2CCED3.pdf (accessed on 31 May 2008).
- Navarro, F.; Labianca, M.; Cejudo, E.; De Rubertis, S.; Salento, A.; Maroto, J.; Belliggiano, A. Interpretations of Innovation in Rural Development. The Cases of Leader Projects in Lecce (Italy) and Granada (Spain) in 2007–2013 Period. Eur. Countrys. 2018, 10, 107–126. [Google Scholar] [CrossRef] [Green Version]
- Wojewódzka-Wiewiórska, A. The importance of the leader programme 2007–2013 in the rural areas development in Poland. Res. Rural Dev. 2017, 2, 97–103. [Google Scholar]
- Alonso, G.C.; Masot, N.A. Rural space governance in Extremadura (SW Spain): Analysis of the Leader Approach. Eur. Countrys. 2020, 12, 448–468. [Google Scholar] [CrossRef]
- Gargano, G. The Bottom-Up Development Model as a Governance Instrument for the Rural Areas. The Cases of Four Local Action Groups (LAGs) in the United Kingdom and in Italy. Sustainability 2021, 13, 9123. [Google Scholar] [CrossRef]
- Dziekański, P.; Prus, P. Financial Diversity and the Development Process: Case study of Rural Communes of Eastern Poland in 2009–2018. Sustainability 2020, 12, 6446. [Google Scholar] [CrossRef]
- Salmon, P. Decentralizations as an Incentive Scheme. Oxf. Rev. Econ. Policy 1987, 3, 24–43. [Google Scholar] [CrossRef]
- Parker, A.N. Decentralization: The Way forward for Rural Development? World Bank, Agriculture and Natural Resources Department, Sector Policy and Water Resources Division: Washington, DC, USA, 1995; p. 52. [Google Scholar]
- Karanikolas, P.; Hatzipanteli, S. The Decentralization Process of Rural Development Policy in Greece. Eur. Plan. Stud. 2008, 18, 411–434. [Google Scholar] [CrossRef]
- Maro, P.S. The impact of decentralization on spatial equity and rural development in Tanzania. World Dev. 1990, 18, 673–693. [Google Scholar] [CrossRef]
- Lu, S.; Wang, H. Limited Decentralization: Understand China’s Land System from the Perspective of Central-Local Relation. Land 2022, 11, 517. [Google Scholar] [CrossRef]
- Chen, X.; Zhang, X.; Song, Y.; Liang, X.; Wang, L.; Geng, Y. Fiscal Decentralization, Urban-Rural Income Gap, and Tourism. Sustainability 2020, 12, 10398. [Google Scholar] [CrossRef]
- Hennebry, B.; Stryjakiewicz, T. Classification of Structurally Weak Rural Regions: Application of a Rural Development Index for Austria and Portugal. Quaest. Geogr. 2020, 39, 5–14. [Google Scholar] [CrossRef]
- Zekic, S.; Kleut, Z.; Matkovski, B. An analysis of key indicators of rural development in Serbia: A comparison with EU countries. Econ. Ann. 2017, 214, 107–120. [Google Scholar] [CrossRef]
- Pawlik, A.; Dziekański, P.; Przybytniowski, J.W. Influence of Financial Variables on the Development of Rural Communes of Eastern Poland in 2009–2018. Risks 2021, 9, 145. [Google Scholar] [CrossRef]
- Shcherbak, V.; Ganushchak-Yefimenko, L.; Nifatova, O.; Fastovets, N.; Plysenko, H.; Lutay, L.; Tkachuk, V.; Ptashchenko, O. Use of key indicators to monitor sustainable development of rural areas. Glob. J. Environ. Sci. Manag. 2020, 6, 175–190. [Google Scholar] [CrossRef]
- Hashemi, N.; Ghaffarv, G. A proposed Sustainable Rural Development Index: Lessons from Hajij village, Iran. Tour. Manag. 2017, 59, 130–138. [Google Scholar] [CrossRef]
- Michalek, J.; Zarnekow, N. Application of the Rural Development Index to Analysis of Rural Regions in Poland and Slovakia. Soc. Indic. Res. 2012, 105, 1–37. [Google Scholar] [CrossRef]
- Banakar, V.; Patil, S.V. A Conceptual Model of Rural Development Index. Int. J. Hortic. Agric. Food Sci. 2018, 2, 29–38. [Google Scholar] [CrossRef]
- Jiang, L.; Luo, J.; Zhang, C.; Tian, L.; Liu, Q.; Chen, G.; Tian, Y. Study on the Level and Type Identification of Rural Development in Wuhan City’s New Urban Districts. ISPRS Int. J. Geo-Inf. 2020, 9, 172. [Google Scholar] [CrossRef] [Green Version]
- Cadoná, L.A.; Umburanas, R.C.; Junior, P.A.V.; Dourado Neto, D. Sustainable Rural Development Index. World Economics Association (WEA) Conferences, No. 2 2016, Food and Justice, 5 November–15 December 2016. Available online: https://foodandjustice2016.weaconferences.net/papers/sustainable-rural-development-index/ (accessed on 11 March 2022).
- Tae-Hwa, K.; Seung-Ryong, Y. Construction Of The Rural Development Index: The Case Of Vietnam. J. Rural. Dev. /Nongchon-Gyeongje Ang 2016, 39, 113–142. [Google Scholar] [CrossRef]
- Khomiuk, N.; Bochko, O.; Pavlikha, N.; Demchuk, A.; Stashchuk, O.; Shmatkovska, T.; Naumenko, N. Economic modeling of sustainable rural development under the conditions of decentralization: A case study of Ukraine. Sci. Pap. Ser. Manag. Econ. Eng. Agric. Rural Dev. 2020, 20, 317–332. [Google Scholar]
- Organisation for Economic Co-Operation and Development. Ten Guidelines for Effective Decentralisation Conducive to Regional Development OECD. Available online: https://www.oecd.org/eurasia/countries/ukraine/Ten-Guidelines-for-Effective-Decentralisation-Conducive-to-Regional-Development.pdf (accessed on 3 March 2022).
- State Statistics Service of Ukraine. Statistical Yearbook of Ukraine. Available online: http://ukrstat.gov.ua/druk/publicat/kat_u/2021/zb/11/Yearbook_2020_e.pdf (accessed on 13 February 2022).
- Armstrong, J.S.; Adya, M.; Collopy, F. Rule-Based Forecasting: Using Judgment in Time-Series Extrapolation. In Principles of Forecasting; A Handbook for Researchers and Practitioners; Kluwer: Alphen aan den Rijn, The Netherlands, 2001. [Google Scholar]
- Cabinet of Ministers of Ukraine. Rural Development Concept on 23 September 2015 No. 995-p. Available online: https://zakon.rada.gov.ua/laws/show/995-2015-%D1%80#Text (accessed on 13 February 2022).
- Patyka, N.; Gryschenko, O.; Kucher, A.; Hełdak, M.; Raszka, B. Assessment of the Degree of Factors Impact on Employment in Ukraine’s Agriculture. Sustainability 2021, 13, 564. [Google Scholar] [CrossRef]
- Dmytryshyn, M.; Dmytryshyn, R.; Yakubiv, V.; Zagorodnyuk, A. Peculiarities of Ukrainians’ Approval of Decentralization Reform. Adm. Sci. 2021, 11, 104. [Google Scholar] [CrossRef]
- Kvålseth, T.O. Coefficient of Variation: The Second-Order Alternative. J. Appl. Stat. 2016, 44, 402–415. [Google Scholar] [CrossRef]
- Verkhovna Rada of Ukraine. Budget Code of Ukraine on 8 July 2010. No. 2456-VI. Available online: https://zakon.rada.gov.ua/laws/show/79-19#Text (accessed on 13 February 2022).
- Verkhovna Rada of Ukraine. About Modification of the Budget Code of Ukraine Concerning Reform of Interbudgetary Relations on 28 December 28 2014. No. 79-VIII. Available online: https://zakon.rada.gov.ua/laws/show/2456-17?lang=en#Text (accessed on 13 February 2022).
- State Statistics Service of Ukraine. Statistical Publication “Regions of Ukraine”. Available online: http://www.ukrstat.gov.ua/druk/publicat/Arhiv_u/Arch_reg.htm (accessed on 13 February 2022).
- State Statistics Service of Ukraine. Statistical publication “Gross regional product”. Available online: http://www.ukrstat.gov.ua/druk/publicat/Arhiv_u/03/Arch_vrp.htm (accessed on 13 February 2022).
- Ministry of Finance of Ukraine. Statistical Yearbook “Budget of Ukraine”. Available online: https://www.mof.gov.ua/uk/statistichnij-zbirnik (accessed on 13 February 2022).
- State Statistics Service of Ukraine. Statistical Publication “Expenditure and Resources of Households of Ukraine”. Available online: http://www.ukrstat.gov.ua/druk/publicat/kat_u/2021/zb/06/vrd_20_ue.pdf (accessed on 13 February 2022).
- State Statistics Service of Ukraine. Statistical Publication “Economic Activity of Population in Ukraine”. Available online: http://www.ukrstat.gov.ua/druk/publicat/kat_u/2021/zb/07/zb_r_s_2020.pdf (accessed on 13 February 2022).
- State Statistics Service of Ukraine. Statistical Publication “Preschool education in Ukraine”. Available online: http://www.ukrstat.gov.ua/druk/publicat/kat_u/publosvita_u.htm (accessed on 13 February 2022).
- Ministry of Health of Ukraine. Statistics. Available online: http://medstat.gov.ua/ukr/statdan.html (accessed on 13 February 2022).
- Dyakonenko, O.I. Influence of financial decentralization on development of rural settlements in Ukraine. Demogr. Soc. Econ. 2018, 3, 161–174. [Google Scholar] [CrossRef]
- State Statistics Service of Ukraine. Statistical Publication “Transport and Communication of Ukraine”. Available online: http://www.ukrstat.gov.ua/druk/publicat/kat_u/2021/zb/10/zb_Transpot.pdf (accessed on 13 February 2022).
- State Statistics Service of Ukraine. Statistical Publication“Resident Population of Ukraine by Sex and Age”. Available online: http://www.ukrstat.gov.ua/druk/publicat/kat_u/2021/zb/06/zb_rpn21_ue.pdf (accessed on 13 February 2022).
- State Statistics Service of Ukraine. Demographic Yearbook “Population of Ukraine”. Available online: http://www.ukrstat.gov.ua/druk/publicat/kat_u/2021/zb/10/dem_2020.pdf (accessed on 13 February 2022).
- Belei, S. Development of Rural Areas in Conditions of Decentralization. Ef. Ekon. 2021, 1. Available online: http://www.economy.nayka.com.ua/?op=1&z=8503 (accessed on 16 May 2022).
- Dubnevych, Y.; Dubnevych, N.; Dorosh, U. Social and economic development of rural areas under conditions of decentralization. Agric. Econ. 2019, 1–2, 25–31. [Google Scholar] [CrossRef] [Green Version]
- Britchenko, I.; Bezpartochnyi, M.; Maslii, N. Financial decentralization in Ukraine: Prerequisites, problems, prospects. VUZF Rev. 2019, 4, 25–44. [Google Scholar] [CrossRef]
- Titenko, Z. Budgetary decentralization as a factor for the rural development of rural areas of Ukraine. Agrosvit 2020, 7, 87–91. [Google Scholar] [CrossRef] [Green Version]
- Hotra, V.V.; Kovach, A.Y. The influence of the decentralization process on the development of rural areas. Scientific Bulletin of Uzhhorod University. Ser. Econ. 2021, 1, 30–37. [Google Scholar] [CrossRef]
- Oliynyk-Dunn, O.M.; Wasilewski, M.; Wasilewska, N.; Okhrimenko, I.; Adamenko, V. Transformation of the financing patterns of agricultural enterprises in the conditions of the financial system crisis: A case of Ukraine and the USA. Econ. Ann.-Xxi 2020, 182, 77–89. [Google Scholar] [CrossRef]
- Boiko, S.V.; Shirinyan, L.V. Horizontal equalization of regional budgets in the system of interbudget financial provision of regions of Ukraine. Econ. Horiz. 2018, 3, 65–77. [Google Scholar] [CrossRef]
- Sakal, O.; Kovalenko, A.; Tretiak, R.; Tretiak, N. Results of the decentralization reform in Ukraine: Land use. Scientific Papers Series Management. Econ. Eng. Agric. Rural. Dev. 2019, 19, 511–516. [Google Scholar]
Figure 1.
Structure of the Rural Development Index.

Figure 2.
Study area.

Figure 3.
The share of the rural population of Ukraine, actual value (State Statistics Service of Ukraine [58], 2012–2018), simulated value (Formulas (11)–(13)).
Figure 3.
The share of the rural population of Ukraine, actual value (State Statistics Service of Ukraine [58], 2012–2018), simulated value (Formulas (11)–(13)).

Figure 4.
The rate of the available rural population, actual value (State Statistics Service of Ukraine [58], 2012–2018), and simulated values, as in Formulas (14)–(16).
Figure 4.
The rate of the available rural population, actual value (State Statistics Service of Ukraine [58], 2012–2018), and simulated values, as in Formulas (14)–(16).

Figure 5.
Rural Development Index (IRD) of Ukraine: (a) 2012, (b) 2013, (c) 2014, (d) 2015, (e) 2016, (f) 2017, (g) 2018, (h) 2019, and (i) 2020.
Figure 5.
Rural Development Index (IRD) of Ukraine: (a) 2012, (b) 2013, (c) 2014, (d) 2015, (e) 2016, (f) 2017, (g) 2018, (h) 2019, and (i) 2020.


Table 1.
Indicators of rural development in Ukraine in 2012–2020 [58].
Table 1.
Indicators of rural development in Ukraine in 2012–2020 [58].
| Indicator | The Period before Decentralization | The Period during Decentralization | Difference 2020 vs. 2014 | |||||||
|---|---|---|---|---|---|---|---|---|---|---|
| 2012 | 2013 | 2014 | 2015 | 2016 | 2017 | 2018 | 2019 | 2020 | ||
| Social component of Rural Development Index | ||||||||||
| The proportion of children in preschool education in rural areas, % (xsoc2) | 38 | 41 | 40 | 40 | 41 | 41 | 41 | 43 | 39 | −2 |
| Number of RMPs per 1000 rural population (xsoc3) | 0.86 | 1.06 | 1.06 | 1.01 | 1.01 | 1.01 | 0.98 | 0.99 | 0.94 | −0.13 |
| Infrastructural component of Rural Development Index | ||||||||||
| Growth (decrease) rate in the provision of rural population with accommodation, % (xinfrast2) | 100.77 | 100.76 | 95.33 | 100.87 | 100.68 | 100.39 | 100.62 | 100.59 | 99.95 | −0.82 |
| Demographic component of Rural Development Index | ||||||||||
| Share of rural population, % (xdemog1) | 31.23 | 31.12 | 31.02 | 30.88 | 30.81 | 30.77 | 30.71 | 30.70 | 30.70 | −0.53 |
| Growth (decrease) rate in the number of the available rural population, % (xdemog2) | 99.41 | 99.45 | 99.40 | 94.08 | 99.39 | 99.44 | 99.34 | 99.09 | 98.97 | −0.45 |
| Employment component of Rural Development Index | ||||||||||
| Rural employment rate, % (xemploy1) | 62.7 | 63.5 | 55.9 | 55.1 | 54.9 | 54.4 | 55.0 | 48.9 | 47.1 | −15.6 |
| Average duration of job search by the unemployed in rural areas, months (xemploy2) | 5 | 6 | 5 | 6 | 6 | 6 | 5 | 5 | 6 | 1 |
Table 2.
Rural development indicators in 2012–2020 according to the Rural Development Concept [60].
Table 2.
Rural development indicators in 2012–2020 according to the Rural Development Concept [60].
| Indicator | 2012 | 2013 | 2014 | 2015 | 2016 | 2017 | 2018 | 2019 | 2020 | Critical Indicator Until 2025 |
|---|---|---|---|---|---|---|---|---|---|---|
| Number of rural population, million people | 14.3 | 14.2 | 14.1 | 13.2 | 13.2 | 13.1 | 13.0 | 12.9 | 12.8 | Increase |
| The level of wages in agriculture, Euro | 203.88 | 220.88 | 162.64 | 136.57 | 148.28 | 201.87 | 235.11 | 305.88 | 316.92 | Increase |
| Number of jobs in the rural area, thousands | 6370.70 | 6405.90 | 5292.40 | 5134.20 | 5098.40 | 5047.10 | 5089.20 | 5163.5 | 4931.6 | Increase up to 1 mln |
| The rate of the employed rural population growth, according to 2015 | 1.14 | 1.15 | 1.01 | 1.00 | 1.00 | 0.99 | 1.00 | 0.89 | 0.85 | 1.5 times |
| Share of income of rural households from entrepreneurial activity and self-employment | 3.1 | 2.9 | 5.1 | 4.4 | 4.5 | 3.5 | 5.1 | 5.6 | 5.6 | Increase up to 15% |
Table 3.
Economic component of Rural Development Index (IRDecon), Refs [66,67,68,69,70] and our own calculation.
| Regions | The Period before Decentralization | The Period during Decentralization | Difference 2020 vs. 2014 | |||||||
|---|---|---|---|---|---|---|---|---|---|---|
| 2012 | 2013 | 2014 | 2015 | 2016 | 2017 | 2018 | 2019 | 2020 | ||
| The Autonomous Republic of Crimea | 0.46 | 0.40 | ||||||||
| Vinnytsia region | 0.27 | 0.33 | 0.30 | 0.31 | 0.36 | 0.38 | 0.38 | 0.48 | 0.45 | 0.05 |
| Volyn region | 0.43 | 0.42 | 0.46 | 0.42 | 0.38 | 0.40 | 0.33 | 0.48 | 0.41 | −0.05 |
| Dnipropetrovsk region | 0.74 | 0.69 | 0.68 | 0.81 | 0.74 | 0.70 | 0.67 | 0.67 | 0.67 | −0.06 |
| Donetsk region | 0.80 | 0.72 | 0.57 | 0.51 | 0.48 | 0.44 | 0.43 | 0.44 | 0.44 | −0.13 |
| Zhytomyr region | 0.29 | 0.33 | 0.32 | 0.28 | 0.30 | 0.27 | 0.28 | 0.39 | 0.39 | 0.01 |
| Zakarpattia region | 0.11 | 0.20 | 0.13 | 0.12 | 0.31 | 0.22 | 0.21 | 0.32 | 0.31 | 0.08 |
| Zaporizhzhia region | 0.53 | 0.55 | 0.54 | 0.62 | 0.66 | 0.62 | 0.52 | 0.57 | 0.57 | −0.07 |
| Ivano-Frankivsk region | 0.40 | 0.39 | 0.36 | 0.39 | 0.39 | 0.37 | 0.35 | 0.46 | 0.44 | 0.01 |
| Kyiv region | 0.66 | 0.63 | 0.61 | 0.63 | 0.67 | 0.64 | 0.63 | 0.62 | 0.62 | −0.02 |
| Kirovohrad region | 0.45 | 0.46 | 0.44 | 0.43 | 0.49 | 0.44 | 0.40 | 0.50 | 0.50 | −0.02 |
| Luhansk region | 0.42 | 0.38 | 0.31 | 0.30 | 0.37 | 0.30 | 0.27 | 0.31 | 0.31 | −0.01 |
| Lviv region | 0.33 | 0.38 | 0.34 | 0.45 | 0.50 | 0.46 | 0.40 | 0.49 | 0.43 | −0.02 |
| Mykolaiv region | 0.54 | 0.60 | 0.55 | 0.57 | 0.60 | 0.55 | 0.47 | 0.64 | 0.66 | 0.02 |
| Odesa region | 0.30 | 0.32 | 0.29 | 0.33 | 0.37 | 0.36 | 0.28 | 0.39 | 0.39 | 0.00 |
| Poltava region | 0.59 | 0.55 | 0.50 | 0.61 | 0.70 | 0.66 | 0.67 | 0.63 | 0.61 | 0.02 |
| Rivne region | 0.43 | 0.45 | 0.44 | 0.37 | 0.33 | 0.31 | 0.27 | 0.39 | 0.38 | −0.08 |
| Sumy region | 0.27 | 0.33 | 0.27 | 0.32 | 0.35 | 0.32 | 0.30 | 0.40 | 0.39 | 0.01 |
| Ternopil region | 0.17 | 0.25 | 0.18 | 0.18 | 0.26 | 0.25 | 0.24 | 0.44 | 0.41 | 0.12 |
| Kharkiv region | 0.42 | 0.44 | 0.44 | 0.40 | 0.40 | 0.37 | 0.36 | 0.48 | 0.46 | −0.08 |
| Kherson region | 0.37 | 0.34 | 0.28 | 0.25 | 0.33 | 0.30 | 0.28 | 0.42 | 0.42 | 0.03 |
| Khmelnytskyi region | 0.31 | 0.37 | 0.36 | 0.30 | 0.29 | 0.29 | 0.26 | 0.37 | 0.37 | −0.07 |
| Cherkasy region | 0.40 | 0.38 | 0.34 | 0.32 | 0.38 | 0.37 | 0.36 | 0.44 | 0.41 | −0.01 |
| Chernivtsi region | 0.21 | 0.26 | 0.11 | 0.10 | 0.09 | 0.05 | 0.04 | 0.21 | 0.22 | −0.01 |
| Chernihiv region | 0.26 | 0.27 | 0.27 | 0.28 | 0.33 | 0.32 | 0.32 | 0.41 | 0.40 | 0.04 |
Table 8.
Descriptive statistics on the Rural Development Index (IRD), and our own calculation.
| State | The Period before Decentralization | The Period during Decentralization | |||||||
|---|---|---|---|---|---|---|---|---|---|
| 2012 | 2013 | 2014 | 2015 | 2016 | 2017 | 2018 | 2019 | 2020 | |
| All regions of Ukraine | |||||||||
| Average | 0.51 | 0.57 | 0.50 | 0.51 | 0.55 | 0.48 | 0.48 | 0.51 | 0.55 |
| Median | 0.51 | 0.59 | 0.51 | 0.51 | 0.54 | 0.49 | 0.47 | 0.51 | 0.54 |
| Maximum | 0.64 | 0.73 | 0.63 | 0.66 | 0.68 | 0.63 | 0.65 | 0.64 | 0.71 |
| Minimum | 0.35 | 0.34 | 0.31 | 0.20 | 0.34 | 0.24 | 0.25 | 0.32 | 0.36 |
| Standard Deviation | 0.08 | 0.09 | 0.07 | 0.09 | 0.08 | 0.09 | 0.09 | 0.08 | 0.09 |
| Coefficient of variation, % | 15.99 | 16.07 | 14.95 | 18.47 | 15.26 | 18.83 | 19.56 | 15.32 | 15.84 |
| Regions of Ukraine excluding the temporarily occupied territory of the Autonomous Republic of Crimea. the city of Sevastopol and a part of the temporarily occupied territories in the Donetsk and Luhansk regions in 2014–2020 | |||||||||
| Average | 0.51 | 0.57 | 0.48 | 0.48 | 0.54 | 0.47 | 0.45 | 0.50 | 0.51 |
| Median | 0.51 | 0.59 | 0.49 | 0.47 | 0.54 | 0.48 | 0.46 | 0.50 | 0.50 |
| Maximum | 0.64 | 0.73 | 0.65 | 0.69 | 0.69 | 0.62 | 0.64 | 0.67 | 0.72 |
| Minimum | 0.35 | 0.34 | 0.33 | 0.33 | 0.37 | 0.31 | 0.29 | 0.38 | 0.36 |
| Standard Deviation | 0.08 | 0.09 | 0.09 | 0.08 | 0.07 | 0.07 | 0.08 | 0.08 | 0.08 |
| Coefficient of variation, % | 15.99 | 16.07 | 18.48 | 16.87 | 13.16 | 15.91 | 18.66 | 15.03 | 15.24 |
Publisher’s Note: MDPI stays neutral with regard to jurisdictional claims in published maps and institutional affiliations. |
© 2022 by the authors. Licensee MDPI, Basel, Switzerland. This article is an open access article distributed under the terms and conditions of the Creative Commons Attribution (CC BY) license (https://creativecommons.org/licenses/by/4.0/).
Share and Cite
MDPI and ACS Style
Davydenko, N.; Wasilewska, N.; Boiko, S.; Wasilewski, M. Development of Rural Areas in Ukraine in the Context of Decentralization: An Empirical Study. Sustainability 2022, 14, 6730. https://0-doi-org.brum.beds.ac.uk/10.3390/su14116730
AMA Style
Davydenko N, Wasilewska N, Boiko S, Wasilewski M. Development of Rural Areas in Ukraine in the Context of Decentralization: An Empirical Study. Sustainability. 2022; 14(11):6730. https://0-doi-org.brum.beds.ac.uk/10.3390/su14116730
Chicago/Turabian StyleDavydenko, Nadiia, Natalia Wasilewska, Svitlana Boiko, and Mirosław Wasilewski. 2022. "Development of Rural Areas in Ukraine in the Context of Decentralization: An Empirical Study" Sustainability 14, no. 11: 6730. https://0-doi-org.brum.beds.ac.uk/10.3390/su14116730
Note that from the first issue of 2016, this journal uses article numbers instead of page numbers. See further details here.