Article

Projection Matrix Models: A Suitable Approach for Predicting Sustainable Growth in Uneven-Aged and Mixed Hyrcanian Forests

by
Abotaleb Salehnasab
1,
Harold E. Burkhart
2,
Mahmoud Bayat
3,*,
Bagher Khaleghi
1,
Sahar Heidari
4 and
Hafiz Umair Masood Awan
5,6
1
Department of Forestry and Forest Economics, University of Tehran, Karaj P.O. Box 6619-14155, Iran
2
Department of Forest Resources and Environmental Conservation, Virginia Polytechnic Institute and State University, 319 Cheatham Hall, 310 West Campus Drive, Blacksburg, VA 24061, USA
3
Research Institute of Forests and Rangelands, Agricultural Research, Education, and Extension Organization (AREEO), Tehran P.O. Box 14968-1311, Iran
4
Department of Environment, University of Tehran, Karaj P.O. Box 6619-14155, Iran
5
Helclean Consultancy Services, Asiakkaankatu 6B 29, 00930 Helsinki, Finland
6
Faculty of Agriculture and Forestry, University of Helsinki, Latokartanonkaari 7, 00014 Helsinki, Finland
*
Author to whom correspondence should be addressed.
Sustainability 2022, 14(11), 6777; https://0-doi-org.brum.beds.ac.uk/10.3390/su14116777
Submission received: 8 April 2022 / Revised: 28 May 2022 / Accepted: 30 May 2022 / Published: 1 June 2022
(This article belongs to the Special Issue Sustainable Forest Management and Natural Hazards Prevention)

Abstract

:
The Hyrcanian forests of Iran are mainly managed with the single-selection silvicultural technique. Despite significant ecological benefits associated with selection cutting, this type of forest management leads towards more challenging situations where it is difficult to maintain and practice successful forestry than in even-aged systems. Therefore, this study provides relevant management tools in the form of models to estimate low growth levels in Hyrcanian forests. In the present study, estimation of the population growth rate and then the allowable cut rate of these forests using a matrix model have been calculated in the Gorazbon district. For this purpose, the data of 256 permanent sample plots measured during the years between 2003 and 2012, as well as the data recorded about the trees harvested according to the forestry plan, have been used. As a first step, the most frequently occurring tree species were divided into four groups (beech, hornbeam, chestnut-leaved oak, and other species). Compartments of the district were divided into two groups of logged and unlogged compartments. The purpose of this division was to estimate the allowable cut and compare its volume with the volumes of observed and predicted allowable cuts obtained from forestry plans. The results showed that the total operated allowable cut (OAC) in logged compartments was more than the estimated allowable cut (EAC). In unlogged compartments, the total predicted allowable cut (PAC) was more than EAC. A comparison of EAC and OAC showed that hornbeam has been harvested more than its potential. However, chestnut-leaved oak and other species group have depicted opposite trends. Our models provide important advancements for estimating allowable cut that can enhance the goal of practicing sustainable forestry.

1. Introduction

Effective forest planning considers the concept of sustainable forest management while following a documented master plan [1]. Sustainability in natural systems such as forests can be defined as the production of environmental and socio-economic functions and services and maintenance of structures over time [2,3]. Hyrcanian forests, as a major source of commercial wood in Iran [4], perform various functions such as biodiversity, recreation, soil and water conservation, etc. Therefore, they need to be managed sustainably. One approach would be to devise a plan for uneven-aged trees occurring in Hyrcanian forests. Uneven-aged management of these forests can to be an efficient and effective way of achieving these goals of sustainability. However, the lack of appropriate tools (e.g., combined growth models) for the proper implementation of uneven-aged management in Hyrcanian forests has delayed the practical and efficient implementation of this sort of forest planning.
One of the important challenges for forest managers is to define the harvesting rate while considering the sustainability of forest resources in the long term. For instance, logging cycles in uneven-aged forests are often specified as 10-years. In order to offset the harvested volume inventory, an accurate model is needed to estimate allowable cut. Allowable cut requires estimating harvested volume, determined by an inventory of the forest, and an estimation of the increment rate, as well as the habitat and the intended purpose in the forestry plan [5].
Forest growth and increment models facilitate sustainable forest management and decision-making processes [6,7]. There are different types of forest models for use in uneven aged and mixed forests including: whole-stand models, diameter-distribution models, size-class models, and individual-tree models and Matrix models [8].
Significant improvements in computational environments and techniques have led to improvements and flexibility in forecasting models. For example, matrix models use transition matrices to estimate the dynamics of Ecol populations based on three main components including forest growth, mortality, and recruitment [9,10,11].
Since the 1940s [12,13], researchers have made extensive use of matrix models to study the dynamics of forest ecosystems [14]. Although matrix models differ in the degrees of complexity associated with recording forest growth, recruitment, and mortality, they have been used to estimate forest population dynamics and related C forest dynamics under different disturbance, management, and climate scenarios [11].
Matrix models are size-class models that predict the population structure of forest stands using transition matrix [8,10]. These models are widely used in the field of forestry [10] since they provide important information on forest stand behavior under different conditions [15]. Matrix models are utilized for different forestry applications, for example, in forest ecology for study of natural sequences [16,17,18,19] and biodiversity dynamics [20], forest policy [21], for the effects of climate change [22], natural disturbances [23], logging [24], and tree mortality resulting from logging injuries [25]. Another function of matrix models is to evaluate the sustainability of different logging regimes [26], which is also considered in the present study. Matrix model and individual-tree models interact well with each other through computational equations [27,28,29]. This feature enables the researcher to fit either a suitable individual-tree model or matrix model. It is important to mention that matrix models are preferred for large areas and when detailed information is limited or scarce (individual-tree models require detailed information) [10,30]. These two models (matrix model and individual-tree model) are usually combined with good results in situations where increment models that rely on conditions such as habitat form, topography and different tree species, etc. are needed [10]. Despite the advantages of individual-tree models over matrix models, however, due to usual lack of access to detailed forest information and complexity of individual tree models, it is recommended to use combinations of the aforementioned two models for better results [30,31,32,33]. Although several studies [34,35,36,37] have utilized a combination of individual-tree growth and matrix models, possible combinations of individual-tree increment and matrix models have not been thoroughly investigated. Projection matrix models show the dynamics of the forest through the distribution of diameter classes at certain times. Therefore, use of these models to determine the allowable cut over a given time period is recommended [26,38]. Projection matrix models represent forest increment in the form of numbers per hectare for each species by diameter class, thus, providing precise information to the tree markers.
Northern forests of Iran (Hyrcanian forests) have been managed using single-selection method for decades. Bayat, Pukkala, Namiranian and Zobeiri [5] and Hamidi, et al. [39] developed individual-tree growth models, but, due to lack of combining tools such as growth and increment models with Matrix models, the modeling approach was not efficient.
Hence, the development of a model in which the harvesting rate of each species and the diameter distribution of the forest stands are estimated will provide decision support needed for preventing the possible negative consequences of the present management plans and will provide an appropriate guide to put the forest on a sustainable basis. Accordingly, the purpose of this study was to estimate the allowable tree cut of Hyrcanian forests by combining an individual-tree model and a projection matrix model. Our research should be useful for forest practitioners who are managing forests in similar situations.
In this study, we addressed the following research questions:
  • Can individual-tree increment models and matrix models be combined to reliably estimate growth rate and allowable cut rate in uneven-aged mixed forests managed by single-selection silvicultural techniques in Hyrcanian forests?
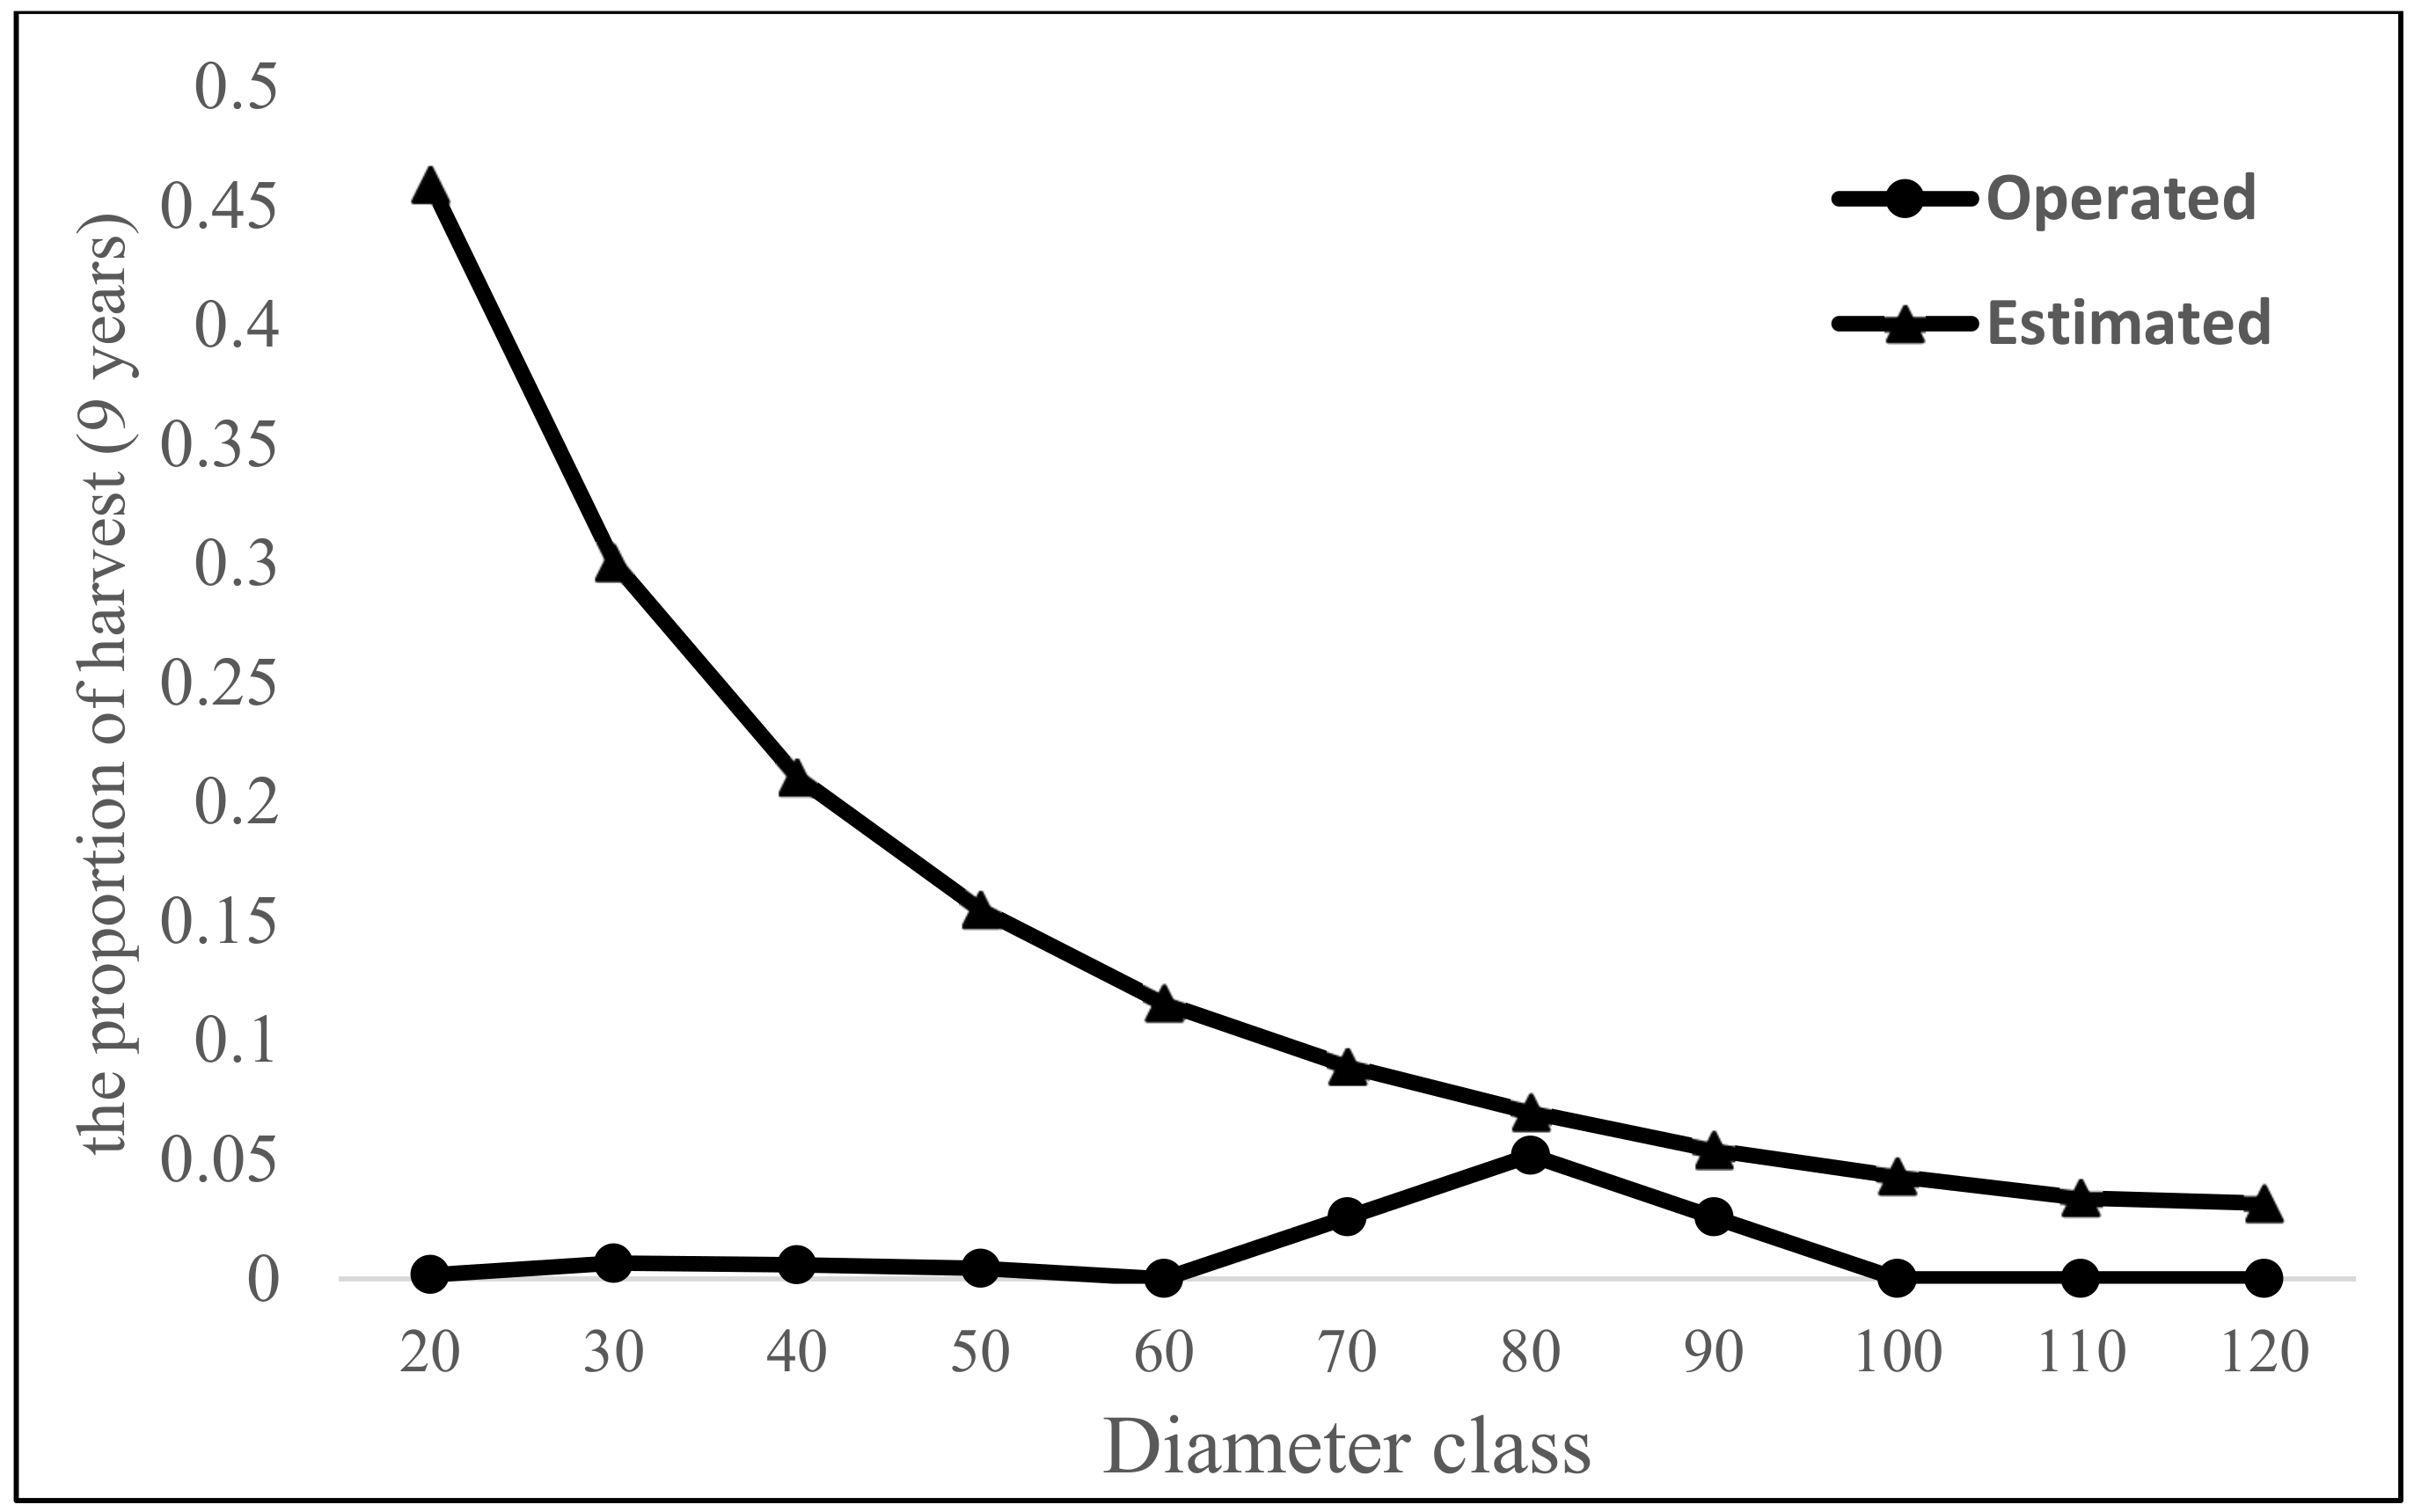
  • Are the total operated allowable cut (OAC) and estimated allowable cut (EAC) volumes for Hyrcanian forests consistent?
  • How does the estimated volume from the developed individual tree increment/matrix model compare to the predicted volume according to the Hyrcanian forest plan?

2. Materials and Methods
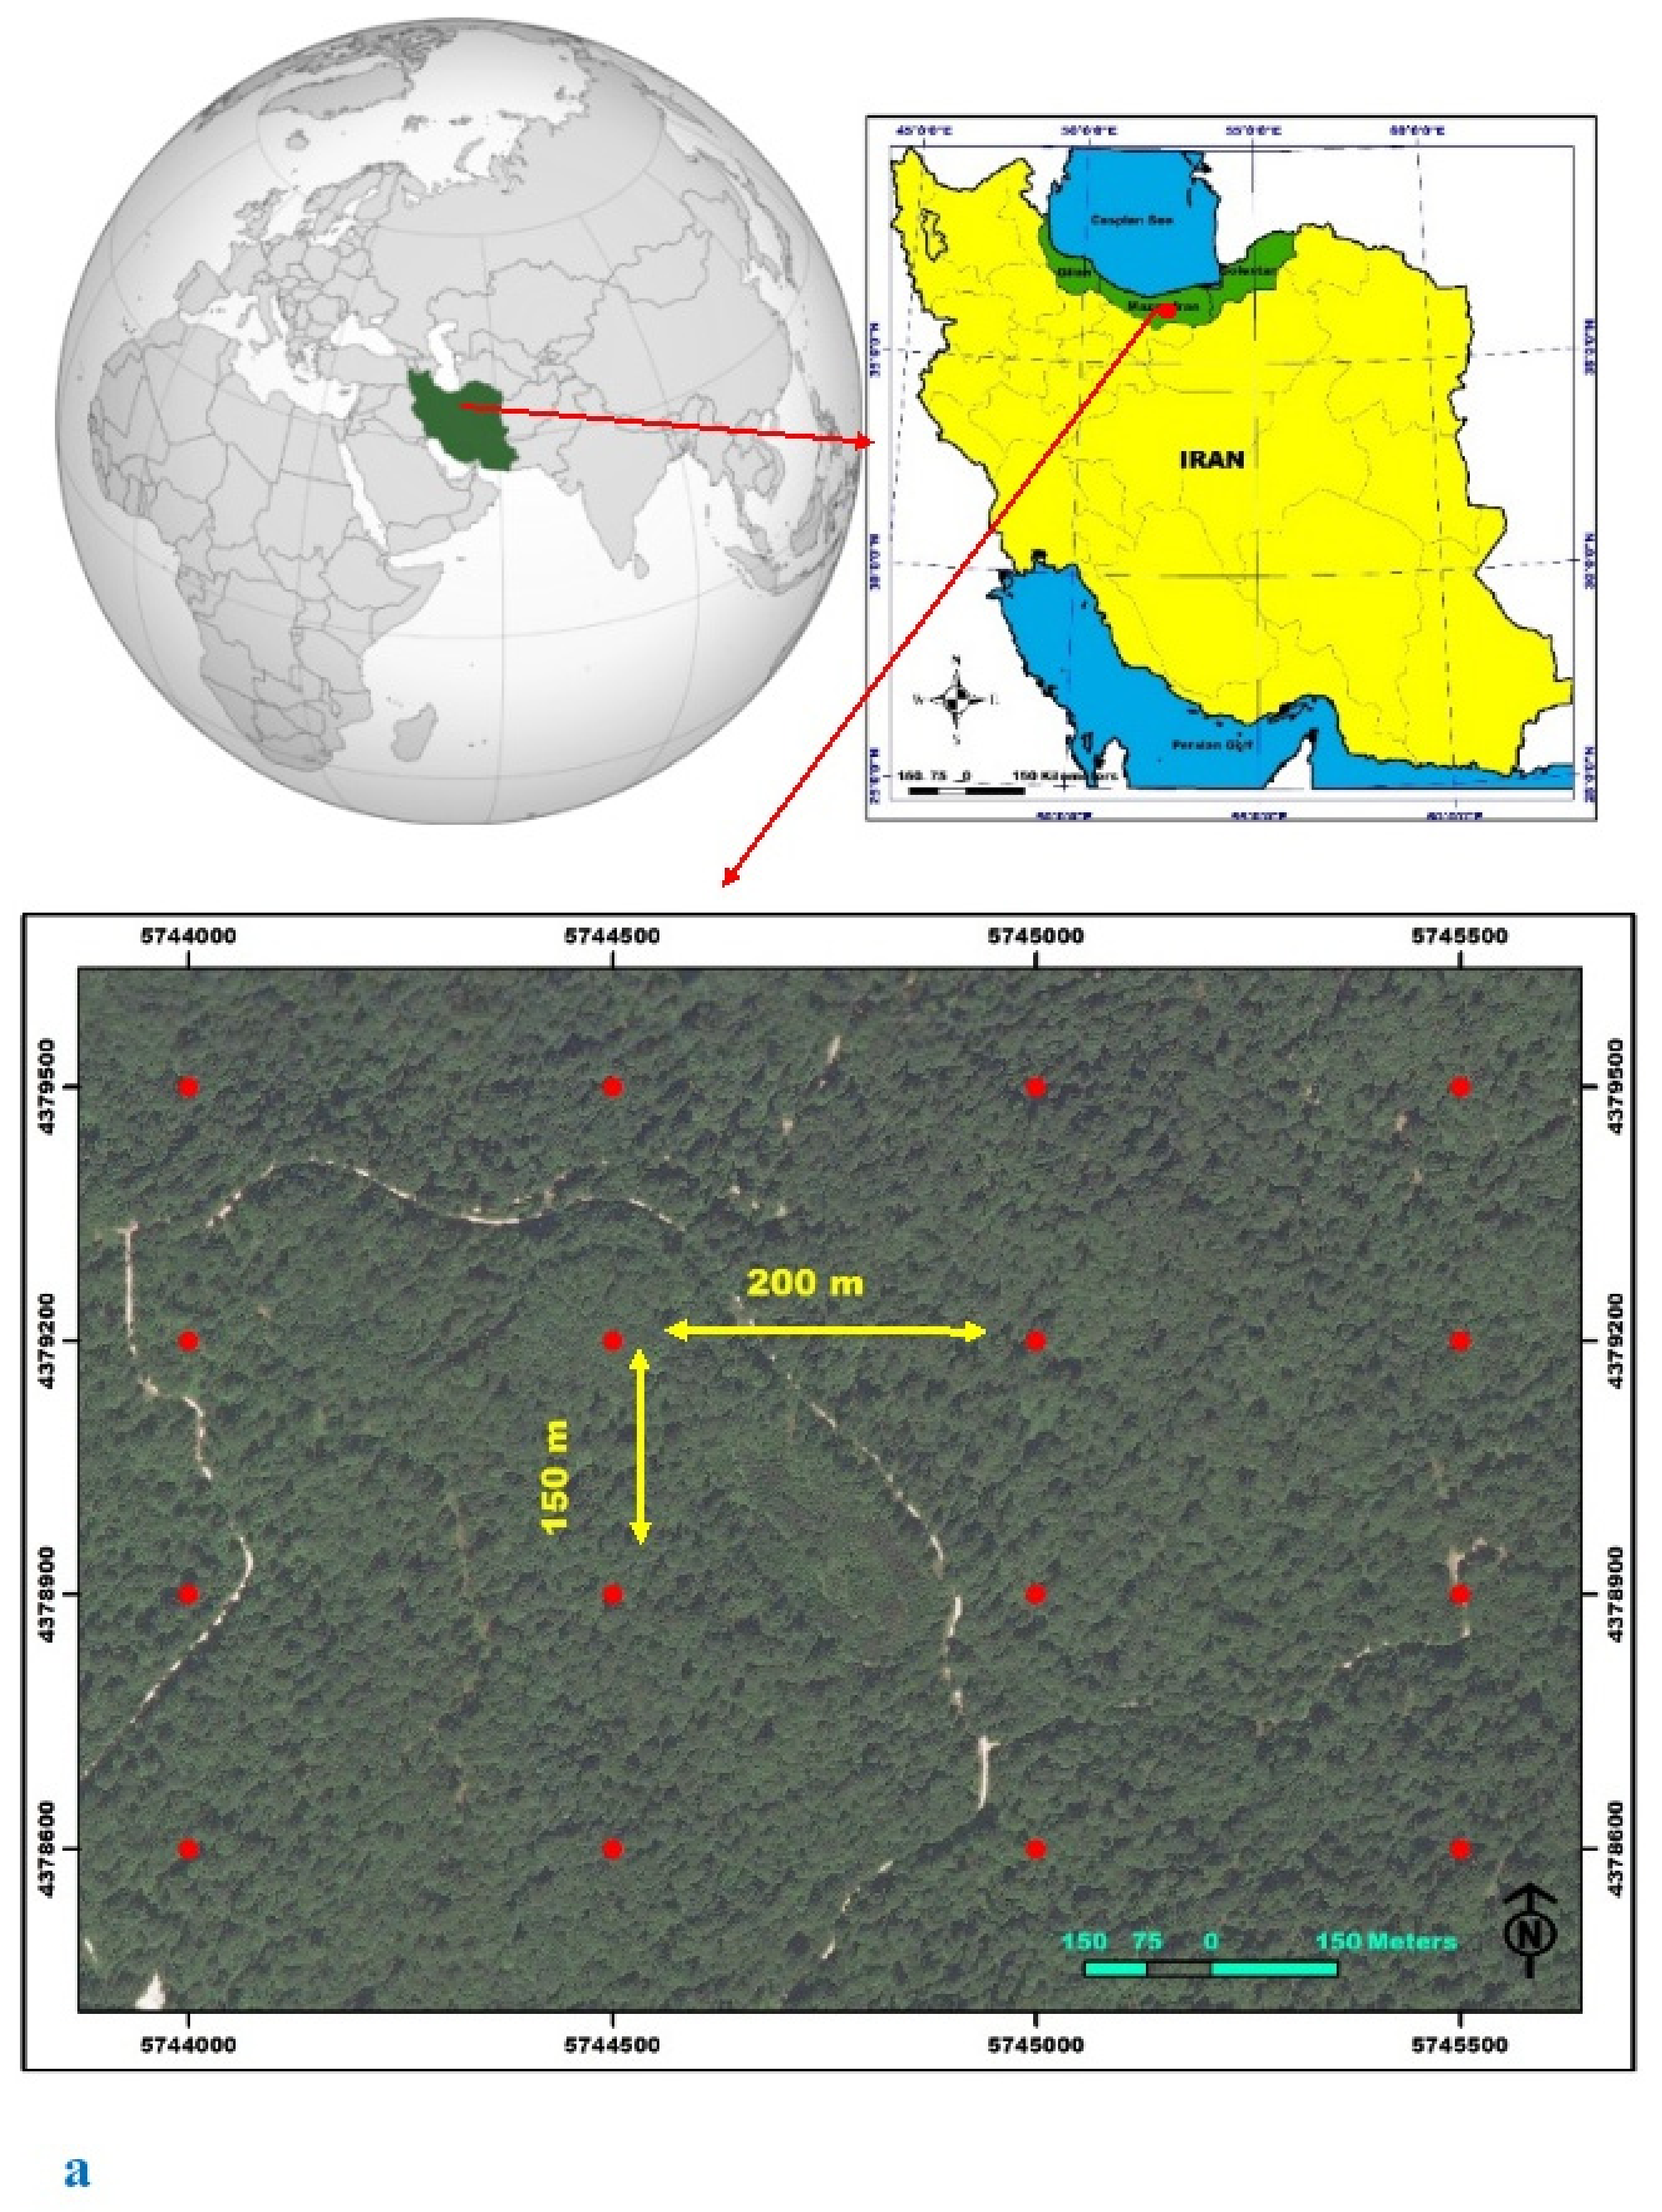
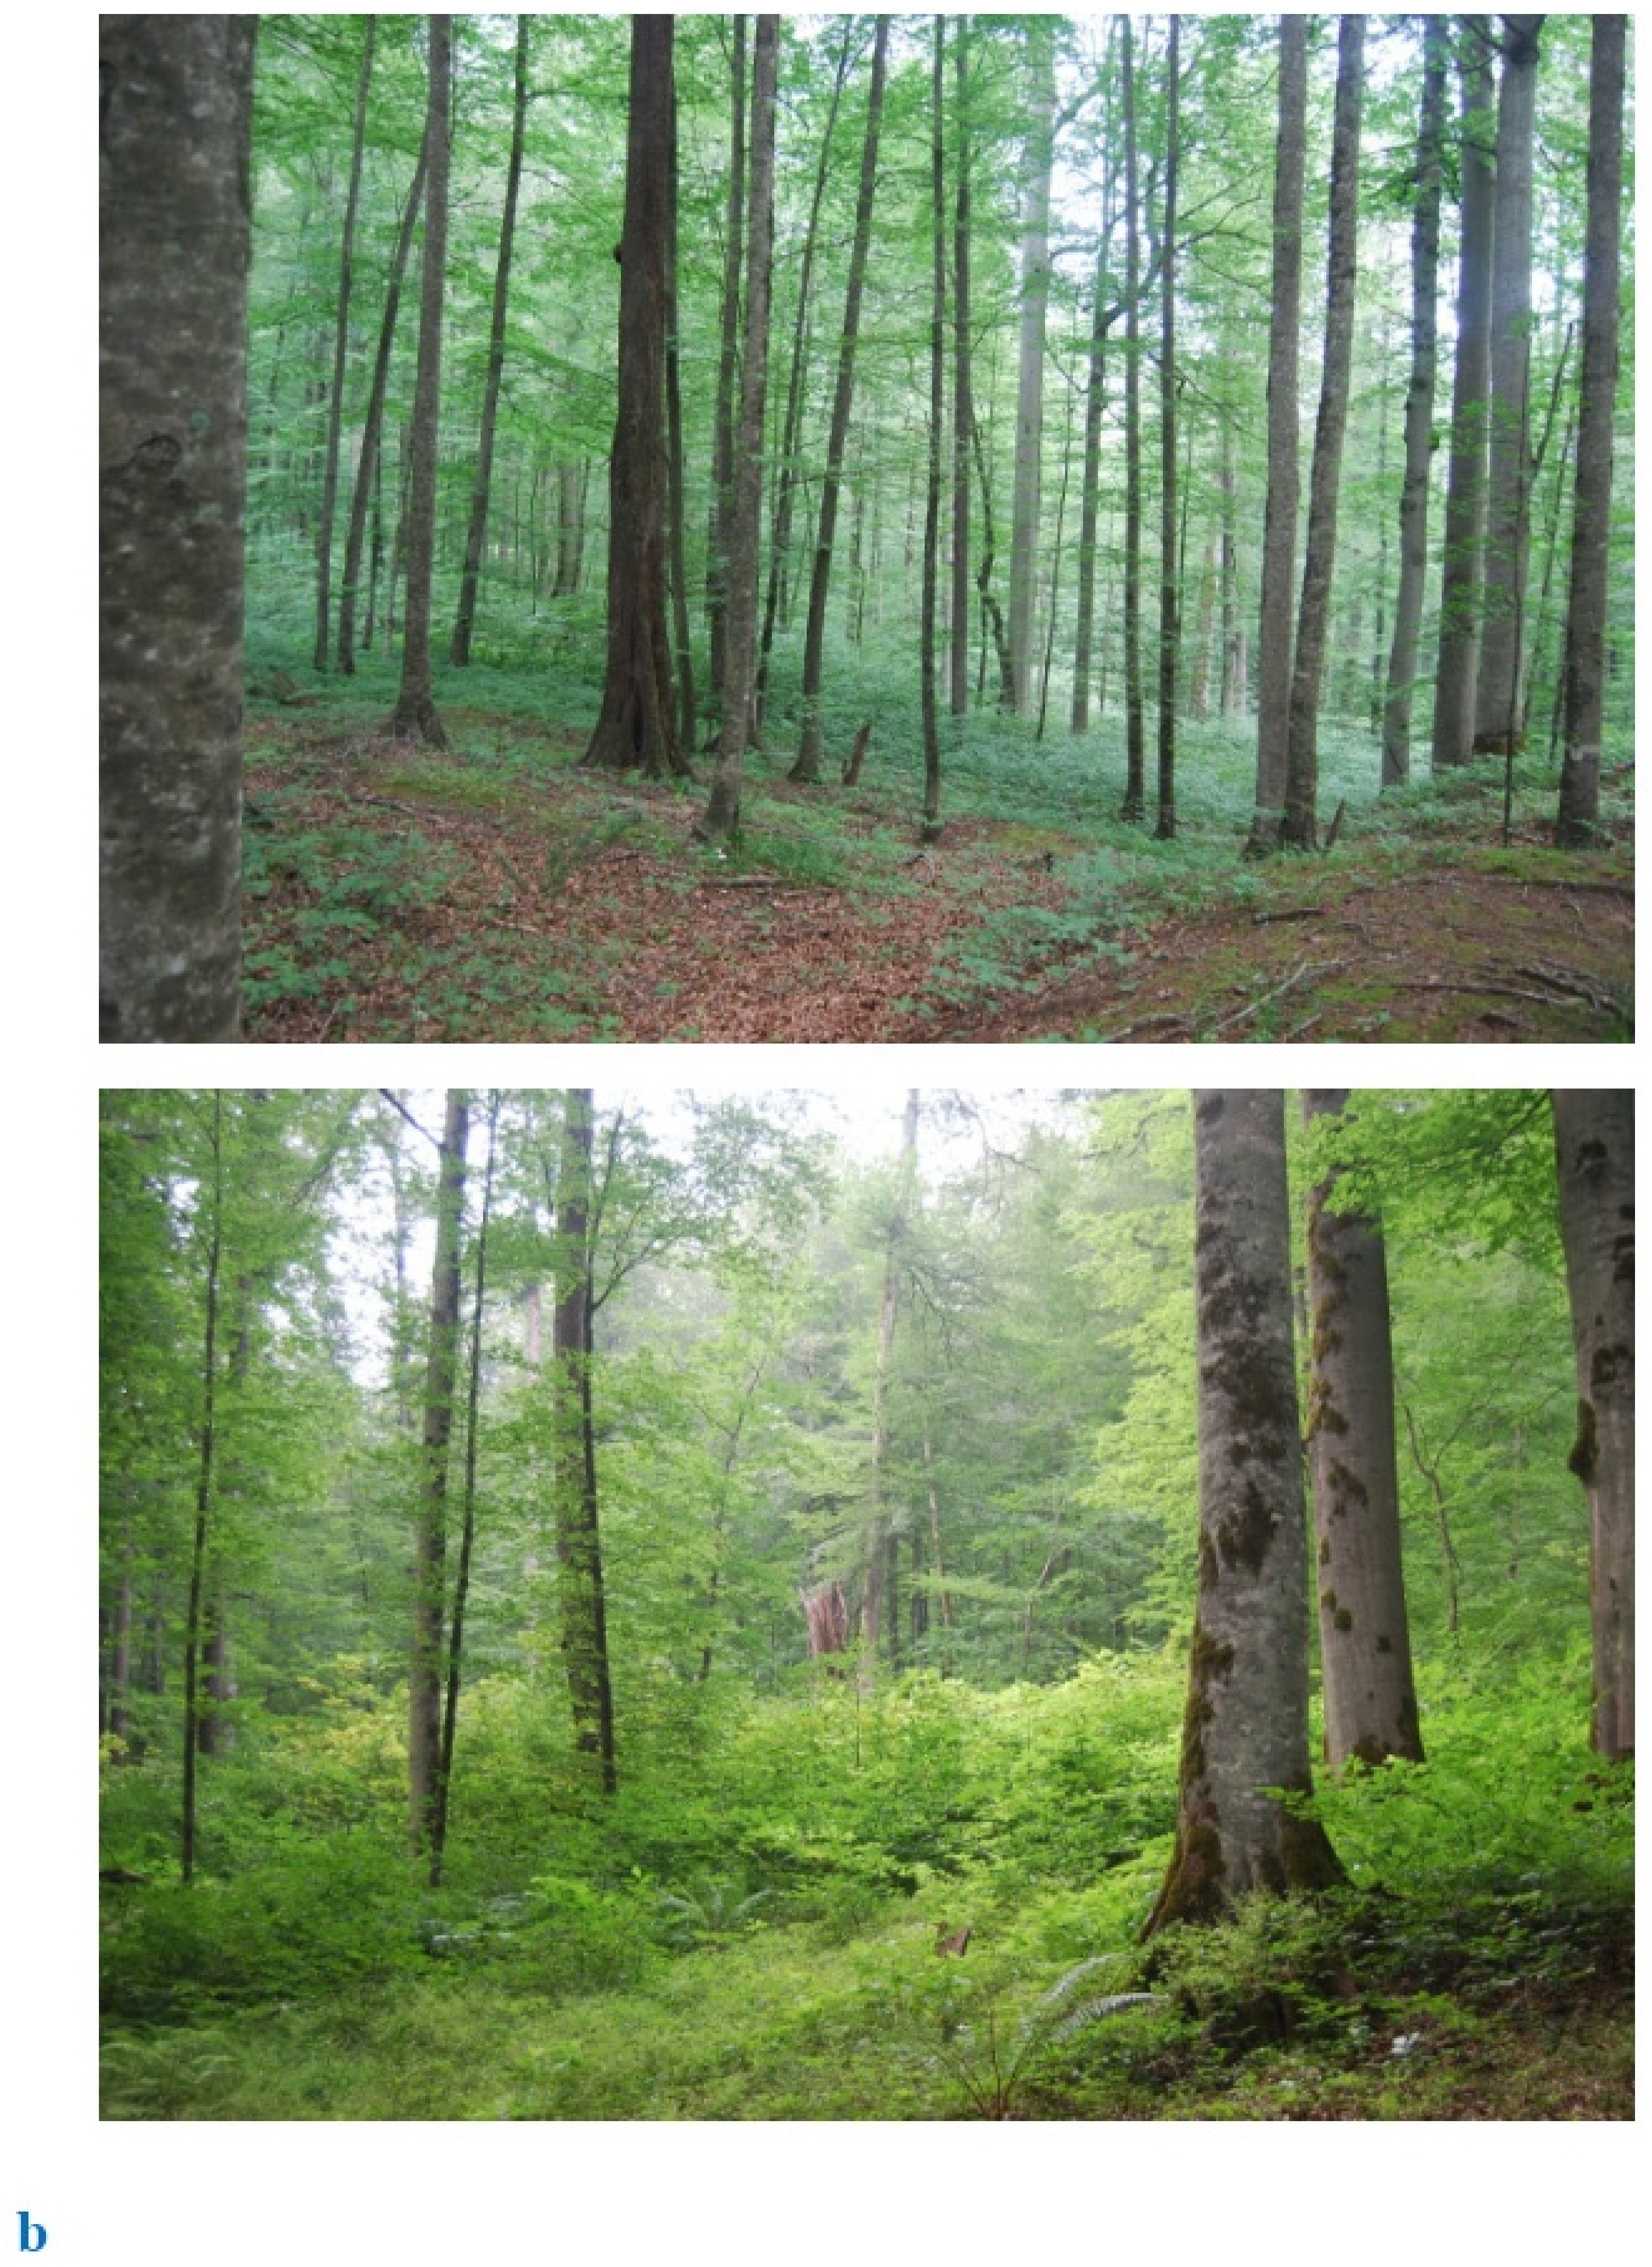
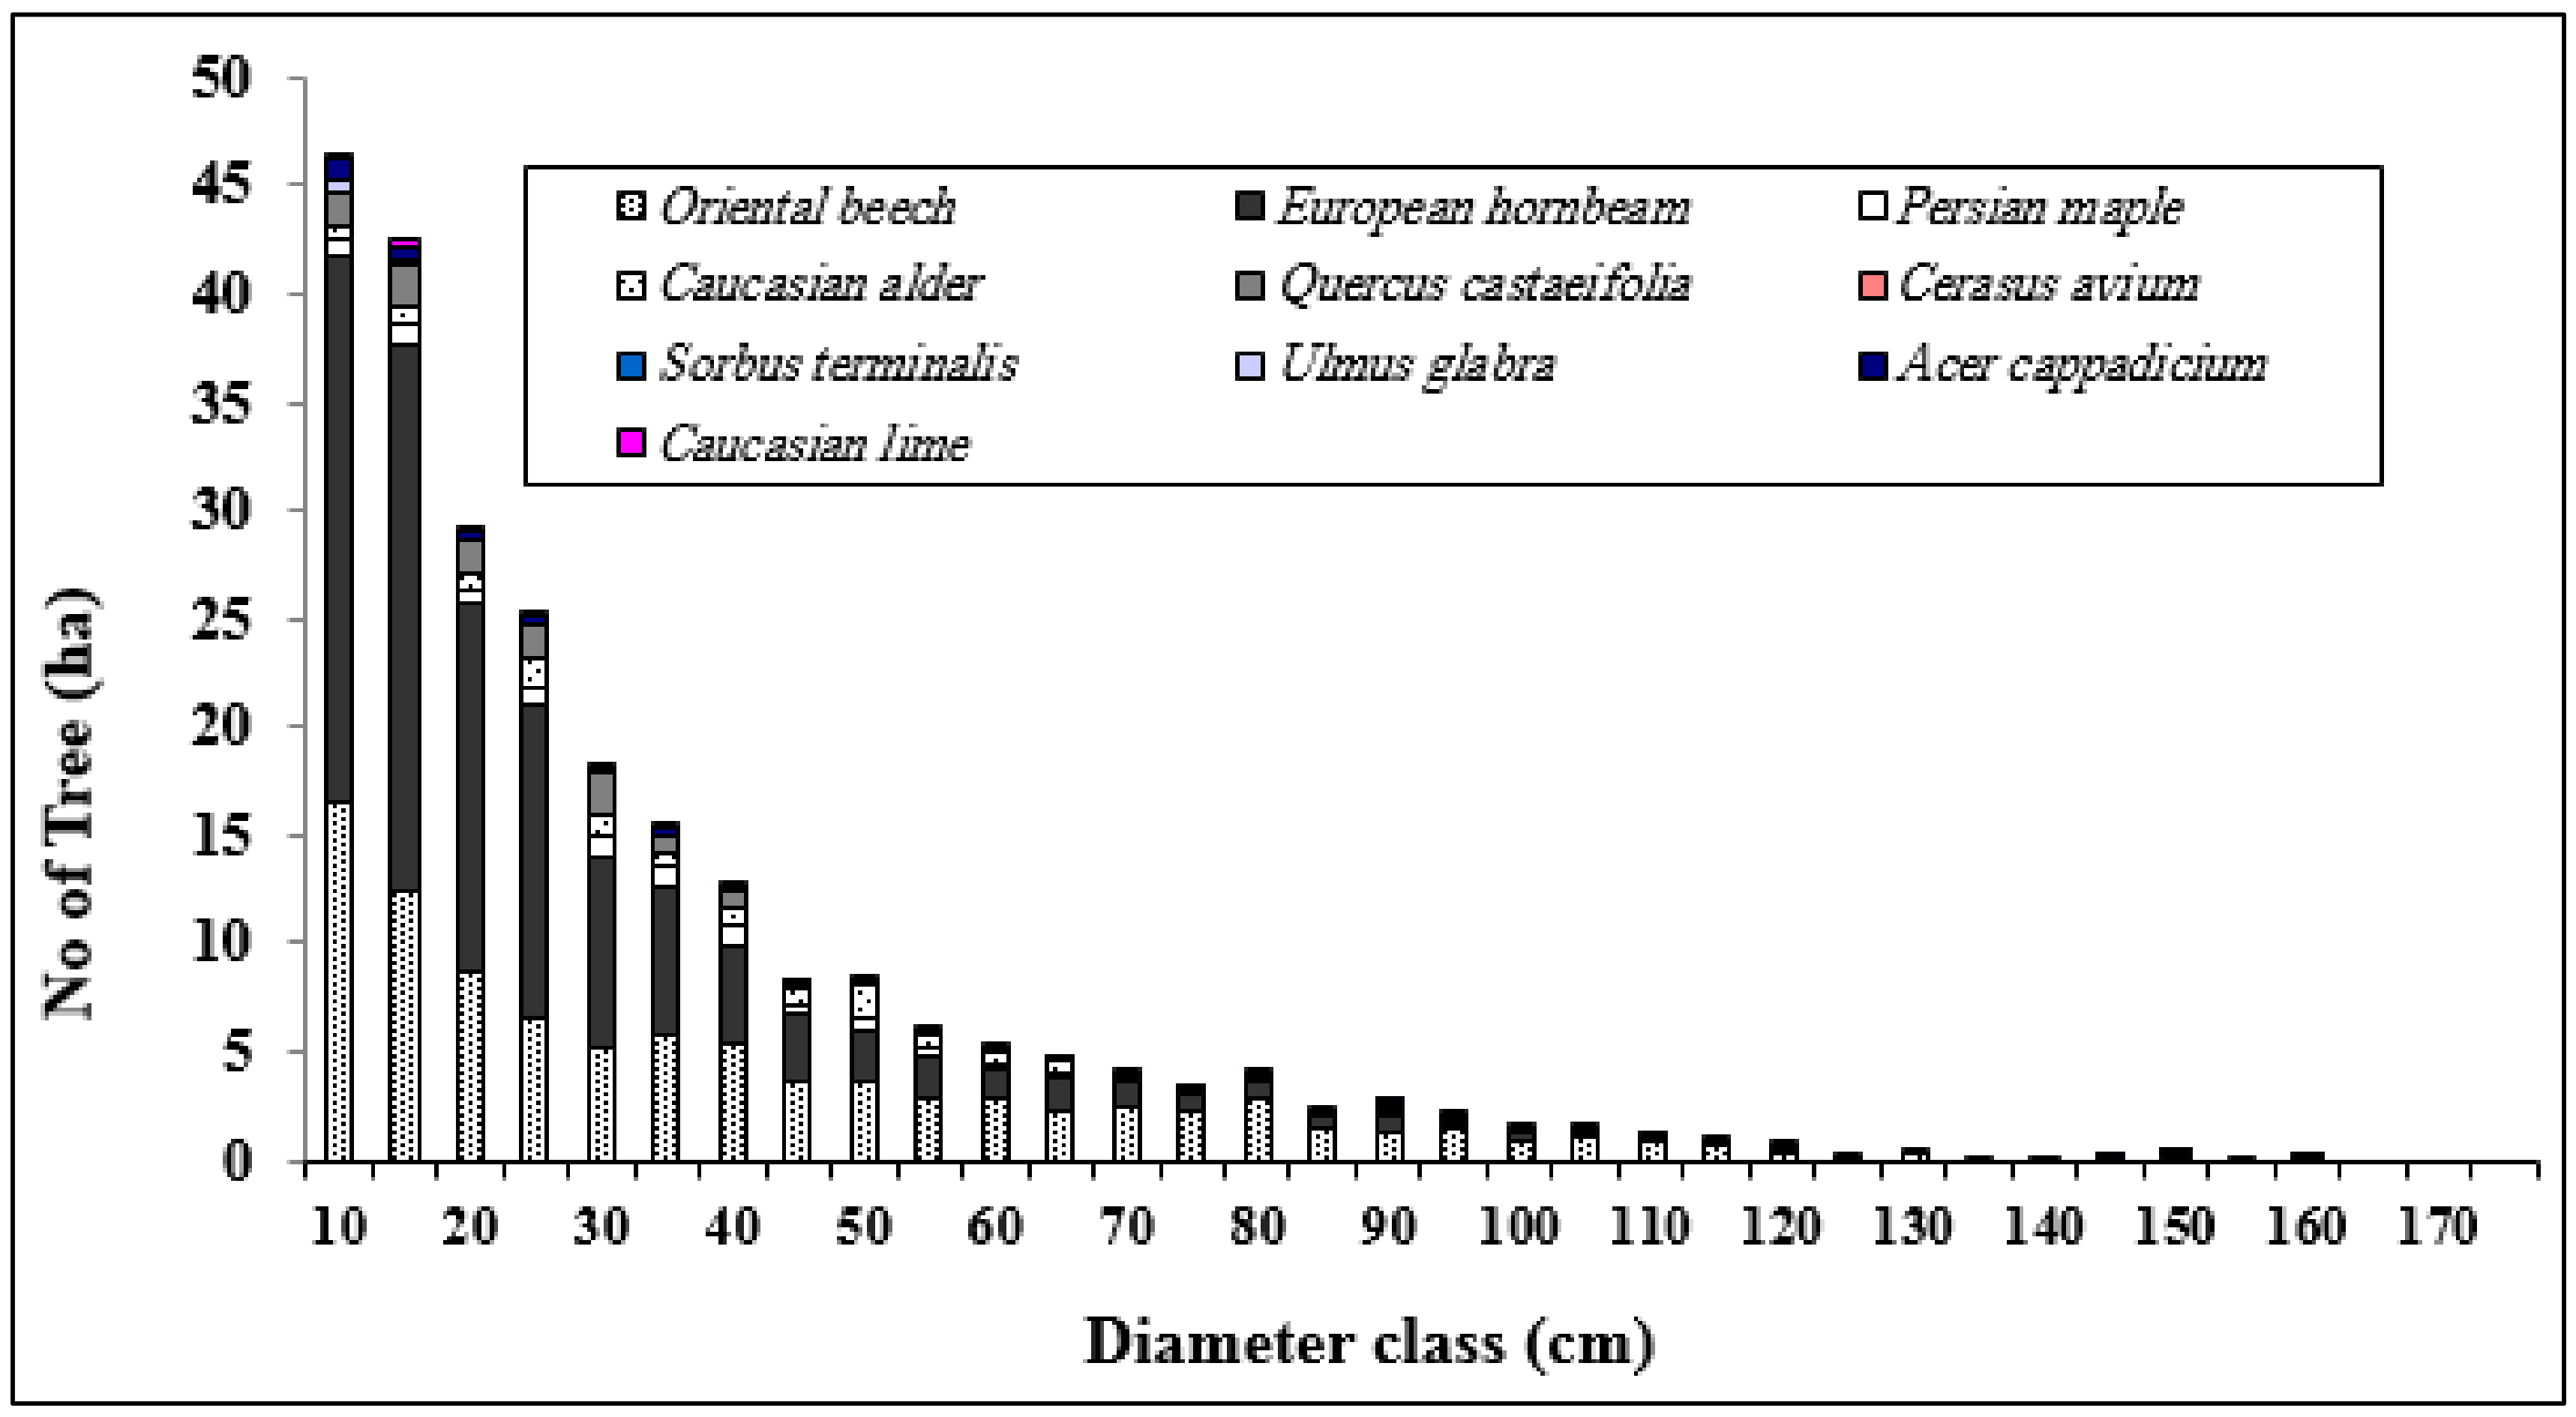
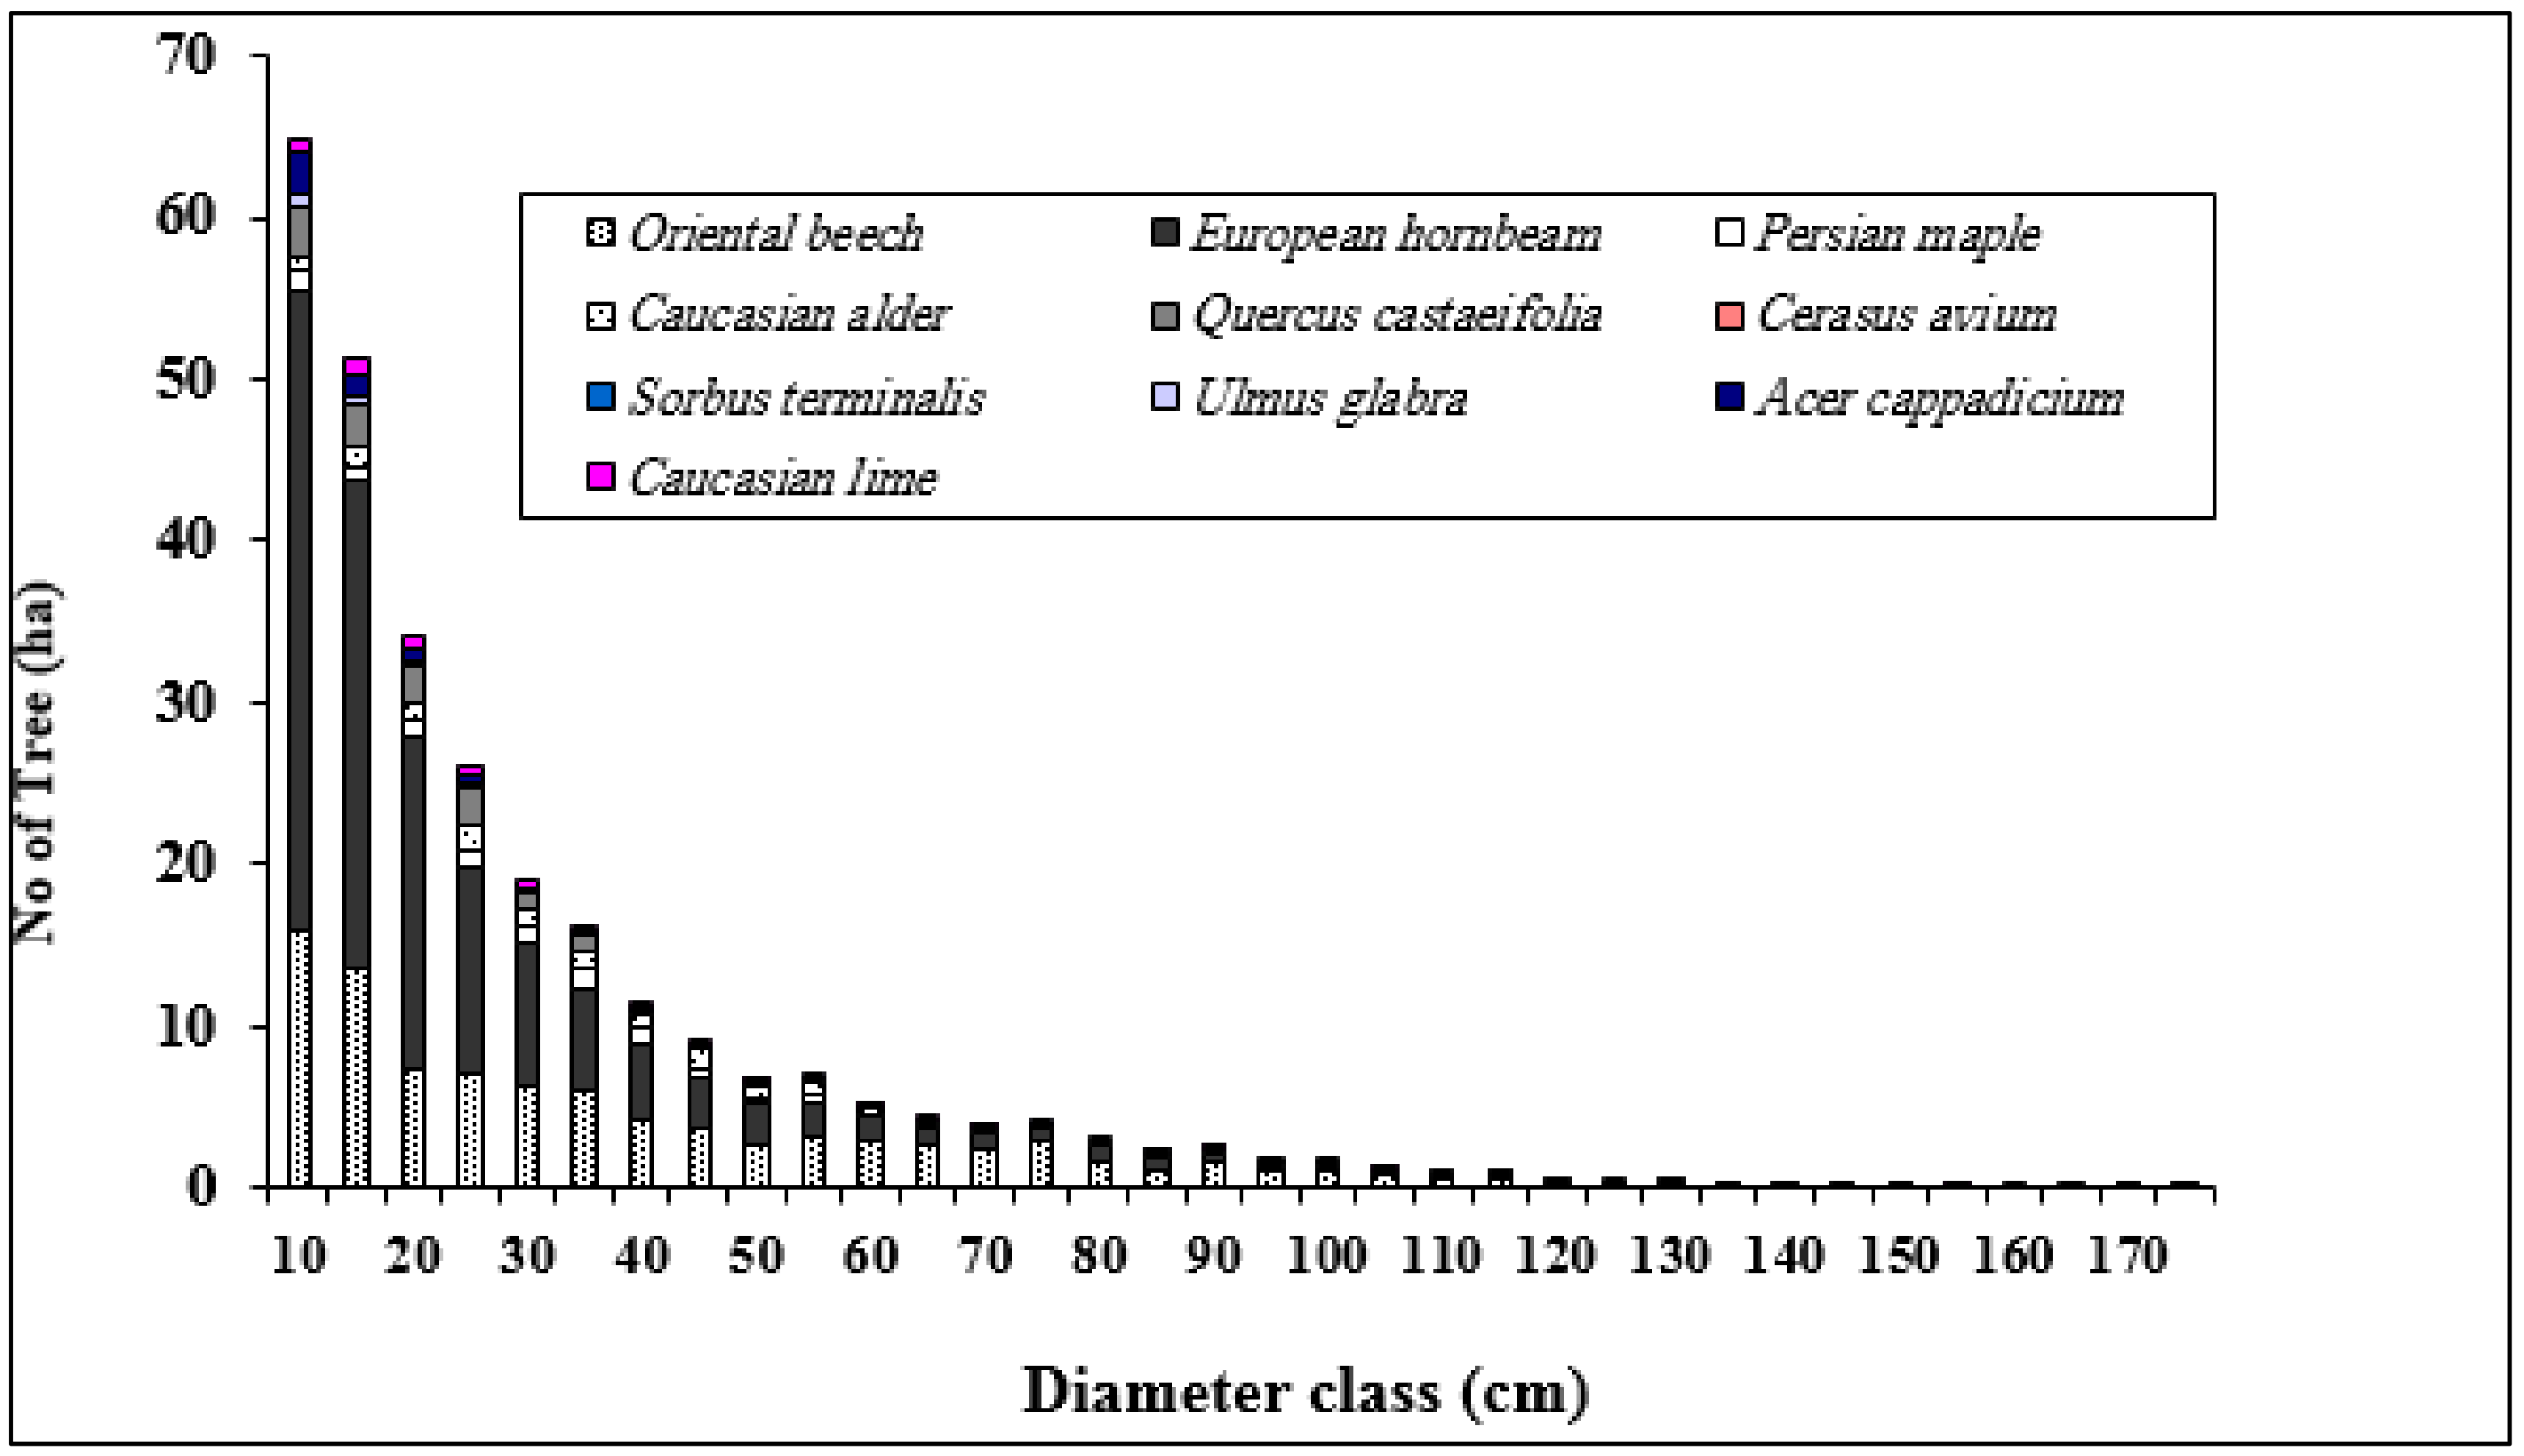
2.1. Study Area

Kheyroud educational-research forest is located in watershed 45 of northern forests in Mazandaran province of Iran. These forests range in elevation from zero to 2000 m above sea level [40]. Kheyroud forests in the forestry plan are been divided into eight districts including the Gorazbon district, which is third district and has 27 compartments (from 301 to 327). Of the 27 compartments, three (301 to 303) are designated for conservation and were not measured (Figure 1). This district lies between longitude of 51°36′30″ to 51°39′30″ and latitude of 0°32′36″ to 0°34′36″. Tree species of the district, according to the inventory, include Fagus orientalis, Quercus castaneifolia, Carpinus betulus, Acer cappadocicum, Acer velutinum, Alnus subcordata, and Tilia begonifolia [41]. Multi-purpose and close to nature forestry is used to manage Hyrcanian forests. The main goal in Hyrcanian forests is wood production and these forests are the only forests that can produce wood commercially in Iran. But in the study area, it has not been exploited in most parts and they are not logged or virgin forest. Just, three compartments including, compartment 305, 306 and 309, have been exploited [42].

2.2. Data Collection

The data used in modeling were obtained from two inventory periods (2003 and 2012) with permanent sample plots. In 2003, using a 200 × 150 m rectangular inventory grid with a random start, 256 permanent circular sample plots with an area of 0.1 ha were installed at Gorazbon district in the form of a systematic-random sample. Inside the sample plots, the diameter at breast height (DBH) of all living trees with a diameter more than 7.5 cm were measured using a caliper, recorded in inventory forms by one-centimeter classes. These operations were repeated after nine years. We used the same protocol for inventory and tree measuring as explained by Bayat et al. [43]. Tree species in forest stands were divided into four groups: beech (2215), hornbeam (3131), Chestnut-leaved oak (340), and other species (856). Using the data of these species, a matrix growth model was developed for four species groups.
Other data used in this study were recorded as specified in the Forestry Plan. According to the forestry plan of Gorazbon district, three compartments 305, 306, and 309 were logged before the inventory of 2012. Since the forestry plan was 10 years and the inventory period of our study was nine years, the statistics and data related to the forestry plan were multiplied by 0.9 before being used for modeling or comparison purposes. Thus, the projection matrix models were developed separately for the logged (305, 306 and 309) and unlogged compartments (other compartments). The stocking volume per hectare of each species group was calculated for each compartment (compartments under logging) using the volume functions developed by Bayat et al. [5]. In the unlogged compartments, the predicted volume values in the forestry plan were compared with the estimated volume of the present study. It should be noted that in this study three types of allowable cut have been computed, which include:
(A)
Operated allowable cut (OAC): is the by volume of trees harvested in three compartments of 305, 306 and 309 according to forestry plan.
(B)
Predicted allowable cut (PAC): is the amount of tree harvesting predicted when formulating a forestry plan for the whole district.
(C)
Estimated allowable cut (EAC): is the amount of tree harvesting that has been obtained in the present study.
In the above cases A and C, the number of trees was converted to volume values using volume functions presented by Bayat et al. [5].

2.3. Projection Matrix Model and Determination of Harvest Rate
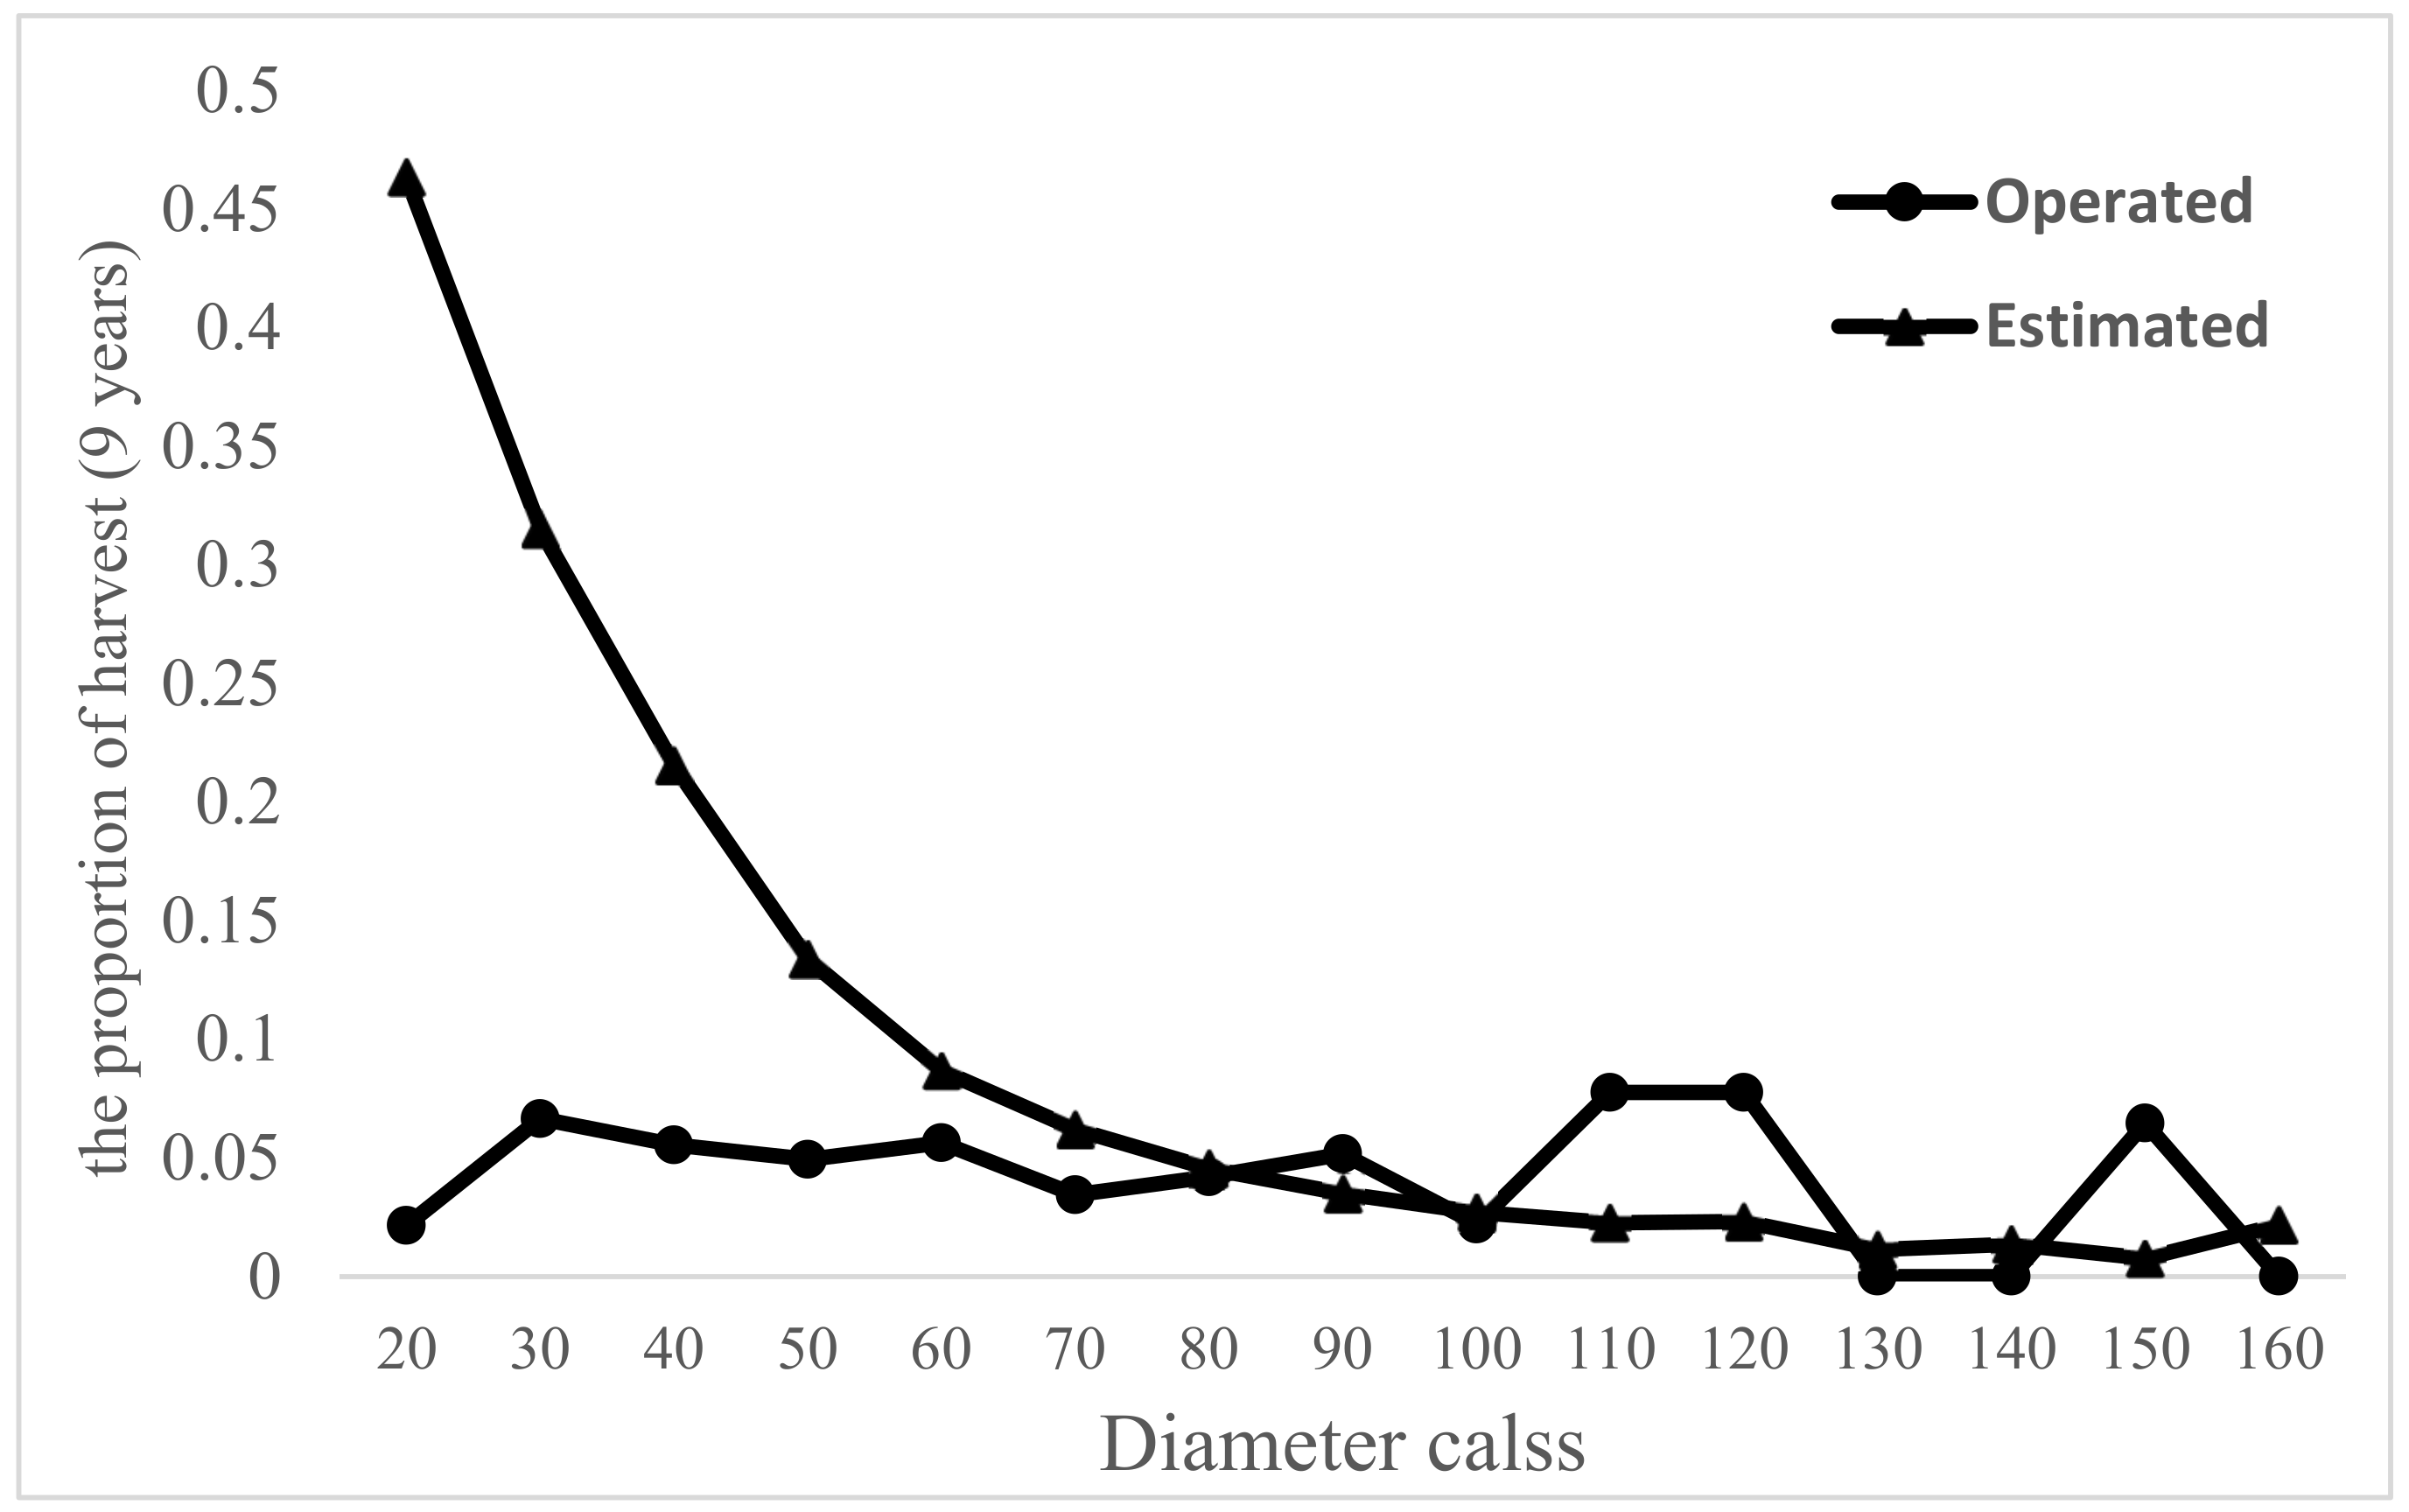
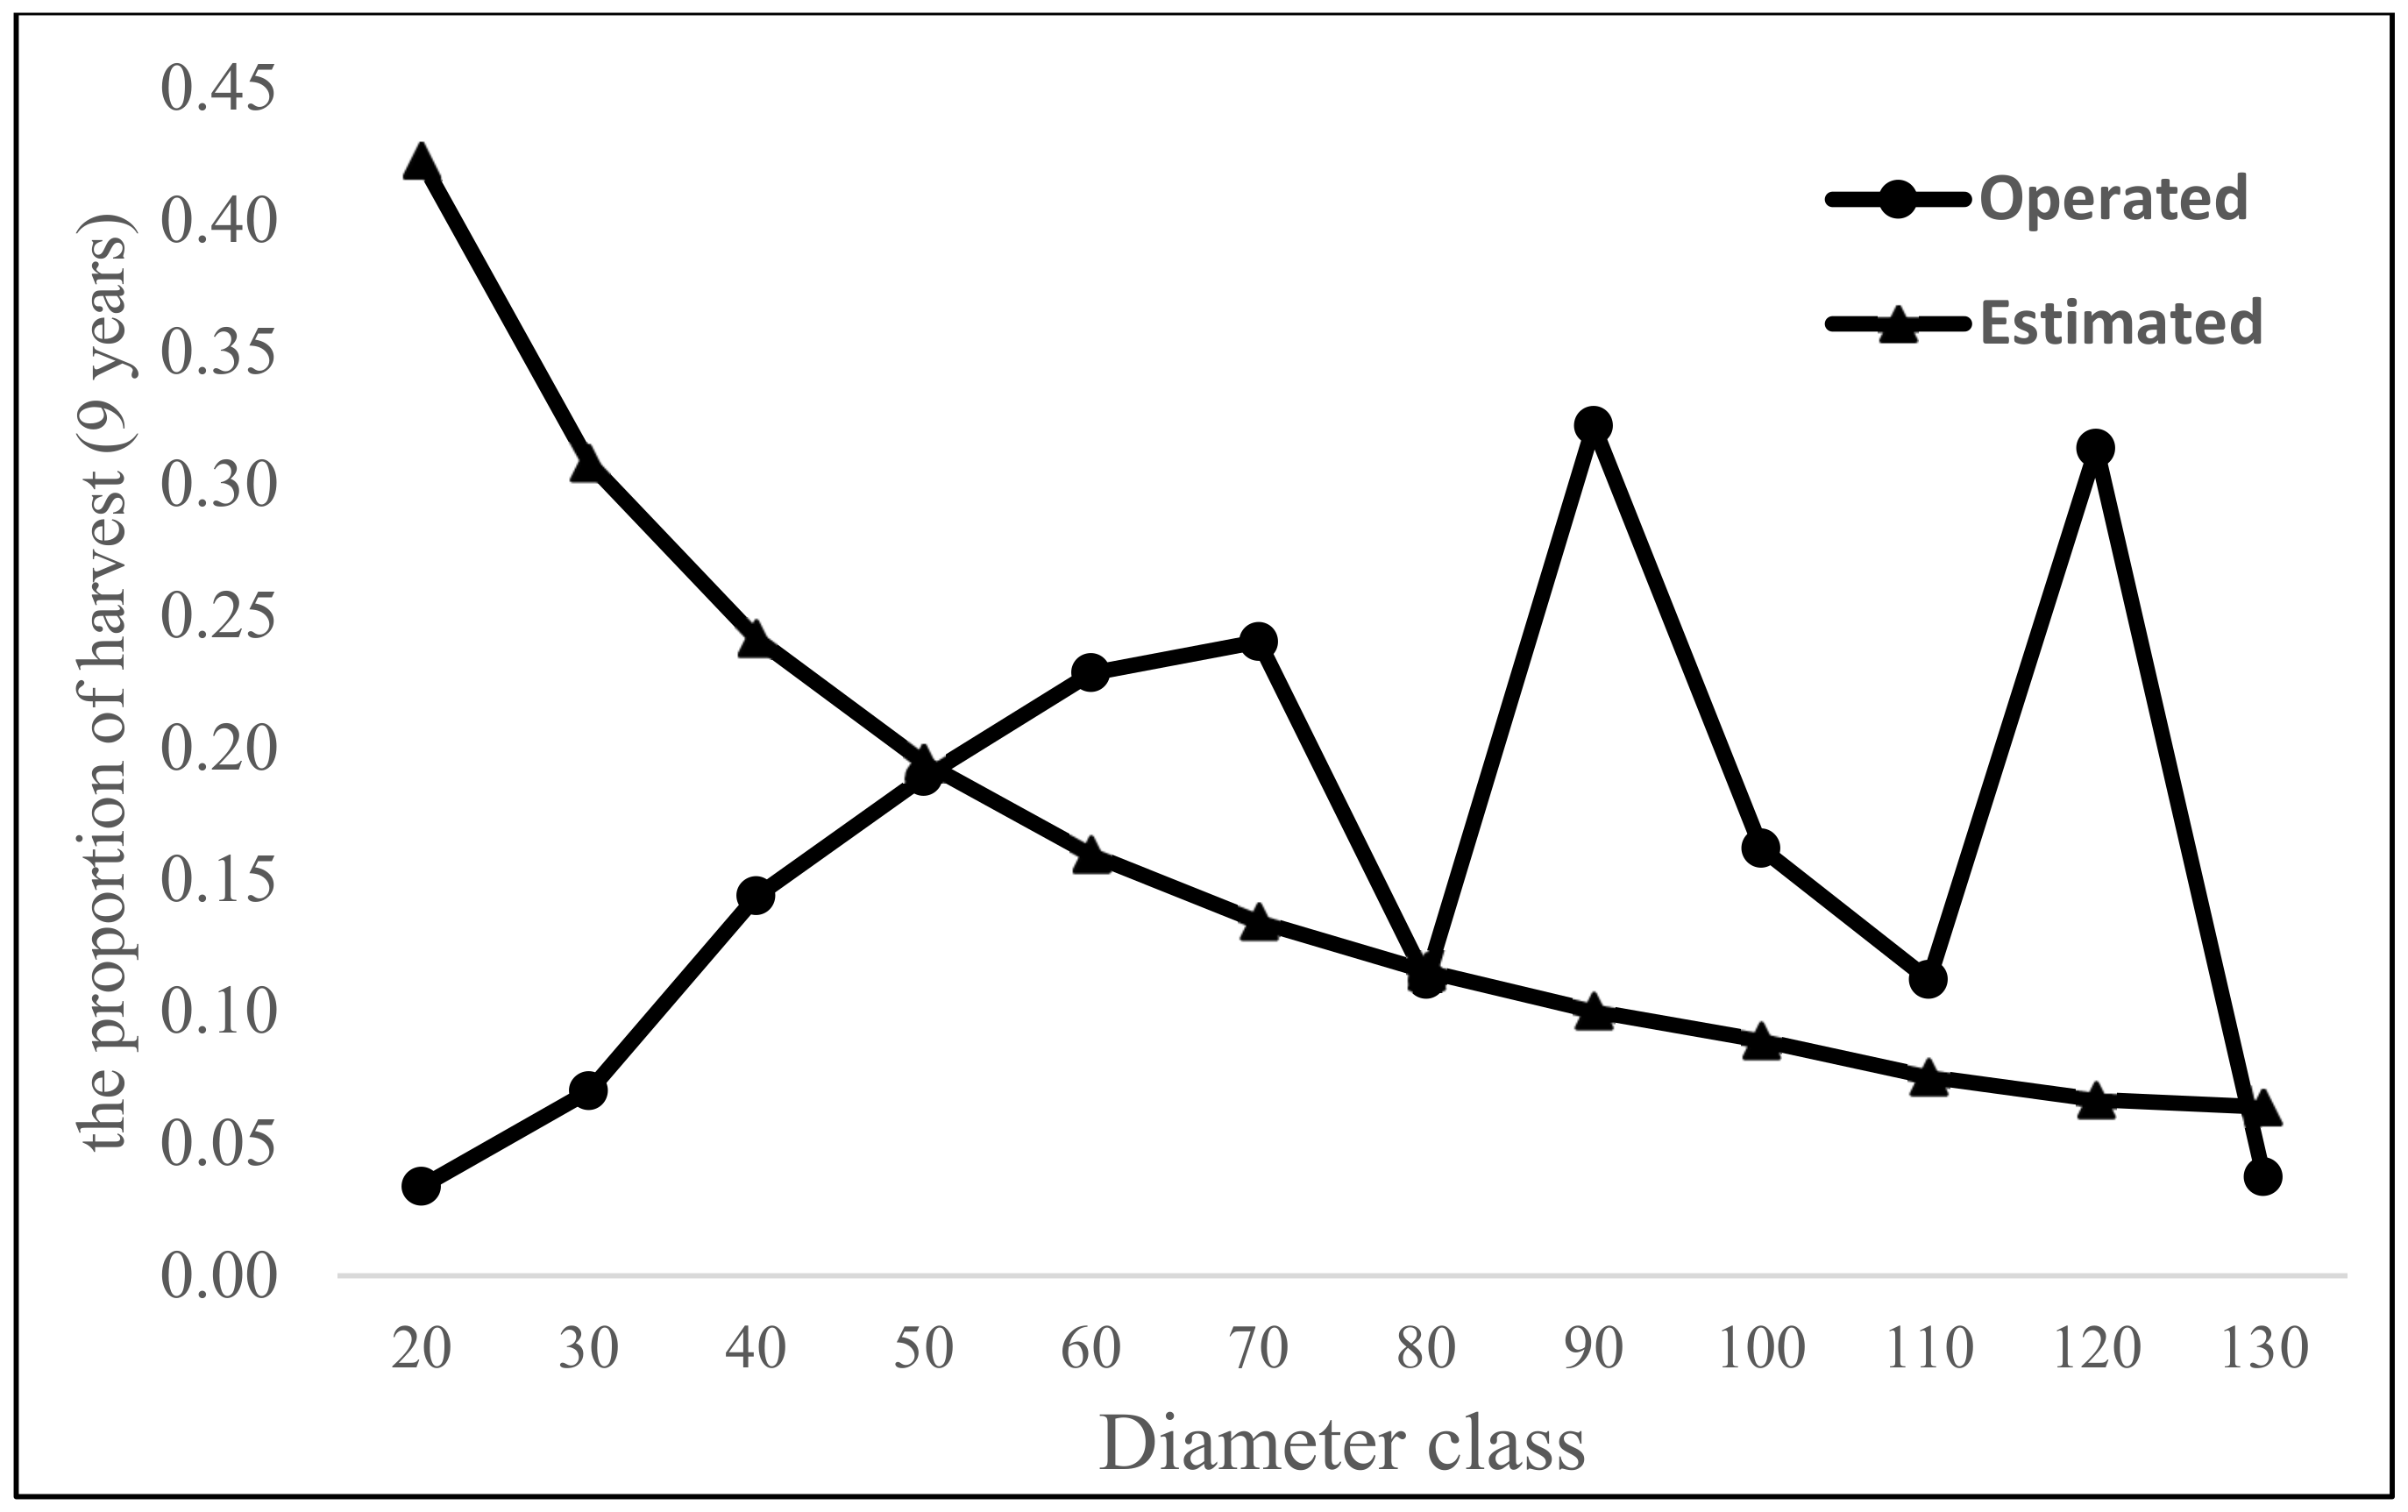
Gorazbon district has 27 compartments, three of which are protective and forestry plan does not include harvesting in them. According to the forestry plan of Gorazbon district, three compartments 305, 306, and 309 were logged before the inventory in 2012. Logged compartment means those logged during the inventory period. Projection matrix models were developed separately for three logged compartments and other unlogged compartments.
Significant improvements in computational environments and techniques have led to improvements and flexibility in forecasting models. For example, matrix models use transition matrices to estimate the dynamics of Ecol populations based on three main components including forest growth, mortality, and recruitment t [9,10,11].
Different models, including a projection matrix model, are available to predict the status of a forest stand based on the inventory periods in the permanent sample plots. In the matrix model, based two inventory periods (t, t + 1), the growth of forest stands is predicted for year t + 1. The matrix model was proposed by Buongiorno, Peyron, Houllier and Bruciamacchie [36]. For more information on matrix models and other models used in mixed and uneven- aged forests, please refer to Burkhart and Tomé [8]. The general relationship of this model, with modification to determine the harvest rate, is as follows [44,45]:
N t + 1 = G I H N t
where Nt+1 is the stem density (ha−1) in class-j at the final time of projection, I is identity matrix, Nt is the stem density (ha−1) in class-j at the initial time of projection, and H is diagonal matrix with the actual harvest rate.
In unlogged compartments harvest rate is estimated, but, in logged compartments, harvested volume is available and is estimated using forestry plan data. We estimated the forest growth between the two time periods (2003–2012) and used official tariff tables (volume tables) of the Kheyroud forest were converted into volume functions [5] for estimating harvested rate.G: transition matrix. This matrix shows how trees grow in a forest stand between two periods of time t and t + 1 by applying Equations (2) and (3) (i denotes species group or species and j indicates diameter class).
G = G 1 G 2 G n
G i = 1 p 1 r 2 r 3 r m 1 r m p 1 1 p 2 0 0 0 0 p 2 1 p 3 0 0 0 0 0 1 p m 1 0 0 0 0 p m 1 1   i = 1 ,   2 ,   ,   n   j = 1 ,   2 ,   ,   m 1
where rj is recruitment coefficients (the number of offspring’s living at time t + 1 of projection that were produced in the interval (t, t + 1) by an average tree in class j at time t). Pj is transition probabilities between two consecutive pair of diameter classes, which is separately calculated for each group from the following equation:
P j = D j d j D j D j 1
where Dj represents the diameter of the tree at the end of the period for a tree with diameter of dj. In Equation (4), instead of the numerator of fraction, the diameter increment of each tree from every species group can be computed. For this purpose, by using the results of Salehnasab, et al. [46], the diameter increment of each species group (Equations (5)–(8)) is placed in the numerator of Equation (4).
F a i d c y = exp ( 0.223 0.153 H d , y + 0.484 ln d c y 0.341 d c y 100 2 0.008 ln ( B A L c , y ) 0.108 g m , y ) + e c y
C i d c y = exp ( 0.1 0.005 B A L c y + 0.087 d c y 100 + 0.28 ln d c y ) + e c y
Q i d c y = exp ( 0.554 0.49 d c y 100 + 0.558 ln d c y + 0.004 B A L c y 0.076 H s , y ) + e c y
O i d c y = exp ( 0.099 0.337 d c y 100 + 0.361 ln d c y 0.002 B A L c , y 0.013 H s , y ) + e c y
where Fa, C, Q and O are beech, hornbeam, chestnut-leaved oak, and other species, respectively, and idcy is nine-year-old tree c from sample plot y (cm), d is diameter at breast height (cm), BAL is basal area of the largest trees (m2/ha), gm is mean of the basal area at sample plot (m2), and Hd is size diversity index, and Hs species diversity index (Table 1).
R is recruitment or the number of trees in the first diameter class in the second period; it is obtained as follows:
R = r 2 N 2 + r 3 N 3 + + r m N m = j = 1 m r j N j
where N is the number of tree species i in the class j per hectare and r is recruitment coefficients (the number of offsprings living at time t + 1 of projection that were produced in the interval (t, t + 1) by an average tree in class-j at time t). Past studies about regeneration rate of four groups of beech, hornbeam, chestnut-leaved oak, and other species were examined [47].
As can be seen in Equation (1), harvesting disrupts the normal growth of trees since the natural growth of trees is as follows:
N(t + 1) = GN(t)
which changes the natural transition matrix G to the perturbed G(I − H). Thus, if the matrices G and G(I − H) are primitive [44], and whenever the dominant eigenvalue of matrix G is λ0 > 1, the long-term sustainable harvest rates can be determined as the proportion of trees removed in each class so that the dominant eigenvalue of matrix G(I − H) is λ = 1 [44]. There are, of course, different harvesting strategies to meet these conditions. Some strategies focus on the largest diameter class. Thus, with increasing diameter, the probability of a tree being harvested increases [44]. The strategy used in this model was to obtain the three main conditions proposed in the study of Torres, Belda, Pérez, and Fernández [45], which result in a stable diameter distribution. In this strategy, in order to perform a harvesting operation, the dominant eigenvalue λ of matrix G must always be greater than one (λ0 > 1), and the harvest from the forest stand will continue as long as the dominant eigenvalue of matrix G(I − H) is equal to one. Also, through solving GW0 = λW0 and obtaining to the right eigenvector W0 corresponding to the dominant eigenvalue λ0 of the matrix G, the stable diameter distribution is defined and then the long-term dynamic of harvested trees is also achieved. Therefore, by solving the linear system of GHW0 = (λ0 − 1) W0, the above conditions are rewritten to maintain a sustainable harvest rate. Finally, using Equation (11), the harvest rate is estimated.
λ 0 = 1 1 H
Then, by dividing the eigenvector (W0) by the number of trees in each diameter class, the harvest proportion is obtained. In order to validate the projection matrix model, Chi-square test was used and data were analyzed using MATLAB version 2016 and EXCEL.

3. Results

Table 2 shows the number of trees that were logged in the three mentioned compartments.
According to Table 2 and Table 3, the operated allowable cut was more than the predicted allowable cut. The highest rate of operated allowable cut (number and volume) was for hornbeam species and the least rate for chestnut-leaved oak species. According to the forestry plan, the highest volume of operated allowable cut was for compartment 309.
The first step in developing a projection matrix model was to determine the size of the diameter classes. Considering the high being of maximum diameter in the studied forest stands which causes an increase in number of diameter classes, the width between classes was considered 10 cm. The next step was to consider the individual-tree diameter increment model, which was obtained from the research of Salehnasab et al., [46]. Then, a matrix model was developed for each species group separately. Given that the chestnut-leaved oak group has not been logged during the period (Table 2 and Table 3), comparisons between model estimates and operated allowable cut could not be made.
Initially, a growth model was presented for all species groups in the logged compartments (compartments of 305, 306, and 309) to obtain an estimated allowable cut, and thus a comparison was made between the operated and estimated volumes of allowable cut. The trees of each species group were divided into different number of diameter classes according to their diameter class width and their transition matrix was obtained using Equation (3), with transition probabilities values (PJ) shown in Table 4.
Then, using the transition matrix, the number trees in diameter classes (Nt+1) was estimated. Afterwards, Chi-square test was used to evaluate the fitted models. The results showed that at 0.01 level, there was no significant difference between operated and estimated Nt+1 by models (in all species groups). Therefore, the resulting model was accepted and used to calculate the eigenvector.
Using the transition matrix, the highest eigenvalues for all species groups were obtained in both groups of compartments and by using the Equation (11), an estimated nine-year harvest rate was obtained (Table 5).
Comparison of the results of Table 3 and Table 5 (compartments 305, 306, and 309) showed that a nine-year estimated allowable cut of the present study was equal to operated allowable cut of beech group. Thus, according to the initial assumptions of the study, the operated allowable cut of beech group was stable.
The results showed that for the hornbeam group volume of operated allowable cut is much higher than estimated allowable cut and its dominant eigenvalue is 0.91. Whereas, for chestnut-leaved oak group and other species group, the estimated allowable cut was higher and the re-computed dominant eigenvalue is more than one.
In order to stabilize the diameter distribution after harvesting, according to the equation GW0 = λW0, the eigenvector corresponding to the dominant eigenvalue was calculated for four species groups (logged compartments). This vector represents the permitted trees for harvesting per diameter class, and thus the diameter distribution of the stand remains stable over the long-term. Therefore, by having the W0 values and dividing them by the number of trees in each diameter class (Nt), the harvesting proportion was obtained per diameter class (Figure 2, Figure 3 and Figure 4) Here, the harvesting proportion refers to the harvesting of wood from all diameter classes, not just larger diameter classes or trees. The results indicated that in the long-term the diameter distribution of the forest stands change.
Summary of the three logged compartments showed that the sum of operated allowable cut (with coefficient of 0.9) and estimated allowable cut of the nine-year model were 2708.847 m3 and 2415.41 m3, respectively. The results of the study depict that the sum of operated allowable cut of all groups was higher than estimated allowable cut (Table 5). The dominant eigenvalue of the transition matrix of all groups, with regard to logging, was estimated to be less than one (0.964). Finally, for three compartments the annual estimated allowable cut is 3.03 m3/ha.
In the unlogged compartments, the sum of the predicted (with a coefficient of 0.9) and estimated allowable cut (with a total harvest rate of 0.076) were 18,864 and 17,772.92 m3, respectively. Predicted volumes are higher than the estimated volumes, for these compartments (unlogged), the annual estimated allowable cut is 2.72 m3/ha.
The diameter distribution of trees sampled in the study area, for the first and second measurement periods. follows the typical reverse-J shaped frequency distributions of uneven-aged forests. The results indicate that exploitation during the period did not cause damage to the forest and the curve at the beginning and end of the period is almost the same. (Figure 5 and Figure 6).

4. Discussion

In this study, the allowable cut was estimated based on the net increment rate. Since this estimation was based on net increment, with the help of matrix models, it is therefore more reliable than other indirect estimation methods as suggested by Sterba [48]. Dividing the forest species into four groups, with different values of diameter growth, resulted in different allowable cut estimates for each species group (Table 5).
The study area was stratified into logged and unlogged areas. Harvest rate for each species group was estimated to be higher in the logged compartments. Harvesting rate for the four groups of beech, hornbeam, chestnut-leaved oak and other species in the logged and unlogged areas were (0, 0.075, 0.108, and negative) and (0.06, 0.079, 0.101, and 0.067), respectively. Also, the overall harvest rates for the logged and unlogged compartments were estimated 0.085 (3.03 m3/ha) and 0.076 (2.72 m3/ha), respectively. Due to differences of species proportions, estimated harvest rates were different for two compartment groups. The highest harvest rate belonged to chestnut-leaved oak group (0.1 and 0.08 M3/ha per year). However, due to the volume inventory information at the beginning of the period, the highest value of harvest rate was for the beech group (1.26 m3/ha per year).
Mohadjer, et al. [49] estimated the allowable cut of different forest types and the annual harvest for beech-hornbeam type using methods of Meyer were 6.56 and 5.32 m3, respectively, which has significant differences with the results of the present study. Also, for the mixed type (which can be compared with the total volume of harvest), the annual harvest per hectare was estimated to be 3.75 m3/ha, which is more than the findings of the present study (2.72 m3/ha per year). Therefore, the findings of our study suggest that, compared to other methods, the projection matrix model estimates allowable cut lower and closer to the net increment, and thus can prevent the possible consequences of harvest over increment of the single-selection method. Forest cutting is used as a tool for forest cultivation (biological production) and wood harvesting (mechanical production) and leads the forest toward desirable quantitative and qualitative production [50]. To use this tool properly, it is necessary to accurately estimate the allowable cut [51]. Given such importance of the allowable cut, for each forest type based on their species and increment rate and other influential characteristics, it is necessary to perform comprehensive studies to determine an appropriate method for estimation of allowable cut in any forest area.
In addition, the matrix model helps managers to maintain a stable forest diameter distribution by presenting the eigenvector corresponding to the dominant eigenvalue. As the results of this study showed, tree harvesting in three compartments has caused changes in the diameter distribution of the stand in the long-term (Figure 2, Figure 3 and Figure 4). As these figures show, for both beech and hornbeam species, the proportion of harvested larger- diameter trees was higher than the permitted values. The presence of thick, old trees makes the stands more resistant against adverse natural effects. In addition, the single-selection method may result in structural consequences including homogeneity of canopy structure [52], density reduction [53,54], reducing the total basal area of stand [55], reducing the number of thick trees [52,54], and ultimately reducing the forest biomass [56]. Tree marking (for cutting) in the compartments of a district should fully consider the regeneration, quantitative and qualitative increase of forest stand’s volume, enhancing the stability of young stands, and creating, completing and expanding the natural regeneration.
In uneven-aged forest stands, cuttings should contribute to proper or better distribution of trees (horizontal and vertical) in the forest. Therefore, computing a harvest eigenvector in the diameter classes is a good guide to the tree-markers for cutting purposes. The findings of this research can be useful for managers who consider optimizing production with respect to the potential and specific characteristics of forests [57] in uneven- aged scenarios. Since cutting is considered as a tool for production and regeneration in natural forests, the use of suitable allowable cut methods will result in continuity of production, economic efficiency and sustainability of the forest. Faulty decision-making in management of these forest stands can compromise the continuity and sustainability of valuable industrial species in the natural forests. Although findings from this study are based on data from one forest area, the research methodology showed be applicable when modeling other uneven-aged mixed forest types.
To improve the accuracy and reliability of the outcomes, future research may utilize more accurate data provided by remotely sensed data that has proven efficiency in many scientific fields [58,59,60,61].

5. Conclusions

Since this study for the first time investigated the use of projection matrix models in Hyrcanian forests, we attempted to introduce the most obvious benefit of these models. Nowadays, projection matrix models are one of the tools for forest monitoring since they provide a clear assessment from the primary and secondary status and behavior of the stand, awareness of forest status helps managers not only in harvesting scenarios but also in other contexts e.g., forest health so on. applying proper management tools such as projection matrix models, it will be easier to make pertinent scientific assumptions on forest management and planning. The results showed that the total operated allowable cut (OAC) in logged compartments was more than the estimated allowable cut (EAC). In unlogged compartments, the total predicted allowable cut (PAC) was more than EAC. A comparison of EAC and OAC showed that hornbeam has been harvested more than its potential. However, chestnut-leaved oak and other species group have depicted opposite trends. Our models provide important advancements for estimating allowable cut, and thus can enhance the goal of practicing sustainable forestry.

Author Contributions

Conceptualization: A.S. and M.B.; data collection: A.S., M.B. and H.E.B.; formal analysis: A.S., H.E.B., B.K., S.H. and H.U.M.A. Validation: A.S., M.B. and H.U.M.A.; writing—original draft: all authors; funding acquisition: H.E.B. All authors have read and agreed to the published version of the manuscript.

Funding

This research received no external funding.

Institutional Review Board Statement

Not applicable.

Informed Consent Statement

Not applicable.

Data Availability Statement

The data presented in this study will be available on interested request from the corresponding author.

Conflicts of Interest

The authors declare no conflict of interest.

References

  1. Li, W.; Shi, Y.; Zhu, D.; Wang, W.; Liu, H.; Li, J.; Shi, N.; Ma, L.; Fu, S. Fine root biomass and morphology in a temperate forest are influenced more by the nitrogen treatment approach than the rate. Ecol. Indic. 2021, 130, 108031. [Google Scholar] [CrossRef]
  2. O’hara, K.L.; Hasenauer, H.; Kindermann, G. Sustainability in multi-aged stands: An analysis of long-term plenter systems. Forestry 2007, 80, 163–181. [Google Scholar] [CrossRef] [Green Version]
  3. Geng, M.; Ma, K.; Sun, Y.; Wo, X.; Wang, K. Changes of land use/cover and landscape in Zhalong wetland as “red-crowned cranes country”, Heilongjiang province, China. Glob. Nest J. 2020, 22, 477. [Google Scholar]
  4. Hamidi, S.K.; Zenner, E.K.; Bayat, M.; Fallah, A. Analysis of plot-level volume increment models developed from machine learning methods applied to an uneven-aged mixed forest. Ann. For. Sci. 2021, 78, 4. [Google Scholar] [CrossRef]
  5. Bayat, M.; Pukkala, T.; Namiranian, M.; Zobeiri, M. Productivity and optimal management of the uneven-aged hardwood forests of Hyrcania. Eur. J. For. Res. 2013, 132, 851–864. [Google Scholar] [CrossRef]
  6. Rayner, M.; Turner, B. Growth and yield modelling of Australian eucalypt forests I. Historical development. Aust. For. 1990, 53, 224–237. [Google Scholar] [CrossRef]
  7. Orrego, S.; Montes, C.; Restrepo, H.I.; Bullock, B.P.; Zapata, M. Modeling height growth for teak plantations in Colombia using the reducible stochastic differential equation approach. J. For. Res. 2021, 32, 1035–1045. [Google Scholar] [CrossRef]
  8. Burkhart, H.E.; Tomé, M. Modeling Forest Trees and Stands; Springer Science & Business Media: Berlin/Heidelberg, Germany, 2012. [Google Scholar]
  9. Solomon, D.S.; Hosmer, R.A.; Hayslett, H.T., Jr. A two-stage matrix model for predicting growth of forest stands in the Northeast. Can. J. For. Res. 1986, 16, 521–528. [Google Scholar] [CrossRef]
  10. Liang, J.; Picard, N. Matrix model of forest dynamics: An overview and outlook. For. Sci. 2013, 59, 359–378. [Google Scholar] [CrossRef]
  11. Ma, W.; Domke, G.M.; D’Amato, A.W.; Woodall, C.W.; Walters, B.F.; Deo, R.K. Using matrix models to estimate aboveground forest biomass dynamics in the eastern USA through various combinations of LiDAR, Landsat, and forest inventory data. Environ. Res. Lett. 2018, 13, 125004. [Google Scholar] [CrossRef]
  12. Lewis, E. On the Generation and Growth of a Population Mathematical Demography; Springer: Berlin/Heidelberg, Germany, 1942. [Google Scholar]
  13. Leslie, P.H. On the use of matrices in certain population mathematics. Biometrika 1945, 33, 183–212. [Google Scholar] [CrossRef]
  14. Usher, M. A matrix model for forest management. Biometrics 1969, 25, 309–315. [Google Scholar] [CrossRef]
  15. Keyfitz, N.; Caswell, H. Applied Mathematical Demography; Springer: Berlin/Heidelberg, Germany, 2005; Volume 47. [Google Scholar]
  16. Huenneke, L.F.; Marks, P. Stem dynamics of the shrub Alnus incana ssp. rugosa: Transition matrix models. Ecology 1987, 68, 1234–1242. [Google Scholar] [CrossRef]
  17. Manders, P. A transition matrix model of the population dynamics of the Clanwilliam cedar (Widdringtonia cedarbergensis) in natural stands subject to fire. For. Ecol. Manag. 1987, 20, 171–186. [Google Scholar] [CrossRef]
  18. Alvarez-Buylla, E.R.; Slatkin, M. Finding confidence limits on population growth rates: Three real examples revised. Ecology 1994, 75, 255–260. [Google Scholar] [CrossRef]
  19. Liang, J.; Buongiorno, J.; Monserud, R.A. Bootstrap simulation and response surface optimization of management regimes for Douglas-fir/western hemlock stands. For. Sci. 2006, 52, 579–594. [Google Scholar]
  20. Liang, J.; Zhou, M. A geospatial model of forest dynamics with controlled trend surface. Ecol. Model. 2010, 221, 2339–2352. [Google Scholar] [CrossRef]
  21. Synek, M.; Hrib, M. Analysing data sources’ suitability to support forest policy decision-making in the Czech Republic. Int. For. Rev. 2019, 21, 92–107. [Google Scholar] [CrossRef]
  22. Liang, J.; Zhou, M.; Verbyla, D.L.; Zhang, L.; Springsteen, A.L.; Malone, T. Mapping forest dynamics under climate change: A matrix model. For. Ecol. Manag. 2011, 262, 2250–2262. [Google Scholar] [CrossRef]
  23. Hoffmann, W.A. Fire and population dynamics of woody plants in a neotropical savanna: Matrix model projections. Ecology 1999, 80, 1354–1369. [Google Scholar] [CrossRef]
  24. Schmidt, I.B.; Mandle, L.; Ticktin, T.; Gaoue, O.G. What do matrix population models reveal about the sustainability of non-timber forest product harvest? J. Appl. Ecol. 2011, 48, 815–826. [Google Scholar] [CrossRef]
  25. Van der Werf, E.; Indrajaya, Y.; Mohren, F.; van Ierland, E.C. Logging damage and injured tree mortality in tropical forest management. Nat. Resour. Model. 2019, 32, e12210. [Google Scholar]
  26. Gourlet-Fleury, S.; Cornu, G.; Jésel, S.; Dessard, H.; Jourget, J.-G.; Blanc, L.; Picard, N. Using models to predict recovery and assess tree species vulnerability in logged tropical forests: A case study from French Guiana. For. Ecol. Manag. 2005, 209, 69–85. [Google Scholar] [CrossRef]
  27. Picard, N.; Franc, A. Aggregation of an individual-based space-dependent model of forest dynamics into distribution-based and space-independent models. Ecol. Model. 2001, 145, 69–84. [Google Scholar] [CrossRef]
  28. Verzelen, N.; Picard, N.; Gourlet-Fleury, S. Approximating spatial interactions in a model of forest dynamics as a means of understanding spatial patterns. Ecol. Complex. 2006, 3, 209–218. [Google Scholar] [CrossRef]
  29. Picard, N.; Bar-Hen, A.; Gourlet-Fleury, S. Estimator of upgrowth transition rates for size-classified matrix from small samples. Ecol. Model. 2007, 204, 59–69. [Google Scholar] [CrossRef]
  30. Van Nes, E.H.; Scheffer, M. A strategy to improve the contribution of complex simulation models to ecological theory. Ecol. Model. 2005, 185, 153–164. [Google Scholar] [CrossRef]
  31. Huston, M.; DeAngelis, D.; Post, W. New computer models unify ecological theory: Computer simulations show that many ecological patterns can be explained by interactions among individual organisms. BioScience 1988, 38, 682–691. [Google Scholar] [CrossRef]
  32. Grimm, V.; Railsback, S.F. Individual-based modeling and ecology. In Individual-Based Modeling and Ecology; Princeton University Press: Princeton, NJ, USA, 2013. [Google Scholar]
  33. Grimm, V. Ten years of individual-based modelling in ecology: What have we learned and what could we learn in the future? Ecol. Model. 1999, 115, 129–148. [Google Scholar] [CrossRef]
  34. Haight, R.G. Evaluating the efficiency of even-aged and uneven-aged stand management. For. Sci. 1987, 33, 116–134. [Google Scholar]
  35. Haight, R.G.; Monserud, R.A. Optimizing any-aged management of mixed-species stands: II. Effects of decision criteria. For. Sci. 1990, 36, 125–144. [Google Scholar]
  36. Buongiorno, J.; Peyron, J.-L.; Houllier, F.; Bruciamacchie, M. Growth and management of mixed-species, uneven-aged forests in the French Jura: Implications for economic returns and tree diversity. For. Sci. 1995, 41, 397–429. [Google Scholar]
  37. Tahvonen, O.; Pukkala, T.; Laiho, O.; Lähde, E.; Niinimäki, S. Optimal management of uneven-aged Norway spruce stands. For. Ecol. Manag. 2010, 260, 106–115. [Google Scholar] [CrossRef]
  38. Sist, P.; Picard, N.; Gourlet-Fleury, S. Sustainable cutting cycle and yields in a lowland mixed dipterocarp forest of Borneo. Ann. For. Sci. 2003, 60, 803–814. [Google Scholar] [CrossRef]
  39. Hamidi, S.K.; Weiskittel, A.; Bayat, M.; Fallah, A. Development of individual tree growth and yield model across multiple contrasting species using nonparametric and parametric methods in the Hyrcanian forests of northern Iran. Eur. J. For. Res. 2021, 140, 421–434. [Google Scholar] [CrossRef]
  40. Bourque, C.P.-A.; Bayat, M.; Zhang, C. An assessment of height–diameter growth variation in an unmanaged Fagus orientalis-dominated forest. Eur. J. For. Res. 2019, 138, 607–621. [Google Scholar] [CrossRef]
  41. Bayat, M.; Burkhart, H.; Namiranian, M.; Hamidi, S.K.; Heidari, S.; Hassani, M. Assessing biotic and abiotic effects on biodiversity index using machine learning. Forests 2021, 12, 461. [Google Scholar] [CrossRef]
  42. Bourque, C.P.-A.; Bayat, M. Landscape variation in tree species richness in northern Iran forests. PLoS ONE 2015, 10, e0121172. [Google Scholar] [CrossRef]
  43. Bayat, M.; Bettinger, P.; Hassani, M.; Heidari, S. Ten-year estimation of Oriental beech (Fagus orientalis Lipsky) volume increment in natural forests: A comparison of an artificial neural networks model, multiple linear regression and actual increment. For. Int. J. For. Res. 2021, 94, 598–609. [Google Scholar] [CrossRef]
  44. López, I.; Ortuño, S.F.; Martín, Á.J.; Fullana, C. Estimating the sustainable harvesting and the stable diameter distribution of European beech with projection matrix models. Ann. For. Sci. 2007, 64, 593–599. [Google Scholar] [CrossRef] [Green Version]
  45. Torres, I.L.; Belda, C.F.; Pérez, S.O.; Fernández, A.M. Choosing Fagus sylvatica L. matrix model dimension by sensitivity analysis of the population growth rate with respect to the width of the diameter classes. Ecol. Model. 2008, 218, 307–314. [Google Scholar] [CrossRef]
  46. Salehnasab, A.; Bayat, M.; Namiranian, M.; Khaleghi, B.; Omid, M.; Masood Awan, H.U.; Al-Ansari, N.; Jaafari, A. Machine Learning for the Estimation of Diameter Increment in Mixed and Uneven-Aged Forests. Sustainability 2022, 14, 3386. [Google Scholar] [CrossRef]
  47. Amoli Kondori, A.; Marvi Mohajer, M.R.; Zobeiri, M.; Etemad, V. Natural regeneration of tree species in ralation to gap charactristics in natural beech (Fagus orientalis Lipsky) stand, north of Iran. Iran. J. For. Poplar Res. 2012, 20, 151–164. [Google Scholar]
  48. Sterba, H. Forest inventories and growth models to examine management strategies for forests in transition. Forestry 2002, 75, 411–418. [Google Scholar] [CrossRef]
  49. Mohadjer, M.M.; Zobeiri, M.; Etemad, V.; Gholami, M.J. Performing the single selection method at compartment level and necessity for full inventory of tree species (case study: Gorazbon district in Kheyroud forest). Iran. J. Nat. Resour. 2009, 61, 889–908. [Google Scholar]
  50. Bayat, M.; Bettinger, P.; Heidari, S.; Hamidi, S.K.; Jaafari, A. A Combination of Biotic and Abiotic Factors and Diversity Determine Productivity in Natural Deciduous Forests. Forests 2021, 12, 1450. [Google Scholar] [CrossRef]
  51. Van Gardingen, P.R.; Valle, D.; Thompson, I. Evaluation of yield regulation options for primary forest in Tapajos National Forest, Brazil. For. Ecol. Manag. 2006, 231, 184–195. [Google Scholar] [CrossRef]
  52. Okuda, T.; Suzuki, M.; Adachi, N.; Quah, E.S.; Hussein, N.A.; Manokaran, N. Effect of selective logging on canopy and stand structure and tree species composition in a lowland dipterocarp forest in peninsular Malaysia. For. Ecol. Manag. 2003, 175, 297–320. [Google Scholar] [CrossRef]
  53. Cannon, C.H.; Peart, D.R.; Leighton, M. Tree species diversity in commercially logged Bornean rainforest. Science 1998, 281, 1366–1368. [Google Scholar] [CrossRef] [Green Version]
  54. Ferry Slik, J.; Verburg, R.W.; KEßLER, P.J. Effects of fire and selective logging on the tree species composition of lowland dipterocarp forest in East Kalimantan, Indonesia. Biodivers. Conserv. 2002, 11, 85–98. [Google Scholar] [CrossRef]
  55. Bonnell, T.R.; Reyna-Hurtado, R.; Chapman, C.A. Post-logging recovery time is longer than expected in an East African tropical forest. For. Ecol. Manag. 2011, 261, 855–864. [Google Scholar] [CrossRef]
  56. Lindner, A.; Sattler, D. Biomass estimations in forests of different disturbance history in the Atlantic Forest of Rio de Janeiro, Brazil. New For. 2012, 43, 287–301. [Google Scholar] [CrossRef]
  57. Ghajar, I.; Najafi, A. Evaluation of harvesting methods for Sustainable Forest Management (SFM) using the Analytical Network Process (ANP). For. Policy Econ. 2012, 21, 81–91. [Google Scholar] [CrossRef]
  58. Chen, X.; Quan, Q.; Zhang, K.; Wei, J. Spatiotemporal characteristics and attribution of dry/wet conditions in the Weihe River Basin within a typical monsoon transition zone of East Asia over the recent 547 years. Environ. Model. Softw. 2021, 143, 105116. [Google Scholar] [CrossRef]
  59. Wang, S.; Zhang, K.; Chao, L.; Li, D.; Tian, X.; Bao, H.; Chen, G.; Xia, Y. Exploring the utility of radar and satellite-sensed precipitation and their dynamic bias correction for integrated prediction of flood and landslide hazards. J. Hydrol. 2021, 603, 126964. [Google Scholar] [CrossRef]
  60. Zhao, X.; Xia, H.; Pan, L.; Song, H.; Niu, W.; Wang, R.; Li, R.; Bian, X.; Guo, Y.; Qin, Y. Drought monitoring over Yellow River basin from 2003–2019 using reconstructed MODIS land surface temperature in Google Earth Engine. Remote Sens. 2021, 13, 3748. [Google Scholar] [CrossRef]
  61. Zhang, K.; Ali, A.; Antonarakis, A.; Moghaddam, M.; Saatchi, S.; Tabatabaeenejad, A.; Chen, R.; Jaruwatanadilok, S.; Cuenca, R.; Crow, W.T. The sensitivity of North American terrestrial carbon fluxes to spatial and temporal variation in soil moisture: An analysis using radar-derived estimates of root-zone soil moisture. J. Geophys. Res. Biogeosci. 2019, 124, 3208–3231. [Google Scholar] [CrossRef]
Figure 1. Iran’s position in the world, Location of the study area in northern Iran, and the network of permanent sample plots in the form of red dots, respectively (a). Photographs from Hyrcanian forests (b).
Sustainability 14 06777 g001aSustainability 14 06777 g001b
Figure 2. Trend of the proportion of operated and estimated harvest in the diameter classes of the beech group.
Sustainability 14 06777 g002
Figure 3. Trend of the proportion of operated and estimated harvest in the diameter classes of the hornbeam group.
Sustainability 14 06777 g003
Figure 4. Trend of the proportion of operated and estimated harvest in the diameter classes of the other species group.
Sustainability 14 06777 g004
Figure 5. The diameter distribution for uneven-aged, mixed forests in year 2003.
Sustainability 14 06777 g005
Figure 6. The diameter distribution for uneven-aged, mixed forests in 2012.
Sustainability 14 06777 g006
Table 1. Forest stand status with respect to different characteristics (first period inventory).
VariableMinimumMaximumStandard Deviation
Diameter (cm)718824.7
The mean of basal area at sample plot (m2)0.020.6330.1
The basal area of the largest tree (m2/ha)0528.4
Size diversity index of the sample plot02.4680.314
Shannon-Wiener index01.80.663
Table 2. Number of logged trees in each species group and compartment in Gorazbon district.
Compartments Number Number of Marked Trees in CompartmentsPredicted Allowable Cut in Forestry Plan (m3)
BeechHornbeamChestnut-Leaved OakOther SpeciesTotal Without CoefficientWith Coefficient 0.9
305739707177600540
30616216010246520468
309812370932714201278
Total17055002675025362282.4
Table 3. The volume of operated allowable cut (m3) in each species group and compartment in Gorazbon district.
Species GroupCompartment 305Compartment 306Compartment 309Total
VolumeVolume with Coefficient 0.9VolumeVolume with Coefficient 0.9VolumeVolume with Coefficient 0.9VolumeVolume with Coefficient 0.9
Beech480.82432.7474.7967.31632.33569.11187.941069.15
Hornbeam296.75267.7586.35527.72865.34778.81748.441573.6
Chestnut-leaved oak00000000
Other species14.4112.9712.110.8946.9442.2573.4566.105
Total 791.98712.78673.24605.9161544.7611390.153009.832708.847
Table 4. Transition probabilities between diameter classes for each species group.
PjUnlogged CompartmentsLogged Compartments (305, 306 and 309)
BeechHornbeamChestnut-Leaved OakOther SpeciesBeechHornbeamChestnut-Leaved OakOther Species
P10.15640.19810.22780.27910.14330.19560.21520.2502
P20.21190.23170.30700.34590.18340.23130.29510.3005
P30.24180.25970.35970.37290.24560.25770.35870.3427
P40.27870.28420.41110.39190.27850.28280.40870.3724
P50.31740.30760.46020.40300.33520.3075 0.3895
P60.33110.32680.47120.40980.36100.3286 0.4053
P70.33430.33780.46780.40460.38460.3451 0.4088
P80.33820.36010.50970.39780.39290.3598 0.4051
P90.35560.37250.49850.38720.40000.3678 0.4075
P100.32980.3912 0.37790.36740.3977 0.3949
P110.32930.3934 0.34270.25290.4128 0.3835
P120.32570.3711 0.31130.2462
P130.3097 0.29490.2309
P140.2880 0.27870.2053
P150.2693 0.2525
Table 5. Eigenvalue, harvest rate and estimated allowable cut for each species group.
The Group of CompartmentsUnlogged CompartmentsLogged Compartments
Species GroupBeechHornbeamChestnut-Leaved OakOther SpeciesBeechHornbeamChestnut-Leaved OakOther Species
The largest right dominant eigenvalue1.0621.0791.1131.07410.911.1211.083
The nine-year harvest rate0.060.0730.1010.0670-0.1080.077
Annual allowable cut (m3/ha)1.260.550.080.830-0.10.75
Total of Nine-year allowable cut (m3) 8237.263564.46537.685433.520−830.5778.62533.835
Publisher’s Note: MDPI stays neutral with regard to jurisdictional claims in published maps and institutional affiliations.

