Article

Priority of Water Allocation during Drought Periods: The Case of Jaguaribe Metropolitan Inter-Basin Water Transfer in Semiarid Brazil

by
Ályson Brayner Sousa Estácio
1,2,
Maria Aparecida Melo Rocha
1,*,
Marcílio Caetano de Oliveira
3,
Samiria Maria Oliveira da Silva
1,
Francisco de Assis de Souza Filho
1 and
Ticiana Marinho de Carvalho Studart
1
1
Department of Hydraulic and Environmental Engineering, Federal University of Ceará, Fortaleza 60400-900, CE, Brazil
2
Research Institute in Meteorology and Water Resources, Fortaleza 60115-221, CE, Brazil
3
Ceará Water Resources Management Company, Fortaleza 60824-140, CE, Brazil
*
Author to whom correspondence should be addressed.
Sustainability 2022, 14(11), 6876; https://0-doi-org.brum.beds.ac.uk/10.3390/su14116876
Submission received: 25 March 2022 / Revised: 10 May 2022 / Accepted: 17 May 2022 / Published: 4 June 2022

Abstract

:
Inter-basin water transfers are the root of many conflicts, and water scarcity accentuates them. Those conflicts involve the priority of water use between regions. The Jaguaribe Metropolitan system, located in the Brazilian semiarid region, presents conflicts amongst different water users: irrigated perimeters, industry, and households. This paper analyzed the Jaguaribe Metropolitan water transfer during the 2012–2018 drought by considering environmental and societal aspects. Changes in consumption and users’ drought perception were assessed. The results showed that the drought was longer and more severe in the region that provided water (i.e., Jaguaribe) than in the region that received it (i.e., FMR). Jaguaribe irrigators were aware of the beginning of the drought, but it did not result in immediate consumption control. On the other hand, drought perception was delayed in the FMR. The results of this study suggested that the water allocation decision-making process should include not only the water demands but also the characteristics of the drought and how people perceive it. The main strategy for improving water governance seems to be promoting integrated regional planning and the empowerment of participatory management.

1. Introduction

Water availability is a primary requirement for any society’s development. Nevertheless, in many places around the world, there is a mismatch between the local hydrological conditions and the societal demands for water, e.g., in northeast China [1], Spain [2], Iran [3,4], and northeast Brazil [5]. A typical solution to dealing with the variable spatial distribution of water availability is investing in hydraulic infrastructure that enables water transfer from basins with abundant water to regions that face water deficits. These water transfers involve agro-climatic, geophysical, social, cultural, and political aspects [6]. However, water transfers also involve conflicts related to the priority of water use between regions [7,8].
The potential for water conflicts tends to intensify during drought periods when water resources are scarce [9]. In regions marked by high interannual variability of climatic conditions (e.g., with frequent droughts), the problems related to water transfer becomes even more critical. Thus, an adequate assessment of the water transfer during a drought period is essential for efficient and fair water and risk allocation in these regions. In this context, several studies have investigated the conflicts between water use and transfer and strategies for improving water transfer mechanisms.
For instance, Van Huynh et al. [10] assessed the conflict in Vietnam due to water sharing between farmers, drinking water companies, and hydropower companies, a conflict that may be intensified due to climate change. In their study, Van Huynh et al. [10] tested the implementation of a mechanism for water sharing managed at the local level, which presented positive results in the district where the mechanism was applied.
Ma et al. [11] proposed a novel operation for inter-basin water transfers from multiple sources to improve the capability to satisfy the expected pronounced increase in water demand.
In the state of Ceará (Brazil), Pereira and Cuellar [12] studied the different conflicts caused by water scarcity in the Lower Jaguaribe basin and the economic and environmental impacts caused in that area. Nevertheless, there is still a need for a study that evaluates the water transfer from the Jaguaribe basin toward the capital of the state of Ceará, Fortaleza, investigating the diverse environmental and societal conditions and possible conflicts involved.
The Jaguaribe Metropolitan system in the state of Ceará (Brazil) is an integrated system through which water from the Jaguaribe basin can be allocated to the Fortaleza Metropolitan Region (FMR). Jaguaribe water users, i.e., mainly farmers, claim a right to their local resources. On the other hand, 3.2 million people in the FMR and important industry districts depend on Jaguaribe water input to feed the local reservoir’s storage and guarantee their water supply. During the recent drought in the region (2012–2018), the storage of the main Jaguaribe reservoir reached a critical level (<6%), which made the Jaguaribe Metropolitan water transfer an even more sensitive issue to be managed.
Given the relevant number of people and economic interests related to Jaguaribe Metropolitan water allocation, the main goal of this study was to analyze the Jaguaribe Metropolitan water transfer during the last drought (2012–2018), considering both environmental and societal aspects such as precipitation, available water storage, drought perception, water allocation, and consumption. The main aspects of water governance that can improve the water allocation are discussed.

2. Materials and Methods

2.1. Study Area

The Jaguaribe Metropolitan system (Figure 1) is a sophisticated water infrastructure, including reservoirs, interconnected basins, canals, and pipelines.
The FMR is the 6th most populous metropolitan region in Brazil with a population of 4.1 mi people, i.e., around 45% of the state of Ceará’s population [13]. This region does not have large water bodies within its geographic reach (Pacoti (0.38 bi m3), Riachão (0.05 bi m3), Gavião (0.03 bi m3), Pacajus (0.23 bi m3), Aracoiaba (0.16 bi m3), Acarape do Meio (0.03 bi m3), and Sítios Novos (0.13 bi m3)). Urban growth and industrial activities in its territory, such as the establishment of the Pecém harbor, have caused greater dependence on water transfers. This dependence started to grow at the beginning of the 1990s, and it is now concentrated mainly on the Castanhão dam, located 216 km from Fortaleza. The FMR’s economic production represents 60% of the gross domestic product (GDP) of the state of Ceará [14]. The Pecém harbor complex has thermal power plants, ore receiving, storage, and export companies, and a steel mill [15]. Maracanau and Pacajus industrial districts (IDs) include textile and clothing, food, beverage, machinery, chemical, rubber, plastic, and paper industries [16,17]. The installation of these industries generates a significantly positive impact on the economy of the nearby regions [18]. On the other hand, the industrial districts have an impact on the FMR’s water demand.
Until the early 1990s, the supply to the FMR was from the integrated Pacoti–Riachão–Gavião system. In 1993, the Labor Canal (Canal do Trabalhador) was constructed and became the first piece of infrastructure for water transfer to the metropolitan area [19]. However, this canal was associated with important water transmission losses [20]. Then, the waters of the Jaguaribe basin (Orós dam and Jaguaribe River) became part of the metropolitan supply system. In 2003, the Castanhão reservoir was completed. This reservoir is the largest in Ceará, and it is in the Jaguaribe basin (6.7 billion m3). Thus, water security in the metropolitan system was progressively reinforced; first by extending the Jaguaribe River, which already supplied part of Fortaleza, and especially since 2012 with the conclusion of a complex system of pumping stations, canals, pipelines, siphons, and tunnels named the Eixão Canal (Eixão das Águas), which allowed water to be transferred directly from the Castanhão dam to the FMR.
Projects of seawater desalination and water reuse are still not operational [21]. Thus, the Jaguaribe Metropolitan system supplies water to approximately 78% of the FMR’s population (3.2 mi people) [22] and the IDs. Nevertheless, non-negligible water demands are also found in the Jaguaribe basin. Castanhão supplies water for irrigated perimeters (IP) and 0.4 mi households in the Jaguaribe basin [19].
The Tabuleiro de Russas irrigated perimeter (DISTAR) and Federação das Associações do Perímetro Irrigado Jaguaribe Apodi (FAPIJA) are two of the main irrigated perimeters in this state of Ceará and benefit from the Castanhão dam. DISTAR receives water from Eixão Canal, while FAPIJA draws water from Jaguaribe River, downstream of the Castanhão dam. A smaller irrigated perimeter (IP) called Mandacaru (681 ha) also benefits from Eixão.
About 17% of the expropriated area of DISTAR (14,508 ha) accounts for rainfed agriculture, and this ratio rises to 59% in FAPIJA (8093 ha) [23]. In both IPs, farmers often combine irrigation with rainfed production. They produce multiple cultures, including traditionally rainfed grains and tubers (e.g., beans, corn, and cassava) and irrigated fruits (e.g., banana, guava, papaya, orange, coconut, and cashew). These IPs are important to the local economy. In 2010, they generated a revenue of 1.6 mi BRL and employed about 3200 people, including permanent and temporary jobs [24]. The temporary jobs are associated with the annual and seasonal cultures (e.g., beans, corn, sorghum, melon, and watermelon).
Agro-industrial producers and smallholders share the space in the IPs. For instance, in DISTAR, small farmers (i.e., with an average farm size of 8 ha) are the owners of 4035 ha, while the agro-industry owns 4968 ha [25]. However, the power and technical differences between these producers are still potential sources of conflict.

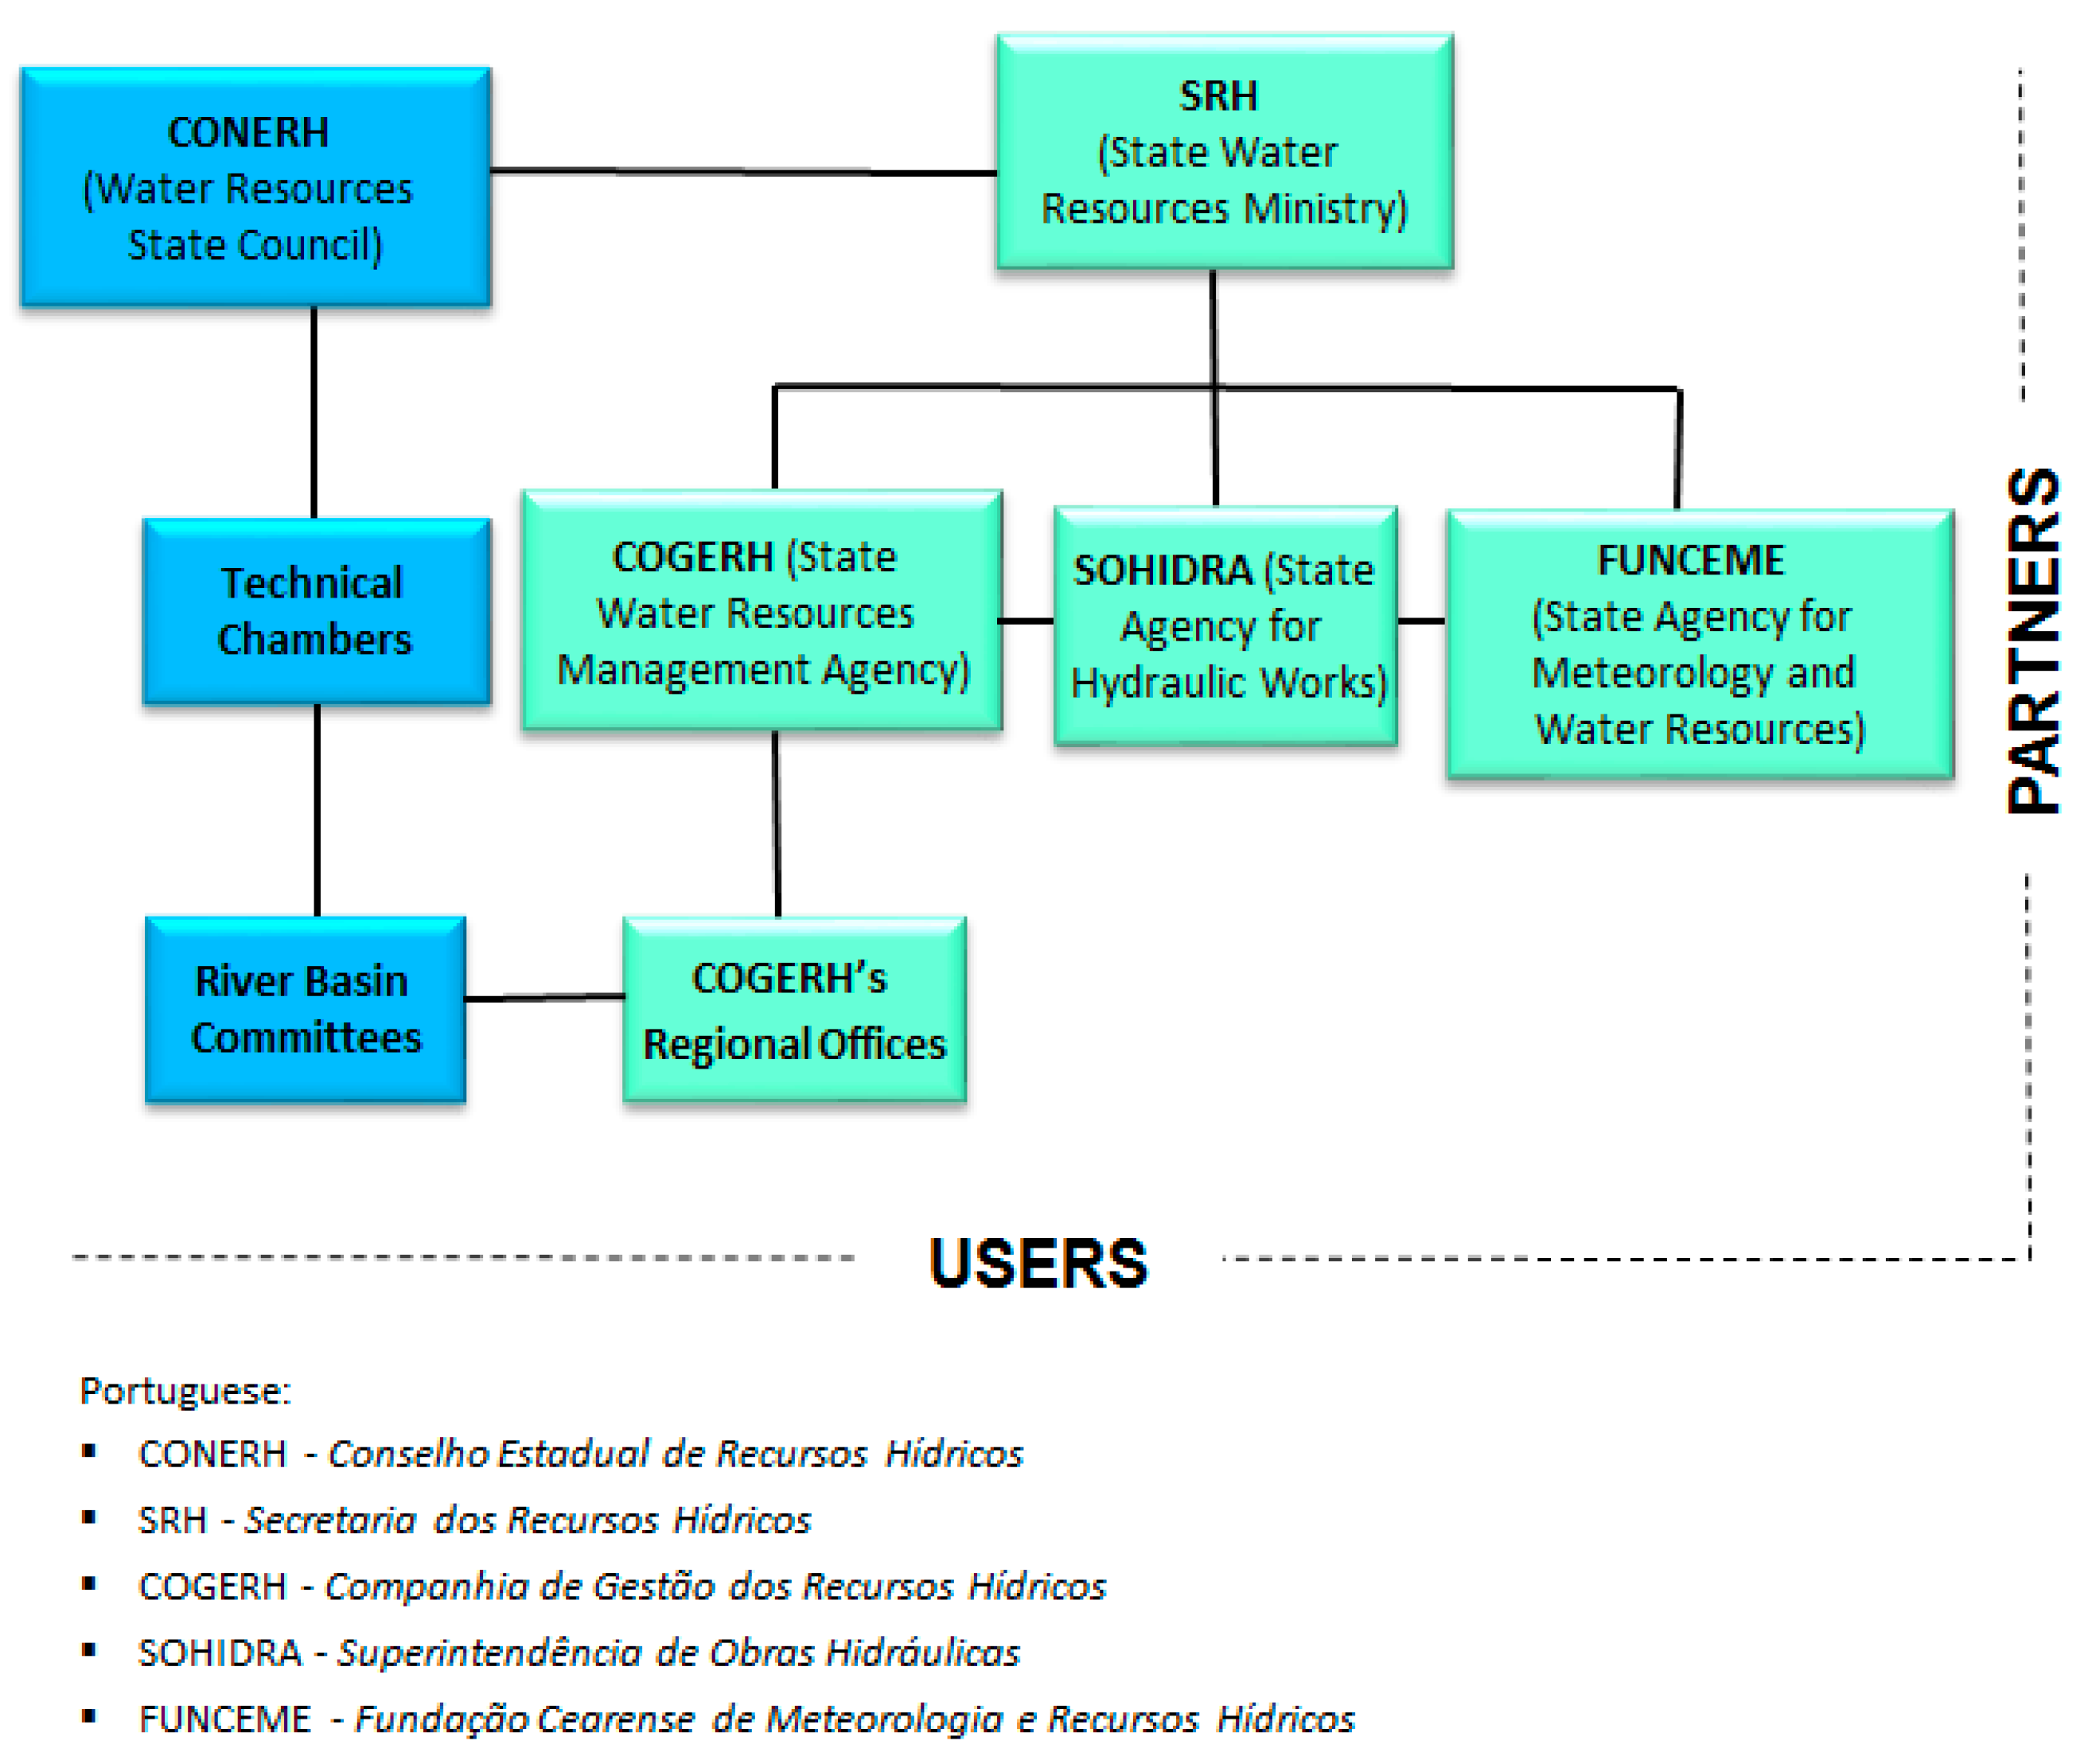
2.2. Water Governance in the State of Ceará

The central institutions are involved in water security in the state of Ceará and in the supply of the FMR are at the state level (Figure 2).
The water resources management agencies (SRH and COGERH) develop and regulate the use of bulk water throughout the state. They are responsible for conflict prevention and mitigation and have a mandate to oversee the water security of current and future generations. CAGECE, the state water and sanitation company, is responsible for supplying water to 151 (out of 184) municipalities in the state, including the FMR. FUNCEME, the state agency in charge of meteorology and water, is responsible for hydrological and climatological monitoring. Operationally, the state agency for hydraulic works (SOHIDRA) is responsible for the construction of hydraulic works and water infrastructure. Municipalities have certain authority and prerogatives regarding water supply and sanitation. They also exercise control over land use and occupation. Collegiate bodies—the Water Resources State Council (CONERH) and river basin committees (RBCs)—bring together users and civil society and are responsible for the negotiated allocation of water.
COGERH regional offices support the organization and functioning of the RBCs and the Management Committees of Hydric Systems (Comissões Gestoras, in Portuguese) on isolated reservoirs [26,27]. Each RBC is composed of representatives of the federal and state power (20% of the collegium), the municipality power (20%), water users (30%), and civil society (30%) [22].
Long-term water allocation in Ceará is based on the SRH permit to use water, while short-term allocation depends on the negotiated water allocation (NWA), initiated in Ceará state in 1994. NWA is a participative solution in which water from the hydrological system (perennial valley or reservoir) is allocated by the RBC members. This allocation is based on parameters previously defined by the RBC with the assistance of COGERH. The volumes of water from the reservoirs that are available to users throughout the year (and the associated risks) are negotiated. The decisions are endorsed by COGERH, which operates the reservoir system and verifies water use according to the stakes defined in the participative decision-making process [29]. These meetings occur once a year, after the rainy season. The five RBCs of Jaguaribe and the one of the FMR gather to discuss the water allocation from the Castanhão dam regarding the current storage and rainfall projections for the following year. Based on these data, the RBC discusses how to meet the demands with optimal reservoir use. COGERH presents allocation scenarios to RBC, which votes for the scenario to be implemented [30].
The whole process and the decision making follow the principles of the national and state water resources policies. The National Water Policy [31] determines that domestic water must be prioritized in water scarcity contexts. More strongly, the state of Ceará’s [32] policy states that domestic water is a priority in any circumstance. In addition, State Decree n° 33.559/2020 strengthened the NWA meetings, allowing them to temporarily suspend a long-term allocation of water use in the case of water scarcity [29].
Even though participative water management is an effective strategy for coping with drought and democratizing access to water [28], tension and conflict pervade the negotiations, especially during the drought period. For instance, Jaguaribe IP farmers argue that the allocations have benefited the FMR’s industrial use but are usually justified by the domestic water demand.

2.3. Data Analysis Procedure

A simple three-step methodology was adopted to assess the Jaguaribe Metropolitan transfers during the last decade of drought and their impacts on different water users: (i) data collection, (ii) data treatment and processing, and (iii) analysis and synthesis. The methodology was structured into five analysis axes, embedding those three steps and resulting in a comprehensive and multidisciplinary assessment that considers environmental and societal aspects. The data sources and necessary treatment of each of the five analysis axes are detailed below.

2.3.1. Axis 1: Meteorological and Hydrological Drought Evolution

Drought effects progressively manifest through different drought types, i.e., meteorological, hydrological, agricultural, and socioeconomic droughts, as defined by the American Meteorological Society [33]. The meteorological effects of the drought are the first to appear. In this study, the evolution of the meteorological drought was assessed considering the Standard Precipitation Index (SPI) [34], as recommended by the World Meteorological Organization (WMO) [35].
Precipitation data for SPI calculation were obtained from a rain gauge network managed by the state of Ceará and federal agencies (i.e., Departamento Nacional de Obras Contra as Secas (DNOCS); Superintendência do Desenvolvimento do Nordeste (SUDENE); and FUNCEME). The 265 rain gauges for which daily data were available for more than 40% of the whole period of 1911–2019 were considered. Daily precipitation was aggregated to a monthly scale and interpolated from the rain gauges into a 0.1-degree grid using an inverse distance weighting method. Then, the monthly precipitation series in the average territory was obtained by cropping the grid with the shape of the targeted areas. Since the Castanhão dam is subject to dispute, the precipitation and SPI were calculated considering its catchment territory. SPI was also calculated for the metropolitan hydrographic region to analyze the drought evolution in the region that receives the water transfer.
SPI computation consists of a variable transformation from the monthly aggregated precipitation into a standardized value, which compares the current precipitation to the entire series. The 12-month aggregation was considered, resulting in an SPI-12 series related to long-term precipitation and water scarcity [36]. SPI is positive in wet periods and negative in dry periods. As for the original application of SPI, precipitation was gamma distributed [34]. The maximum likelihood method was used to estimate the gamma parameters. Moreover, the whole period (1911–2019) was considered for distribution adjustment, but only the last decade (2010–2019) in the SPI series was necessary to analyze the targeted drought.
The storage of Castanhão and the FMR’s reservoirs in the 2010–2019 period was plotted to analyze the evolution of the hydrological drought. This allowed for the assessment of the effect of lower precipitation on water availability. The aggregated storage of the FMR reservoirs consisted of the sum of volumes in the reservoirs Pacoti, Riachão, Gavião, Pacajus, Acarape do Meio, Aracoiaba, and Sítios Novos. The reservoir storage data were made available in an open-source repository called “Portal Hidrológico do Ceará”, hosted by COGERH and FUNCEME [37].

2.3.2. Axis 2: Water Users’ Perception of Drought

Two data sources were considered to infer different water users’ perceptions of drought: semi-structured interviews and a database from the Google Trends tool.
The semi-structured interviews were conducted by Xavier et al. [38], who collected information from 30 farmers from DISTAR. Snowball sampling was used to determine the sample size and conduct the interviews. Under this method, the interviewees recommend the next person to be interviewed [38]. The process continues until the first interviewee is recommended again, then the interviewing process is completed. Of the total participants, 17% were women, and 70% were older than 40 years old. In addition, small farmers (1–3 irrigation lots) were the focus of this interview process due to the social network among the interviewees and the difficulty of accessing larger irrigated areas. Regarding the analysis presented in this paper, the most pertinent pieces of information included: (i) general characterization of the farmer; (ii) characterization of the farmers’ agricultural production; (iii) more severe droughts the interviewee had already dealt with; and (iv) when they considered that the last drought had begun. Only some unpublished data from Xavier et al.’s [38] interviews were used in the present study. More details on the interview process can be found in Xavier et al. [38].
The Google Trends tool was used to analyze the general perceptions of drought. This tool provides data about searches on a specific topic (or specific term) in a region and time, providing a monthly index of searches, and is largely used as a proxy for harvesting data. It has been applied in many fields of study for mapping disease outbreaks [39], predicting energy consumption in buildings [40], and evaluating flood susceptibility in areas where data are scarce [41]. This tool is easy to use, free, and provides samples with a high number of observations. However, the sample is not randomly selected since only people with access to the Internet are accounted for, which can induce some bias. Above all, this tool was suitable for the aim of this paper as it is useful for observing the variability of public interest on a given issue. In the current study, we performed searches on “water scarcity” and “rationing” in Ceará state from 2010 to 2019. The use of the term “rationing” in our analysis is justified by the implementation of restrictions in the FMR during the drought. The Google Trends tool indicated that searches for these terms were strongly concentrated in Fortaleza city. Then, these data were used as a proxy for the FMR population’s perception of drought. The research indexes were aggregated to an annual scale to enable an assessment of the concern regarding the topic year by year.

2.3.3. Axis 3: Water Allocation during the Drought

Data concerning the annual allocation of Castanhão’s waters for the FMR and Jaguaribe IPs were made available by COGERH. These data consider the period from 2014 to 2019, when the last section of the Eixão Canal (Eixão das Águas) started to operate.

2.3.4. Axis 4: Drought Impact on Water Consumption

Water consumption was estimated from the database of billed volumes by COGERH for the concessions to water use. The monthly billed volumes recorded for levying approximate the water consumption, except for illegal or non-chargeable consumption.
The database of billed volumes, made available by COGERH, describes the date, municipality, spring, withdrawal infrastructure, and category of use (e.g., human consumption, agricultural, or industrial), but it preserves the personal data of the individual users. The water consumption was calculated on an annual scale from 2010 to 2019.
For the analysis of the FMR’s consumption, this study focused on the volumes withdrawn from the infrastructures of the Jaguaribe Metropolitan system, which represent 93% of the FMR’s consumption. This consumption was divided into industrial and human consumption. Other water sources in the FMR, which are not disputable by Jaguaribe users, were not included in the analysis.
The same database was used to evaluate consumption in the Jaguaribe basin based on the volumes withdrawn from the Castanhão dam, its derivative infrastructure, and the regulated downstream river.
It is important to bear in mind that the human consumption computed in the current study corresponds to the volumes allocated by COGERH for the sanitation company (CAGECE), which is responsible for water distribution. The National System of Information on Sanitation (SNIS) estimated a 45.6% loss in the CAGECE supply system in 2019 [42].

2.3.5. Axis 5: Drought Impact on Agricultural Production

Planted area and agricultural production (in monetary values) data from 2013 to 2019 were made available by the managers of DISTAR and FAPIJA. These data were organized and computed to assess the impact of the drought on perennial and seasonal and annual crops downstream to the Castanhão dam.

3. Results and Discussion

3.1. Meteorological and Hydrological Drought Evolution

The SPI-12 series for Castanhão’s catchment shows that the meteorological drought began in 2012. It quickly reached its peak (in 2013) and lasted until 2018 (i.e., for approximately seven years). During this period, the reservoir recharge produced by the under-average precipitation was not enough to compensate for the withdrawal and the reservoir losses (i.e., mainly evaporation). Consequently, Castanhão’s storage decreased in that period. When the drought period began, the storage was about 70% of the capacity of the Castanhão dam, and it reached 6% at the end of the drought. Since 2018, even though the meteorological drought has passed, the hydrological drought has persisted since Castanhão still has low storage (Figure 3A).
In the Metropolitan Hydrographic Region, the meteorological drought began in the same year (2012) as in the Castanhão catchment, but it ended one year earlier (2017). At the end of the meteorological drought, the reservoirs of the FMR quickly recovered their storage, reaching 70% of the storage capacity in 2019 (Figure 3B). Nevertheless, the total capacity of the FMR reservoirs is only 15% of Castanhão’s capacity.
In the regions where Castanhão’s recharge is produced, the drought lasted longer and was more severe than in the Metropolitan Hydrographic Region. Pontes Filho et al. [43] also found that the sub-basins upstream of Castanhão faced a drought more severe and longer than the drought faced by the Metropolitan Hydrographic Region.
Technical capabilities are important to assess the differences in the drought faced by each region, which is expected to play a role in the water allocation. Nevertheless, the characteristics of the drought, including its duration and severity, depend on which definition of drought we are using, e.g., meteorological, hydrological, agricultural, or socioeconomic drought. The precipitation deficit (meteorological drought) may take months before it results in reduced streamflow and reservoir volumes (hydrological drought) [44]. These different types of droughts mean that the drought perception varies according to different uses, cultures, and regions [45].

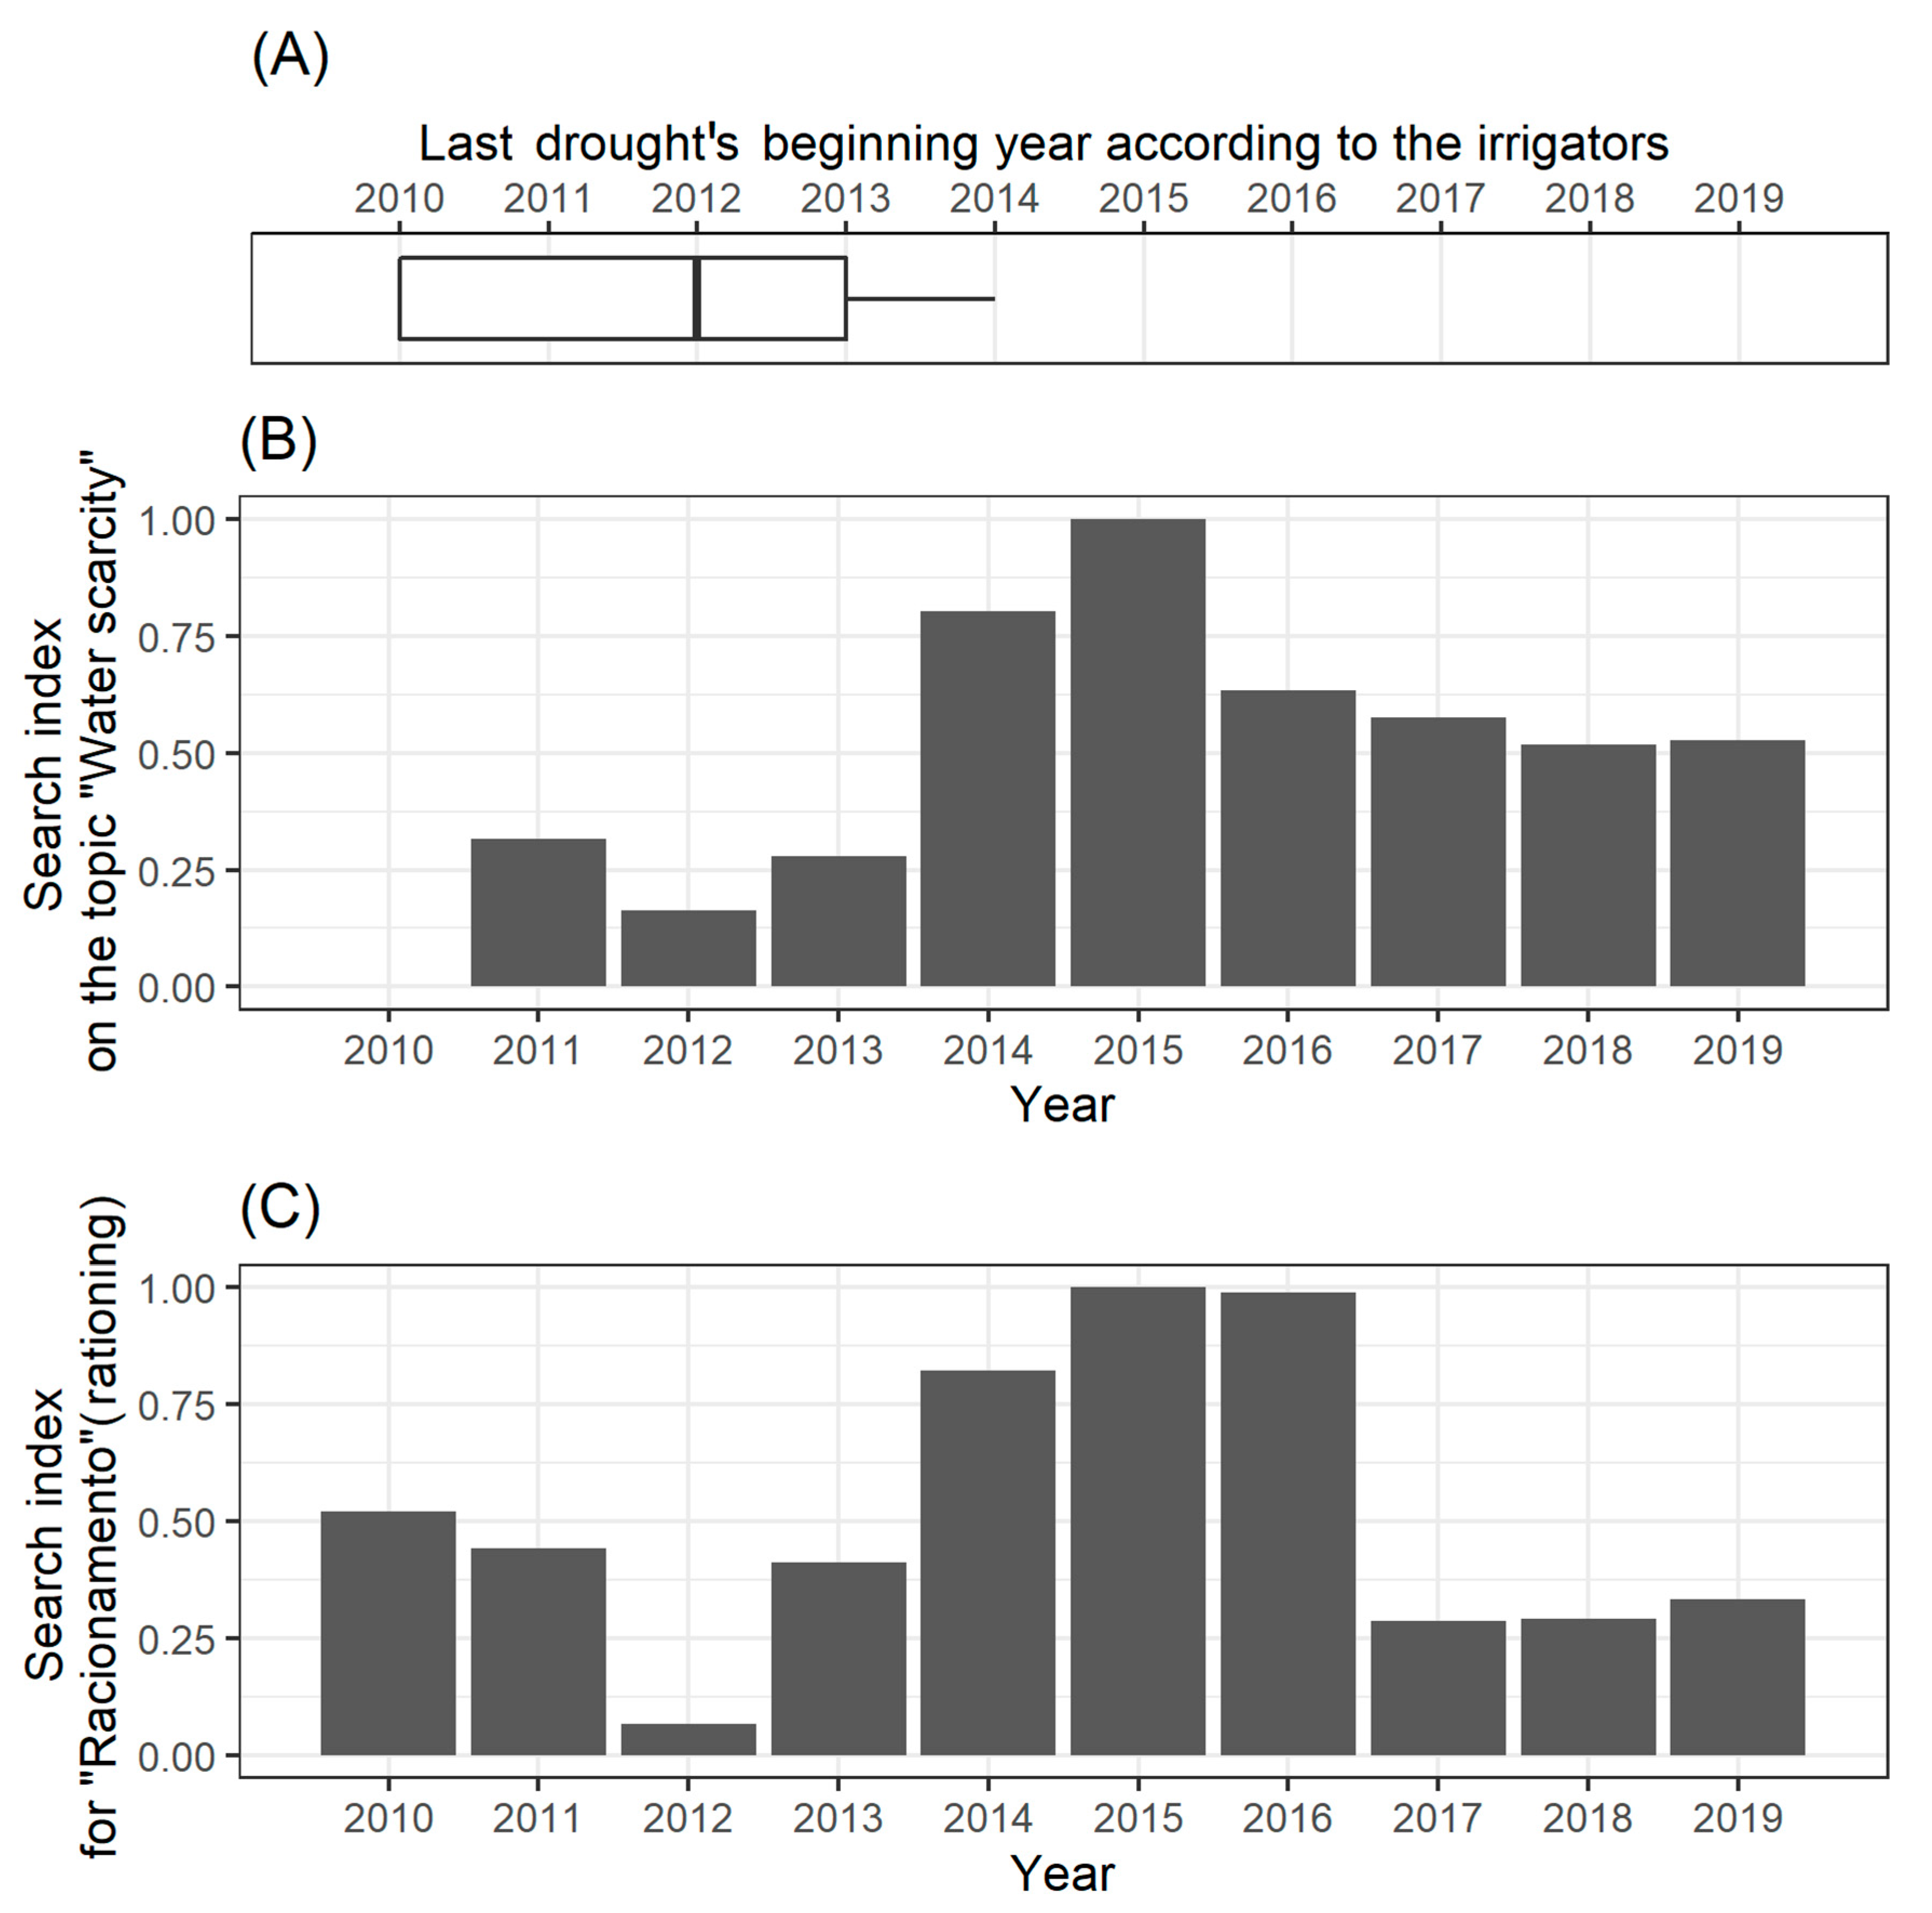
3.2. Water User’s Perception of Drought

Drought perception varied between Jaguaribe farmers and Fortaleza inhabitants. When asked about the more severe droughts they had already dealt with, all 30 interviewees included the last drought. They also considered different years as the beginning of the drought, with responses ranging from 2010 to 2014 (Figure 4A).
As the SPI series shows, 2010 had precipitation under the average, making some farmers consider that year the beginning of the drought, even if 2011 was a wet year. Moreover, the median response (i.e., 2012) coincides with the beginning of the meteorological drought. Nevertheless, Castanhão storage was about 70% in 2012, and irrigation was still not affected by the lower precipitation.
Rainfed agriculture is most affected by a lack of precipitation, while irrigated agriculture is most affected by a low reservoir volume. Thus, it was expected that farmers of rainfed agriculture would associate the beginning of the drought with the meteorological drought but farmers of irrigated agriculture would be more sensitive to the hydrological drought. The crops of the interviewees were cashew, beans, corn, guava, cassava, sorghum, banana, melon, coconut, mango, avocado, papaya, and acerola. Even though most interviewed farmers (i.e., 60%) only irrigated, the answers concerning the beginning of the drought were more related to the meteorological drought than water availability for irrigation. Two factors may explain the sensitivity of the meteorological drought: (i) irrigated production also benefits from direct precipitation, and (ii) local history and culture sustain the relationship between lack of precipitation and drought, regardless of impacts.
Another relevant factor that may influence farmers’ perception of the drought is the impact on their productivity. When asked how the drought period affected their work, all interviewees stated that their productivity highly decreased. Two years after the drought had started, around 2014, the drought impacted the irrigated agriculture expansion of some irrigated perimeters in the studied region [11]. Xavier et al. [38] showed that most farmers considered 2018 to be the most severe drought year among those that worked with irrigated agriculture. However, the most critical year when considering meteorological drought was 2013 (Figure 2). These results indicate that the farmers’ perception of the severity of the drought is associated with the reservoir’s low storage rather than low precipitation. This results from farmers’ lived experiences, and it helps to formalize how the farmers understand the drought phenomenon. Their understanding of the drought is critical to explaining their behavior toward the water, since this is expected to drive their susceptibility to control their consumption and to accept (or not accept) water transfer to the FMR.
The FMR users’ perception of the drought was assessed using the Google Trends tool. This tool indicated that searches in the state of Ceará for the term “rationing” or other terms related to water scarcity were mainly concentrated in Fortaleza city. In 2013, the search index was still close to that before the drought (Figure 4). The searches reached their peak in 2015, when Castanhão and the FMR reservoirs’ storage were already low (around 25% of their capacities). These results indicate that drought perception by Fortaleza inhabitants was delayed compared to that of the farmers. In Fortaleza, the drought perception may be more related to the political discussion held by the media about the drought’s effects and the potential actions for tackling it (e.g., rationing). In addition, their drought perception can also be influenced by the adoption of the contingent tariff applied to household water consumption, which started in 2015 [46]. As can be seen in Figure 4B, 2015 and 2016 were the years with the most Google searches for the term “rationing”.
The contrasts between the drought perception of farmers and townspeople can lead to conflicts in the water allocation process. If the users that are benefited by the water transfer are less aware of the drought, the users from the region that provide the water may take the water transfer as an injustice. This result indicates that the different drought perceptions are an important parameter in the decision-making process during the water allocation.

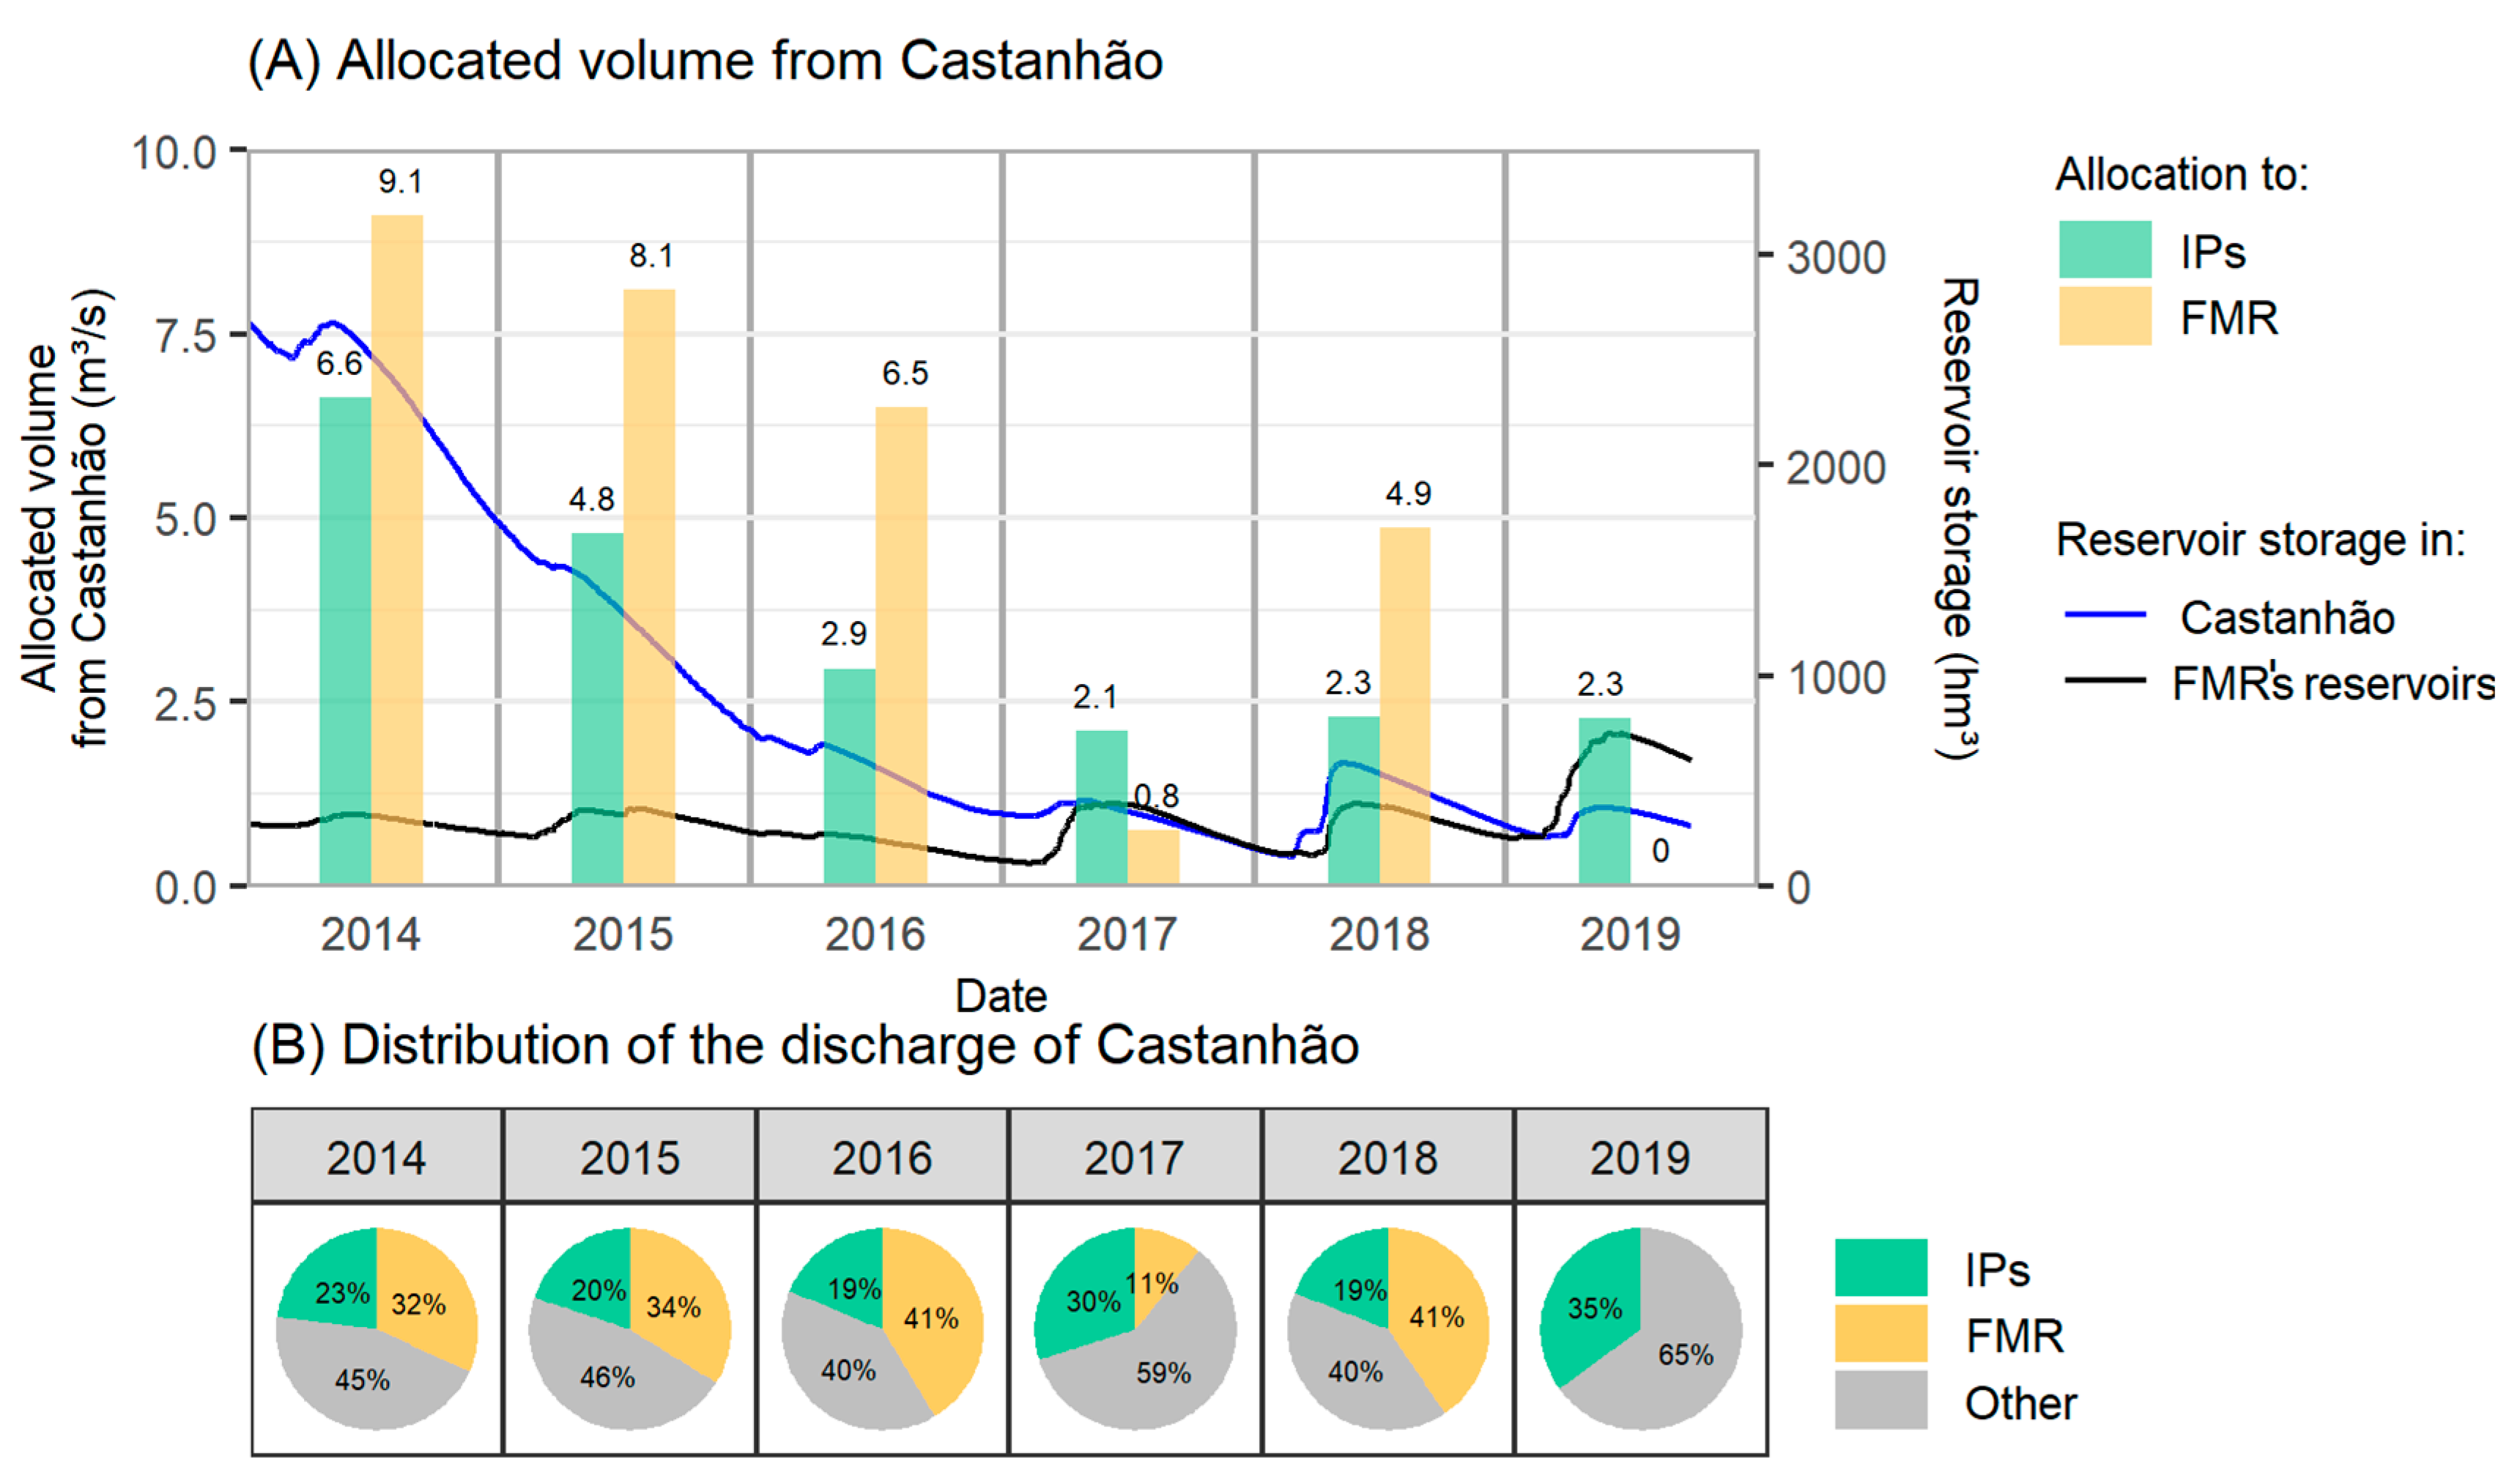
3.3. Water Allocation during the Drought

The allocation of waters from the Castanhão dam and the storage volumes are depicted in Figure 5A.
The volume allocated to Jaguaribe IPs (DISTAR, FAPIJA, and Mandacaru) decreased from 6.6 m3/s in 2014 to 2.1 m3/s in 2017, staying around 2.3 m3/s in 2018 and 2019. The allocated volume for the FMR decreased progressively from 9.1 m3/s in 2014 to 4.9 m3/s in 2018. A notable reduction in the volume allocated to the FMR was observed in 2017 and 2019 (e.g., no volume was allocated to the FMR in 2019). The reason for this is that in both years, the FMR reservoirs accumulated more water (>30%), which allowed the local system to supply the FMR’s demands, decreasing their dependence on the Castanhão dam. In 2018, the FMR’s reservoir storage was similar to 2017. Therefore, a low contribution from Castanhão would be expected. Nevertheless, in 2018, Castanhão experienced an increase in volume, which may explain the higher water allocation to the FMR than in the previous year. In general, the decrease in volume allocated to Jaguaribe IPs and the FMR were a result of the reduction in Castanhão storage.
Nevertheless, the different users did not suffer equal reductions in their allocated volume. Figure 5B presents the evolution of the percentage of the annual Castanhão discharge allocated to the FMR, IPs, and other uses. The term “Other uses” refers to some low-consumption uses (e.g., human consumption in Jaguaribe cities and diffuse irrigation) and the part of Castanhão’s discharge that is lost in river regulation (transmission losses). The percentage allocated to the FMR increased, except in 2017 and 2019. This shows that water allocation from the Castanhão dam prioritized the FMR’s demands over those from Jaguaribe IPs when the local reservoirs in the FMR did not have enough storage to supply the metropolitan demands. Moreover, that prioritization increased with the reduction in the Castanhão storage.
More than 90% of the FMR’s demands supplied by the Jaguaribe Metropolitan system are related to public water supply and distribution for household consumption, which explains the prioritization of the allocation to the FMR. On the other hand, other important water demands (e.g., industrial uses) have also benefited from the Castanhão allocation to the FMR. In dry years, the Castanhão dam must support the FMR local system, prioritizing the populations as determined by the law. Then, once Castanhão volumes are transferred to the FMR, they are incorporated into the local storage and become available for the different water uses in the FMR. This means that the FMR’s industries are being indirectly prioritized. These direct and indirect prioritizations are often subject to conflicts between the users, which is expected to be negotiated in the annual water allocation meeting.

Decision Making concerning Water Allocation

The water governance in Ceará follows a participatory management model, i.e., Jaguaribe water users vote for the allocation scenario to be implemented. Therefore, they can express their will during the NWA meeting. On the other hand, their options are limited to the scenarios proposed by COGERH, which might explain Jaguaribe farmers’ dissatisfaction.
The participatory water allocation in Ceará contrasts with the water management of other semiarid regions. For instance, in Spain, the state is legally responsible for the decision making regarding water transfer. Nevertheless, the autonomous communities informally assume the responsibility of making decisions [2]. In Iran, a case study conceptualized a model to help decision making regarding water transfer allocation [3]. The authors observed that bilateral cooperation among the water users was the best strategy to solve allocation conflicts. Thus, negotiation and participation seem to be the most natural ways to improve water governance regarding water allocation.
Another form of water allocation that is meant to solve the drought problem is water privatization. However, this alternative has presented many negative consequences after being implemented. In Bolivia, social conflicts arose after privatizing the water supply system [47]. In the United Kingdom, the water tariff increased significantly right after water privatization, and the service was cut off in many households exempt from payment [47].
Furthermore, concerning the allocation of a scarce resource, solutions based on maximizing the global benefit might ignore important aspects of reducing regional inequalities. These solutions often assume equal access to information and ignore cultural aspects. The sale of the right to use water also ignores the social and economic impacts of the production chain breakdown that it can generate.
The RBCs work well as a deliberative space where the deliberations and activities are made public, and they have the potential to improve the more they become operational [48]. However, this requires the continuous improvement of the technical capabilities of the members of the committees.

3.4. Drought Impact on Water Consumption

During the first three years of the drought (i.e., until 2015), as Castanhão’s storage remained above 25%, water consumption followed the tendency to increase despite the drought. For instance, both the FMR’s industries and Jaguaribe IPs increased their consumption by 208% between 2010 and 2014. Nevertheless, the volume increase was greater for the Jaguaribe IPs (an increase of 3.3 m3/s) than for the FMR’s industries (an increase of 0.7 m3/s). In both cases, the expressive augmentation of consumption was related to the expansion of economic activities during the period. An increase of 20% was also observed in the FMR’s human consumption between 2010 and 2015, corresponding to an additional 1.6 m3/s.
Only after 2015, due to the reduction in the water availability, did the consumption in the FMR’s households and Jaguaribe IPs decrease (Figure 6).
The consumption of Jaguaribe IPs reduced by 67% between 2015 and 2019. For the FMR, human consumption reduced by 8%. On the other hand, the FMR’s industry consumption increased by 15% over the same period. In the Jaguaribe cities, human consumption remained quite consistent at around 0.4 m3/s.
As previously discussed, human consumption is a priority. Since it is related to basic household activities, a reduction in human consumption is limited by a minimum value. Otherwise, a reduction would mean a deterioration of sanitary conditions. Therefore, it is expected that the decrease in human consumption is smaller than in other sectors (e.g., agriculture). According to the World Health Organization, the minimum water consumption for basic human activities is 110 L per person per day. Then, the minimal consumption would be 0.5 m3/s for the 0.4 mi people in Jaguaribe and 4.1 m3/s for the 3.2 mi people in the FMR. The contrast between the minimal and observed consumption indicates that the situation of household water supply in the FMR is more comfortable than in Jaguaribe. It is worth remembering that the human consumption computed in Figure 6 corresponds to the volumes allocated to the sanitary company (CAGECE), not the volume effectively consumed by households. Households consumed less water because of the losses in the distribution system. The leeway that the FMR had compared to Jaguaribe cities might explain why the FMR’s consumption was reduced while Jaguaribe cities’ consumption was maintained during the drought.
The reduction in the FMR’s human consumption was mainly due to operational changes, e.g., water reuse in the water treatment plant and pressure reduction in the water network. When the pressure is reduced, the consumption drops, and so do the leakages.
The losses in the network are a recurrent problem. SNIS data indicate that the rate of losses in Fortaleza increased from 39.8% in 2012 to 44.6% in 2018 (from 108 mi m3/year to 124 mi m3/year, respectively) [42]. Thus, CAGECE intensified the leak buster and the fraud prevention campaign (i.e., water theft) during the drought. CAGECE invested 11 million and 8 million BRL in these initiatives, respectively. In the leak buster campaign, citizens indicated the occurrence of leaks through a communication channel. In 2015, CAGECE received 158 thousand calls to fix leaks [22].
In addition, a contingency fee was adopted by CAGECE for customers who increased their water consumption. The additional fee has restrained the water consumption and financed actions to promote an efficiency gain in water distribution. Nunes Carvalho and Souza Filho [46] found that the contingent tariff contributed to an 11–17% reduction in residential water demand in Fortaleza city. However, this tariff had a higher impact on lower-income households. This occurred because the contingency fee represents less than 1% of the average per capita income of classes A and B (higher income), while it is about 23% of the income of class E (lower income) [46]. Consequently, lower-income households have fewer resources to invest in food and other expenses. Therefore, when formulating such tariffs, the social aspect should be considered. In general, as affirmed by Formiga-Johsson and Britto [49], the risks related to public water supply and water scarcity highly affect populations vulnerable to poverty.
Regarding other water uses, the reduction in Jaguaribe IPs’ consumption during the drought contrasts with the increase in the industrial consumption in the FMR. Effectively, Jaguaribe IPs demand more water than the FMR’s industries and naturally undergo more pressure to reduce consumption. However, some of the FMR’s industries have high water demand (e.g., textile factories, steel mills, and the beverage industry). Some industries have invested in water reuse technology to increase the water availability, justifying an agreement to keep the water supply. However, there is no priority defined by law for industrial or irrigation uses. Additionally, the fact that the IPs are in the basin that owns the water might indicate their right to participate in managing those resources. Jaguaribe IP representatives, as the other water users in Jaguaribe and the FMR, take part in the annual meeting in which water allocation is negotiated. However, Jaguaribe IPs’ representatives are still unsatisfied with the allocation that seems to prioritize the FMR’s industries.
The disagreement between the users is mainly due to the lack of formal rules to guide the decision making. Rules concerning the hierarchization of the different uses would require the formulation of a common strategy for regional development. More operational rules can be provided by a drought plan, i.e., a preparedness plan for the next drought [50,51].

3.5. Drought Impact on Agricultural Production

Precipitation deficits usually present themselves in the beginning as a deficiency in soil moisture; therefore, agriculture is often the first economic sector to experience drought impacts [44]. Northeast Brazil is one of the most vulnerable regions to droughts’ negative effects on agriculture [44]. Some drought effects mentioned by the interviewees were: anxiety and depression, increased food prices, population migration, and conflicts between residents and farmers. These impacts may be consequences of the decrease in profits and the breaking of their crops, two impacts mentioned by all the interviewees.
In numbers, the planted area in Jaguaribe’s main IPs (FAPIJA and DISTAR) has decreased by about 50% since 2015. Simultaneously, perennial crops now play a more important role in agricultural production when compared to seasonal crops (Figure 7A), which may proportionally reduce temporary jobs.
The economic production resulting from those IPs increased until 2016. Perennial crops, which take more time to produce but are more profitable, had their production increased until that year. However, economic production declined after 2016, reaching a decrease of more than 50% in three years (0.3% per week) (Figure 7B), affecting local income generation and commerce. Similar economic losses have been observed during droughts in other places. For instance, in the United States during a drought period from 2001 to 2014, the reduction rates for each additional week of drought were 0.1% to 0.2% for corn and soybean in dryland counts and 0.1% to 0.5% in irrigated counts [52].
In the Jaguaribe IPs, a linear equation satisfactorily modeled (R2 = 0.90) the relation between the plated area and the water consumption (Figure 7C). This result indicates that a reduction in the plated area (from 7400 ha in 2015 to 3900 ha in 2019) was strongly related to a decrease in the water supply. On the other hand, it demonstrates that the IPs did not improve their water use efficiency during the drought.

4. Conclusions

Databases from different sources were collected, treated, and compiled to construct a panorama of the water allocation in the Jaguaribe Metropolitan system during the 2012–2018 drought, considering the environmental and societal aspects involved.
The main findings were:
  • The drought was longer and more severe in the region that provided water than in the region that received it, which brings up a new aspect to be discussed regarding the fairness of water transfer.
  • The beginning and evolution of the meteorological drought did not induce a reduction in water consumption, which was observed only when the hydrological drought was already taking place. This behavior was observed even for irrigation water users, whose drought perception was strongly related to the meteorological drought.
  • In the FMR, the drought perception was delayed and more related to mitigating actions, such as rationing and contingency fees.
  • Water transfer to the FMR decreased as the Castanhão dam’s storage decreased. However, the allocation for Jaguaribe IPs decreased proportionally more, except when the FMR’s local reservoir had enough storage.
  • Human consumption was prioritized both in Jaguaribe and in the FMR. The consumption remained around the same in Jaguaribe and reduced by only 8% in the FMR.
  • Jaguaribe irrigation was strongly affected by a reduction in water availability, with likely negative consequences for the local economy.
Complex issues involving the human right to water emerge from the water allocation process, mainly when it includes inter-basin water transfer. In addition to a democratic forum for discussing these issues, which already exists in the water resources management in Ceará in the form of the RBCs, fair water allocation requires these committees to become more operational. For that, the members of the committees must continuously improve their technical capabilities. This would enable a deepening of the discussions on the characteristics of the drought between both regions, providing tools for greater argumentation and decision making.
In addition, during water allocation, the different drought perceptions must be taken into account in the decision-making process. The inclusion of these different perceptions is already foreseen in the participatory management model used in Ceará; however, the RBCs’ representativity should be continuously improved.
A common strategy toward regional development would help the hierarchization of priorities and guide the decision-making process. Simultaneously, guidelines for water allocation are needed to support negotiations between the different users. These guidelines should incorporate the results of scenario simulations and communicate to the decision makers in the committee the risks associated with their decisions. It would function as a drought plan or an operational policy for the Jaguaribe Metropolitan system during the drought.
This drought plan, coupled with the empowerment of basin committees in terms of technical capabilities, is essential to improve the participatory management of droughts.

Author Contributions

Conceptualization, Á.B.S.E., M.A.M.R. and T.M.d.C.S.; data curation, Á.B.S.E., M.A.M.R., M.C.d.O. and S.M.O.d.S.; writing—original draft preparation, Á.B.S.E. and M.A.M.R.; writing—review and editing, F.d.A.d.S.F. and T.M.d.C.S.; supervision, T.M.d.C.S. All authors have read and agreed to the published version of the manuscript.

Funding

The authors would like to thank CAGECE for supporting this study (project n. 11098079/2019). Additionally, the second author acknowledges a scholarship from the Coordination for the Improvement of Higher Educational Personnel (CAPES). The authors would also like to thank CAPES and the Graduate Program in Water Resources of the Department of Hydraulic and Environmental Engineering of the Federal University of Ceará for funding the publication of this article.

Institutional Review Board Statement

Not applicable.

Informed Consent Statement

Not applicable.

Data Availability Statement

Not applicable.

Acknowledgments

The authors would like to thank the Water Resource Management Company of Ceará (COGERH), Ceará Water and Sewage Company (CAGECE), and the irrigated perimeters of the Jaguaribe region for providing the data that enabled the present study to be conducted.

Conflicts of Interest

The authors declare no conflict of interest.

References

  1. Zhang, C.; Liu, Y.; Qiao, H. An Empirical Study on the Spatial Distribution of the Population, Economy and Water Resources in Northeast China. Phys. Chem. Earth Parts A/B/C 2015, 79–82, 93–99. [Google Scholar] [CrossRef]
  2. Morote, A.F.; Hernández, M.; Rico, A.M.; Eslamian, S. Inter-Basin Water Transfer Conflicts. The Case of the Tagus-Segura Aqueduct (Spain). Int. J. Hydrol. Sci. Technol. 2020, 10, 364–391. [Google Scholar] [CrossRef]
  3. Ahmadi, A.; Zolfagharipoor, M.A.; Afzali, A.A. Stability Analysis of Stakeholders’ Cooperation in Inter-Basin Water Transfer Projects: A Case Study. Water Resour. Manag. 2019, 33, 1–18. [Google Scholar] [CrossRef]
  4. Bozorg-Haddad, O.; Abutalebi, M.; Chu, X.; Loáiciga, H.A. Assessment of Potential of Intraregional Conflicts by Developing a Transferability Index for Inter-Basin Water Transfers, and Their Impacts on the Water Resources. Environ. Monit. Assess. 2020, 192, 40. [Google Scholar] [CrossRef]
  5. Roman, P. The São Francisco Interbasin Water Transfer in Brazil: Tribulations of a Megaproject through Constraints and Controversy. Water Altern. 2017, 10, 395–419. [Google Scholar]
  6. Boelens, R.; Vos, J. Legal Pluralism, Hydraulic Property Creation and Sustainability: The Materialized Nature of Water Rights in User-Managed Systems. Curr. Opin. Environ. Sustain. 2014, 11, 55–62. [Google Scholar] [CrossRef]
  7. Prakash, A.; Singh, S.; Brouwer, L. Water Transfer from Peri-Urban to Urban Areas. Environ. Urban. ASIA 2015, 6, 41–58. [Google Scholar] [CrossRef]
  8. Wei, S.; Yang, H.; Abbaspour, K.; Mousavi, J.; Gnauck, A. Game Theory Based Models to Analyze Water Conflicts in the Middle Route of the South-to-North Water Transfer Project in China. Water Res. 2010, 44, 2499–2516. [Google Scholar] [CrossRef]
  9. Veisi, K.; Bijani, M.; Abbasi, E. A Human Ecological Analysis of Water Conflict in Rural Areas: Evidence from Iran. Glob. Ecol. Conserv. 2020, 23, e01050. [Google Scholar] [CrossRef]
  10. Van Huynh, C.; van Scheltinga, C.T.; Pham, T.H.; Duong, N.Q.; Tran, P.T.; Nguyen, L.H.K.; Pham, T.G.; Nguyen, N.B.; Timmerman, J. Drought and Conflicts at the Local Level: Establishing a Water Sharing Mechanism for the Summer-Autumn Rice Production in Central Vietnam. Int. Soil Water Conserv. Res. 2019, 7, 362–375. [Google Scholar] [CrossRef]
  11. Ma, Y.; Chang, J.; Guo, A.; Wu, L.; Yang, J.; Chen, L. Optimizing Inter-Basin Water Transfers from Multiple Sources among Interconnected River Basins. J. Hydrol. 2020, 590, 125461. [Google Scholar] [CrossRef]
  12. Pereira, G.R.; Cuellar, M.D.Z. Conflitos Pela Água Em Tempos de Seca No Baixo Jaguaribe, Estado Do Ceará. Estud. Avançados 2015, 29, 115–137. [Google Scholar] [CrossRef] [Green Version]
  13. IBGE. Estimativas da População Residente para os Municípios e para as Unidades da Federação Com Data de Referência em 1o de Julho de 2019: [Notas Metodológicas]; IBGE: Rio de Janeiro, Brazil, 2019.
  14. IPECE. Ceará em Números; IPECE: Fortaleza, Brazil, 2020. [Google Scholar]
  15. da Costa, E.S.; Costa, A.A. Study of the Transport of Atmospheric Pollutants in the Pecém Industrial and Port Complex (Cipp), Ceará, Brazil. Rev. Bras. Meteorol. 2021, 36, 615–624. [Google Scholar] [CrossRef]
  16. FIEC. Available online: https://arquivos.sfiec.org.br/nucleoeconomia/files/files/Outras%20publicacoes/distrito-industrial-nova-identidade-vfinal.pdf (accessed on 15 April 2022).
  17. IPECE. Available online: https://www.ipece.ce.gov.br/wp-content/uploads/sites/45/2014/02/TD_44.pdf (accessed on 15 April 2022).
  18. Ponte, A.G.R. Impactos Econômicos do Complexo Industrial e Portuário do Pecém-CIPP; Universidade Federal do Ceará: Fortaleza, Brazil, 2022. [Google Scholar]
  19. CEARÁ. A Importância da Duplicação do Eixão das Águas para o Desenvolvimento Regional do Vale do Jaguaribe e Região Metropolitana de Fortaleza (RMF); Ceará State Government: Fortaleza, Brazil, 2021.
  20. Costa, A.C.; Foerster, S.; de Araújo, J.C.; Bronstert, A. Analysis of Channel Transmission Losses in a Dryland River Reach in North-Eastern Brazil Using Streamflow Series, Groundwater Level Series and Multi-Temporal Satellite Data. Hydrol. Process. 2012, 2274, 2267–2274. [Google Scholar] [CrossRef] [Green Version]
  21. FORTALEZA. Fortaleza 2040; Ceará State Government: Fortaleza, Brazil, 2020.
  22. CEARÁ. Plano de Segurança Hídrica da Região Metropolitana de Fortaleza; Ceará State Government: Fortaleza, Brazil, 2016.
  23. Pontes, P.A.; Aragão, K. Os Perímetros Irrigados Do Ceará: Os Grandes Projetos de Irrigação Têm Impacto Sobre a Renda Local ? In Proceedings of the XXXVII Encontro da ANPAD, Rio de Janeiro, Brazil, 7–11 September 2013; pp. 1–13. [Google Scholar]
  24. dos Santos, F.S.S.; Campos, K.C.; Coelho, E.L.; da Silva, F.L.; Oliveira, V.R. De Avaliação de Perímetros Públicos Irrigados No Ceará. Rev. Política Agrícola 2014, 23, 29–42. [Google Scholar]
  25. Silva Neto, O.L.S.; Cunha, L.E.M.; Schilling Marquesan, F.F. As implicações socioeconômicas da seca sobre a população de um perímetro irrigado. In Proceedings of the Congresso Internacional da Diversidade do Semiárido, Campina Grande, Brazil, 10 November 2016. [Google Scholar]
  26. CEARÁ. Ceará 2050; Ceará State Government: Ceará, Brazil, 2018.
  27. CEARÁ. Plano de Ações Estratégicas do Estado do Ceará; Ceará State Government: Ceará, Brazil, 2018.
  28. de Assis Souza Filho, F.; Formiga-Johnsson, R.M.; de Carvalho Studart, T.M.; Abicalil, M.T. From Drought to Water Security: Brazilian Experiences and Challenges; Water Resources Development and Management: Singapore, 2018; ISBN 9789811079139. [Google Scholar]
  29. de Carvalho Studart, T.M.; Campos, J.N.B.; de Souza Filho, F.A.; Pinheiro, M.I.T.; Barros, L.S. Turbulent Waters in Northeast Brazil: A Typology of Water Governance-Related Conflicts. Environ. Sci. Policy 2021, 126, 99–110. [Google Scholar] [CrossRef]
  30. SRH. Diagnóstico da Alocação Negociada de Água; Ceará State Government: Fortaleza, Brazil, 2021.
  31. BRASIL. Lei N° 9433: Política Nacional de Recursos Hídricos; Secretaria de Recursos Hídricos: Brasília, Brazil, 1997; 72p. [Google Scholar]
  32. CEARÁ. Casa Civil. Lei N°. 14.844: Política Estadual de Recursos Hídricos. Diário Oficial do Estado do Ceará, 30 December 2010, p. 245. Fortaleza–CE. Série 3, Ano I, N°. Available online: http://extwprlegs1.fao.org/docs/pdf/bra183427.pdf (accessed on 15 May 2021).
  33. Heim, R.R., Jr. A Review of Twentieth-Century Drought Indices Used in the United States. Bull. Am. Meteorol. Soc. 2002, 83, 1149–1166. [Google Scholar] [CrossRef] [Green Version]
  34. McKee, T.B.; Doesken, N.J.; Kleist, J. The Relationship of Drought Frequency and Duration to Time Scales. In Proceedings of the 8th Conference of Applied Climatology, Anaheim, CA, USA, 17–22 January 1993; pp. 17–22. [Google Scholar]
  35. Pontes Filho, J.D.; Portela, M.M.; Marinho de Carvalho Studart, T.; de Souza Filho, F.A. A Continuous Drought Probability Monitoring System, CDPMS, Based on Copulas. Water 2019, 11, 1925. [Google Scholar] [CrossRef] [Green Version]
  36. WMO. Standardized Precipitation Index User Guide; WMO: Geneva, Switzerland, 2012. [Google Scholar]
  37. COGERH. Portal Hidrológico do Ceará. 2020. Available online: http://www.hidro.ce.gov.br/hidro-ce-zend/app/pagina/show/162 (accessed on 14 April 2020).
  38. Xavier, L.C.P.; Carvalho, T.M.N.; Filho, J.D.P.; de Souza Filho, F.A.; da Silva, S.M.O. Use of Machine Learning in Evaluation of Drought Perception in Irrigated Agriculture: The Case of an Irrigated Perimeter in Brazil. Water 2020, 12, 1546. [Google Scholar] [CrossRef]
  39. Carneiro, H.A.; Mylonakis, E. Google Trends: A Web-Based Tool for Real-Time Surveillance of Disease Outbreaks. Clin. Infect. Dis. 2009, 49, 1557–1564. [Google Scholar] [CrossRef]
  40. Fu, C.; Miller, C. Using Google Trends as a Proxy for Occupant Behavior to Predict Building Energy Consumption. Appl. Energy 2022, 310, 118343. [Google Scholar] [CrossRef]
  41. Thompson, J.J.; Wilby, R.L.; Matthews, T.; Murphy, C. The Utility of Google Trends as a Tool for Evaluating Flooding in Data-scarce Places. Area 2021, 54, 1–10. [Google Scholar] [CrossRef]
  42. SNIS. Diagnóstico dos Serviços de Água e Esgoto-2019; National Sanitation Department: Brasília, Brazil, 2019. [Google Scholar]
  43. Pontes Filho, J.D.; de Souza Filho, F.A.; Martins, E.S.P.R.; Studart, T.M.C. Copula-Based Multivariate Frequency Analysis of the 2012-2018 Drought in Northeast Brazil. Water 2020, 12, 834. [Google Scholar] [CrossRef] [Green Version]
  44. Cunha, A.P.M.A.; Zeri, M.; Leal, K.D.; Costa, L.; Cuartas, L.A.; Marengo, J.A.; Tomasella, J.; Vieira, R.M.; Barbosa, A.A.; Cunningham, C.; et al. Extreme Drought Events over Brazil from 2011 to 2019. Atmosphere 2019, 10, 642. [Google Scholar] [CrossRef] [Green Version]
  45. Hughes, N.; Soh, W.Y.; Boult, C.; Lawson, K. Defining Drought from the Perspective of Australian Farmers. Clim. Risk Manag. 2022, 35, 100420. [Google Scholar] [CrossRef]
  46. Nunes Carvalho, T.M.; de Souza Filho, F.A. A Data-Driven Model to Evaluate the Medium-Term Effect of Contingent Pricing Policies on Residential Water Demand. Environ. Challenges 2021, 3, 100033. [Google Scholar] [CrossRef]
  47. Swyngedouw, E. Privatizando o H2O: Transformando Águas Locais Em Dinheiro Global. Rev. Bras. Estud. Urbanos E Reg. 2004, 6, 33. [Google Scholar] [CrossRef] [Green Version]
  48. Abers, R.N.; Formiga-Johnsson, R.M.; Frank, B.; Keck, M.E.; Lemos, M.C. Inclusão, Deliberação e Controle: Três Dimensões Dedemocracia Nos Comitês e Consórcios de Bacias Hidrográficas No Brasil. Ambient. Soc. 2009, 12, 115–132. [Google Scholar] [CrossRef] [Green Version]
  49. Formiga-Johnsson, R.M.; Britto, A.L. Water Security, Metropolitan Supply and Climate Change: Some Considerations Concerning the Rio de Janeiro Case. Ambient. Soc. 2020, 23, 1–22. [Google Scholar] [CrossRef]
  50. Wilhite, D.A. Planning for Drought: A Methodology. In Drought Assessment, Management, and Planning: Theory and Case Studies; Springer: Boston, MA, USA, 1993; pp. 87–108. [Google Scholar]
  51. Wilhite, D.A.; Sivakumar, M.V.K.; Wood, D.A. Early Warning Systems for Drought Preparedness and Drought Management. In Proceedings of the An Expert Group Meeting, Lisbon, Portugal, 5–7 September 2000; World Meteorological Organization: Geneva, Switzerland. [Google Scholar]
  52. Kuwayama, Y.; Thompson, A.; Bernknopf, R.; Zaitchik, B.; Vail, P. Estimating the Impact of Drought on Agriculture Using the U.S. Drought Monitor. Am. J. Agric. Econ. 2019, 101, 193–210. [Google Scholar] [CrossRef]
Figure 1. Jaguaribe Metropolitan system.
Sustainability 14 06876 g001
Figure 2. Water resources management system of the state of Ceará [28].
Sustainability 14 06876 g002
Figure 3. Meteorological and hydrological drought evolution in (A) Castanhão’s catchment and (B) Metropolitan Hydrographic Region. Meteorological drought is represented (upper) by the SPI-12. Hydrological drought is represented (lower) by the evolution of reservoir storage. For the Metropolitan Hydrographic Region, reservoir storage was aggregated by considering the reservoirs Pacoti, Riachão, Gavião, Pacajus, Acarape do Meio, Aracoiaba, and Sítios Novos.
Sustainability 14 06876 g003
Figure 4. Drought perception. (A) Beginning year of the last drought according to Jaguaribe farmers. Farmers’ response distribution is represented using a boxplot. (B) Search index for topics related to water scarcity in Ceará, according to Google Trends data. (C) Search index for the term “rationing” (racionamento, in Portuguese) in Ceará, according to Google Trends data. The searches in (B,C) were mainly launched in Fortaleza city.
Sustainability 14 06876 g004
Figure 5. Water allocation from Castanhão dam between Jaguaribe IPs (i.e., DISTAR, FAPIJA, and Mandacaru) and FMR. Allocations are presented in volume (A) and in percentage of Castanhão’s discharge (B). The evolution of the storage (in hm3) for Castanhão and FMR’s reservoirs (Pacoti, Riachão, Gavião, Pacajus, Acarape do Meio, Aracoiaba, and Sítios Novos) are also depicted in (A).
Sustainability 14 06876 g005
Figure 6. Annual water consumption by the FMR’s industry, FMR’s households, Jaguaribe IPs, and Jaguaribe households directly or indirectly supplied by Castanhão. The FMR consumptions whose withdrawal infrastructure does not integrate the Jaguaribe Metropolitan system were not computed.
Sustainability 14 06876 g006
Figure 7. Drought effect on agricultural production of the Jaguaribe IPs (FAPIJA and DISTAR), considering (A) the evolution of the planted area and (B) the evolution of the resulting economic production. Perennial and seasonal crops are differentiated. In (C), a correlation analysis was performed between the plated area and the water consumption.
Sustainability 14 06876 g007
Publisher’s Note: MDPI stays neutral with regard to jurisdictional claims in published maps and institutional affiliations.

