
Driver Behavior and Intention Recognition Based on Wavelet Denoising and Bayesian Theory

1
School of Mechanical and Automobile Engineering, Qingdao University of Technology, No. 777 Jialingjiang Road, Qingdao 266520, China
2
Department of Industrial Engineering, Beijing Institute of Technology, Beijing 100081, China
3
Hubei Key Laboratory of Power System Design and Test for Electrical Vehicle, Hubei University of Arts and Science, Xiangyang 441053, China
4
China National Heavy Machinery Research Institute Co., Ltd., No. 3699 Shanglin Road, Xi’an 710032, China
*
Author to whom correspondence should be addressed.
Sustainability 2022, 14(11), 6901; https://0-doi-org.brum.beds.ac.uk/10.3390/su14116901
Submission received: 4 April 2022
/
Revised: 28 April 2022
/
Accepted: 31 May 2022
/
Published: 6 June 2022
(This article belongs to the Special Issue Mobility Sustainability: Ecological, Smart and Connected Transportation Systems)
Abstract
:Driver behavior and intention recognition affects traffic safety. Many scholars use the steering wheel angle, distance of the brake pedal, distance of the accelerator pedal, and turn signal as input data to identify driver behaviors and intentions. However, in terms of time, the acquisition of these parameters has a relative delay, which lengthens the identification time. Therefore, this study uses drivers’ EEG (electroencephalograph) data as input parameters to identify driver behaviors and intentions. The key to the driving intention recognition of EEG signals is to reduce their noise. Noise interference has a significant influence on EEG driving intention recognition. To substantially denoise EEG signals, this study selects wavelet transform theory and wavelet packet transform technology, collects the EEG signals during driving, uses the threshold noise reduction method on EEG signals to reduce noise, and achieves noise reduction through wavelet packet reconstruction. After the wavelet packet coefficients of EEG signals are obtained, the energy characteristics of the wavelet packet coefficients are extracted as input to the Bayesian theoretical model for driver behavior and intention recognition. Results show that the maximum recognition rate of the Bayesian theoretical model reaches 82.6%. Early driver behavior and intention recognition has important research significance for traffic safety and sustainable traffic development.
1. Introduction
The “2018 Global Road Safety Report” issued by the World Health Organization emphasizes that the number of deaths caused by traffic accidents is still increasing year by year, and it has become the eighth leading cause of death of people of all ages. In order to reduce the occurrence of traffic accidents, scholars have conducted research on traffic implementation, for example, Macioszek, E. studied the traffic capacity of roundabouts [1]. Alessandro Severino et al. studied the safety benefits of flower roundabouts [2]. The occurrence of traffic accidents is affected by many factors, among which the influence of the driver is the main factor [3,4,5]. Sustainable transportation is one of the latest transportation development concepts in the world today, and safety is one of the keys to sustainable transportation development. Predicting driver behaviors and intentions in advance plays a key role in reducing traffic accidents, and it provides a strong guarantee for sustainable development. This article mainly collects EEG (electroencephalograph) driving signals during the driving process; predicts driver behaviors and intention; and makes timely decisions, which can further reduce the occurrence of traffic accidents and provide a stronger guarantee for sustainable traffic development. Many studies have been conducted on sustainable transportation development, and they have focused mainly on energy saving and carbon emission research [6,7,8]. Pamucar, D., Deveci, M. and Cantez, F. et al. proposed to achieve zero carbon emissions from transportation [7]. Al-Thawadi, F.E., Banawi, A. and Al-Ghamdi, S.G. suggested that using public transport was sustainable [9]. In the present study, sustainable transportation development is considered from the perspective of energy saving and improving traffic safety.
Many scholars have studied the intention of drivers, such as Micucci, A., Mantecchini, L. and Sangermano, M. They examined the relationship between motorcyclists’ understanding of car drivers’ intentions and the perceived factors that affect the state of front and rear turn signals [10]. Driving intentions can be predicted in advance by predicting behaviors such as turning left, turning right, and going straight, thereby providing information to drivers for avoiding traffic conflicts and gaining protection for traffic safety. Predicting driving intentions in advance can also save time and reduce drivers’ judging time thereby saving energy and improving safety.
The key problem of driver behaviors and intentions based on EEG signals is noise reduction; EEG signals are extremely weak, and various signal noises interfere during the signal acquisition process. Driver behavior and intention data are mixed and cannot reflect real driver behaviors and intentions. Therefore, noise reduction is indispensable to obtain clear, accurate driver behavior and driving intention based on EEG signals. This study uses the wavelet transform principle to layer EEG signals, soft threshold for noise reduction, and Python for simulation.
At present, popular classification and recognition mainly include the Bayesian method and the support vector machine (SVM), neural network, and deep learning models.
This research uses Bayesian classification and recognition, which is relatively simple, with high learning and prediction efficiencies based on the probability learning algorithm. In this work, driving intentions during the normal driving process are studied, which can serve as a reference for assisted and automatic driving and lay a foundation for sustainable transportation development.
The paper mainly includes five parts, the first part is the introduction, the second part is the literature review, the third is the materials and methods, the fourth part is models and methods, and the fifth is the discussion and conclusion.
2. Literature Review
Research on drivers’ EEG signals includes driver fatigue detection, driving intention recognition, driver cognitive response, and driver drowsiness.
Borghini, G., Vecchiato, G., and Colosimo, A. et al. evaluated mental fatigue during car driving through high-resolution brain electrical activity and neurophysiological indicators [11]. Tran, Y., Wijesuryia, N., and Thuraisingham, R. A et al. detected changes in driving fatigue through the fast time resolution of EEG signals. They conducted nonlinear analysis on the alertness and fatigue EEG signals of driving simulation tasks through the second-order difference map quantified by sample entropy and central tendency measurement. The results indicated that the sample entropy and the second-order difference caused a significant increase in the regularity of the EEG signals from the alert to the fatigue state and reduced the variability of such signals [12]. Mohamed, F. et al. initiated an adaptive fatigue recognition model on the basis of the main axis of EEG frequency, which extracts EEG signals and recognizes the brain perceptions of various environmental changes and driver behaviors thereby identifying driver fatigue [13].
Hernández, L.G., Mozos, O.M. and Ferrández, J.M. recognized driver braking intention by taking EEG signals as input features with SVM models and convolutional neural network (CNN) models [14]. Trung-hau Nguyen and Wan-young Chung developed a new system that used EEG signals to detect the driving intention to brake in an emergency with 91% accuracy [15].
Huang, Yufei, and Hajinoroozi detected the cognitive performance of drivers by extracting EEG features as input parameters and adopting deep CNNs [16]. Lin, C.T., Lin, K.L., and Ko, L.W. et al., extracted the characteristics of EEG signals through nonparametic weighted feature extraction and detected driver cognitive responses to traffic light signals through Naive Bayes [17]. Chuang, C.H., Lai, P.C., and Ko, L.W. et al., established a system to assess the cognitive state of drivers, and they proposed a classification system for alertness/drowsiness on the basis of EEG signals [18]. Li, G., Lee, B.L., and Chung, W. detected driver drowsiness through EEG [19].
Lin, F.-C., and L.-W., et al., proposed a self-organizing neuro-fuzzy system on the basis of generalized EEG to monitor and to predict driver drowsiness through the occipital area [20]. Lin, F.C., Ko, L.W., and Chen, S.A., et al., detected driver drowsiness by extracting the frequencies of EEG signals [21]. Gang, Chung, and Wan-Young, et al. found driver drowsiness by adopting the posterior probability model of SVM based on the characteristics of brain electrical signals [19]. Rahma, O.N. and Rahmatillah, A. recognized awake and lethargic states, extracted the relative power of EEG signals as a feature, and optimized the extreme learning machine by using the common space pattern method to calculate the variance of the relative power thereby achieving significant effects [22].
Picot, A., Charbonnier, S., and Caplier, A. proposed an online sleepiness detection method on the basis of EEG; the results indicated that nearly 85% of the correct detection were obtained [23].
Lin, C.T., Chen, S.A., and Ko, L.W., et al., studied driver distraction detection while driving through EEG signals. They found that the increased power of theta wave in the frontal lobe extracted by EEG signal processing can be used as an early detection indicator of distraction for driver inattention [24].
The above literature investigated and explored driver cognition, drowsiness, fatigue, and braking intention through EEG signal extraction features, and it improved its positive effect on driving assistance. However, relatively few studies have explored the EEG signals of drivers during normal driving.
3. Materials and Methods
3.1. Experiment
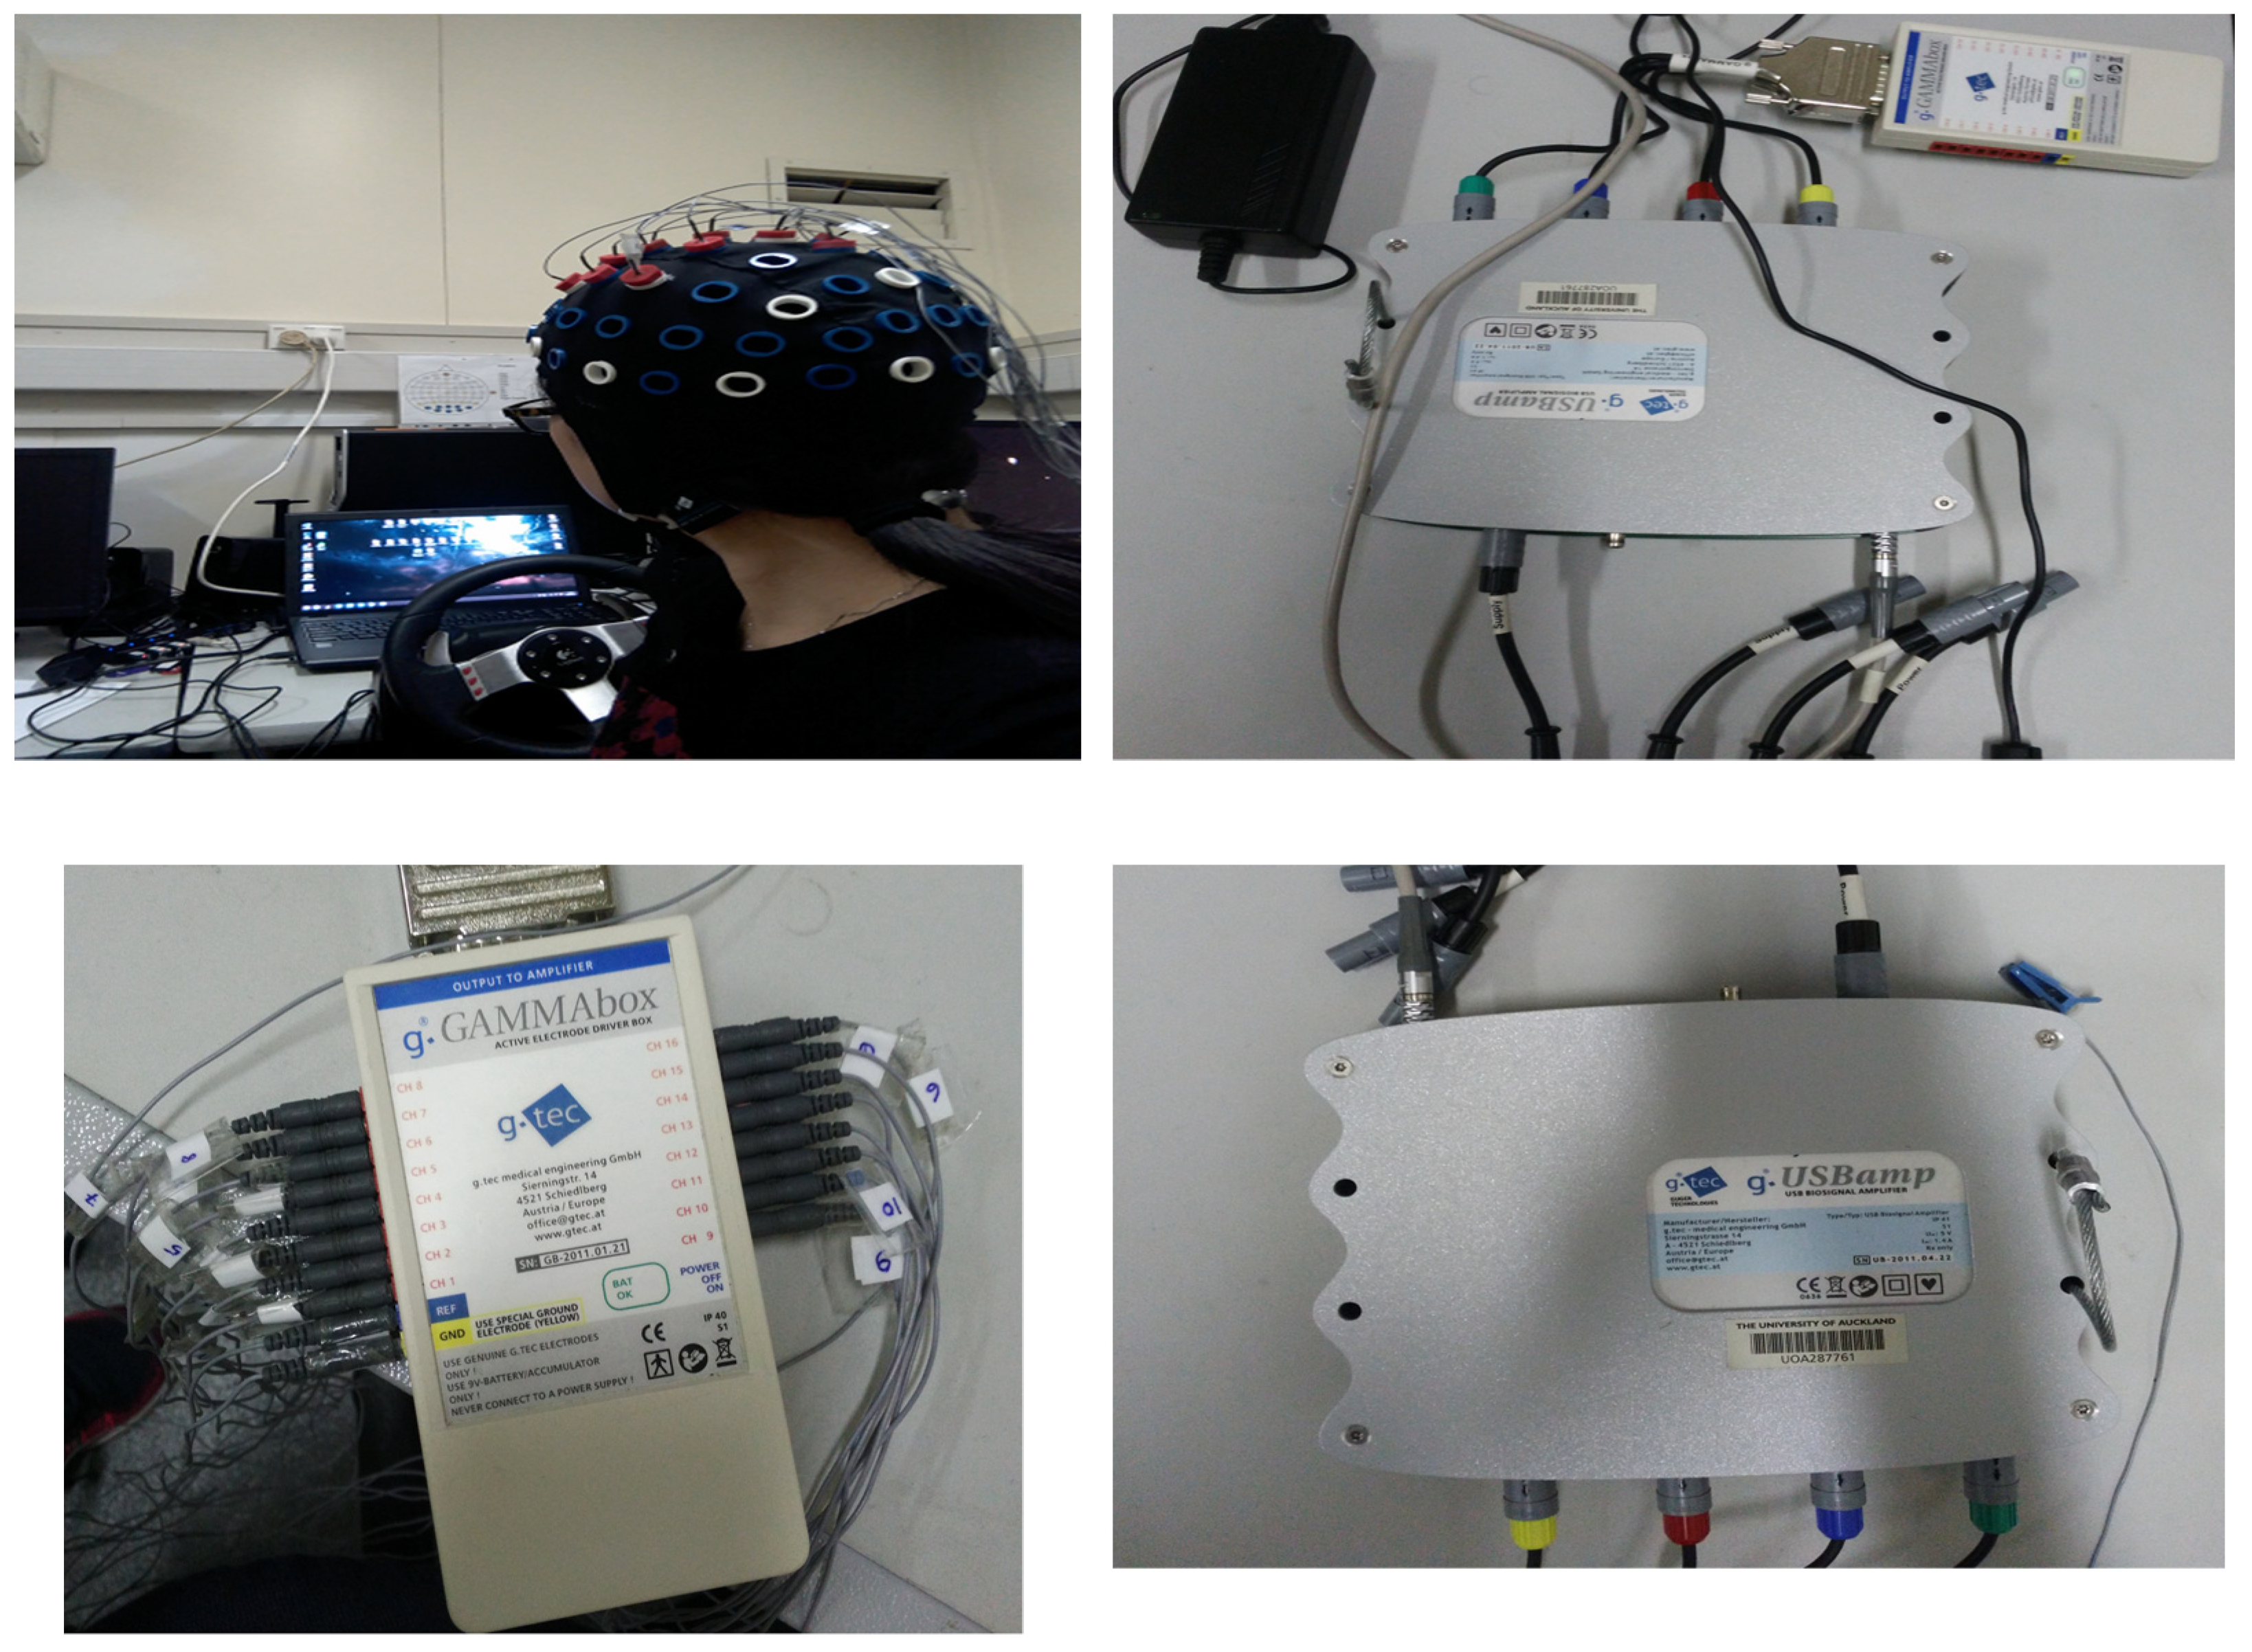
A driving simulation experiment platform and EEG signal acquisition platform were built, EEG signals were collected through the EEG device g.USBamp, and a route was selected. The two platforms included two parts. One part was a virtual driving platform composed of simulation software for driving simulation, a computer, and a hardware system for driving operation. The other part was EEG acquisition equipment, which was composed of an EEG signal amplifier, power supply equipment, 32 electrodes, electrode caps, and display equipment for showing EEG signal graphics. Figure 1 showed the driving virtual environment and the experimental equipment. The EEG signals were collected while driving at the same time. The driving process of the route included driving intention operations, such as turning left, turning right, and going straight. Nine drivers were selected, aged between 20 and 23 years old, had a driving license, and did not have any brain diseases. Moreover, a relevant pre-experiment training for drivers was conducted. This experiment was approved by the school ethics committee.
Driving operation was conducted through a driving simulator, and EEG signal information was collected simultaneously. The first 3 s and the last 3 s of data from the EEG signals of the left, right, and straight driving intentions during driving were collected in EEG. In signal acquisition, a 50-Hz power frequency noise signal was filtered out using EEG equipment. The collection frequency was 256 Hz, and the time for collecting EEG information was 3 s. Moreover 16-channel EEG signal information was collected. Meanwhile, 16-channel electrodes mainly included the area above the left and the right hemispheres of the brain. The 16-channel electrodes were F3, FC3, C3, F1, FC1, C1, Fz, FCz, Cz, CPz, F2, F4, C2, C4, FC2, and FC4. By testing these electrodes, the corresponding EEG data were obtained, thereby providing a basis for the analysis of the EEG signals. Table 1 shows the electrode positions in certain brain areas.
3.2. Analysis of Driving Intention Data
Driving intentions in this experiment had three main kinds: turn left, turn right, and go straight. The EEG signals of the three driving intentions were collected. The time window data of the traditional driving intention object generally included 3, 6, and 10 s for research. This study selected 3 s of data for analysis and research; collected the 3-s EEG signals of the driver turning left, right, and going straight; and processed and analyzed the 3-s EEG signals. The sampling frequency was 256 Hz, and the EEG signals corresponding to the left-turn, right-turn, and the straight-forward driving intentions for 3 s had 768 data points. Taking the right-turn driving intention as an example, when a driver turned on the right turn signal, the moment when the driver turned right was determined. The EEG data of the first 3 s of the right turn were collected as research data, and Python was used to read the EEG signals. All EEG data were screened; left turn, right turn and straight drive of different drivers were classified; and EEG data were normalized. Table 2 shows the EEG data of the right-turn driving intention. Table 3 displays the EEG data of the left-turn driving intention. Table 4 presents the EEG data of the straight driver behavior.
4. Models and Methods
EEG signals were decomposed in the wavelet domain, and the wavelet db3 was selected and decomposed into three, four, and five layers. The wavelet was transformed to obtain wavelet coefficients. Part of the wavelet coefficients was decomposed into EEG signals and noise, and another part was decomposed into noise signals. Wavelet decomposition transformed to extract useful EEG signals. Moreover, the decomposed signals were used as input into the independent component analysis model to continue filtering. Thereafter, wavelet packet processing technology was used to extract energy as the input data of the input model for training and testing.
4.1. Wavelet Transform Principle
Wavelet transform is an important tool for time–frequency research. Through wavelet transform, localized frequency analysis can be performed, which overcomes the shortcomings of the Fourier transform, and it is suitable for processing nonstationary signals. Wavelet transform is a time–frequency analysis method with multi-resolution characteristics. It can have good resolution in the time and frequency domains, and it is considerably suitable for processing EEG signals. Wavelet transform is a localized analysis in the time and frequency domains. Signals are refined in multiple scales through scaling and translation operations. Frequency and time are subdivided at low and high frequencies, respectively. Various time-varying signals can be effectively decomposed, and signal and noise can be separated substantially. Commonly used wavelet basis functions include the wavelet function, wavelet function system, and complex wavelet. The choice of wavelet basis is founded on which group of wavelet basis obtains the largest wavelet coefficients in which the variance value is small and which group of wavelet basis is selected. Internationally renowned wavelet analysis scholar Inrid Daubechies constructed the wavelet function Daubechies. The wavelet base in the Daubechies series is denoted as dbN, where N is sequence N = 1, 2, …, 10.
The basic wavelet transform principle is to use the wavelet function system to approximate a signal and to obtain the signal through translation or expansion via a basic wavelet function.
The decomposition of the wavelet one-dimensional transform is as follows:
where is the mother wavelet, a is the translation factor, b is the expansion factor, and is the wavelet coefficient of the signal, is energy finite signal. The projection decomposition of under these wavelet basis functions is the continuous wavelet transform
Continuous wavelet and wavelet coefficients are discretized, and the discrete wavelet function is obtained as follows:
Formula (3) represents the discrete wavelet basis function, and Formula (4) represents the discrete wavelet transform. Each letter has the same meaning as Formulas (1) and (2).
Wavelet transform is divided into three layers, only decomposes the low-frequency part, and it does not consider the high-frequency part. Signal S = CA3 + CD3 + CD2 + CD1 + CA1, where S is signal, where CA is the approaching signal—which is the low-frequency part—and CD is the detail signal, which is the high-frequency part (Figure 2).
The frequency range of the beta waves in EEG signals is 14–30 Hz, and that of gamma waves is 30–60 Hz. Therefore, the EEG signals are divided into three layers by db3 wavelets A3, D3, D2, and D1. The sampling frequency is 256 Hz. According to the sampling theorem, D1 is the first layer and the frequency range is 64–128 Hz. D2 is the second layer and the frequency range is 32–64 Hz. D3 is the third layer and the frequency range is 16–32 Hz. A3 is the third layer and the frequency range is 8–16 Hz. Therefore, the beta and gamma waves are in the third and second layers, respectively.
4.2. Wavelet Threshold Denoising
Wavelet threshold denoising occurs through wavelet transform, which maintains the wavelet coefficients higher than the threshold, and sets the wavelet coefficients below the threshold to zero. In this manner, the useful signal information is preserved and the noise signal is filtered out. Thereafter, processed wavelet coefficients are reconstructed to obtain denoised EEG signals. The selection of the threshold and the threshold function is particularly important.
Threshold selection rules mainly include minimum and maximum thresholds, fixed thresholds, adaptive thresholds based on the unbiased likelihood estimation principle, and heuristic thresholds. The four threshold selection rules have their respective advantages and disadvantages. The minimum–maximum value mainly realizes the minimization of the maximum mean square error and produces the minimum variance extreme value. The fixed threshold value aims to select a fixed threshold value according to the characteristics of signals to reduce noise when it is reduced. The soft threshold estimator determines the minimum risks and obtains the adaptive thresholds. The heuristic threshold is a threshold method based on the ideas of adaptive and fixed thresholds.
The two main types of threshold functions are hard and soft. The hard threshold function compares the wavelet coefficients before the wavelet transform with the threshold value. The absolute value of the wavelet coefficients is higher than the threshold value, and that of the wavelet coefficient is set to zero if the absolute value is below the threshold value.
The hard threshold function is as follows:
where is the wavelet coefficient of the original signal, is the wavelet coefficient after threshold quantization, and T is the threshold.
The soft threshold function compares the wavelet coefficients before the wavelet transform with the threshold value. Wavelet coefficients, whose absolute value is above or equal to the threshold, are set to a constant difference, and wavelet coefficients below the threshold are set to zero. Hard threshold easily loses some useful signals after processing. Hence, soft threshold is selected to process and to analyze EEG signals. Some studies have been based on soft and hard thresholds, and they have made improvements [13,14].
The soft threshold function is as follows:
where is the wavelet coefficient of the original signal, is the wavelet coefficient after threshold quantization, and T is the threshold.
The noise reduction effect is evaluated using the signal-to-noise ratio (SNR) and minimum mean square error. The smaller the minimum mean square error, the closer the processed signal to the original signal. The larger the SNR, the more useful the information and the less noise the information has.
The maximum–minimum threshold method is as follows:
The maximum–minimum threshold method minimizes the maximum risks. The original noisy signal is considered similar to the estimation formula of the unknown regression function. This extreme value estimation minimizes the maximum mean error in the function. This study uses the maximum–minimum threshold method to obtain the threshold.
The signal changed by wavelet is filtered using the independent component analysis method, and the filtered signal is processed via a wavelet packet transform.
Wavelet packet transform decomposes high frequency on the basis of wavelet transform theory.
Python is used to process and to analyze the EEG signal noise reduction of the wavelet transform and to evaluate the processing effect through the minimum mean square error and SNR.
Signals before and after noise reduction are compared to one another. Through wavelet stratification, soft threshold is used for wavelet transform noise reduction analysis. Figure 3 illustrates that the right turn of the F3 channel is used as an example.
The minimum mean square error obtained using Python to simulate noise reduction is 0.001697, indicating that the effect is excellent.
4.3. Wavelet Packet Theory and Its Characteristic Analysis
Orthogonal wavelet decomposition aims to decompose the low-frequency coefficients into two parts, and obtain the low- and high-frequency coefficient vectors. Thereafter, the new low-frequency coefficient vector is continuously decomposed into low- and high-frequency coefficient vectors, but the latter is no longer disintegrated. Wavelet packet decomposition continues to break down high-frequency coefficients. Furthermore, the high-frequency coefficient vector is decomposed into two parts, different from wavelet decomposition, and it is considerably detailed. See Figure 4, the abscissa represents the frequency, and the ordinate represents the amplitude of the signal.
This study uses wavelet packet energy, and it is a feature vector as input to the Bayesian recognition model for recognition. Wavelet packet energy is obtained through the wavelet packet coefficient.
4.4. Driving Intention Recognition Based on Bayesian Theory
Suppose A and B are any two events, and P(A) > 0. Under the condition that event A has occurred, the conditional probability of event B occurring is as follows:
where P(A) and P(B/A) are the prior and the posterior probabilities, respectively.
Therefore, the multiplicative theorem can be obtained as follows:
If P(A) > 0 and P(B) > 0 for any two events A and B, respectively, then:
Let A1, A2, …, An be any n events, n >= 2, and P(A1, A2, …, An) > 0; thus,
for any event B, the total probability formula is as follows:
From the preceding conditional and total probability formulae, Bayes’ theorem can be obtained as follows:
Naive Bayes classifier works on the basis of Formula (12):
where is the posterior probability, is the likelihood probability, is the prior probability, and is the marginal probability.
Assuming that the likelihood probability of feature x follows a normal distribution:
The three main categories of driving intention recognition are turn left, turn right, and go straight. Assuming that the probability of a certain category is the same, prior probability is as follows:
The following formula is used when recognizing driving intensions:
where j represents turning left, going straight, and turning right; i represents the number of channels; k represents the number of drivers; and represents the kth characteristic parameter of the number of ith channels. indicates the category of the ith channel number.
This research selects the first channel (F3) of the left hemisphere of the brain for research. The analysis results show that when wavelet and wavelet packet decompositions are divided into five layers, the recognition rate is the highest, and the recognition rate of a driving intention through Python simulation reaches 82.6%. Table 5 shows the SVM model, random forest (RF) model, decision tree model, Naive Bayes model, and recognition rates.
5. Discussion and Conclusions
In this study, driving intentions are identified through EEG signals, and the original EEG signals are denoised through wavelet packet theory. Driving intentions are also predicted by inputting denoised EEG signals into the Naive Bayes SVM, RF, and decision tree models. The Naive Bayes model prediction of the driving intentions of turning right and left is up to 82.6%. In this research, predictions are not made about turning left, turning right, and going straight at the same time. This part of the research content will be added to future research. Different noise reduction and recognition methods will also be used to identify driving intentions in the future. Regarding the age of the drivers, the age of the drivers selected in the paper is 20–23 years old, and the age stages are relatively concentrated. In future research, drivers of different ages will be studied and analyzed.
Sustainable transportation development is inseparable from driving intention recognition and assisted and autonomous driving development. Driving intention recognition can identify driving intentions in advance to reduce the occurrence of traffic accidents. At the same time, early driving intention recognition can assist driving and provide a strong guarantee for autonomous driving, which is the future trend of sustainable transportation development. The traditional research objective of driving intention is mainly based on the state of vehicles. State parameters are measured, processed, and analyzed as the input objects of driving intention recognition. The driving intention recognition model is used, and EEG signals are the objects of studying driving intentions. In addition, the measures to estimate driving intentions are directly measured. Compared with the traditional driving intention research objective, the identification of the characteristic parameters of the input EEG signals is superior, which is direct and accurate. Numerous interference factors are present in collecting EEG signals, thereby necessitating the noise reduction of these signals. Wavelet transform is used to analyze the driving intention data of EEG signals to reduce noise. Wavelet transform is utilized to analyze and to process nonstationary signals, frequency localization analysis, and other characteristics are performed, and the driving intention data of EEG signals are processed and analyzed. EEG signals are divided into five layers, and the soft threshold method is used thereafter to process the signals. The minimum mean square error of the signal after noise reduction is 0.001697, thereby obtaining a good noise reduction effect. The noise reduction of wavelet transform theory continues to have shortcomings. Specifically, it only decomposes low-frequency signals, and it cannot decompose high-frequency signals. Thus, wavelet packets are used to extract energy features from the denoised EEG signals and input them to driving intentions. In the recognition model, a good recognition effect is obtained, and the maximum recognition rate reaches 82.6%. In future research, in-depth investigations on noise control are needed to provide a reference for further sustainable transportation development.
Author Contributions
Conceptualization, M.L.; methodology, W.W., M.Q. and D.Q.; software, M.L. and Z.L.; data curation, M.L.; funding acquisition, Z.L. All authors have read and agreed to the published version of the manuscript.
Funding
This research was funded by the Provincial Natural Science Foundation of Shandong (No. ZR2019MEE072), the “Human Factors and Ergonomics” Industry-University Cooperation Collaborative Education Project (No. 202101042014), the National Natural Science Foundation of China (No. 51805034), and the Hubei Natural Science Foundation Youth Project (No. 2020CFB320).
Data Availability Statement
The data presented in this study are available on request from the corresponding author.
Conflicts of Interest
The authors declare no conflict of interest.
References
- Macioszek, E. Roundabout Entry Capacity Calculation—A Case Study Based on Roundabouts in Tokyo, Japan, and Tokyo Surroundings. Sustainability 2020, 12, 1533. [Google Scholar] [CrossRef] [Green Version]
- Severino, A.; Pappalardo, G.; Curto, S.; Trubia, S.; Olayode, I.O. Safety Evaluation of Flower Roundabout Considering Autonomous Vehicles Operation. Sustainability 2021, 13, 10120. [Google Scholar] [CrossRef]
- Wang, Z.; Yue, Y.; Li, Q.; Nie, K.; Tu, W.; Lian, S. Analyzing Risk Factors for Fatality in Urban Traffic Crashes: A Case Study of Wuhan, China. Sustainability 2017, 9, 897. [Google Scholar] [CrossRef] [Green Version]
- Alrugaib, A.K.; Al-Suwaidan, H.I.; Al-Rowais, S.S.; AlZahrani, A.N.; Abushryei, R.H.; Mobrad, A.M.; Alhazmi, R.A.; Althunayyan, S.M.; Goniewicz, K. The Prevalence of Risky Driving Habits in Riyadh, Saudi Arabia. Sustainability 2021, 13, 7338. [Google Scholar]
- Ma, Y.; Gu, X.; Yu, Y.; Khattakc, A.J.; Chen, S.; Tang, K. Identification of Contributing Factors for Driver’s Perceptual Bias of Aggressive Driving in China. Sustainability 2021, 13, 766. [Google Scholar] [CrossRef]
- Godzisz, K.; Dzikuć, M.; Kułyk, P.; Piwowar, A.; Kuryło, P.; Szufa, S. Selected Determinants of Sustainable Transport in the Context of the Development of a Low-Carbon Economy in Poland. Energies 2021, 14, 5418. [Google Scholar] [CrossRef]
- Pamucar, D.; Deveci, M.; Cantez, F.; Paksoy, T.; Lukovac, V. A novel methodology for prioritizing zero-carbon measures for sustainable transport. Sustain. Prod. Consum. 2021, 27, 1093–1112. [Google Scholar] [CrossRef]
- Solaymani, S.; Sharafi, S. A comparative study between government support and energy efficiency in malaysian transport. Sustainability 2021, 13, 6196. [Google Scholar] [CrossRef]
- Al-Thawadi, F.E.; Banawi, A.; Al-Ghamdi, S.G. Social impact assessment towards sustainable urban mobility in Qatar: Understanding behavioral change triggers. Transp. Res. Interdiscip. Perspect. 2021, 9, 100295. [Google Scholar] [CrossRef]
- Micucci, A.; Mantecchini, L.; Sangermano, M. Analysis of the Relationship between Turning Signal Detection and Motorcycle Driver’s Characteristics on Urban Roads, A Case Study. Sensors 2019, 19, 1802. [Google Scholar] [CrossRef] [PubMed] [Green Version]
- Borghini, G.; Vecchiato, G.; Toppi, J.; Astolfi, L.; Maglione, A.; Isabella, R.; Caltagirone, C.; Kong, W.; Wei, D.; Zhou, Z.; et al. Assessment of Mental Fatigue During Car Driving by Using High Resolution EEG Activity and Neurophysiologic Indices. In Proceedings of the 2012 Annual International Conference of the IEEE Engineering in Medicine and Biology Society, San Diego, CA, USA, 28 August–1 September 2012. [Google Scholar]
- Tran, Y.; Wijesuryia, N.; Thuraisingham, R.A.; Craig, A.; Nguyen, H.T. Increase in regularity and decrease in variability seen in electroencephalography (EEG) signals from alert to fatigue during a driving simulated task. In Proceedings of the 2008 30th Annual International Conference of the IEEE Engineering in Medicine and Biology Society, Vancouver, BC, Canada, 20–25 August 2008; pp. 1096–1099. [Google Scholar]
- Mohamed, F.; Yaacob, S.; Nataraj, S.K. Conceptual Approach in Determining Fatigueness and Drowsiness Detection Using EEG-Based and Artificial Neural Network. 2016. Available online: http://ir.unikl.edu.my/jspui/handle/123456789/15024 (accessed on 3 April 2022).
- Hernández, L.G.; Mozos, O.M.; Ferrández, J.M.; Antelis, J.M. EEG-based detection of braking intention under different car driving conditions. Front. Neuroinform. 2018, 12, 29. [Google Scholar] [CrossRef]
- Nguyen, T.H.; Chung, W.Y. Detection of Driver Braking Intention Using EEG Signals During Simulated Driving. Sensors 2019, 19, 2863. [Google Scholar] [CrossRef] [Green Version]
- Hajinoroozi, M.; Mao, Z.; Jung, T.P.; Lin, C.T.; Huang, Y. EEG-based prediction of driver’s cognitive performance by deep convolutional neural network. Signal Process. Image Commun. 2016, 47, 549–555. [Google Scholar] [CrossRef]
- Lin, C.T.; Lin, K.L.; Ko, L.W.; Liang, S.F.; Kuo, B.C.; Chung, I.F. Nonparametric Single-Trial EEG Feature Extraction and Classification of Driver’s Cognitive Responses. EURASIP J. Adv. Signal Process. 2008, 2008, 849040. [Google Scholar] [CrossRef] [Green Version]
- Chuang, C.H.; Lai, P.C.; Ko, L.W.; Kuo, B.C.; Lin, C.T. Driver’s cognitive state classification toward brain computer interface via using a generalized and supervised technology. In Proceedings of the 2010 International Joint Conference on Neural Networks (IJCNN), Barcelona, Spain, 18–23 July 2010. [Google Scholar]
- Li, G.; Lee, B.L.; Chung, W.Y. Smartwatch-Based Wearable EEG System for Driver Drowsiness Detection. IEEE Sens. J. 2015, 15, 7169–7180. [Google Scholar] [CrossRef]
- Lin, F.; Ko, L.-W.; Chuang, C.; Su, T.; Lin, C. Generalized EEG-Based Drowsiness Prediction System by Using a Self-Organizing Neural Fuzzy System. IEEE Trans. Circuits Syst. I Regul. Pap. 2012, 59, 2044–2055. [Google Scholar]
- Tomita, Y.; Mitsukura, Y.; Tanaka, T.; Cao, J. EEG frequency analysis for dozing detection system. In Proceedings of the International Joint Conference on Neural Networks, DBLP 2010, Barcelona, Spain, 18–23 July 2010. [Google Scholar]
- Rahma, O.N.; Rahmatillah, A. Drowsiness analysis using common spatial pattern and extreme learning machine based on electroencephalogram signal. J. Med. Signals Sens. 2019, 9, 130–136. [Google Scholar] [CrossRef] [PubMed]
- Picot, A.; Charbonnier, S.; Caplier, A. On-line automatic detection of driver drowsiness using a single electroencephalographic channel. In Proceedings of the Annual International Conference of the IEEE Engineering in Medicine and Biology Society, Vancouver, BC, Canada, 20–24 August 2008. [Google Scholar]
- Lin, C.; Chen, S.; Ko, L.; Wang, Y. EEG-based brain dynamics of driving distraction. In Proceedings of the 2011 International Joint Conference on Neural Networks, San Jose, CA, USA, 31 July–5 August 2011; pp. 1497–1500. [Google Scholar]
Figure 1.
The driving virtual environment and experimental equipment.

Figure 2.
Wavelet triple decomposition.

Figure 3.
Original signal and denoised signal.

Figure 4.
Wavelet packet decomposition.


Table 1.
Electrode positions in certain brain areas.
| Name | Codename |
|---|---|
| Frontal Pole | Fp1, Fp2 |
| Frontal | F3, F4, Fz |
| Central | C3, C4, Cz |
| Parietal | O1, O2 |
| Occipital | F7, F8 |
| Inferior Frontal | T3, T4 |
| Temporal | T5, T6 |
| Auricular | A1, A2 |
Table 2.
Part of the EEG signal for right-turning driver behavior.
| Feature 1 | Feature 2 | Feature 3 | Feature 4 | Feature 5 | Feature 6 |
|---|---|---|---|---|---|
| −0.470793 | −0.249510 | 0.213251 | 0.375241 | 0.038111 | −0.390818 |
| −0.567436 | 0.270887 | 0.391875 | −0.414986 | −1.106893 | −0.890131 |
| −0.075273 | −0.224075 | −0.203669 | −0.202219 | −0.349733 | −0.329178 |
| −0.161783 | −0.160582 | −0.344785 | −0.356788 | −0.163295 | −0.094263 |
| −0.144852 | −0.383548 | −0.270902 | 0.088163 | 0.268423 | 0.108332 |
Table 3.
Part of the EEG data for left-turning driver behavior.
| Feature 1 | Feature 2 | Feature 3 | Feature 4 | Feature 5 | Feature 6 |
|---|---|---|---|---|---|
| −0.397875 | 0.216597 | 0.6633238 | 0.056592 | 0.056592 | 0.304644 |
| −0.216548 | −0.340523 | 0.787573 | 0.0832372 | 0.0832372 | 0.261192 |
| −0.192910 | −0.477439 | 0.363420 | 0.305807 | 0.305807 | −0.058086 |
| −0.199765 | 0.215363 | −0.111654 | 0.381363 | 0.381363 | −0.325223 |
| −0.049635 | 0.835561 | −0.143058 | 0.021561 | 0.021561 | −0.219865 |
Table 4.
Part of EEG data of straight driver behavior.
| Feature 1 | Feature 2 | Feature 3 | Feature 4 | Feature 5 | Feature 6 |
|---|---|---|---|---|---|
| −0.191059 | −0.378736 | −0.373933 | −0.090514 | 0.146785 | −0.027652 |
| 0.603281 | 0.096405 | −0.402995 | −0.150650 | 0.313094 | 0.105828 |
| 0.137631 | −0.009734 | −0.357019 | −0.198795 | 0.159049 | 0.177211 |
| −0.217545 | −0.172413 | −0.158614 | −0.060870 | 0.229063 | 0.292487 |
| −0.038612 | −0.126484 | −0.375715 | −0.178546 | 0.045054 | −0.259565 |
Table 5.
Model and recognition data.
| Model/Recognition Rate | Turning Left and Going Straight | Turning Right and Going Straight | Turning Right and Left |
|---|---|---|---|
| Support Vector Machine | 69.2% | 69.2% | 50% |
| Random Forest | 68.4% | 68.4% | 72% |
| Decision-Making Tree | 70.7% | 70.5% | 73.9% |
| Naive Bayes | 71.5% | 70.5% | 82.6% |
Publisher’s Note: MDPI stays neutral with regard to jurisdictional claims in published maps and institutional affiliations. |
© 2022 by the authors. Licensee MDPI, Basel, Switzerland. This article is an open access article distributed under the terms and conditions of the Creative Commons Attribution (CC BY) license (https://creativecommons.org/licenses/by/4.0/).
Share and Cite
MDPI and ACS Style
Li, M.; Wang, W.; Liu, Z.; Qiu, M.; Qu, D. Driver Behavior and Intention Recognition Based on Wavelet Denoising and Bayesian Theory. Sustainability 2022, 14, 6901. https://0-doi-org.brum.beds.ac.uk/10.3390/su14116901
AMA Style
Li M, Wang W, Liu Z, Qiu M, Qu D. Driver Behavior and Intention Recognition Based on Wavelet Denoising and Bayesian Theory. Sustainability. 2022; 14(11):6901. https://0-doi-org.brum.beds.ac.uk/10.3390/su14116901
Chicago/Turabian StyleLi, Min, Wuhong Wang, Zhen Liu, Mingjun Qiu, and Dayi Qu. 2022. "Driver Behavior and Intention Recognition Based on Wavelet Denoising and Bayesian Theory" Sustainability 14, no. 11: 6901. https://0-doi-org.brum.beds.ac.uk/10.3390/su14116901
Note that from the first issue of 2016, this journal uses article numbers instead of page numbers. See further details here.