
Business Customer Satisfaction with B2B Consulting Services: AHP-Based Criteria for a New Perspective

1
Institute of Management and Political Science, Faculty of Public Governance and Business, Mykolas Romeris University, 08303 Vilnius, Lithuania
2
LLC Bridge2Apex, 06325 Vilnius, Lithuania
*
Author to whom correspondence should be addressed.
Sustainability 2022, 14(12), 7437; https://0-doi-org.brum.beds.ac.uk/10.3390/su14127437
Submission received: 19 May 2022
/
Revised: 15 June 2022
/
Accepted: 15 June 2022
/
Published: 17 June 2022
(This article belongs to the Special Issue Sustainability and Consumer Behavior: Perspectives and Developments)
Abstract
:The paper aims to take a novel look to customer satisfaction with B2B service through the lens of customer perception of service quality criterions. By literature review, service quality models define sets of key factors, however, do not rank them by significance. Based on AHP analysis of expert interview results, we argue that the current models of service quality reflect business customer perceptions partially. This is a gap in B2B service quality knowledge that this study seeks to fill. The quality criterions play a role in building a positive balance between the customers’ expected and perceived value of services. Thus, we propose the model of customer satisfaction with factors divided into essential, significant, sufficient, and marginal according to their level of significance. The model may encourage academics to understand customer satisfaction criteria in service quality not only as generic sets but also at the importance of the criteria themselves in relation to each other. In the aspect of practical implication, the model can help B2B enterprises to rationally manage resources on set quality priorities to achieve customer satisfaction and, hence, to ensure organization sustainability by more effective organizational resource management. The model also can benefit B2B customers when considering service providers capable of delivering service quality which meets the expectations.
1. Introduction
The business-to-business (B2B) model has its own challenges, as the end user of the service is another company with complex organizational needs. A business customer’s satisfaction is largely determined by the value created by B2B, which the customer can transform into its business success. As a result, business customers are increasingly demanding tailored solutions [1]. With this aim, before starting the collaboration, the client company and the service provider company agree on unique, client-specific project Key Performance Indicators (KPIs) that lead to the outcome the client expects. The KPIs enable the customer and the service provider to agree on the service provider’s obligations and the quality of service. However, business realities, thus the needs of business customers, can change more rapidly than can be predicted in advance. This was clearly illustrated by the COVID-19 crisis [2], not only due to external shocks, but also for a variety of other reasons, such as when the client company demands services while the project may no longer be the same as originally foreseen in the service contract. Although it is understandable that not all the client’s wishes can be taken into account by the service provider, it is easier to agree on a mutually valuable cooperation when clients trust the service providers and are generally satisfied with their work. Hence, to increase customer trust and satisfaction, B2B service companies need to continuously improve their performance, adjust their customer engagement strategy, innovate, etc. [3,4,5,6].
Monitoring and evaluating customer satisfaction allows service providers to identify specific areas for improving their performance. Analysis of the academic literature shows that customer satisfaction is mostly based on the SERVQUAL model or its variations such as SERVQUAL (Refined), SERVPERF, etc. Milner and Furnham [6] observe that the criteria for assessing service quality, as defined in these models, are repeated in almost every academic study that examines customer satisfaction. Some less commonly used models, such as SERV*OR [7], also offer criteria for assessing service quality. Thus, researchers have been trying for decades to purify a set of criteria covering a range of customer satisfaction characteristics but have not delved deeply enough into the extent to which specific service satisfaction factors are meaningful to the business customers themselves. In other words, there is a gap in the academic literature for science-based evidence on the priorities of customer satisfaction criteria.
The paper analyses customer satisfaction with B2B service through the lens of customer perception of service quality criterions and develops an understanding of whether there is a difference between the importance and significance of customer satisfaction characteristics. With the help of analytic hierarchy process (AHP) method to analyze expert interview results, we provide a new approach to B2B customer satisfaction criteria and propose the customer satisfaction with B2B service criteria model. This paper extends the use of service quality evaluation models’ components by applying a new approach to customer satisfaction. The paper suggests a model that allows the service provider to better manage the priorities of performance (service delivery) and goes beyond the measurement of customer satisfaction. The aim of the service quality assessment models and the model proposed in this paper is the same: to increase customer satisfaction with services. However, SERVQUAL and other similar models measure satisfaction after the service has been provided, whereas the model proposed in this paper increases the likelihood that resources will be focused on the areas that are most important for customer satisfaction. Thus, both models are concerned with increasing customer satisfaction, however, SERVQUAL and its derivatives allow for learning from experience, whereas the model proposed in this paper is concerned with increasing potential customer satisfaction by working in a targeted way upfront.
The paper consists of three main sections: a theoretical background explaining the importance, role, and limitations of customer satisfaction measurement tools in a B2B setting, the methodology of the study, and a review of expert interview results. Finally, the paper concludes with a discussion, findings, and guidelines for future research.
2. Theoretical Background
2.1. Characteristics of a B2B-Type Consulting Service
B2B business service can be characterized by some certain features of which the most important is customer-supplier cooperation, i.e., suppliers and customers together create value for service end users.
By its very nature, a B2B is characterized by nurturing the continuity of customer relationships. Customer is also concerned with continuity, as the customer directly uses received service or transforms it to create services or products for the end user, which cannot be done without one or another business service provider. The more unique the specification of the customer’s preferences, the more cooperation is needed. To a minimum, service providers and service users cooperate when customers provide information to suppliers about the ongoing service’s compliance with their expectations. Meanwhile, more customer engagement is needed when the service provider develops a system for customer operations. Cooperation helps supplier to better respond to customer needs and contribute to the creation of service value.
Business consulting services are B2B services, which business organizations use to find solutions to various business problems [8]. Unlike traditional service delivery methods, customers usually contact consulting firms themselves when they encounter a problem or foresee an upcoming problem. This type of contact between the two parties can have an impact on client satisfaction, as the cooperation between the two parties is driven by the client’s need and initiative, rather than by the consulting firm’s achievement of its marketing strategy. However, it is worth stressing that ‘usually’ does not mean always. Every company has certain areas of activity where efficiency could be improved, risks managed, and problems solved.
One common observation highlighted by B2B researchers (e.g., [9,10]) is that the main task of a consultancy firm is to help clients help themselves, rather than solving customers’ problems or providing expert advice. Schmuck [11] identifies counselling as a service through which counsellors encourage their customers to make changes. Vukotić, Aničić and Vukotić [12] describe the functions of business consulting through four main features: (1) Consulting is an independent service; (2) Consulting services are primarily designed to advise rather than to make decisions for the managers of organizations or to lead the company; (3) Consulting is a service that provides insights and knowledge to make the management of the company more effective; (4) Consulting is not a service that provides a simple and easy-to-implement solution to difficult managerial problems. Thus, the client must be proactive and trust the consultant and keep in mind that since the consultant does not have the power to make firm-level decisions for the client, the client bears full responsibility for the decisions and actions taken. Vukotić, Aničić and Vukotić [12] point out that consulting is a hard and systematic work based on the analysis of hard facts and the exploration of all possible solutions, and that the mutual commitment and cooperation between the consultant and the client is critical for the quality and outcome of the consultancy.
McGivern [13] (p. 381) found in a study that business customers tend to evaluate the quality of consulting services in terms of the relationship between the consultant and the customer during the service process, rather than in terms of outputs and outcomes. According to Ibatova et al. [14], companies use consulting services to achieve a positive economic effect—the client is interested in the outcome rather than the consulting process. Nevertheless, the customer evaluates the quality of consulting services through a different prism—not economic, but worldview.
Cameran, Moizer, and Pettinicchio [15] point out that the customer’s expectations of the consultancy firm have an impact on the perception of the quality of consultancy. The smaller the gap between a particular consulting firm and what the client considers to be the ideal consulting firm, the higher the satisfaction with the service that is ultimately achieved. However, Momparler et al. [16] specify that the characteristics of the consulting team are more important for service quality than those of the consulting firm. Consulting firms ensure customer satisfaction through the consultants’ qualifications, experience, knowledge, initiative, motivation, ability to create a positive microclimate, etc. [14,15,16,17].
In summary, the consultant’s ability to establish a productive relationship with the client has a major impact on the client’s perception of the quality of the consulting service.
2.2. Service Quality Measurement Instruments
The definition of services is relatively broad. According to Gronroos [18] (p. 10), services are defined by four main characteristics: (1) services are physically intangible; (2) a service is an ongoing activity or series of activities; (3) services are, at least to a small extent, provided and consumed simultaneously; and (4) the recipient of the service contributes, at least to a small extent, to the creation of the service. The above features explain why service quality cannot be defined straightforwardly. Service quality is understood in a rather subjective way by service users, professionals, and academics alike. Moreover, the same quality criteria are of different importance for clients and customers [19]. Thus, before measuring service quality, it is necessary to define which aspects of service quality will be assessed.
There are different approaches to customer satisfaction criteria. When it comes to customer satisfaction, it is important to distinguish between a B2B customer and a B2C customer. A B2C customer is a buyer. A buyer—a person or a company—uses services or buys products once, does not establish a relationship with the supplier and, in most cases, does not maintain a relationship after the transaction. In contrast, as mentioned above, a B2B customer is a company that orders professional services from other companies and maintains a relationship with them during and after the purchase of the service. Below is an overview of sources relevant to the assessment of B2B customer satisfaction, discussing fundamental criteria and criteria models for measuring service quality.
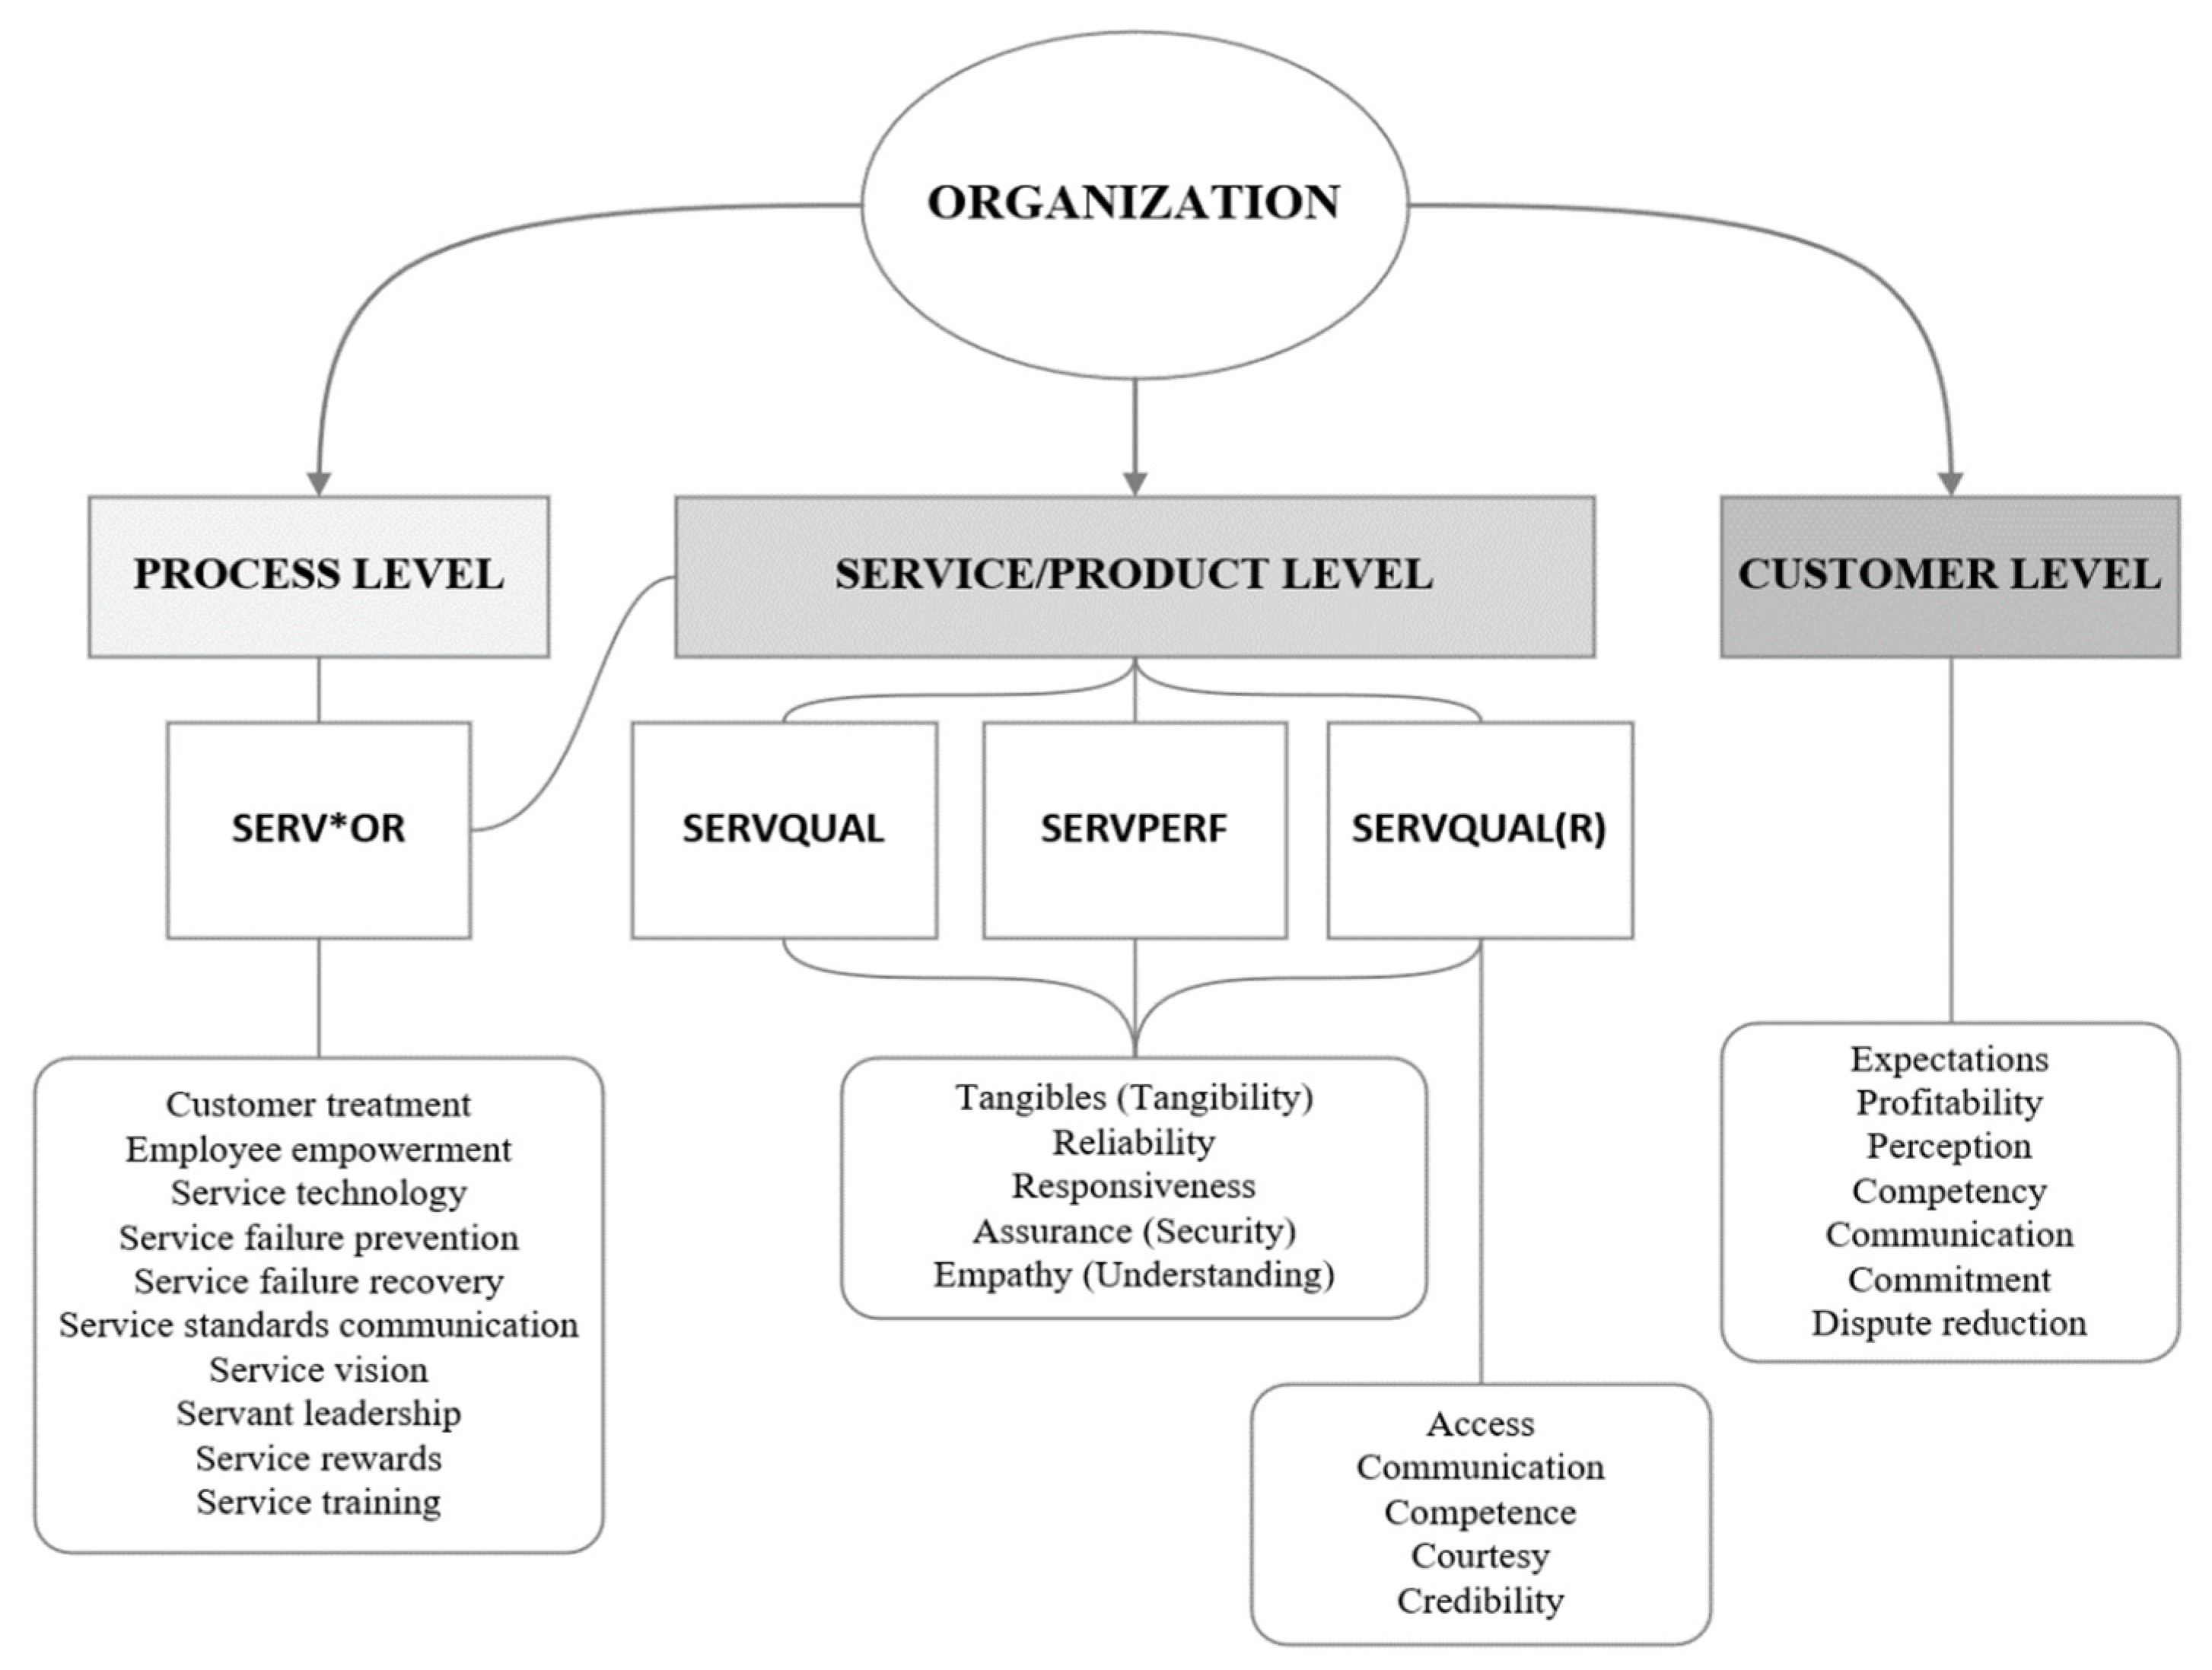
Parasuraman, Zeithaml, and Berry [20] developed SERVQUAL, a service quality assessment model, through a series of follow-up studies, which enabled the objectivity of the assessment to be achieved despite the physical intangibility of the service. The authors of the model introduced 5 factors: tangibles, reliability, responsiveness, assurance, and empathy. Later, Parasuraman, Berry, and Zeithaml [21] modified the SERVQUAL model by extending it with the following factors: access, communication, competence, courtesy, and credibility. The SERVQUAL model is still widely used in recent scientific studies (e.g., [22,23,24,25]). It is the foundation on which customers’ perception of service quality is built. On the other hand, researchers note that the model is not suitable for all service types, business models, and industries [22,26]. These and some other shortcomings of the SERVQUAL model have inspired researchers to look at service quality and the model itself in a new light. For example, Durdyev Serdar et al. [25] studied customer satisfaction across five service quality factors: reliability, responsiveness, assurance, empathy, and tangibility. The authors found that all five service quality factors have a positive impact on customer satisfaction, which leads to future customer behavior—loyalty. The SERVQUAL model became the basis for other models. Raišys and Baranauskas [27] proposed the combined approach to interlinkage between key service quality assessment models, based on SERVQUAL model, and their constituent criteria, which are most cited in academic literature (Figure 1).
In addition to SERVQUAL and its derivative models, there are more widely used service quality assessment models and quality assurance factor frameworks, e.g., QFD (Quality Function Deployment) model [28], Kano model [29] or I-S (Importance-Satisfaction) model [30].
Quality assessment models are updated according to the challenges of the changing times and industry. For example, the QFD model has been developed by researchers by adding a Mass Customization dimension [31,32]. The QFD model has also been combined with the Kano model to assess service quality [33,34]. Meanwhile, the Kano model itself is an improved version of the importance-performance analysis (IPA) model [35], correcting some limitations of the IPA model [36]. Subsequently, based on the IPA analysis model, another model, the importance-satisfaction (I-S) model, was developed, which included an additional customer satisfaction factor.
The combination of models suggests that pure models lack efficiency. Combining different models and testing the effectiveness of such combinations in different service areas leads to a very large number of variations in the evaluation criteria. On the other hand, each new model provides a solid basis for the emergence of newer models. The continuous development, adaptation, and renewal of customer satisfaction evaluation models enable companies to keep pace with the changing business world.
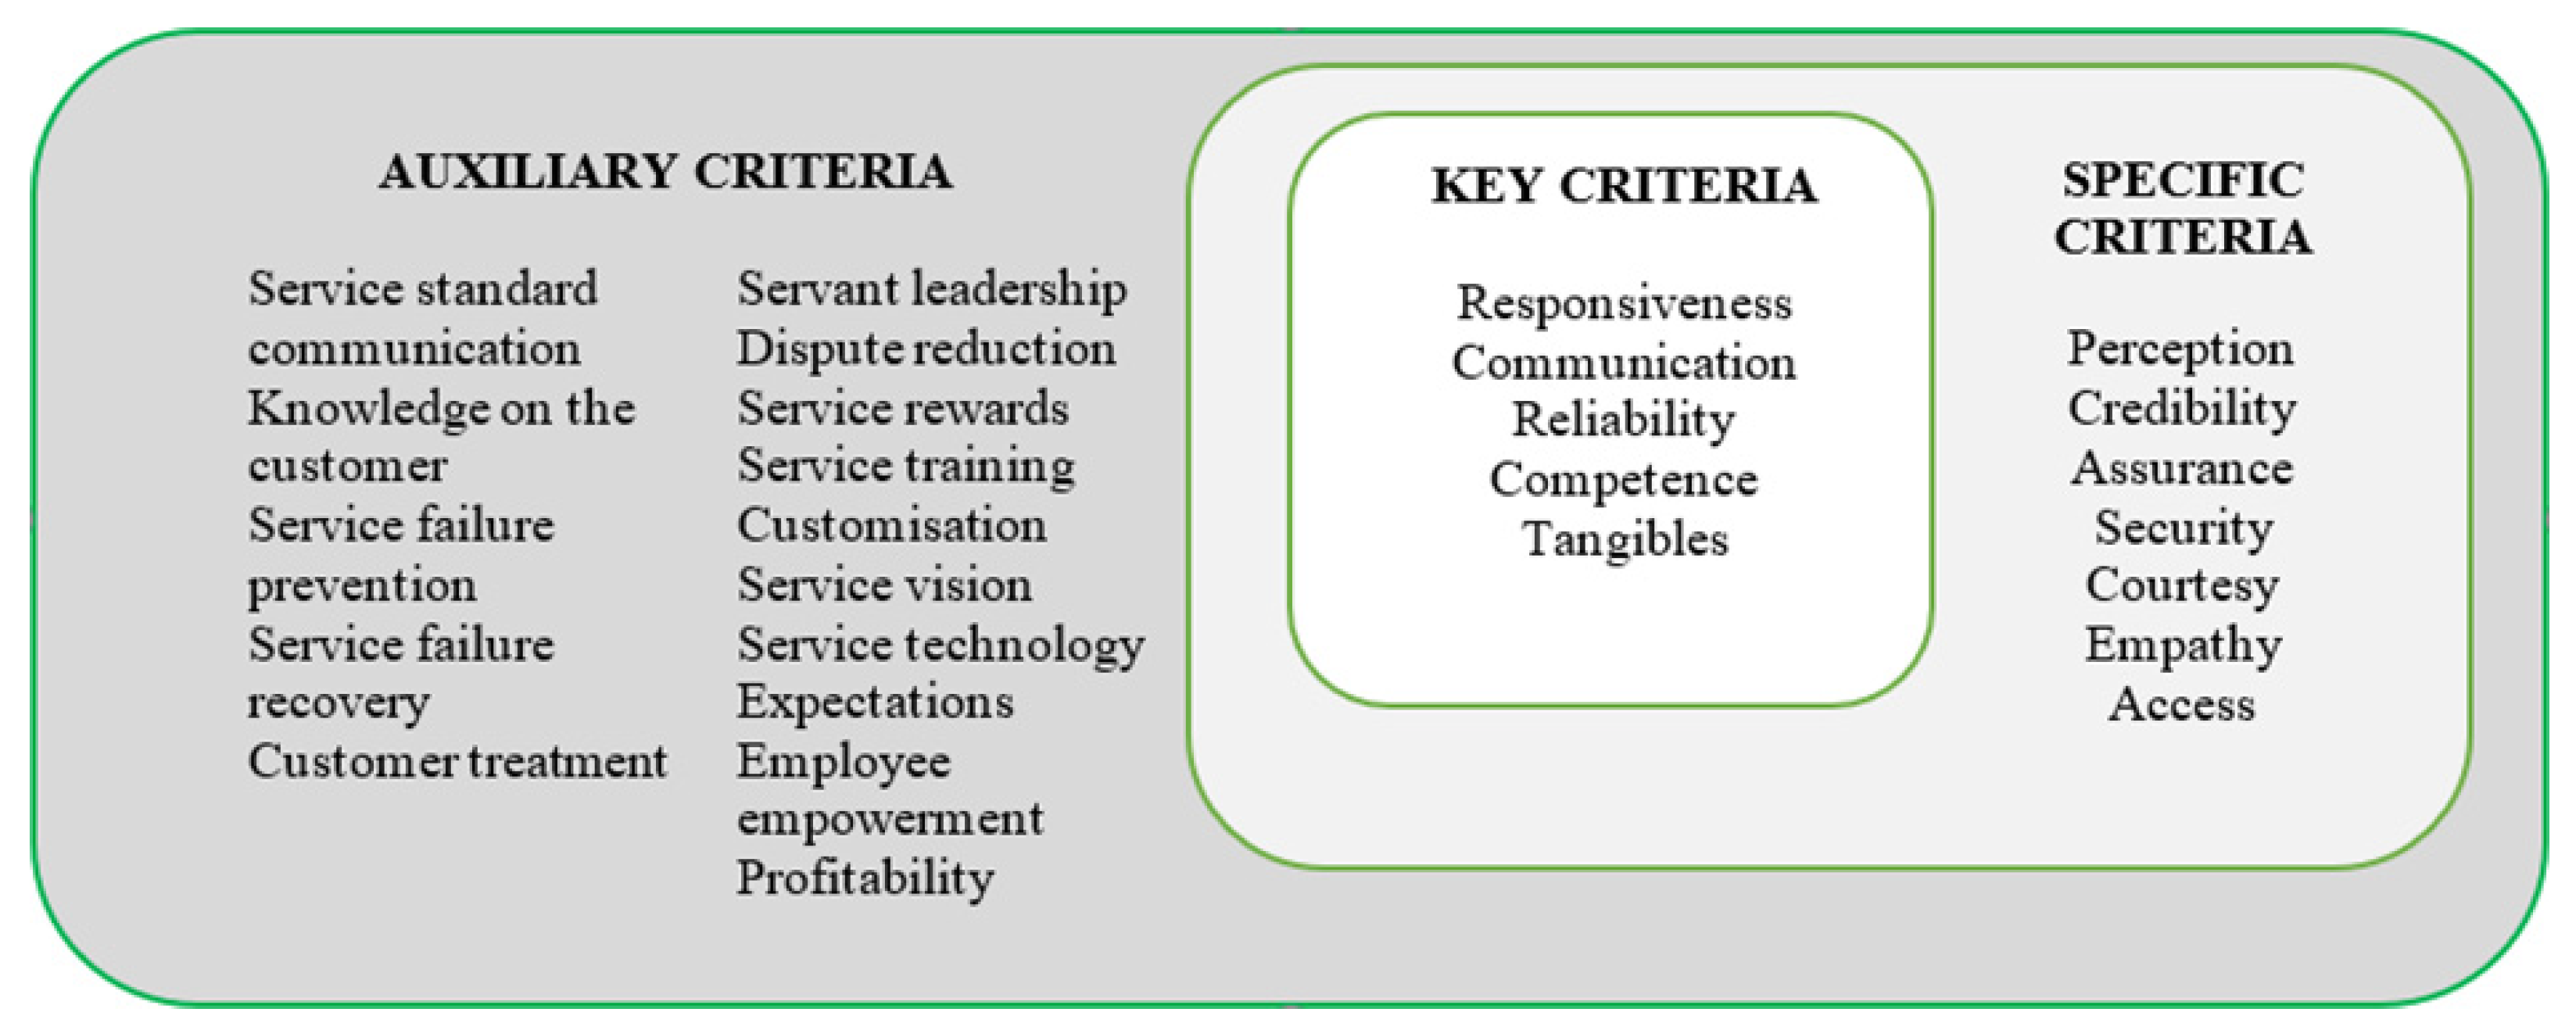
As can be seen, the reviewed models present sets of important factors of service quality, nevertheless, do not differentiate them according to priorities or a level of significance. As a result, service providers may face a potential problem. Aiming to achieve high customer satisfaction they may place organizational resources on aspects of service quality that customers will not perceive as critical. To address this gap, we propose a theoretically based approach to service quality criteria system (Figure 2). Here, “Key criteria” are criteria presented in the majority of SERVQUAL, its derivatives and other analyzed models and concepts. The “Specific criteria” consists of criteria that are stressed as important in some but not all analyzed models and concepts. Finally, the “Auxiliary criteria” are those that are mentioned in a minority of the models and/or are attributed to specific industry sectors.
The theoretical model is further tested empirically.
3. Methods
With the help of an expert survey and using the Analytic Hierarchy Process (AHP) method, we examined the experts’ views on the importance of customer satisfaction criteria for B2B services. Based on the 27 service quality criteria identified in the theoretical analysis (see in Figure 2), we developed a pairwise comparison matrix for the AHP assessment. The aim of the study was to structure the results of the expert survey and compare them with the results of the theoretical analysis.
Pairwise comparisons of given criteria result in higher information saturation per respondent compared to simple ranking of criteria. For this reason, the AHP method was chosen as it allows to obtain meaningful and reliable results in a small sample of respondents [37,38]. Using AHP method, most commonly used sample size is 2–100 experts [39]. There is no strict minimum sample size for AHP analysis, although some studies have used sample sizes of 4–9 and only a few studies have used a sample size of more than 30 [40]. On average, interviewing more than 7 to 10 experts may introduce repetitive information gathering [41].
The AHP method allows the assignment of values to the criteria, which determines the preference of the criteria or the ranking of an alternative. Such values can be used to select alternatives according to a hierarchical structure [42]. AHP is usually used to rank the weights of the criteria when choosing between several alternatives, however, in the case of a single alternative, the focus is on the weight of the criteria themselves.
The following steps are applied in the design of the research instrument, data collection, and data analysis:
A pairwise comparison matrix is constructed in which the criteria in the first column and first row are identical. Each criterion is compared in pairs with every other criterion, and the criteria themselves are not compared with each other, since the importance of a criterion compared with itself will always be the same.
Respondents fill in the pairwise comparison values in a table (matrix) according to a table of relative importance levels, otherwise known as the Saaty table in scientific literature [43].
Removing inconsistencies between assessments where necessary and feasible is also a particular focus. More than 2 options (criteria) may lead to assessment inconsistencies. For example, if a > b > c > a, it would mean that a is more important than b, b is more important than c, and c is more important than a. Inconsistencies are resolved by applying a > c, instead of a < c. However, it is not always possible to eliminate inconsistencies in assessment, especially when there are more than 7 options [44].
The information obtained is processed by mathematical methods according to Saaty [43].
According to Atanasova-Pacemska et al. [45] (p. 375), when n number of elements are compared, matrix A is formed, by dimension n × m:
The relation between the elements to be compared is expressed as:
According to the mathematical model of Saaty [43], if the element A is n times more important than element B, then element B has 1/n importance over element A:
After filling in the values of matrix A, a normalized matrix B [bij] is produced, whose elements are calculated:
Calculating the weights of the elements of normalized matrix B, i.e., the eigenvector w = [wi], is done by calculating the arithmetic mean of each row of the matrix according to the following formula:
The consistency of the respondent’s opinion should then be calculated. According to Saaty and Ozdemir [46] (p. 238), in mathematical terms the matrix A = (aij) is consistent when aijajk = aik, however it is very rare for this formula to be completely working in practice. According to Atanasova-Pacemska et al. [45] (p. 375), when matrix A is completely consistent, a matrix C is constructed, in which all elements w are identical:
However, according to Atanasova-Pacemska et al. [45] (p. 375), in the case where matrix A is not consistent, the relative weight wi is approximated by the average of the n elements of row i of the normalized matrix C. When is a calculated average vector , then λmax can be calculated:
The closer the numerical value of λmax is to the quantity of elements n, the more consistent is matrix A. On this basis, consistency ratio CR is calculated:
where: CI—consistency index:
and RI—random index. Values of RI depend on the number of matrix elements n (Table 1).
According to Saaty and Ozdemir [46] (p. 242), the maximum allowed number of consistency ratio CR equals 0.10. The more elements n are in the matrix, the higher the chance of consistency ratio being CR > 10, which would mean that decision maker’s opinion varies and may be inconsistent. The authors explain this with the work of Miller [44], which is based on the characteristics of the human psyche. The authors suggest that assessing more than 7 items (n) may be difficult for humans due to the inability to remember more than 7 pieces of information at a time. However, other authors disagree with this view. For example, Lane and Verdini [48] conclude, that a limit of CR ≤ 0.10 is too strict, for larger matrices consisting of n > 10 elements. Liang, Brunelli and Rezaei [49] note that 10% threshold rule of consistency ratio for AHP is criticized by other scholars and points out that Saaty [50] himself has subsequently proposed additional thresholds of 5% and 8%. Meanwhile Dodd, Donegan, and McMaster [51] claim that the consistency index CI depends directly on the number of elements n in the matrix, so the more elements in the matrix, the more incompatibility is possible. As stated by Byun [52], the consistency ratio CR measures the probability that the matrix has been filled in randomly, so a CR ≤ 0.2 is generally considered tolerable, but sometimes it is not possible to get consistent answers from the experts, because they may not answer questions which they find difficult when filling in the pairwise comparison matrix. Therefore, some pairwise comparison matrices cannot be rejected even if CR ≥ 0.2.
Against the background of the above-mentioned scholarly debate, we follow the approach of Byun [52] and the recommendations of Lane and Verdini [48], Dodd, Donegan and McMaster [51] and Byun [52]. Thus, we have chosen a consistency ratio threshold of CR ≤ 0.5.
3.1. Participants
The sample of six experts selected by purposive sampling method: These are managerial level individuals who are responsible for ensuring that the services provided by the supplier companies are in line with the contract and for approving the acceptance and handover of services, and who have extensive experience of working with service providers. The length of the represented company’s existence has also been considered, which allows an assessment of successful experience in the B2B services sector. Thus, the criteria for selecting the experts were as follows:
- candidate has ≥5 years of experience working with companies in B2B services.
- company represented by the candidate exists for ≥15 years.
- the company represented by the candidate buys/has bought B2B services from ≥2 companies.
- the candidate is responsible for ensuring that the services provided by the supplier companies comply with the contract and for signing the acceptance and handover act.
- the candidate holds a managerial position in the organization represented.
To ensure transparency in the sampling process and to allow individuals that meet sampling criteria to be included in the sample, companies that operate in B2B setting with Microsoft partners to acquire software licenses, deployment, and project management services were selected.
For anonymity purposes, the experts were given codes E1, E2, E3, E4, E5, E6 for the analysis of the data. The full characteristics of the experts are presented in Table 2.
3.2. Survey Material
The matrices presented to experts for pairwise comparison were comprised of 27 criteria which were described to the experts as following:
- Tangibles—ability of the service provider to provide the required number of tools and manpower, maintain order and thorough documentation. Tangible products, their condition, compliance with the requirements. More typical for contact services.
- Reliability—the service provider’s desire to help solve problems, provide services on time and in the form agreed upon, and periodically report progress to the client. Ability to deliver services on time, reliably and thoroughly.
- Responsiveness—the service provider’s desire to help customers and inform them about the duration of the service and the delay of work. Promptness and ability to deal effectively with complaints.
- Communication—communication of the service provider with the customer, which helps to improve mutual trust between stakeholders.
- Dispute Reduction—opportunities and efforts of the service provider to reduce the frequency of emerging disputes.
- Customization—determination and ability to adapt the offered services to the customer’s needs.
- Knowing the Customer—the service provider’s desire to find out and understand the customer’s needs. Shown attention to the customer.
- Customer Treatment—the service provider’s desire to ensure that the services or products perform as expected by the customer.
- Employee Empowerment—allowing day-to-day decisions to be made by the employees of the service company in order to meet the customer’s needs as quickly and efficiently as possible.
- Competence—the technical capacity of the stakeholders, which can be assessed in terms of the tools used and the experience and ability of the staff to provide the services.
- Assurance—employees who build the customer’s trust in the service provider. High standard of work performance, courtesy, sufficient knowledge to answer the customer’s questions and competence in solving problems.
- Service Technology—the service provider’s ability to use the latest technology to ensure a smooth collaboration process that meets customer expectations.
- Empathy—ability of the service provider to understand the specific needs of the customer, convenient working hours for customer, after-sales service and personalized attention to customer.
- Service Failure Prevention—the active effort of the service provider to prevent problems in the provision of the service.
- Access—service provider’s availability and ease of making contact with.
- Service Failure Recovery—ability of the service provider to solve problems related to the provision of the service quickly and efficiently.
- Courtesy—respect, care and friendliness shown to the customer by service provider.
- Service Standards Communication—equal understanding of the quality standards between employees of the company that provides the service.
- Credibility—the characteristics that would allow the customer to trust the service provider are displayed—reputation, name, personal characteristics of the service staff.
- Service Vision—understanding of the service concept, vision, and the most important elements of the service by each employee of the company providing the service.
- Security—physical and financial security and confidentiality throughout employment relationship between service provider and customer.
- Servant Leadership—active involvement of the service-providing team leader—team members are encouraged to follow suit and pursue high quality standards.
- Service Rewards—rewards/compensation for the employees of the service company in order to maintain a high level of service quality.
- Perception—equal understanding of service success criteria between service provider and the customer.
- Service Training—training of the service-providing company employees in various areas related to the provision of the service in order to acquire the ability to meet the complex needs of the client.
- Expectations—the results that the party purchasing the service expects. Expectations determine whether the customer’s wishes and needs will be fulfilled as expected, with the result imagined before receiving the service.
- Profitability—additional benefits. Return on investment over a period of time after the service has been provided.
- The description of criteria was supplied to experts next to the pairwise comparison matrix for a quick reference of the criteria on demand.
3.3. Validity and Ethics
To ensure the internal validity of the research, experts with sufficient expertise in assessing the determinants of customer satisfaction with B2B services were selected for the study pool. The effectiveness of the expert selection criteria was tested by including a control group of 5 respondents in the survey. The control group consisted of representatives from companies purchasing B2B services. All respondents in the control group worked in teams with B2B service providers but did not meet one or more of the expert selection criteria. Analysis of the data showed that the control group had a consistency ratio (CR) ranging from 0.505 to 1.004, with an average of 0.72. In other words, the control group’s consistency ratio was above the CR ≤ 0.5 threshold for the validity of this type of study [48,49,51,52]. Thus, it can be argued that the indicators of expertise used for the selection of experts were effective in ensuring the internal validity of the study.
The external validity of the survey is ensured by the choice of survey instrument. According to Pakalniškienė [53] (p. 30), construct validity is revealed through whether the chosen methodology measures a specific construct, i.e., whether it measures what is intended. As noted by Pauer et al. [54], the AHP approach proposed by Saaty is designed for DMs (decision makers) to solve complex multi-criteria decision problems. The method is based on the idea that it is more reliable to assess the relative importance of multiple criteria using an appropriate pairwise comparison in a hierarchical framework than to assess their absolute importance. According to Wind and Saaty [55], in general criterion analysis, the respondent faces a trade-off task, but in the analytic hierarchy approach, the trade-off is reached by evaluating a series of simple pairwise comparison matrices. Thus, in our study, the AHP approach allowed us to achieve more precise results than other tools would have allowed.
Research ethics: Experts participated in the study of their own free will. Before the survey began, respondents were briefed on the purpose, method, and ethics of the study. The participants did not object to being assigned a unique code to describe their expert status. To ensure the anonymity of the experts, during the data collection phase, the matrices containing the criteria scores entered by the experts were stored in a Microsoft Excel document without the name of the expert and/or any other personally identifiable data or codes. As the experts scored the criteria in the matrix using numerical values, no sensitive or personally identifiable information was collected in the survey dataset.
4. Results
The experts’ pairwise comparisons of the customer satisfaction criteria for B2B service quality (hereafter referred to as ‘criteria’), calculated by the AHP method, resulted in percentage weights for each of the criteria. Aggregating these weights by means of geometric averaging, all the criteria evaluated by the experts were given average percentage weights, resulting in a ranking of the importance of the criteria. The analysis revealed that not all criteria in the sequence were within a similar range of each other. The differences between the weights of the criteria appeared to be variable and inconsistent. This feature is illustrated in Table 3, which shows the order of significance of the criteria, the percentage scores (the sum of the percentage scores for all 27 criteria equals 100%), and the arithmetic difference between the higher position and the next position (by order number). It can be observed that the difference between the first and the second criterion is 0.42 percentage points, between the second and the third criterion 0.25, etc. The highest difference between the ranks is 0.62 and the lowest 0.01.
The size of the interval between the different criteria determined the ranking of the criteria into units. The largest (0.62) gap in values between criteria 3 and 4 justify the attribution of these criteria to a separate unit of most significant criteria, whereas the gap between the twenty-first and twenty-second criteria indicates a very low weight difference relative to each other. With a margin of 0.01%, it would be difficult to argue that one criterion significantly outweighs another. Following this logic, the entire set of expert-assessed criteria has been sliced at the highest points of the gap. This resulted in four criterion units comprised by essential, significant, sufficiently significant, and marginally significant criteria regarding customer satisfaction with B2B services. Essential criteria have the biggest impact on client’s satisfaction with services and are of fundamental significance. Significant criteria supplement essential criteria by providing additional measures to ensure the client’s satisfaction. While sufficiently significant criteria have a positive impact on client’s satisfaction with services, their impact is relatively low. Marginally significant criteria offer only marginal impact on client’s satisfaction with services.
Comparing the theoretical model of customer satisfaction criteria for B2B services with the empirical results, the theoretical model should be remodeled:
- (a)
- by introducing a fourth—marginally significant group of criteria for customer satisfaction with B2B services;
- (b)
- redistributing the criteria in order of significance between criteria groups.
In the empirical model, there are three essential criteria, but only one of them—competence, is included in the group of key criteria in the theoretical model. The other three of the five criteria are distributed in the other two groups, and one is generally of low importance. It is surprising that service failure recovery and service failure prevention are identified in the theoretical model as auxiliary criteria that do not have a particularly high significance in relation to the other criteria. However, the empirical evidence suggests that these two criteria are much more important: according to the results of the study, they are two of the three most significant criteria.
There is a strong drop in the number of criteria in the group of specific criteria, and as many as four of the seven theoretical criteria are empirically found to be only marginally significant. These are courtesy, credibility, assurance, and security. Meanwhile, empathy and understanding should, according to expert judgement, be in the group of auxiliary criteria as supporting criteria for customer satisfaction with B2B services.
Of the fifteen criteria in the group of auxiliary criteria, six were identified by the experts as marginally significant. Four are in line with the position in this group, being identified as of marginal significance, and three are more important and should be placed in the group of specific criteria, being identified as sufficiently significant. The remaining two in this group, as discussed above, are among the most important criteria.
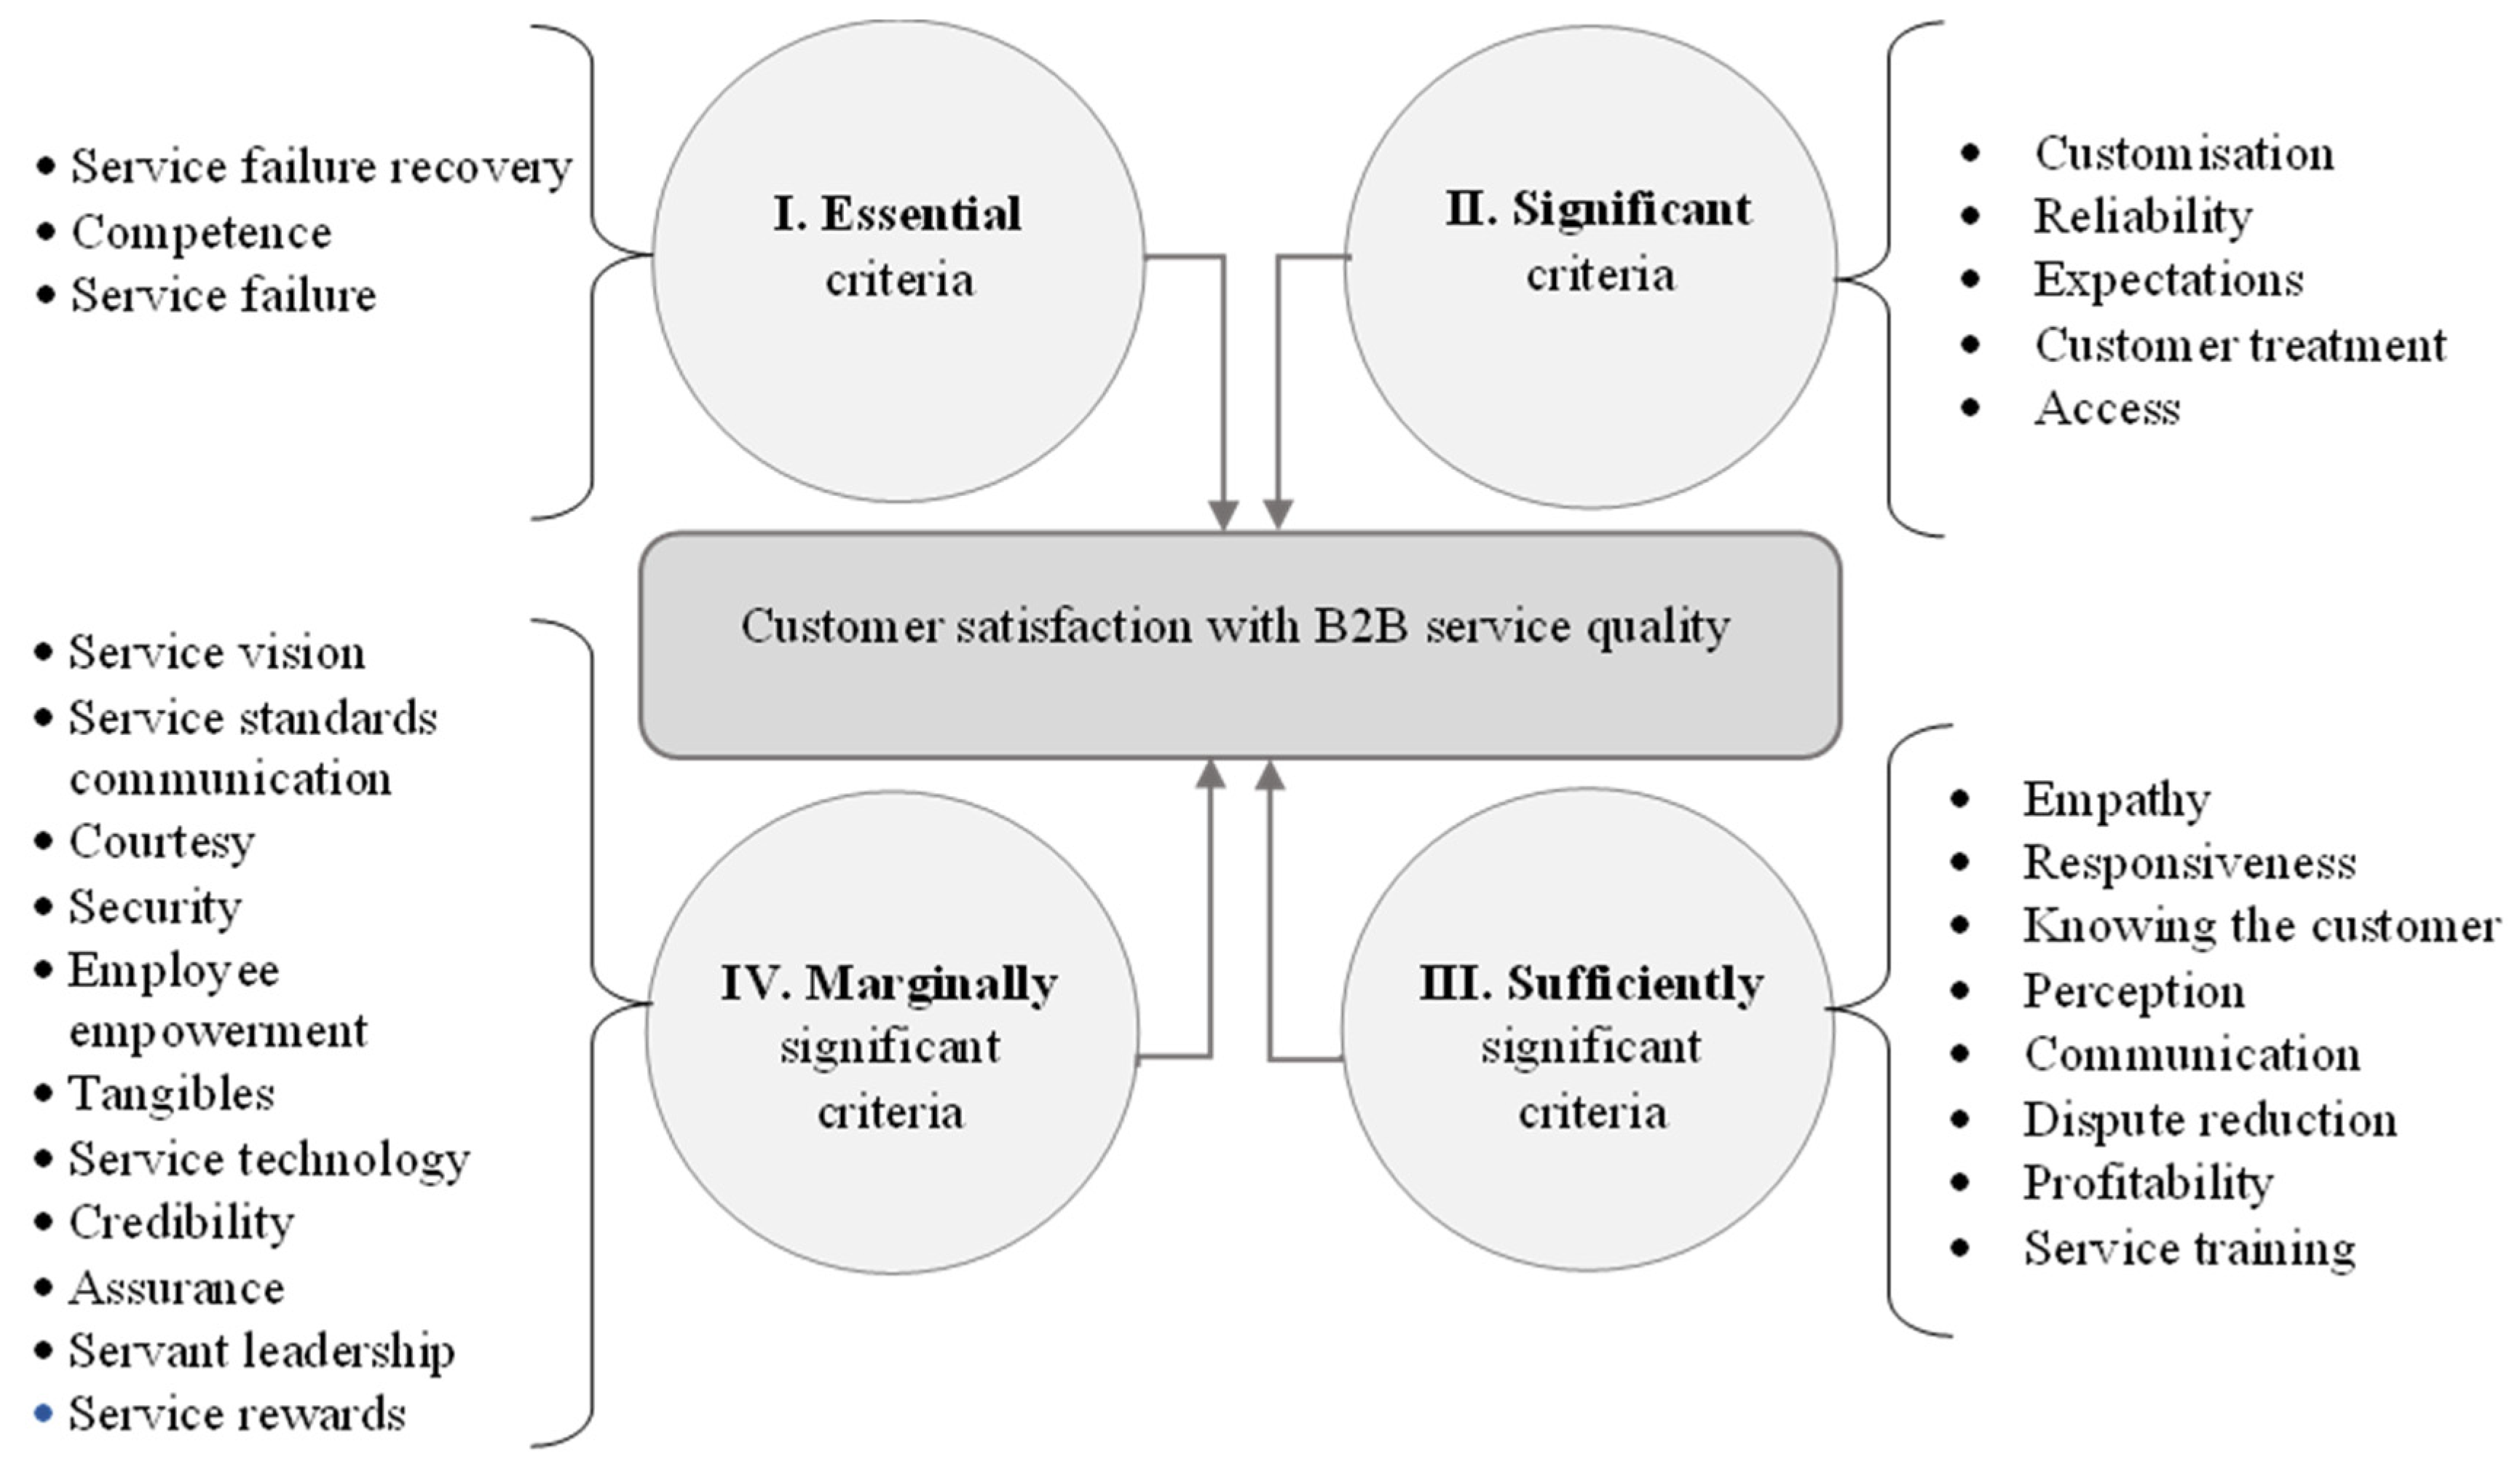
Removing what experts consider to be marginally significant criteria from the theoretical model leads to a real overlap between theory and practice. When examining the overlap between the theoretical and empirical models, it is observed that the overlap between the key and essential criteria is 25% (one out of four), between the specific and significant criteria it is 20% (one out of five), and between the auxiliar and sufficiently significant criteria the overlap is 50% (four out of eight). If all the criteria in the theoretical and empirical model were perfectly matched to the positions in the groups, this would result in a 100% matching. In this case, out of the three groups (making an integer of 3), the match is 1/4 + 1/5 + 1/2 = 0.95. Thus, taking the arithmetic mean gives a match of 0.95/3 = 31.6%. This means that the theoretical and empirical models overlap by 31.6% in their respective criteria. It can be said that one third of the criteria are given the same weight in the empirical context as in the theoretical one. The remainders (68.4%) of the criteria do not overlap in importance in theory and practice. By assigning these criteria to appropriate groups of importance based on their significance, the theoretically and empirically based model of customer satisfaction with B2B service quality was constructed. The model, with the purpose of convenience called ESISUM (E—Essential, Si—Significant, Su—Sufficient, M—Marginal), is visualized by Figure 3.
5. Discussion
The SERVQUAL service quality assessment model [20] is still widely used in research. However, according to our study, the two criteria of the model—tangibility and assurance—are not as significant as one might expect. Three of the five SERVQUAL criteria—reliability, responsiveness, and empathy—were in the significant and sufficiently significant criteria groups in our study. Thus, the applicability of the SERVQUAL model, at least in the field of B2B project management and consulting services, is conditional.
Another, SERV*OR model [7], according to our study, is not inferior to the SERVQUAL model. According to our expert evaluation, of the three most significant criteria in our model, two are the same as those defined in the SERV*OR model. Thus, although most of SERV*OR’s criteria are only marginally significant, a comparison between this model and SERVQUAL shows that it more accurately describes the most significant customer satisfaction factors.
Finally, when discussing the relevance of SERVQUAL(R) [21] in the consulting services sector, we observe that six out of the ten criteria defined in this model were distributed over three significance groups, while the remaining four criteria dropped out of order in our empirically tested model. Thus, the SERVQUAL(R) model can be seen as the least relevant of those discussed in the field of B2B consultancy services.
The model proposed in this paper helps to increase the opportunity for resources to be directed towards the areas that are most crucial for customer satisfaction, in contrast to SERVQUAL and other comparable models that assess satisfaction after the service has been given. Thus, while both models aim to increase customer satisfaction, SERVQUAL and its variations allow for learning from the past, whereas ESISUM aims to increase potential customer satisfaction by working in a focused manner up front.
Based on the results of the study, we suggest that for effective choices to be used in ensuring the satisfaction of business customers, the groups of criteria need to be periodically reassessed and, if necessary, adjusted.
6. Conclusions
Using the analytical hierarchy process method of expert evaluation, we tested the significance of the theoretically identified criteria for customer satisfaction with B2B services. In a sequence of twenty-seven criteria, four groups of significance emerged. The ranking of the criteria in order of significance enables a better definition of priorities in terms of customer perceived service quality and allows for a more targeted approach towards customer satisfaction with B2B services.
The comparison of the theoretical and empirical models of customer satisfaction with B2B consulting services revealed that only one third of the criteria overlap, i.e., fall into the same groups of theoretically important and empirically significant criteria. As the theoretical model can underestimate the practically important customer satisfaction criteria, there is a need to periodically update the groups of criteria to maintain relevance in practice.
We believe that our theoretically and empirically based model of customer satisfaction with B2B service quality has the potential to enable professionals and researchers to better understand the aspects of service quality that are important for customer satisfaction, as it represents the latest insights from academia and evidence from practice. In addition, the model ESISUM can benefit service users, i.e., B2B customers, when considering service providers capable of delivering high service quality.
The ranking of customer satisfaction criteria may encourage looking at quality and satisfaction criteria not only as a whole or as generic sets, but also at the relationship and importance of the criteria themselves in relation to each other. As observed in the study, when the importance of the criteria is assessed in mathematical rather than linguistic terms, the criteria are grouped according to customer preferences, which allows for a more precise assignment of the order of importance to one or another criterion.
Finally, we must mention the limitations of our study. Firstly, we investigated the significance of customer satisfaction criteria in one sector and limited geography—the project consulting service sector in Lithuania. It would be appropriate to check to what extent the results of our study are applicable to other B2B service sectors and other geolocations. Second, our study was conducted during a period of external environmental shocks (during the second quarantine of the COVID-19 pandemic), when consulting services were provided to clients exclusively remotely. This may have influenced the needs, attitudes, and perceptions of the service users, i.e., the customer companies. Periodically repeated research would allow the identification of changes in criteria significance trends, the collection of historical data on the past changes and the forecast of potentially needed changes in the future.
Author Contributions
Conceptualization, A.G.R. and S.J.R.; methodology, S.J.R. and A.G.R.; software, S.J.R.; validation, S.J.R.; formal analysis, S.J.R.; investigation, S.J.R. and A.G.R.; resources, S.J.R.; data curation, S.J.R.; writing—original draft preparation, S.J.R. and A.G.R.; writing—review and editing, A.G.R.; visualization, A.G.R. and S.J.R.; supervision, A.G.R. All authors have read and agreed to the published version of the manuscript.
Funding
This research received no external funding.
Institutional Review Board Statement
Not applicable.
Informed Consent Statement
Informed consent was obtained from all subjects involved in the study.
Data Availability Statement
Not applicable.
Acknowledgments
We would like to acknowledge the administrative support given by LLC Bridge2Apex, Lithuania.
Conflicts of Interest
The authors declare no conflict of interest.
References
- Kuhl, J.; Krause, D. Strategies for customer satisfaction and customer requirement fulfillment within the trend of individualization. Procedia CIRP 2019, 84, 130–135. [Google Scholar] [CrossRef]
- Bond, E.U.; de Jong, A.; Eggert, A.; Houston, M.B.; Kleinaltenkamp, M.; Kohli, A.K.; Ritter, T.; Ulaga, W. The future of B2B customer solutions in a post-COVID-19 economy: Managerial issues and an agenda for academic inquiry. J. Serv. Res. 2020, 23, 401–408. [Google Scholar] [CrossRef]
- Haming, M.; Murdifin, I.; Syaiful, A.Z.; Putra, A.H.P.K. The application of SERVQUAL distribution in measuring customer satisfaction of retails company. J. Distrib. Sci. 2019, 17, 25–31. [Google Scholar] [CrossRef]
- Leninkumar, V. The relationship between customer satisfaction and customer trust on customer loyalty. Int. J. Acad. Res. Bus. Soc. Sci. 2017, 7, 450–465. [Google Scholar] [CrossRef]
- Mittal, V.; Han, K.; Lee, J.-Y.; Im, B. Attribute-level satisfaction, overall customer satisfaction, and performance outcomes in business-to-business firms. SSRN J. 2017, 2964334. [Google Scholar] [CrossRef]
- Milner, R.; Furnham, A. Measuring customer feedback, response and satisfaction. Psychology 2017, 8, 350–362. [Google Scholar] [CrossRef] [Green Version]
- Lytle, R.S.; Hom, P.W.; Mokwa, M.P. SERV∗OR: A managerial measure of organizational service-orientation. J. Retail. 1998, 74, 455–489. [Google Scholar] [CrossRef]
- Benazic, D.; Varga, N. Service quality and customer satisfaction in business consulting services: An importance-performance analysis based on the partial least square method. In Economic and Social Development: Book of Proceedings; Varazdin Development and Entrepreneurship Agency: Varazdin, Croatia, 2018; pp. 380–391. [Google Scholar]
- Soriano, D.R. Quality in the consulting service—Evaluation and impact: A survey in Spanish firms. Manag. Serv. Qual. 2001, 11, 40–48. [Google Scholar] [CrossRef]
- Schabacker, M.; Gericke, K.; Szélig, N.; Vajna, S. (Eds.) Modelling and Management of Engineering Processes; Springer: Berlin/Heidelberg, Germany, 2015; ISBN 978-3-662-44008-7. [Google Scholar]
- Schmuck, R. Strategic management consulting in Hungary. Strateg. Manag. 2020, 25, 45–53. [Google Scholar] [CrossRef]
- Vukotić, S.; Aničić, J.; Vukotić, R. The importance of consulting in contemporary business management. J. Process Manag. New Technol. 2017, 5, 69–78. [Google Scholar] [CrossRef] [Green Version]
- McGivern, C. Some facets of the relationship between consultants and clients in organizations. J. Manag. Stud. 1983, 20, 367–386. [Google Scholar] [CrossRef]
- Ibatova, A.Z.; Kuzmenko, V.I.; Klychova, G.S. Key performance indicators of management consulting. Manag. Sci. Lett. 2018, 8, 475–482. [Google Scholar] [CrossRef]
- Cameran, M.; Moizer, P.; Pettinicchio, A. Customer satisfaction, corporate image, and service quality in professional services. Serv. Ind. J. 2010, 30, 421–435. [Google Scholar] [CrossRef]
- Momparler, A.; Carmona, P.; Lassala, C. Quality of consulting services and consulting fees. J. Bus. Res. 2015, 68, 1458–1462. [Google Scholar] [CrossRef]
- McLachlin, R. Service quality in consulting: What is engagement success? Manag. Serv. Qual. Int. J. 2000, 10, 141–150. [Google Scholar] [CrossRef]
- Gronroos, C. Service quality: The six criteria of good perceived service. Rev. Bus. 1988, 9, 10. [Google Scholar]
- Rashvand, P.; Zaimi Abd Majid, M. Critical criteria on client and customer satisfaction for the issue of performance measurement. J. Manag. Eng. 2014, 30, 10–18. [Google Scholar] [CrossRef]
- Parasuraman, A.; Zeithaml, V.A.; Berry, L.L. A conceptual model of service quality and its implications for future research. J. Mark. 1985, 49, 41–50. [Google Scholar] [CrossRef]
- Parasuraman, A.; Berry, L.L.; Zeithaml, V.A. Refinement and reassessment of the SERVQUAL scale. J. Retail. 1991, 67, 420–450. [Google Scholar]
- Teeroovengadum, V. Service quality dimensions as predictors of customer satisfaction and loyalty in the banking industry: Moderating effects of gender. Eur. Bus. Rev. 2022, 34, 1–19. [Google Scholar] [CrossRef]
- Giao, H.N.K.; Trang, N.D. Developing dimensions to measure the quality of construction project management service. Open Sci. Framew. 2010, 1–9. [Google Scholar] [CrossRef]
- Akdere, M.; Top, M.; Tekingündüz, S. Examining patient perceptions of service quality in Turkish hospitals: The SERVPERF model. Total Qual. Manag. Bus. Excell. 2020, 31, 342–352. [Google Scholar] [CrossRef]
- Durdyev, S.; Ihtiyar, A.; Banaitis, A.; Thurnell, D. The construction client satisfaction model: A PLS-SEM approach. J. Civ. Eng. Manag. 2018, 24, 31–42. [Google Scholar] [CrossRef]
- Nguyen, P.-H. A fuzzy analytic hierarchy process (FAHP) based on SERVQUAL for hotel service quality management: Evidence from Vietnam. J. Asian Financ. Econ. Bus. 2021, 8, 1101–1109. [Google Scholar] [CrossRef]
- Raišys, S.J.; Baranauskas, G. Drivers and challenges of customer satisfaction assessment in modern “business to business” models. Contemp. Res. Organ. Manag. Adm. 2022, 10, 14–23. [Google Scholar] [CrossRef]
- Yoji, A. QFD: The Customer-Driven Approach to Quality Planning and Deployment; Asian Productivity Organization: Tokyo, Japan, 1994; ISBN 978-92-833-1121-8. [Google Scholar]
- Kano, N. Attractive quality and must-be quality. Hinshitsu Qual. J. Jpn. Soc. Qual. Control. 1984, 14, 39–48. [Google Scholar]
- Yang, C.-C. Improvement actions based on the customers’ satisfaction survey. Total Qual. Manag. Bus. Excell. 2003, 14, 919–930. [Google Scholar] [CrossRef]
- Kuo, T.-C. Mass customization and personalization software development: A case study eco-design product service system. J. Intell. Manuf. 2013, 24, 1019–1031. [Google Scholar] [CrossRef]
- Vidor, G.; de Medeiros, J.F.; Fogliatto, F.S.; Tseng, M.M. Critical characteristics for the implementation of mass-customized services. Eur. Bus. Rev. 2015, 27, 513–534. [Google Scholar] [CrossRef]
- Tontini, G. Integrating the kano model and QFD for designing new products. Total Qual. Manag. Bus. Excell. 2007, 18, 599–612. [Google Scholar] [CrossRef]
- Tan, K.C.; Shen, X.X. Integrating kano’s model in the planning matrix of quality function deployment. Total Qual. Manag. 2000, 11, 1141–1151. [Google Scholar] [CrossRef]
- Martilla, J.A.; James, J.C. Importance-performance analysis. J. Mark. 1977, 41, 77–79. [Google Scholar] [CrossRef]
- Chen, K.-J.; Yeh, T.-M.; Pai, F.-Y.; Chen, D.-F. Integrating refined kano model and QFD for service quality improvement in healthy fast-food chain restaurants. Int. J. Environ. Res. Public Health 2018, 15, 1310. [Google Scholar] [CrossRef] [Green Version]
- Abduh, M.; Omar, M.A. Islamic-bank selection criteria in Malaysia: An AHP approach. Bus. Intell. J. 2012, 5, 19182325. [Google Scholar]
- Melillo, P.; Pecchia, L. What is the appropriate sample size to run analytic hierarchy process in a survey-based research. In Proceedings of the International Symposium on the Analytic Hierarchy Process, London, UK, 4–8 August 2016; pp. 4–8. [Google Scholar]
- Şahïn, M.; Yurdugül, H. A content analysis study on the use of analytic hierarchy process in educational studies. J. Meas. Eval. Educ. Psychol. 2018, 9, 376–392. [Google Scholar] [CrossRef]
- Darko, A.; Chan, A.P.C.; Ameyaw, E.E.; Owusu, E.K.; Pärn, E.; Edwards, D.J. Review of application of analytic hierarchy process (AHP) in construction. Int. J. Constr. Manag. 2019, 19, 436–452. [Google Scholar] [CrossRef]
- Hickman, L.; Longman, C. CASE Method: Business Interviewing; Addison-Wesley: Wokingham, UK, 1994; ISBN 978-0-201-59372-3. [Google Scholar]
- Leal, J.E. AHP-express: A simplified version of the analytical hierarchy process method. MethodsX 2020, 7, 100748. [Google Scholar] [CrossRef]
- Saaty, T.L. Decision making with the analytic hierarchy process. Int. J. Serv. Sci. 2008, 1, 83–98. [Google Scholar] [CrossRef] [Green Version]
- Miller, G.A. The magical number seven, plus or minus two: Some limits on our capacity for processing information. Psychol. Rev. 1956, 63, 81–97. [Google Scholar] [CrossRef] [PubMed] [Green Version]
- Atanasova-Pacemska, T.; Lapevski, M.; Timovski, R. Analytical Hierarchical Process (AHP) Method Application in the Process of Selection and Evaluation. In Proceedings of the International Scientific Conference “UNITECH 2014”, Gabrovo, Bulgaria, 21–22 November 2014. [Google Scholar]
- Saaty, T.L.; Ozdemir, M.S. Why the magic number seven plus or minus two. Math. Comput. Model. 2003, 38, 233–244. [Google Scholar] [CrossRef]
- Alonso, J.A.; Lamata, M.T. Consistency in the analytic hierarchy process: A new approach. Int. J. Unc. Fuzz. Knowl. Based Syst. 2006, 14, 445–459. [Google Scholar] [CrossRef] [Green Version]
- Lane, E.F.; Verdini, W.A. A consistency test for AHP decision makers. Decis. Sci. 1989, 20, 575–590. [Google Scholar] [CrossRef]
- Liang, F.; Brunelli, M.; Rezaei, J. Consistency issues in the best worst method: Measurements and thresholds. Omega 2020, 96, 102175. [Google Scholar] [CrossRef]
- Saaty, T.L. Fundamentals of Decision Making and Priority Theory with the Analytic Hierarchy Process; RWS Publications: Pittsburgh, PA, USA, 2000; Volume 6. [Google Scholar]
- Dodd, F.J.; Donegan, H.A.; McMaster, T.B.M. A statistical approach to consistency in AHP. Math. Comput. Model. 1993, 18, 19–22. [Google Scholar] [CrossRef]
- Byun, D.-H. The AHP approach for selecting an automobile purchase model. Inf. Manag. 2001, 38, 289–297. [Google Scholar] [CrossRef]
- Pakalniškienė, V. Tyrimo ir Įvertinimo Priemonių Patikimumo ir Validumo Nustatymas; VU Leidykla: Vilnius, Lithuania, 2012. [Google Scholar]
- Pauer, F.; Schmidt, K.; Babac, A.; Damm, K.; Frank, M.; von der Schulenburg, J.-M.G. Comparison of different approaches applied in analytic hierarchy process—An example of information needs of patients with rare diseases. BMC Med. Inform. Decis. Mak. 2016, 16, 117. [Google Scholar] [CrossRef] [Green Version]
- Wind, Y.; Saaty, T.L. Marketing applications of the analytic hierarchy process. Manag. Sci. 1980, 26, 641–658. [Google Scholar] [CrossRef]
Figure 1.
Combined service quality assessment concept. Source: [27].
Figure 1.
Combined service quality assessment concept. Source: [27].

Figure 2.
Theoretical approach to service quality criteria. Source: the authors’ compilation.

Figure 3.
The model of customer satisfaction with B2B service quality. Source: the authors.


Table 1.
Random Index RI values.
| n | 1 | 2 | 3 | 4 | 5 | 6 | 7 | 8 | 9 | 10 | 11 | 12 | 13 | 14 | 15 |
|---|---|---|---|---|---|---|---|---|---|---|---|---|---|---|---|
| RI | 0 | 0 | 0.52 | 0.89 | 1.11 | 1.25 | 1.35 | 1.40 | 1.45 | 1.49 | 1.52 | 1.54 | 1.56 | 1.58 | 1.59 |
| n | 16 | 17 | 18 | 19 | 20 | 21 | 22 | 23 | 24 | 25 | 26 | 27 | 28 | 29 | 30 |
| RI | 1.60 | 1.60 | 1.61 | 1.62 | 1.63 | 1.64 | 1.65 | 1.65 | 1.66 | 1.66 | 1.66 | 1.67 | 1.67 | 1.68 | 1.68 |
Table 2.
Expert characteristics.
| Experts | E1 | E2 | E3 | E4 | E5 | E6 |
|---|---|---|---|---|---|---|
| Criteria of Expertise | Indicators of Expertise | |||||
| Years of personal experience working with service providers in B2B services | 17 | 5 | 19 | 20 | >20 | 12 |
| Lifetime of represented company | 30 | 30 | 24 | 28 | 29 | 16 |
| The represented company buys/has bought B2B services from ≥2 companies | Yes | Yes | Yes | Yes | Yes | Yes |
| Responsibility for ensuring that the services received are in accordance with the contract and for approving the service acceptance and handover act for the services received | Yes | Yes | Yes | Yes | Yes | Yes |
| Position within the company | Project manager | Head of department | Project and quality manager | Director for change management | Senior project manager | Project director |
Table 3.
Grouping of criteria according to percentage scores and differences between positions.
| No. | Criteria | Percentage Weight, % | Percentage of Change from a Higher Position Criterion | Group of Significance |
|---|---|---|---|---|
| 1 | Service failure recovery | 6.76 | - | Essential criteria |
| 2 | Competence | 6.34 | 0.42 | |
| 3 | Service failure prevention | 6.09 | 0.25 | |
| 4 | Customisation | 5.47 | 0.62 | Significant criteria |
| 5 | Reliability | 4.98 | 0.49 | |
| 6 | Expectations | 4.92 | 0.06 | |
| 7 | Customer treatment | 4.78 | 0.14 | |
| 8 | Access | 4.66 | 0.12 | |
| 9 | Empathy | 4.08 | 0.58 | Sufficiently significant criteria |
| 10 | Responsiveness | 3.95 | 0.13 | |
| 11 | Knowing the customer | 3.88 | 0.07 | |
| 12 | Perception | 3.85 | 0.03 | |
| 13 | Communication | 3.79 | 0.06 | |
| 14 | Dispute reduction | 3.67 | 0.12 | |
| 15 | Profitability | 3.61 | 0.06 | |
| 16 | Service training | 3.56 | 0.05 | |
| 17 | Service vision | 3.00 | 0.56 | Marginally significant criteria |
| 18 | Service standards communication | 2.91 | 0.09 | |
| 19 | Courtesy | 2.85 | 0.06 | |
| 20 | Security | 2.69 | 0.16 | |
| 21 | Employee empowerment | 2.61 | 0.08 | |
| 22 | Tangibles | 2.60 | 0.01 | |
| 23 | Service technology | 2.43 | 0.17 | |
| 24 | Credibility | 1.98 | 0.45 | |
| 25 | Assurance | 1.82 | 0.16 | |
| 26 | Servant leadership | 1.47 | 0.35 | |
| 27 | Service rewards | 1.28 | 0.19 |
Source: the authors’ calculation.
Publisher’s Note: MDPI stays neutral with regard to jurisdictional claims in published maps and institutional affiliations. |
© 2022 by the authors. Licensee MDPI, Basel, Switzerland. This article is an open access article distributed under the terms and conditions of the Creative Commons Attribution (CC BY) license (https://creativecommons.org/licenses/by/4.0/).
Share and Cite
MDPI and ACS Style
Raišienė, A.G.; Raišys, S.J. Business Customer Satisfaction with B2B Consulting Services: AHP-Based Criteria for a New Perspective. Sustainability 2022, 14, 7437. https://0-doi-org.brum.beds.ac.uk/10.3390/su14127437
AMA Style
Raišienė AG, Raišys SJ. Business Customer Satisfaction with B2B Consulting Services: AHP-Based Criteria for a New Perspective. Sustainability. 2022; 14(12):7437. https://0-doi-org.brum.beds.ac.uk/10.3390/su14127437
Chicago/Turabian StyleRaišienė, Agota Giedrė, and Simonas Juozapas Raišys. 2022. "Business Customer Satisfaction with B2B Consulting Services: AHP-Based Criteria for a New Perspective" Sustainability 14, no. 12: 7437. https://0-doi-org.brum.beds.ac.uk/10.3390/su14127437
Note that from the first issue of 2016, this journal uses article numbers instead of page numbers. See further details here.