
Human Factor Index Measurement Using an ISM-SEM-Fuzzy Approach

Department of Industrial Engineering, College of Engineering Guindy, Anna University, Chennai 600025, Tamil Nadu, India
*
Author to whom correspondence should be addressed.
Sustainability 2022, 14(13), 7635; https://0-doi-org.brum.beds.ac.uk/10.3390/su14137635
Submission received: 21 April 2022
/
Revised: 6 June 2022
/
Accepted: 14 June 2022
/
Published: 22 June 2022
(This article belongs to the Topic Recent Advances and Applications in Partial Least Squares Structural Equation Modeling (PLS-SEM))
Abstract
:In recent years, there has been a trend toward automation and data exchange in manufacturing processes through industrial cognitive computing, the Internet of Things (IoT), and artificial intelligence. However, the human–machine interface plays a role in establishing a smart manufacturing system in any industry. It is necessary to develop a comprehensive model to identify the risk factors that contribute to the loss of human performance and productivity and evaluate the workplace for its compliance and agility toward safe human–machine systems. In this study, a model is proposed that can be used as a measurement tool to design ergonomic workplaces in the automotive industry. Several criteria have been classified under four enablers: physiological factors, psychological factors, environmental factors, and safety factors. These were identified through a literature review. The proposed model integrates the applications of structural equation modeling (SEM), interpretive structural modeling (ISM), and the multigrade fuzzy approach. ISM was employed to demonstrate the applicability of the model to depict various ergonomic enablers considered in the ergonomic measurement. SEM was used to validate the ergonomic measurement model statistically. Physiological factors were found to be highly correlated with ergonomic practices. Physiological and psychological factors were also highly correlated. The use of the multigrade fuzzy approach was demonstrated to determine the human factor index for an automotive component manufacturing industry. The proposed model can enable management to evaluate the various risk factors that hamper the ergonomic level of a company and thereby allow the company to harness the benefits of ergonomics to enhance safety and productivity.
1. Introduction
A manufacturing organization is a convoluted human–machine–environment organization system [1] Although the primary objective of such systems is to provide continuous improvements in quality and productivity, thereby increasing profits, meeting this objective largely depends on the wellness of employees and their willingness to actively engage in production activity [2]. Worker fatigue and work-related musculoskeletal Disorders (WMSDs) can lead to losses in overall productivity and efficiency [3]. WMSDs also accounted for 4.1 million early deaths in 2015, an increase of 46% since 2000 [4]. WMSDs have contributed to almost 400,000 injuries, costing industries over USD 20 billion per year. In 2019, 9440 cases of work-related musculoskeletal disorders (WMSDs) were reported in Korea, representing an increase of 2725 cases (40.6%) from the 6715 cases reported in the previous year. The cases accounted for approximately two thirds (67.3%) of all occupational diseases in that year [5]. The study of ergonomics plays a pivotal role in the design and development of conducive working environments that optimize the wellbeing of operators, thus increasing productivity safely [6]. Recently, Indian manufacturing industries have undertaken initiatives to redesign their workplaces to overcome various occupational injuries and musculoskeletal disorders (MSD) [7].
Recent studies have explored the applications of ergonomic tools such as the Strain Index (SI), the National Aeronautics and Space Administration Task Load Index (NASA TLX), the Occupational Repetitive Actions Index (OCRA), the Rapid Upper Limb Assessment (RULA), the Ovako Working posture Analysis System (OWAS) checklist, and the Rapid Entire Body Assessment (REBA) to improve occupational health and safety in the areas of machine design, task design, the working environment, and facility design. These tools and techniques to derive benefits based on the theory of ergonomics require considerable time and energy to implement. Present methods of evaluating postural risk are based on observational techniques that requires an ergonomic analyst to observe the work in real-time or from recorded video to manually segment the relevant body parts and evaluate the risk associated with the posture [8]. Due to human error, however, these techniques produce results with low consistency and repeatability, both of which can be reduced or eliminated by using advanced technologies [9]. All the risk assessment methodologies are used to evaluate the physiological level of risk that was associated with performance of the job.
This study aims to develop a human factor index measurement tool that includes physiological, psychological, environmental, and safety risk considerations based on how these risks are interrelated. Moreover, the use of several indicators in a study requires that these indicators themselves be understood and are easily measurable. However, these limitations have not been addressed in many studies. The remainder of this paper is organized as follows: Section 2 presents the research background in the areas of ergonomic risk evaluation and assessment. The proposed methodology for workplace ergonomic assessment is described in Section 3. The conceptual framework and analysis are presented in Section 4. Finally, the results of this study are reported in Section 5.
2. Research Background
Ergonomic risks in manufacturing sectors can cause serious injuries and impact the health and quality of life of workers [10]. This can contribute to losses of quality and productivity. Different self-reporting methods such as rating scales, questionnaires, checklists, and interviews have been used in the past to study ergonomic risks [11]. An effective rapid-screening instrument was developed by Keyserling et al. [12] to identify the exposure of workers to risky postures in cyclical jobs. Shikdar et al. [1] developed the “ErgoTech” self-assessment software package to evaluate the ergonomic improvement potential of production systems in the manufacturing industry. The application of this tool enabled production managers to recognize ergonomic improvements in the workplace successfully. David [11] reported the use of several tools to assess the exposure to risk based on self-reports, observational methods, and direct measurements. Laring et al. [13] proposed the Ergo SAM tool, which can be used to optimize the workplace in terms of the production time and physical load on the operator. This tool facilitates the detection of high musculoskeletal loads early in the planning process.
The most widely used methods for ergonomic assessment are the Occupational Safety and Health Administration (OSHA) checklist and the standard Nordic MSD questionnaire. The standard Nordic MSD questionnaire has been used in applications such as furniture manufacturing [14] and LCD manufacturing [15]. The OSHA checklist has been used for the analysis of semiconductor manufacturing [16]. The main weakness of these self-reporting approaches is that the results are not always reliable, which can lead to biased interpretations.
Observational methods such as the OWAS and the Strain Index (SI) involve direct observation of the worker and the consequent tasks. Sonne et al. [17] devised an office risk assessment tool, Rapid Office Strain Assessment (ROSA), to measure risks related to computer work. This tool provides a report to the user detailing the need for modification of discomfort associated with office work. Poochada and Chaiklieng [18] demonstrated the use of the ROSA to evaluate the presence of risk elements for job-related MSD in a call center office. The RULA method has been used to assess the risk of work-related upper limb disorders [19,20]. The OCRA method has been used to evaluate upper limb disorders; the risk factors considered are repetition, strength, incorrect postures, and lack of rest intervals [21]. REBA has been effectively used to analyze the exposure related to the upper and lower limbs [22]. Chander and Cavatorta [23] proposed the postural ergonomic risk assessment (PERA) method to assess the postural ergonomic risk of short cyclic assembly jobs. The drawbacks of these observational methods are high intra- and inter-observer inconsistency due to the data collection, which is generally performed through subjective opinion or simple judgment from videos/pictures, and a lack of accuracy. To overcome these limitations, Maman et al. [24] and Plantard et al. [25] recommended the use of sensors attached to the worker’s body to collect data directly; however, this is difficult to implement in real-world situations. Li et al. [26] proposed an improved physical demand analysis (PDA) by integrating risk assessment tools such as REBA, RULA, and NIOSH; the proposed method enables ergonomic risk identification and evaluation and proactively mitigates the risk to workers by providing modified work. The four main ergonomic risks identified in the case study were static whole-body posture, heavy material handling, sensory risks, and awkward body postures. Bortolini et al. [27] developed a motion analysis system (MAS) for the ergonomic analysis of operators during assembly tasks based on Motion Capture (MOCAP) technology with ad hoc software. The applicability of the MAS was discussed through a case study of a water pump assembly workstation. Using a deep learning algorithm to predict RULA scores, Nayak et al. [5] created an automated, RULA-based posture evaluation system. This will help to reduce the amount of time necessary for postural evaluation while also producing highly reliable RULA scores that are similar to the results obtained using the manual method.
In this study, an exhaustive literature review was conducted based on the factors considered for ergonomic evaluation and the area of study, and the results are summarized in Table 1. The literature review indicated that research on ergonomic assessments has often considered physiological and/or psychological factors. Parsons, K.C. [28] discussed the great deal of work on the effects of light, noise, vibration, and thermal environments on the health, comfort, and working efficiency. Health, safety, and environment (HSE) at the operational level will strive to eliminate injuries, adverse health effects, and damage to the environment; enhance worker productivity, provide improved worker safety (physical and mental), and job satisfaction [29]. However, significant factors such as environmental and safety factors that could influence “the ergonomic conducive level” of the industry have been neglected in most previous studies. Moreover, there appears to be a lack of amalgamation of ergonomic assessment tools for better prediction of ergonomic levels in any manufacturing industry. Hence, there is a need to develop a comprehensive evaluation model for workplace ergonomic assessments. This study proposes a conceptual model that facilitates the determination of a human factor index for workplace ergonomic measurements. The application of the model is demonstrated using analytical tools such as interpretive structural modeling (ISM), structural equation modeling (SEM), and a multigrade fuzzy approach to determine the ergonomic performance in the Indian automotive industry. ISM methodology typically helps to create a well-defined visible model from poorly articulated unclear mental model of experts. Since the factors cannot be directly measured, the structural equation modelling (SEM) methodology is typically used to analyze the structural relationship between factors for establishing either a theoretical or a predictive relationship.
3. Methodology
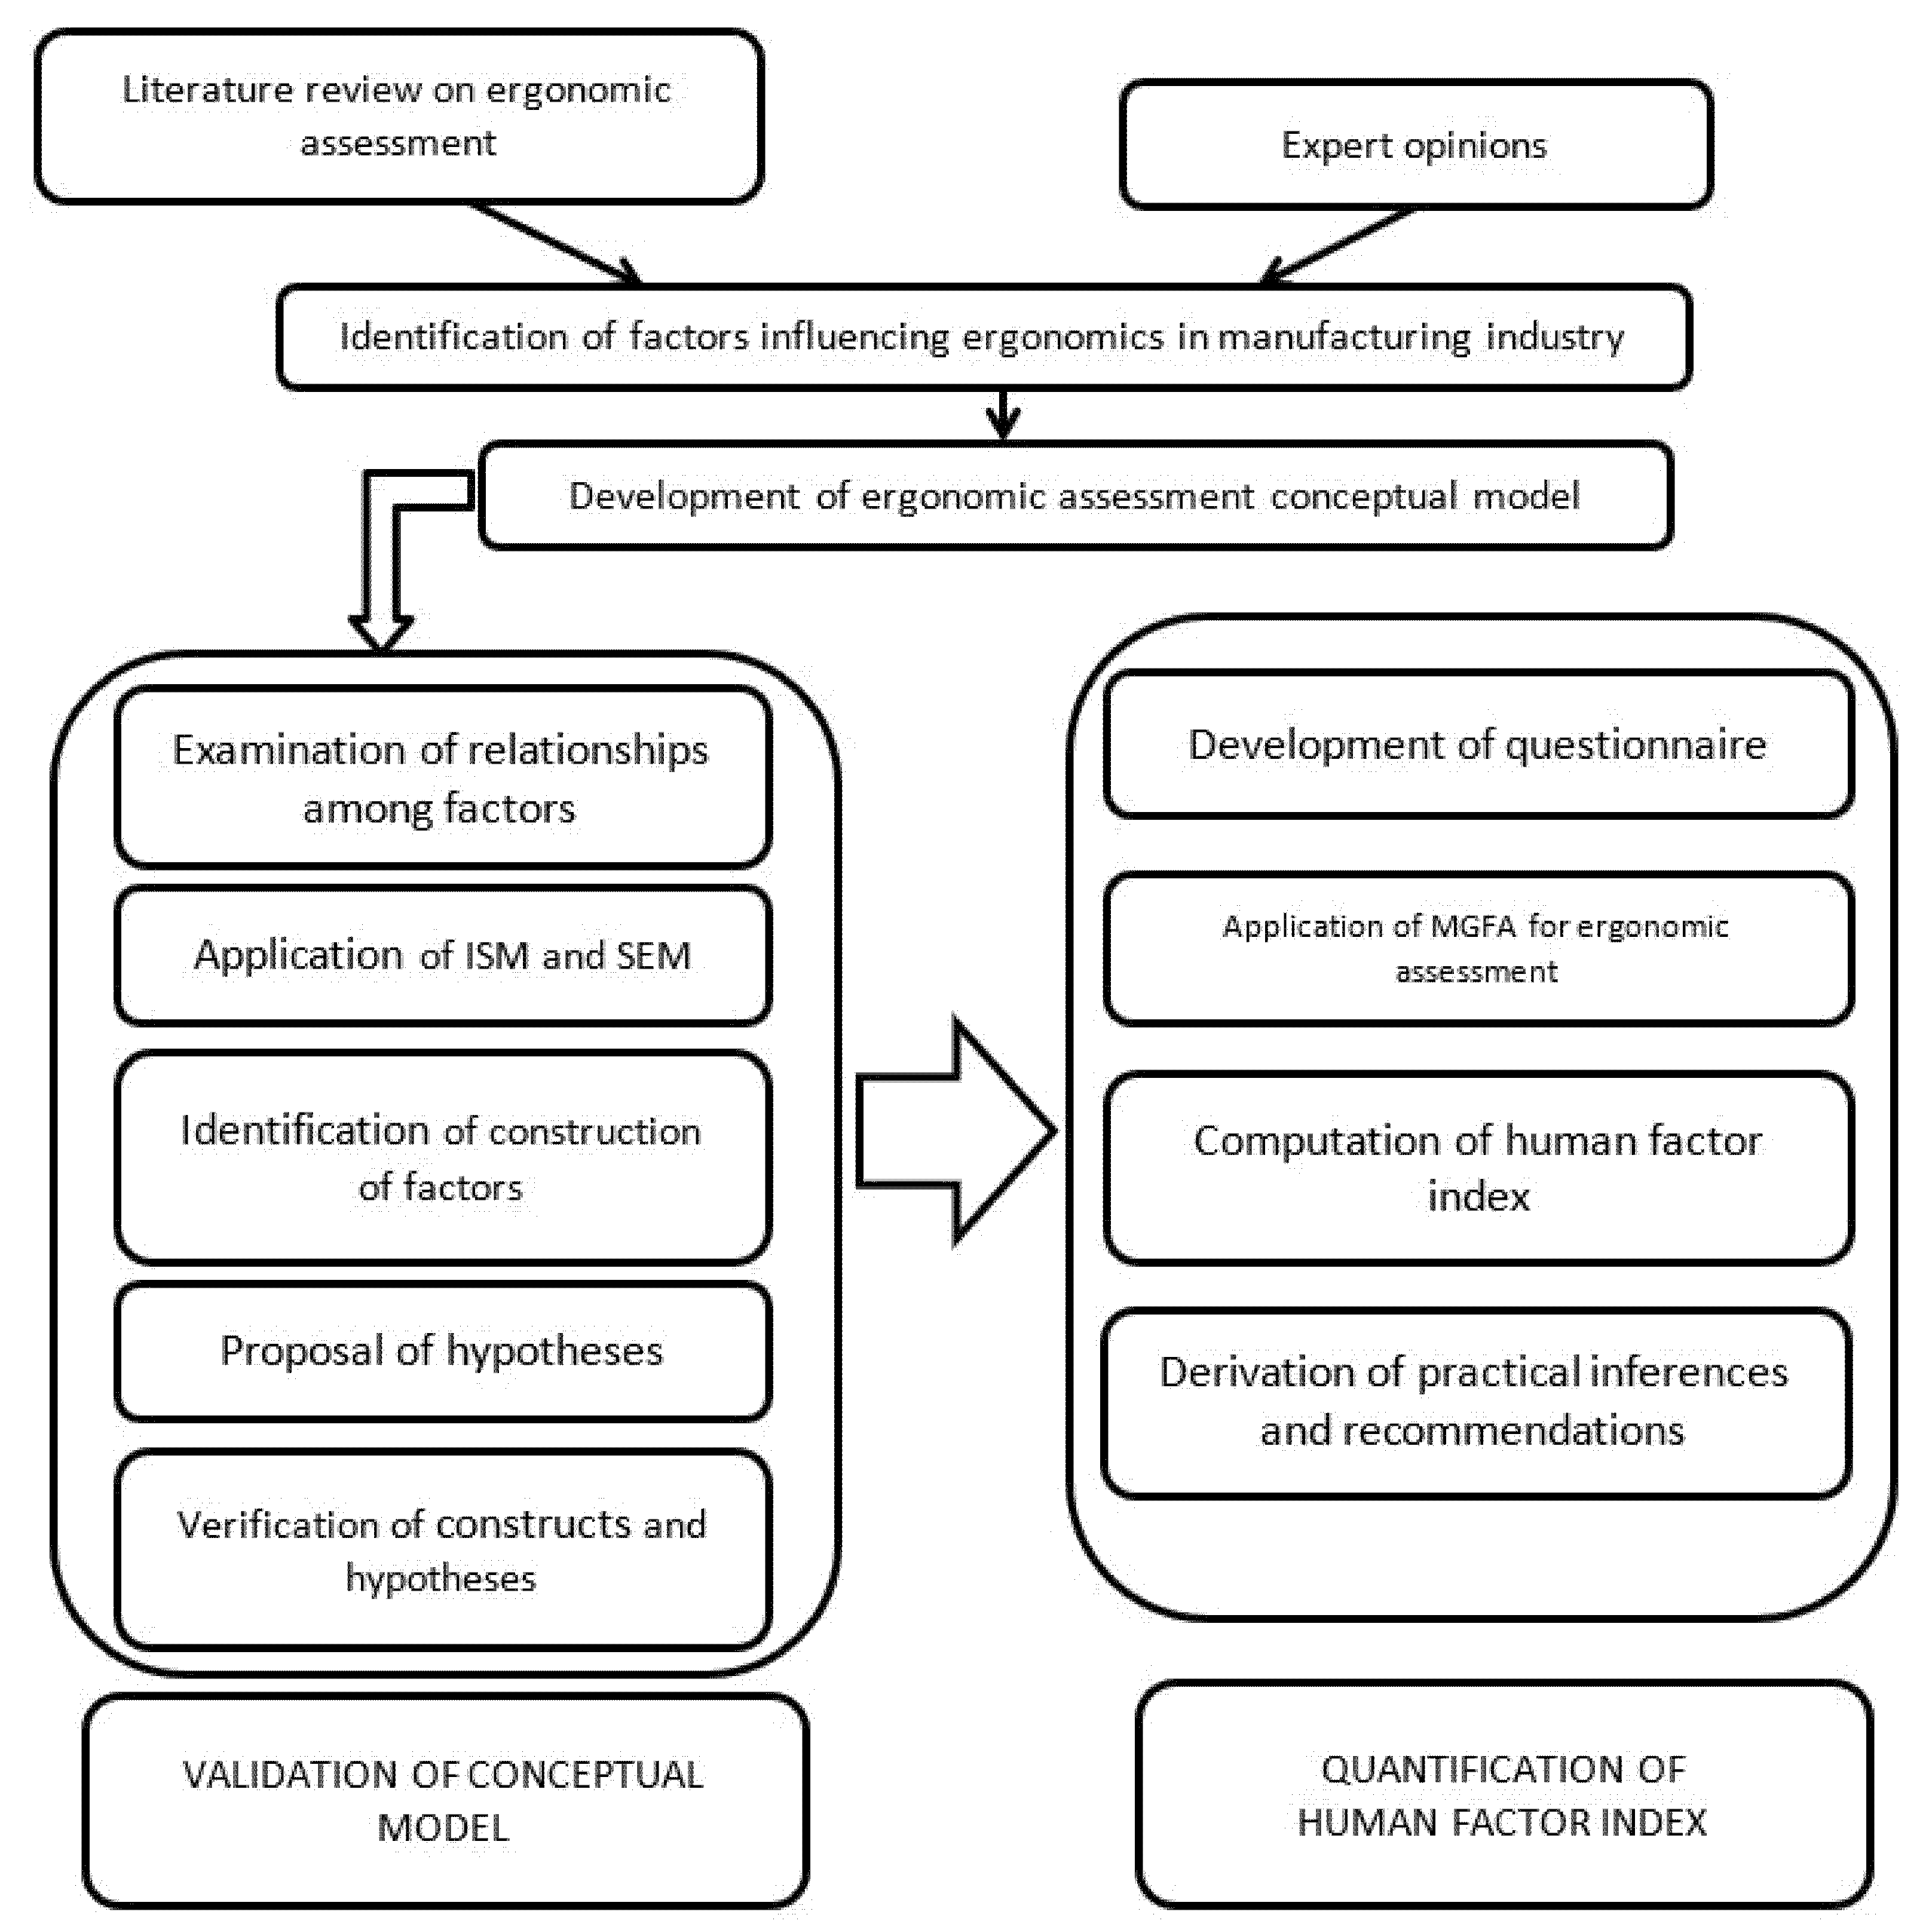
This study aims to determine a human factor index for ergonomic workplace assessment in automotive industries, as shown in Figure 1.
A total of 379 documents were obtained from the core collection database on 30 March 2020. Of the 379 articles, 365 were journal articles, and 14 were review articles. A literature review of workplace ergonomic assessments and expert opinions obtained from the automotive industry enabled us to identify the list of factors to be considered in this study. The factors, criteria, and variables to be included in the ergonomic measurement model were carefully selected. ISM was used to identify and describe the relationships among the factors. The comprehensive model constructed from ISM was verified using partial least squares (PLS)-based SEM. SEM-based statistical analyses do not allow for a comprehensive inference of the interconnectivity relationship. Therefore, to determine the direction of the relationships among factors, ISM was used. In this study, SEM was applied to a first-order four-factor structure for fifteen performance variables. After the theoretical model was verified using SEM, an ergonomic quantification tool was developed using the multigrade fuzzy approach. A demonstration of the proposed model in a workplace ergonomic measurement study was carried out in the Indian automotive industry. The computation of the human factor index facilitates evaluation of the “ergonomic conducive level” of the industry.
4. Ergonomic Assessment Model
The conceptual framework for the design of the ergonomic measurement tool is presented in Table 2. The ergonomic assessment model is divided into three stages. The first stage comprises 4 factors, the second stage contains 15 ergonomic criteria, and the third stage entails 40 ergonomic variables [35].
4.1. Identifying Relationships among Factors: ISM Approach
This study aimed to explore the use of ISM to recognize the associations among the factors that affect the ergonomic assessment of an industry.
ISM is used as a tool in decision making, in which a group of factors affecting the application of a system are identified in an organized manner. ISM utilizes the practical experience of professionals currently working in the area to develop a multilevel organizational model that emphasizes the key aspects involved in the application of a specific system [42]. These features make this a more suitable tool for the present study.
The working mechanism of the ISM technique is as follows [42].
A circumstantial relationship between the factors and the structural self-interaction matrix (SSIM) of factors is developed. This matrix indicates the pairwise association among the factors analyzed, as presented in Table 3. To indicate the direction of the association between two factors (i and j), the following symbols are defined:
- V denotes that factor i affects factor j;
- A denotes that factor j impacts factor I;
- X denotes that factors i and j affect each other;
- X denotes that factors i and j are unrelated.
The SSIM is developed using expert opinions and is improved to create a reachability matrix by changing each entry in the SSIM into binary digits 1 and 0.
The initial reachability matrix is derived from the SSIM matrix. After checking the transitivity, the final reachability matrix is obtained, and the final reachability matrix is partitioned into different levels by listing the factors in the antecedent set, intersection set, reachability set, and partition level, as presented in Table 4.
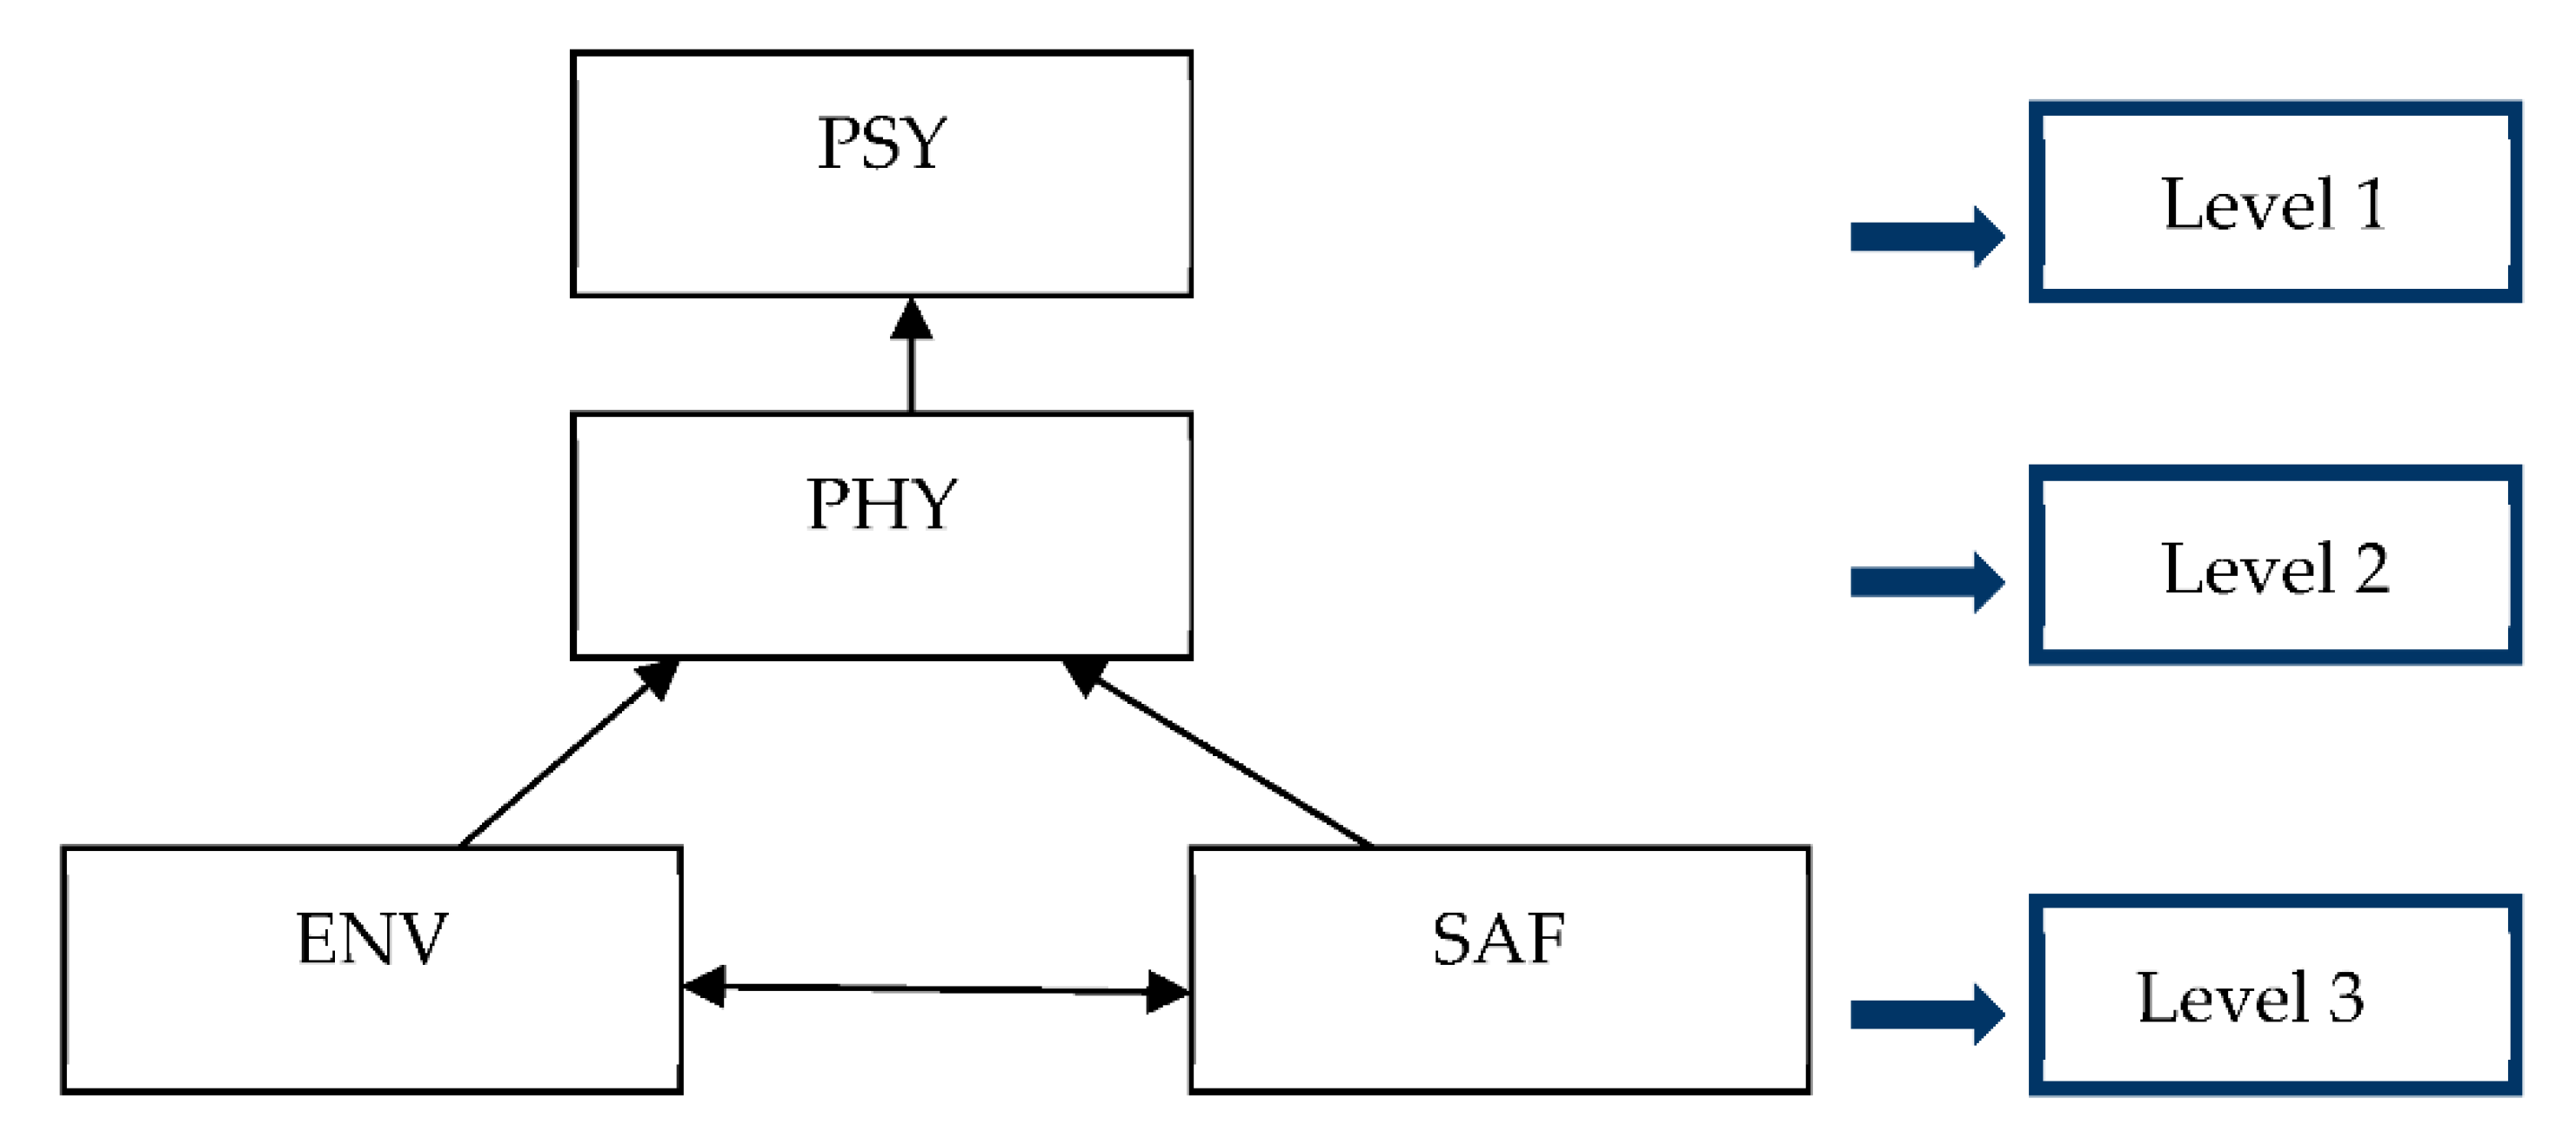
A directed graph of the interactions listed in Table 4 is then drawn. The ISM model thus constructed is shown in Figure 2.
The model shown in Figure 2 is subsequently used for SEM analysis.
4.2. SEM Validation of the Relationships among Factors
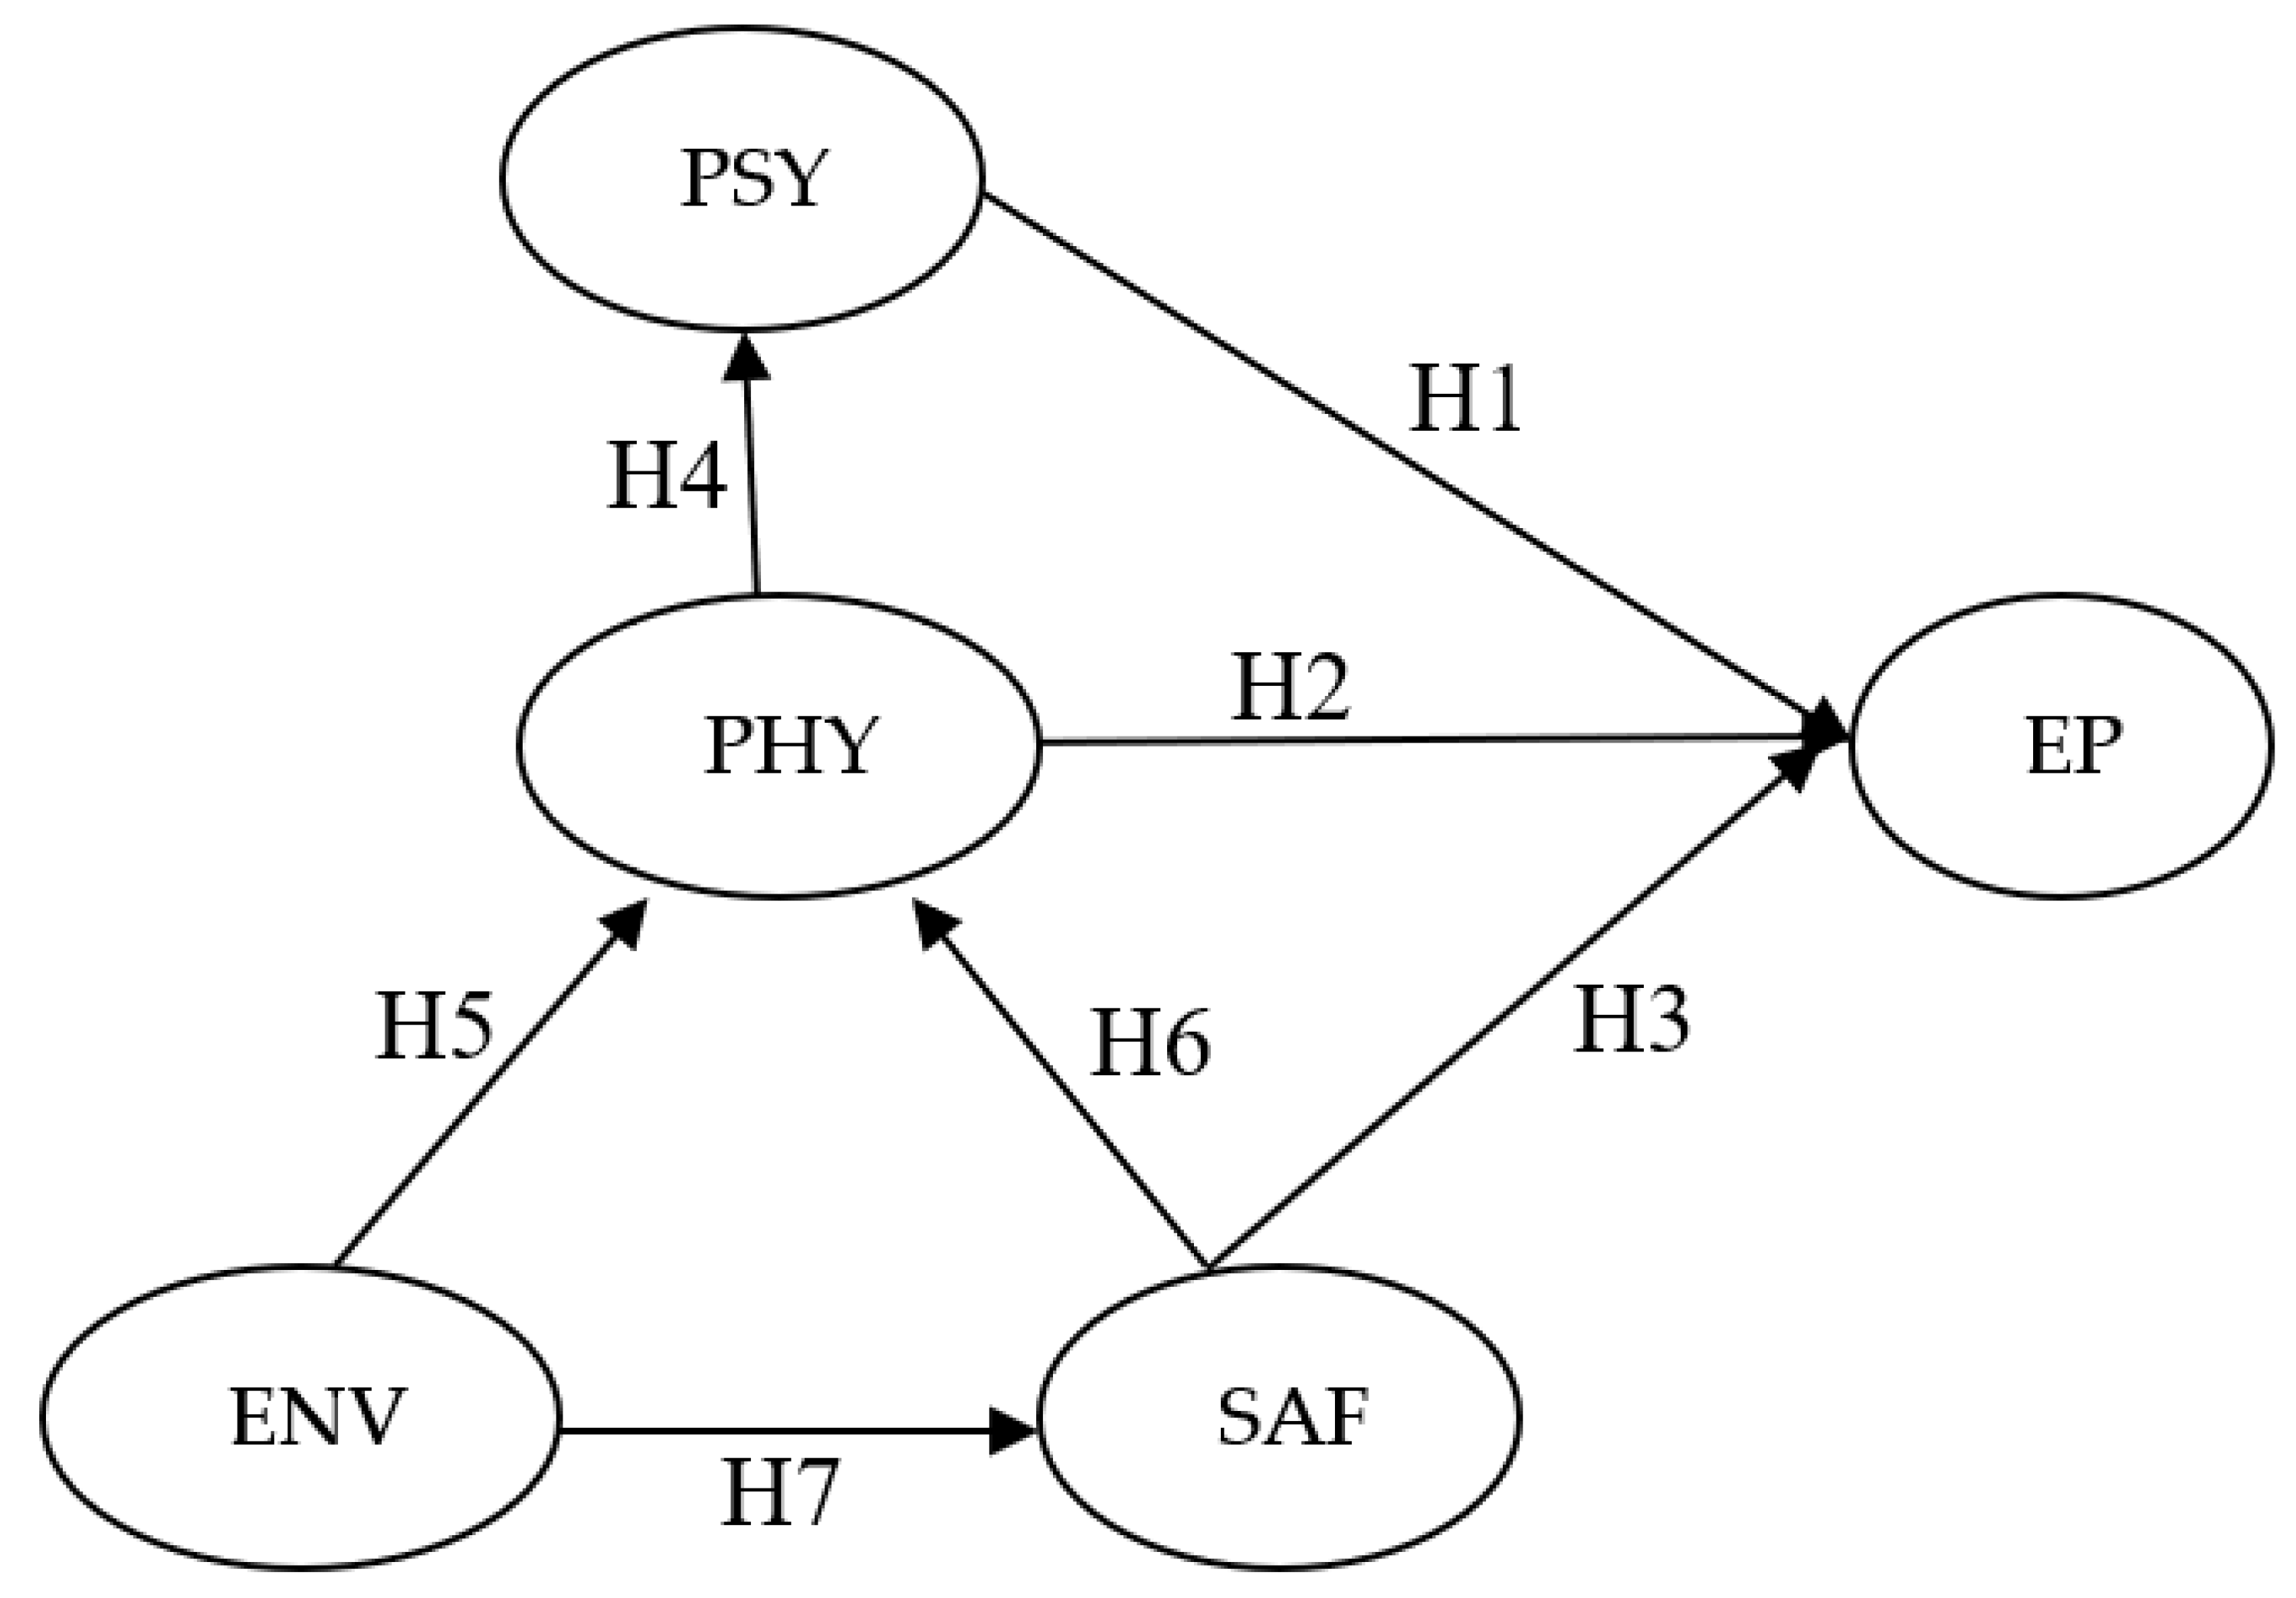
SEM analyzes the hypotheses for unmeasurable variables by considering independent and dependent variables using statistical analysis [42]. The theoretical model obtained from the ISM was validated using PLS-SEM. After a careful literature review, a questionnaire was used in discussions with experts working in the automotive industry. The questionnaire was administered via email to 150 experts from different firms. At the end of the survey, 101 complete and usable responses were received from 40 automotive manufacturing firms. This represents a response rate of 67.30%, which is sufficient for this empirical study [43]. This sample size is adequate for evaluating the hypotheses developed in this study [43]. Our respondents consisted of an ergonomics engineer, head supply chain managers, maintenance engineers, operations managers, and risk assessment specialists. Of the respondents, 67% were between 27 and 50 years of age, and only 12% were over 50 years of age. The model representation of the factors, along with the tests of the hypotheses considered in this study, are shown in Figure 3.
The hypotheses tested in this study are described below:
Hypothesis 1 (H1).
Psychological factors and the ergonomic assessment are correlated.
Hypothesis 2 (H2).
The ergonomic assessment and physiological factors are correlated.
Hypothesis 3 (H3).
The ergonomic assessment and safety factors are correlated.
Hypothesis 4 (H4).
Psychological factors and physiological factors are correlated.
Hypothesis 5 (H5).
Environmental factors and physiological factors are correlated.
Hypothesis 6 (H6).
Safety factors and physiological factors are correlated.
Hypothesis 7 (H7).
Environmental factors and safety factors are correlated.
The convergent validity was evaluated by assessing Cronbach’s α, the average variance extracted (AVE), and the composite reliability, which is used to analyze the level of correlation/convergence of different variables of the same construct. The composite reliability is greater than the acceptable limit of 0.7 for all constructs, and the convergent validity [44] of the constructs is confirmed if the AVE is greater than or equal to 0.50. Moreover, the Cronbach’s α value for the ergonomic factors is above 0.5, and hence, the factors are found to be reliable, as indicated in Table 5.
In this study, discriminant validity measures were evaluated using a confirmatory factor analysis. It can be found that correlation values of factors such as physiological, psychological, environmental, and safety were less than the square root of the AVE [45]. Hence, it was found that the factors considered in this model have discriminant validity, as indicated in Table 6.
The bootstrapping test (Table 7) was performed using the PLS-SEM to determine the t-test values. Based on the bootstrapping results presented in the Table 7. Materials and the hypothesis testing, all of the hypotheses were supported by the survey results (p < 0.05).
The standard errors and t-test values are listed in Table 8.
Based on the “t” statistic, it can be inferred that there is a significant correlation between each of the verified factors and the ergonomic practices. Among these, the physiological factors have very high correlation with the ergonomic practices in the manufacturing industry, with a “t-stat” result of 49.652. It is also observed that there is a significant correlation between psychological and physiological factors, with a “t-stat” value of 107.55.
4.3. Determination of Human Factor Index Measurement
The ergonomic factors and their relationships, which were validated using the ISM-SEM approach, are considered to measure the human factor index using a multigrade fuzzy approach. The multigrade fuzzy approach overcomes the drawbacks associated with conventional crisp approaches. The major advantage of using the multigrade fuzzy method is that the average weights are multiplied by the responses given by experts for each variable. This method avoids fluctuations in the values, and extreme responses and their biases are neutralized as constant weights in the calculation. Fuzzy approaches provide a useful tool to deal with problems in which attribute phenomena are imprecise and vague. Most ergonomic measurements are characterized by ambiguity and multiple possibilities. The scoring of existing techniques is always criticized because the scales used to score ergonomics have limitations. In this context, a multigrade fuzzy approach was used to evaluate ergonomics in the automotive industry.
The application of the multigrade fuzzy approach was validated through a case study. The case study was conducted in an original equipment manufacturer (Sarang Auto Parts Pvt. Ltd., Chennai, India) located in Chennai, India. This organization produces a shaft lower link, nut-driving pinion, bearing lock, rod hydraulic lift connection, and support reverse cluster. They manufacture the following parts under the broad category of automotive components: electrical parts, drive transmission and steering parts, nut-driving pinion, bearing locks, rod hydraulic lift connections, shaft power take-off (PTO) drives, shaft lower links, support reverse clusters, and shaft front PTOs.
The human factor index (HFI) of a workplace is represented by the multiplication of the weight (W) and assessment factor (F).
HFI = W × F
The assessment has been divided into five scales because every ergonomic factor involves the fuzzy determination I = (10, 8, 6, 4, 2). “Excellent”, “good”, “fair”, “poor”, and “very poor” ergonomic levels correspond to scores of 8–10, 6–8, 4–6, 2–4, and 0–2, respectively. Four experts (L1, L2, L3, L4) were involved in the ergonomic evaluation discussion. The weightages assigned for each enabler is 0.4 for physiological factors (HFI1), 0.2 for psychological factors (HFI2), 0.2 for environmental factors (HFI3), and 0.2 for safety factors (HFI4). The physiological factors include the following criteria, including biomechanical aspects (HFI11), usability (HFI12), and energy expenditure (HFI13). The weightages assigned for each criterion are 0.5, 0.25, and 0.25, respectively. Similarly, the distribution of fuzzy weighting to the ergonomic attributes, criteria, and enablers is summarized in Table 9.
4.3.1. Primary Assessment Calculation
The calculations pertaining to biomechanical aspects are shown below.
The index pertaining to biomechanical aspects is given by HFI11 = W11 × F1.
HFI11 = (7.6, 8.2, 8.4, 7.4)
Similarly, the index for each criterion is calculated and listed below.
HFI12 = (8.4, 8, 8.4, 7.8)
HFI13 = (7, 7, 6, 6.5)
HFI21 = (8.5, 7.25, 8.25, 8.25)
HFI22 = (8.5, 9, 9, 9)
HFI23 = (8.25, 7, 7.75, 7.75)
HFI24 = (9, 8.5, 9, 8)
HFI31 = (7.5, 8, 8, 6.5)
HFI32 = (7.5, 8, 8, 7.5)
HFI33 = (6, 6, 6.5, 5.5)
HFI34 = (8, 7.5, 8, 7.5)
HFI35 = (9, 8, 9, 8)
HFI41 = (7.5, 8, 6, 5.5)
HFI42 = (9, 8, 9, 8)
HFI43 = (8.5, 8, 8.5, 8.5)
4.3.2. Secondary Assessment Calculation
The index pertaining to physiological factors is calculated as shown below.
HFI1 = W1 × F1
W1 = [0.5,0.25,0.25]
Similarly, the indexes for other enablers are calculated below.
HFI2 = (8.56, 7.93, 8.5, 8.25)
HFI3 = (7.2, 7.125, 7.55, 6.625)
HFI4 = (8.335, 8, 7.88, 7.345)
4.3.3. Tertiary Assessment Calculation
Finally, the total HFI is calculated as shown below.
HFI = W × F
The HFI is the average of (7.879, 7.791, 7.862, 7.612), which is equal to 7.786.
HUMAN FACTOR INDEX = 7.786 ϵ (6, 8)
A human factor index of 7.86 was determined using a multigrade fuzzy approach, which means that the organization is ERGONOMIC.
5. Results and Discussion
The observations made in this study are presented below.
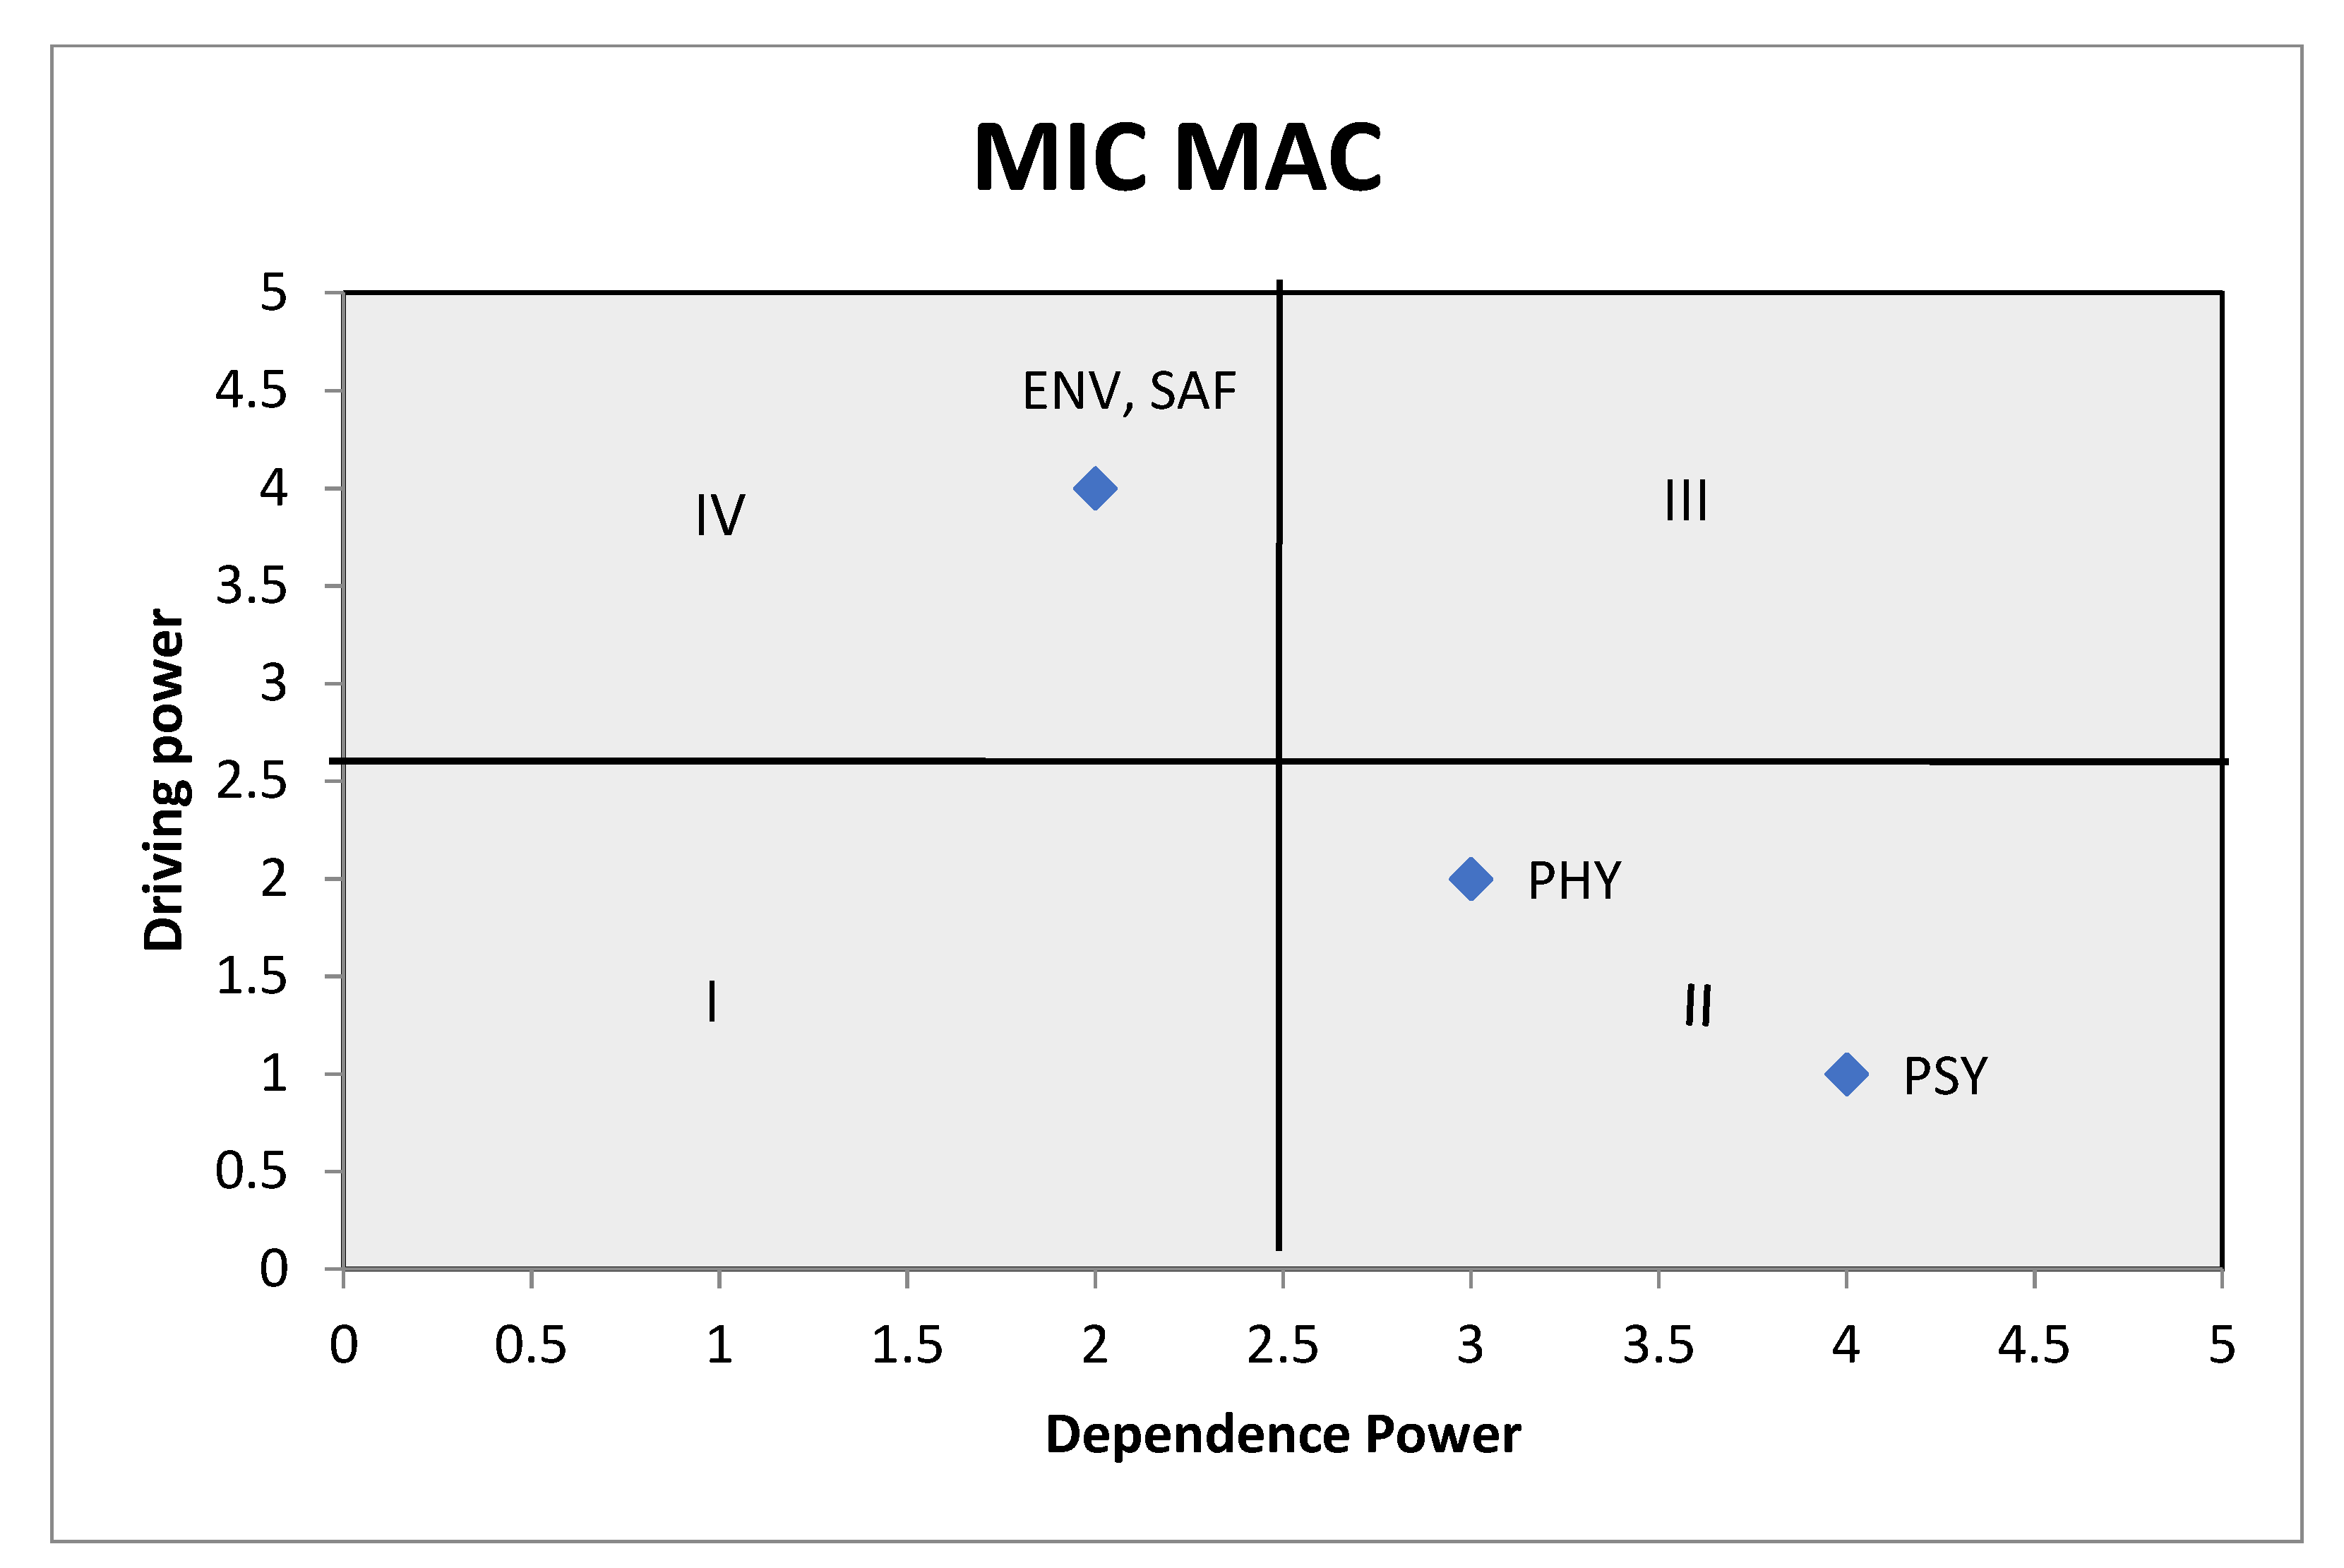
A cross-impact matrix multiplication applied to classification (MICMAC) analysis was used to study the dependence power and driving power of the variables considered in the study [46]. The results indicate that two independent performance variables, namely, the safety factors and environmental factors, show a strong driving power and weaker dependence power. Hence, these were identified as the “key factors” in this ergonomic assessment study. In addition, it was found that the dependent variables, i.e., the physiological and psychological factors, are weak trainers and depend strongly on one another. The results of the MICMAC analysis are shown in Figure 4.
The fit indices for the current case were determined as follows: a value of 0.91 is found for the goodness of fit, indicating that the model is a good fit [47]. The normed-fit index value was 0.70. A value as low as 0.80 is recommended for this index [47]. The relative/normed χ2 ratio (χ2/df) value was 10.45. The Cronbach’s ∝ for the ergonomic performance variables was acceptable and indicates that the variables are reliable.
The ergonomic assessment was performed using the multigrade fuzzy approach. A human factor index of less than 5 indicates that the organization cannot be considered a good candidate to implement an ergonomic work environment that would contribute to better quality and maximum productivity [3]. The human factor index of 7.786 determined for the automotive industry case in this study reveals that the industry is a suitable candidate for operating in a good ergonomic environment. However, it was found that there is scope for improving the work environment of the organization.
It was found that a major gap is perceived for the criterion “biomechanical aspects”. This is followed by “housekeeping”, “temperature/climate”, and “energy expenditure”. Management can take measures to improve the ergonomic conditions, such as the use of material handling equipment to prevent the manual movement of materials, equipment designs that would allow for comfortable reaches and posture, the use of personal protective equipment while working, application of the 5S (sort, set in order, shine, standardize, sustain) scheme to improve the housekeeping facilities, and providing proper a work–rest schedule for workers to sustain a normal heart rate and basal metabolic rate.
6. Conclusions
Ergonomic risks and bad work postures can lead to various types of MSDs and worker fatigue, which hamper the efficiency of manufacturing organizations and lead to a loss in productivity. This study aims to provide insight into the modeling and analysis of ergonomic risk factors in the Indian automotive industry. A combined ISM, SEM, and multigrade fuzzy approach was proposed to determine the human factor index for ergonomic evaluation of industries. The ISM model reveals the driving and dependence among the ergonomic factors, which enables managers to understand the interrelation among ergonomic factors in the automotive component sector. Moreover, management should also consider the dependence among factors in the ISM. Therefore, survey data were analyzed using VPLS software. The SEM-PLS technique was used to verify the seven hypotheses. Furthermore, evaluating the various ergonomic performance factors using the multigrade fuzzy approach facilitated an understanding of the contribution of these factors to safety and productivity improvement. A case study demonstrated the practicability of implementing these approaches in an industrial situation. Manual computation using a multigrade fuzzy approach is time-consuming and error-prone, and a computerized decision-support system (DSS) can be developed. The application of an integrated model for ergonomic assessment is not limited to the manufacturing industry and can be extend to evaluation in industries such as the software and healthcare. In addition to that, several other forms of ergonomic risks factors such as technological factors and process factors can be added to the measurement model to obtain more robust results.
Author Contributions
Methodology, K.V.; Supervision, P.R.; Writing—original draft, K.V.; Writing—review & editing, P.R. All authors have read and agreed to the published version of the manuscript.
Funding
This research received no external funding.
Conflicts of Interest
The authors declare no conflict of interest.
References
- Shikdar, A.; Al-araimi, S.; Omurtag, B. Development of a software package for ergonomic assessment of manufacturing industry. Comput. Ind. Eng. 2002, 43, 485–493. [Google Scholar] [CrossRef]
- Falck, A.C.; Rosenqvist, M. What are the obstacles and needs of proactive ergonomics measures at early product development stages?—An interview study in five Swedish companies. Int. J. Ind. Ergon. 2012, 42, 406–415. [Google Scholar] [CrossRef]
- Savino, M.M.; Battini, D.; Riccio, C. Visual management and artificial intelligence integrated in a new fuzzy-based full body postural assessment. Comput. Ind. Eng. 2017, 111, 596–608. [Google Scholar] [CrossRef]
- Sebbag, E.; Felten, R.; Sagez, F.; Sibilia, J.; Devilliers, H.; Arnaud, L. The world-wide burden of musculoskeletal diseases: A systematic analysis of the World Health Organization Burden of Diseases Database. Ann. Rheum. Dis. 2019, 78, 844–848. [Google Scholar] [CrossRef]
- Nayak, G.K.; Kim, K. Development of a fully automated RULA assessment system based on computer vision. Int. J. Ind. Ergon. 2021, 86, 103218. [Google Scholar] [CrossRef]
- Santos, Z.G.; Vieira, D.L.; Balbinotti, G. Lean Manufacturing and Ergonomic Working Conditions in the Automotive Industry. Procedia Manuf. 2015, 3, 5947–5954. [Google Scholar] [CrossRef] [Green Version]
- Kushwaha, D.K.; Kane, P.V. Ergonomic assessment and workstation design of shipping crane cabin in steel industry. Int. J. Ind. Ergon. 2016, 52, 29–39. [Google Scholar] [CrossRef]
- Andrews, D.M.; Fiedler, K.M.; Weir, P.L.; Callaghan, J.P. The effect of posture category salience on decision times and errors when using observation-based posture assessment methods. Ergonomics 2012, 5, 1548–1558. [Google Scholar] [CrossRef]
- Astrand, P.O.; Rodahl, K. Textbook of Work Physiology; McGraw-Hill Book Co.: New York, NY, USA, 1986. [Google Scholar]
- Vieira, E.R.; Kumar, S. Working postures: A literature review. J. Occup. Rehabil. 2004, 14, 143–159. [Google Scholar] [CrossRef]
- David, G.C. Ergonomic methods for assessing exposure to risk factors for work-related musculoskeletal disorders. Occup. Med. Oxf. Engl. 2005, 55, 190–199. [Google Scholar] [CrossRef] [Green Version]
- Keyserling, W.M.; Brouwer, M.; Silverstein, B.A. A checklist for evaluating ergonomic risk factors resulting from awkward postures of the legs, trunk and neck. Int. J. Ind. Ergon. 1992, 94, 283–301. [Google Scholar] [CrossRef] [Green Version]
- Laring, J.; Christmansson, M.; Kadefors, R.; Örtengren, R. ErgoSAM: A preproduction risk identification tool. Hum. Factors Ergon. Manuf. 2015, 153, 309–325. [Google Scholar] [CrossRef]
- Nejad, N.H.; Choobineh, A.; Rahimifard, H.; Haidari, H.R.; Reza Tabatabaei, S.H. Musculoskeletal risk assessment in small furniture manufacturing workshops. Int. J. Occup. Saf. Ergon. 2013, 19, 275–284. [Google Scholar] [CrossRef] [PubMed]
- Lu, J.M.; Twu, L.J.; Wang, M.J.J. Risk assessments of work-related musculoskeletal disorders among the TFT-LCD manufacturing operators. Int. J. Ind. Ergon. 2014, 52, 40–51. [Google Scholar] [CrossRef]
- Lin, Y.H.; Chen, C.Y.; Pan, Y.T. The suitability for the work-related musculoskeletal disorders checklist assessment in the semiconductor industry: A case study. Hum. Factors Ergon. Manuf. 2013, 23, 222–229. [Google Scholar] [CrossRef]
- Sonne, M.; Villalta, D.L.; Andrews, D.M. Development and evaluation of an office ergonomic risk checklist: ROSA Rapid office strain assessment. Appl. Ergon. 2012, 431, 98–108. [Google Scholar] [CrossRef]
- Poochada, W.; Chaiklieng, S. Ergonomic risk assessment among call center workers. Procedia Manuf. 2015, 3, 4613–4620. [Google Scholar] [CrossRef] [Green Version]
- Mohamed, M.S.S.; Halim, I.; Azani, A.H.; Saptari, A. Work posture improvement at plastic printing process in plastic manufacturing industry. J. Adv. Manuf. Technol. 2019, 13, 25–36. [Google Scholar]
- Ijaz, M.; Ahmad, S.R.; Akram, M.; Khan, W.U.; Yasin, N.A.; Nadeem, F.A. Quantitative and qualitative assessment of musculoskeletal disorders and socioeconomic issues of workers of brick industry in Pakistan. Int. J. Ind. Ergon. 2020, 76, 102933. [Google Scholar] [CrossRef]
- Rosecrance, J.; Paulsen, R.; Murgia, L. Risk assessment of cheese processing tasks using the Strain Index and OCRA Checklist. Int. J. Ind. Ergon. 2017, 61, 142–148. [Google Scholar] [CrossRef]
- Yoon, S.Y.; Ko, J.; Jung, M.C. A model for developing job rotation schedules that eliminate sequential high workloads and minimize between-worker variability in cumulative daily workloads: Application to automotive assembly lines. Appl. Ergon. 2016, 55, 8–15. [Google Scholar] [CrossRef] [PubMed]
- Chander, D.S.; Cavatorta, M.P. An observational method for Postural Ergonomic Risk Assessment PERA. Int. J. Ind. Ergon. 2017, 57, 32–41. [Google Scholar] [CrossRef]
- Maman, Z.S.; Yazdi, M.A.A.; Cavuoto, L.A.; Megahed, F.M. A data-driven approach to modelling physical fatigue in the workplace using wearable sensors. Appl. Ergon. 2017, 65, 515–529. [Google Scholar] [CrossRef] [PubMed]
- Plantard, P.; Muller, A.; Pontonnier, C.; Dumont, G.; Shum, H.P.; Multon, F. Inverse dynamics based on occlusion-resistant Kinect data: Is it usable for ergonomics? Int. J. Ind. Ergon. 2017, 61, 71–80. [Google Scholar] [CrossRef]
- Li, X.; Gül, M.; Al-Hussein, M. An improved physical demand analysis framework based on ergonomic risk assessment tools for the manufacturing industry. Int. J. Ind. Ergon. 2019, 70, 58–69. [Google Scholar] [CrossRef]
- Bortolin, M.; Faccio, M.; Gamberi, M. Motion Analysis System (MAS) for production and ergonomics assessment in the manufacturing processes. Comput. Ind. Eng. 2020, 139, 105485. [Google Scholar] [CrossRef]
- Parson, K.C. Environmental ergonomics: A review of principles, methods and models. Appl. Ergon. 2000, 316, 581–594. [Google Scholar] [CrossRef]
- Azadeh, A.; Fam, I.M.; Khoshnoud, M.; Nikafrouz, M. Design and implementation of a fuzzy expert system for performance assessment of an integrated health, safety, environment (HSE) and ergonomics system: The case of a gas refinery. Inf. Sci. 2008, 178, 4280–4300. [Google Scholar] [CrossRef]
- Sen, R.N.; Das, S. An ergonomics study on compatibility of controls of overhead cranes in a heavy engineering factory in West Bengal. Appl. Ergon. 2000, 312, 179–184. [Google Scholar] [CrossRef]
- Grzybowski, W. A method of ergonomic workplace evaluation for assessing occupational risks at workplaces. Int. J. Occup. Saf. Ergon. 2001, 72, 223–237. [Google Scholar] [CrossRef]
- Maldonado, A.; García, J.L.; Alvarado, A.; Balderrama, C.O. A hierarchical fuzzy axiomatic design methodology for ergonomic compatibility evaluation of advanced manufacturing technology. Int. J. Adv. Manuf. Technol. 2013, 661, 171–186. [Google Scholar] [CrossRef]
- Borah, S. Ergonomic Assessment of Drudgery of Women Worker Involved in Cashew nut Processing Factory in Meghalaya, India. Procedia Manuf. 2015, 3, 4665–4672. [Google Scholar] [CrossRef]
- Matos, M.; Arezes, P.M. Ergonomic Evaluation of Office Workplaces with Rapid Office Strain Assessment ROSA. Procedia Manuf. 2015, 3, 4689–4694. [Google Scholar] [CrossRef] [Green Version]
- Kamala, V.; Malliga, P.; Priyanka, G.M. Criteria Based Ergonomic Assessment in a Manufacturing Industry. In Proceedings of the IEEE International Conference on Industrial Engineering and Engineering Management (IEEM), Bali, Indonesia, 4 December 2016; pp. 238–242. [Google Scholar] [CrossRef]
- Saleem, J.; Kleiner, B.M.; Nussbaum, M. Empirical evaluation of training and a work analysis tool for participatory ergonomic. Int. J. Ind. Ergon. 2003, 31, 387–396. [Google Scholar] [CrossRef]
- Vianna, C.; Quaresma, M. Ergonomic Issues Related to Clothing and Body Changes of the New Elderly Women. Procedia Manuf. 2015, 3, 5755–5760. [Google Scholar] [CrossRef] [Green Version]
- Sanders, M.S.; McCormick, E.J. Human Factors in Engineering and Design, 7th ed.; Mcgraw-Hill Book Company: New York, NY, USA, 1993. [Google Scholar]
- Botti, L.; Mora, C.; Regattieri, A. Integrating ergonomics and lean manufacturing principles in a hybrid assembly line. Comput. Ind. Eng. 2017, 111, 481–491. [Google Scholar] [CrossRef]
- Karwowski, W. International Encyclopedia of Ergonomics and Human Factors—3 Volume Set; CRC Press: Boca Raton, FL, USA, 2007. [Google Scholar] [CrossRef]
- Siemieniuch, C.E.; Sinclair, M.A. Extending systems ergonomics thinking to accommodate the socio-technical issues of Systems of Systems. Appl. Ergon. 2014, 45, 85–98. [Google Scholar] [CrossRef]
- Vinodh, S.; Ramesh, K.; Arun, C.S. Application of interpretive structural modelling for analysing the factors influencing integrted lean sustainable system. Clean Technol. Environ. Policy 2016, 18, 413–428. [Google Scholar] [CrossRef]
- Dubey, R.; Gunasekaran, A.; Singh, .S.T. Building theory of sustainable manufacturing using total interpretive structural modelling. Int. J. Syst. Sci. Oper. Logist. 2015, 52, 231–247. [Google Scholar] [CrossRef]
- Fornell, C.; Larcker, D.F. Evaluating structural equation models with unobservable variables and measurement error. J. Mark. Res. 1981, 18, 39–50. [Google Scholar] [CrossRef]
- Straub, D.; Boudreau, M.C.; Gefen, D. Validation guidelines for IS positivist research. Commun. Assoc. Inf. Syst. 2004, 13, 63. [Google Scholar] [CrossRef]
- Jung, S.; Lee, S.; Yu, J. Identification and Prioritization of Critical Success Factors for Off-Site Construction Using ISM and MICMAC Analysis. Sustainability 2021, 13, 8911. [Google Scholar] [CrossRef]
- Hooper, D.; Coughlan, J.; Mullen, M. Structural Equation Modelling: Guidelines for Determining Model Fit. Electron. J. Bus. Res. Methods 2008, 6, 53–60. [Google Scholar]
Figure 1.
Proposed research scheme for ergonomic assessment.

Figure 2.
ISM model.

Figure 3.
Representations of factors and tests of hypotheses.

Figure 4.
MICMAC analysis.


Table 1.
Summary of the literature review.
| Factors Considered in the Ergonomic Evaluation | Area of Study | ||||||||
|---|---|---|---|---|---|---|---|---|---|
| Authors | Physiological Factors | Psychological Factors | Environmental Factors | Safety Factors | Technological and Organizational Factors | Other Factors | Process/Technology | Workplace | Equipment |
| Keyserling et al. (1992) [12] | ✓ | ✕ | ✕ | ✕ | ✕ | ✕ | ✕ | ✓ | ✕ |
| Parsons (2000) [28] | ✕ | ✕ | ✓ | ✕ | ✕ | ✕ | ✕ | ✕ | ✕ |
| Sen and Das (2000) [30] | ✕ | ✓ | ✕ | ✕ | ✕ | ✕ | ✕ | ✕ | ✓ |
| Grzybowski (2001) [31] | ✓ | ✓ | ✓ | ✕ | ✓ | ✕ | ✕ | ✓ | ✕ |
| Shikdar et al. (2002) [1] | ✕ | ✕ | ✓ | ✓ | ✕ | ✓ | ✕ | ✓ | ✕ |
| Laring et al. (2005) [13] | ✓ | ✕ | ✕ | ✕ | ✕ | ✕ | ✕ | ✓ | ✕ |
| Sonne et al. (2012) [17] | ✓ | ✕ | ✕ | ✕ | ✕ | ✕ | ✕ | ✓ | ✕ |
| Maldonado et al. (2015) [32] | ✓ | ✕ | ✓ | ✕ | ✓ | ✓ | ✓ | ✕ | ✓ |
| Borah (2015) [33] | ✓ | ✕ | ✕ | ✕ | ✕ | ✕ | ✓ | ✕ | ✕ |
| Matos and Arezes (2015) [34] | ✓ | ✕ | ✕ | ✕ | ✕ | ✕ | ✕ | ✓ | ✕ |
| Poochada and Chaiklieng (2015) [18] | ✓ | ✕ | ✕ | ✕ | ✕ | ✕ | ✕ | ✓ | ✕ |
| Chander and Cavatorta (2017) [23] | ✓ | ✓ | ✕ | ✕ | ✕ | ✓ | ✕ | ✓ | ✕ |
| Li et al. (2019) [26] | ✓ | ✕ | ✓ | ✓ | ✕ | ✕ | ✕ | ✓ | ✕ |
| Bortolini et al. (2020) [27] | ✓ | ✕ | ✕ | ✕ | ✕ | ✕ | ✕ | ✓ | ✕ |
| Model presented in this study | ✓ | ✓ | ✓ | ✓ | ✕ | ✕ | ✕ | ✓ | ✕ |
Table 2.
Conceptual framework for ergonomic assessment.
| Factors | Criteria | Variables | Sources |
|---|---|---|---|
| Physiological factors (PHY) | Biomechanical aspects (phy1) | Access to machine and clearance | Maldonado et al. (2013) [32] |
| Horizontal/vertical reach | Maldonado et al. (2013) [32] | ||
| Adjustability of design | Maldonado et al. (2013) [32] | ||
| Postural comfort of design | Maldonado et al. (2013) [32] | ||
| Physical work/endurance and design | Maldonado et al. (2013) [32] | ||
| Usability (phy2) | Compatibility of design and control | Maldonado et al. (2013) [32] | |
| Physical distribution of controls | Maldonado et al. (2013) [32] | ||
| Visual workplace design | Maldonado et al. (2013) [32] | ||
| Error tolerance | Maldonado et al. (2013) [32] | ||
| human–machine function allocation of design | Maldonado et al. (2013) [32] | ||
| Energy expenditure (phy3) | Worker movement | Borah (2015) [33] | |
| Material handling | Saleem et al. (2003) [36] | ||
| Basal metabolic rate | Vianna and quaresma (2013) [37] | ||
| Psychological factors (PSY) | Work–rest schedule (psy1) | Body heat | Keyserling et al. (1992) [12] |
| Heart rate | Keyserling et al. (1992) [12] | ||
| Work and rest periods | Keyserling et al. (1992) [12] | ||
| Human skills and training capability (psy2) | Skill level compatibility | Maldonado et al. (2013) [32] | |
| Training level compatibility | Maldonado et al. (2013) [32] | ||
| Human error (psy3) | Training | Sanders and mccormick (1993) [38] | |
| Design of equipment | Sanders and mccormick (1993) [38] | ||
| Worker selection | Sanders and mccormick (1993) [38] | ||
| Communication (psy4) | Information flow | Sanders and mccormick (1993) [38] | |
| Speech intelligibility | Sanders and mccormick (1993) [38] | ||
| Environmental factors (ENV) | Temperature/climate (env1) | Acclimatization | Åstrand et al. (1986) [9]; parsons (2000) [28] |
| Limits of tolerance | Åstrand et al. (1986) [9]; parsons (2000) [28] | ||
| Noise (env2) | Sound intensity | Parsons (2000) [28] | |
| Sound categories | Parsons (2000) [28] | ||
| Housekeeping (env3) | Maintenance | Parsons (2000) [28] | |
| Level of cleanliness | Parsons (2000) [28] | ||
| Illumination (env4) | Nature of light | Parsons (2000) [28] | |
| Light distribution | Parsons (2000) [28] | ||
| Motion (vibration) (env5) | Interference with activities | parsons (2000) [28] | |
| Motion sickness | Parsons (2000) [28] | ||
| Safety factors (SAF) | Personal safety (saf1) | Personal protective equipment | Botti et al. (2017) [39] |
| Safety training | Karwowski (2007) [40] | ||
| Organizational safety (saf2) | Hazards | Botti et al. (2017) [39] | |
| Regulations and norms | Siemieniuch and sinclair (2014) [41] | ||
| Risk management (saf3) | Risk assessment | Sonne et al. (2012) [17] |
Table 3.
Structural self-interaction matrix (SSIM).
| PHY | PSY | ENV | SAF | |
|---|---|---|---|---|
| PHY | 1 | V | A | A |
| PSY | 1 | A | A | |
| ENV | 1 | X | ||
| SAF | 1 |
Table 4.
Level partitions for ergonomic contributory factors.
| Factors | Reachability Set | Antecedent Set | Intersection Set | Level |
|---|---|---|---|---|
| PHY | PHY, PSY | PHY, ENV, SAF | PHY | I |
| PSY | PSY | PHY, PSY, ENV, SAF | PSY | |
| ENV | PHY, PSY, ENV, SAF | ENV, SAF | ENV, SAF | |
| SAF | PHY, PSY, ENV, SAF | ENV, SAF | ENV, SAF | |
| PHY | PHY | PHY, ENV, SAF | PHY | II |
| ENV | PHY, ENV, SAF | ENV, SAF | ENV, SAF | |
| SAF | PHY, ENV, SAF | ENV, SAF | ENV, SAF | |
| ENV | ENV, SAF | ENV, SAF | ENV, SAF | III |
| SAF | ENV, SAF | ENV, SAF | ENV, SAF |
Table 5.
Construct validity.
| Construct | Composite Reliability | AVE | Cronbach’s α |
|---|---|---|---|
| Ergonomic Practice | 0.887 | 0.728 | 0.827 |
| Physiological Factors | 0.886 | 0.723 | 0.805 |
| Psychological Factors | 0.805 | 0.500 | 0.727 |
| Environmental Factors | 0.846 | 0.500 | 0.798 |
| Safety Factors | 0.767 | 0.687 | 0.767 |
Table 6.
Discriminant validity.
| Construct | Ergonomic Practice | Physiological Factors | Psychological Factors | Environmental Factors | Safety Factors |
|---|---|---|---|---|---|
| Ergonomic Practice | 0.853 | ||||
| Physiological Factors | 0.151 | 0.850 | |||
| Psychological Factors | 0.192 | 0.457 | 0.707 | ||
| Environmental Factors | 0.771 | 0.480 | 0.457 | 0.701 | |
| Safety Factors | 0.135 | 0.647 | 0.629 | 0.471 | 0.829 |
Table 7.
Bootstrapping results.
| Construct | Indicator | Original Sample | Sample Mean | Standard Deviation | t-Statistic |
|---|---|---|---|---|---|
| Ergonomic Practice | EP1 | 0.968 | 0.887 | 0.205 | 4.713 |
| EP2 | 0.897 | 0.812 | 0.242 | 3.701 | |
| EP3 | 0.666 | 0.608 | 0.273 | 2.44 | |
| Physiological Factors | PHY1 | 0.742 | 0.739 | 0.041 | 17.985 |
| PHY2 | 0.907 | 0.907 | 0.014 | 66.47 | |
| PHY3 | 0.892 | 0.893 | 0.021 | 43.195 | |
| Psychological Factors | PSY1 | 0.291 | 0.283 | 0.171 | 1.705 |
| PSY2 | 0.782 | 0.783 | 0.038 | 20.652 | |
| PSY3 | 0.652 | 0.638 | 0.082 | 7.917 | |
| PSY4 | 0.928 | 0.924 | 0.018 | 51.241 | |
| PSY5 | 0.721 | 0.717 | 0.059 | 12.143 | |
| Environmental Factors | ENV1 | 0.399 | 0.423 | 0.169 | 2.36 |
| ENV2 | 0.772 | 0.725 | 0.16 | 4.81 | |
| ENV3 | 0.723 | 0.674 | 0.166 | 4.352 | |
| ENV4 | 0.81 | 0.788 | 0.095 | 8.548 | |
| ENV5 | 0.845 | 0.815 | 0.09 | 9.431 | |
| ENV6 | 0.551 | 0.518 | 0.125 | 4.392 | |
| Safety Factors | SF1 | 0.923 | 0.923 | 0.012 | 77.955 |
| SF2 | 0.889 | 0.89 | 0.02 | 44.844 | |
| SF3 | 0.647 | 0.634 | 0.076 | 8.509 |
Table 8.
Ergonomic measurement model t-test results.
| Hypothesis Number | Hypothesis | Entire Sample Estimate | Mean of Subsamples | Standard Error | t-Statistic |
|---|---|---|---|---|---|
| H1 | PSY-EP | 0.455 | 0.481 | 0.042 | 10.87 |
| H2 | PHY-EP | 0.879 | 0.878 | 0.018 | 49.652 |
| H3 | SAF-EP | 0.11 | 0.131 | 0.012 | 9.167 |
| H4 | PHY-PSY | 0.948 | 0.948 | 0.009 | 107.55 |
| H5 | ENV-PHY | 0.48 | 0.507 | 0.043 | 11.128 |
| H6 | SAF-PHY | 0.927 | 0.926 | 0.016 | 58.634 |
| H7 | ENV-SAF | 0.471 | 0.5 | 0.044 | 10.781 |
Table 9.
Fuzzy index.
| Enabler | Criteria | Attributes | L1 | L2 | L3 | L4 | Wjk | Wij | Wi |
|---|---|---|---|---|---|---|---|---|---|
| HFI1 | HFI11 | HFI111 | 7 | 9 | 8 | 7 | 0.2 | 0.5 | 0.4 |
| HFI112 | 8 | 8 | 8 | 7 | 0.2 | ||||
| HFI113 | 8 | 8 | 8 | 8 | 0.2 | ||||
| HFI114 | 6 | 9 | 8 | 7 | 0.2 | ||||
| HFI115 | 9 | 8 | 9 | 8 | 0.2 | ||||
| HFI12 | HFI121 | 9 | 8 | 9 | 9 | 0.2 | 0.25 | ||
| HFI122 | 9 | 9 | 9 | 8 | 0.2 | ||||
| HFI123 | 7 | 5 | 6 | 6 | 0.2 | ||||
| HFI124 | 8 | 9 | 9 | 8 | 0.2 | ||||
| HFI125 | 9 | 9 | 9 | 8 | 0.2 | ||||
| HFI13 | HFI131 | 6 | 5 | 6 | 5 | 0.25 | 0.25 | ||
| HFI132 | 6 | 5 | 6 | 7 | 0.25 | ||||
| HFI133 | 8 | 9 | 6 | 9 | 0.5 | ||||
| HFI2 | HFI21 | HFI211 | 8 | 6 | 7 | 7 | 0.25 | 0.25 | 0.2 |
| HFI212 | 8 | 7 | 8 | 8 | 0.25 | ||||
| HFI213 | 9 | 8 | 9 | 9 | 0.5 | ||||
| HFI22 | HFI221 | 9 | 9 | 9 | 9 | 0.5 | 0.25 | ||
| HFI222 | 8 | 9 | 9 | 9 | 0.5 | ||||
| HFI23 | HFI231 | 8 | 9 | 9 | 8 | 0.25 | 0.25 | ||
| HFI232 | 9 | 7 | 8 | 8 | 0.5 | ||||
| HFI233 | 7 | 5 | 6 | 7 | 0.25 | ||||
| HFI24 | HFI241 | 10 | 8 | 9 | 9 | 0.5 | 0.25 | ||
| HFI242 | 8 | 9 | 9 | 7 | 0.5 | ||||
| HFI3 | HFI31 | HFI311 | 8 | 8 | 8 | 7 | 0.5 | 0.15 | 0.2 |
| HFI312 | 7 | 8 | 8 | 6 | 0.5 | ||||
| HFI32 | HFI321 | 8 | 8 | 8 | 8 | 0.5 | 0.15 | ||
| HFI322 | 7 | 8 | 8 | 7 | 0.5 | ||||
| HFI33 | HFI331 | 6 | 7 | 7 | 6 | 0.5 | 0.4 | ||
| HFI332 | 6 | 5 | 6 | 5 | 0.5 | ||||
| HFI34 | HFI341 | 8 | 8 | 8 | 8 | 0.5 | 0.15 | ||
| HFI342 | 8 | 7 | 8 | 7 | 0.5 | ||||
| HFI35 | HFI351 | 9 | 8 | 9 | 8 | 0.5 | 0.15 | ||
| HFI352 | 9 | 8 | 9 | 8 | 0.5 | ||||
| HFI4 | HFI41 | HFI411 | 7 | 7 | 3 | 4 | 0.5 | 0.33 | 0.2 |
| HFI412 | 8 | 9 | 9 | 7 | 0.5 | ||||
| HFI42 | HFI421 | 9 | 8 | 9 | 8 | 0.25 | 0.33 | ||
| HFI422 | 9 | 8 | 9 | 8 | 0.25 | ||||
| HFI423 | 9 | 8 | 9 | 8 | 0.5 | ||||
| HFI43 | HFI431 | 8 | 8 | 8 | 9 | 0.5 | 0.34 | ||
| HFI432 | 9 | 8 | 9 | 8 | 0.5 |
Publisher’s Note: MDPI stays neutral with regard to jurisdictional claims in published maps and institutional affiliations. |
© 2022 by the authors. Licensee MDPI, Basel, Switzerland. This article is an open access article distributed under the terms and conditions of the Creative Commons Attribution (CC BY) license (https://creativecommons.org/licenses/by/4.0/).
Share and Cite
MDPI and ACS Style
Vijayakumar, K.; Robert, P. Human Factor Index Measurement Using an ISM-SEM-Fuzzy Approach. Sustainability 2022, 14, 7635. https://0-doi-org.brum.beds.ac.uk/10.3390/su14137635
AMA Style
Vijayakumar K, Robert P. Human Factor Index Measurement Using an ISM-SEM-Fuzzy Approach. Sustainability. 2022; 14(13):7635. https://0-doi-org.brum.beds.ac.uk/10.3390/su14137635
Chicago/Turabian StyleVijayakumar, Kamala, and Paul Robert. 2022. "Human Factor Index Measurement Using an ISM-SEM-Fuzzy Approach" Sustainability 14, no. 13: 7635. https://0-doi-org.brum.beds.ac.uk/10.3390/su14137635
Note that from the first issue of 2016, this journal uses article numbers instead of page numbers. See further details here.