
Challenges and Opportunities for Future BEVs Adoption in Croatia


1
Center for Vehicles of Croatia, Capraška 6, 10000 Zagreb, Croatia
2
Faculty of Transport and Traffic Sciences, University of Zagreb, Vukelićeva 4, 10000 Zagreb, Croatia
*
Author to whom correspondence should be addressed.
Sustainability 2022, 14(13), 8080; https://0-doi-org.brum.beds.ac.uk/10.3390/su14138080
Submission received: 18 May 2022
/
Revised: 29 June 2022
/
Accepted: 30 June 2022
/
Published: 1 July 2022
(This article belongs to the Special Issue Sustainability in Urban Transportation: Factors Impacted on Alternative Fuel Vehicle Usage)
Abstract
:Electric vehicles (EVs) represent a revolution and the beginning of a new era in the development of the automotive industry. This study investigates the advantages and disadvantages of battery electric vehicles (BEVs) and the possibilities of their better future adoption in the Republic of Croatia. Based on an in-depth analysis of the current status of BEVs in Croatia, the study shows that the number of passenger BEVs and charging stations are constantly increasing. However, despite the many advantages of BEVs, such as a reduction in urban air pollution, reduction in greenhouse gas emissions, noise-free, less dependence on oil as a fuel, etc., there also are certain disadvantages, such as a limited range of vehicles, the correlation with an insufficient number of charging stations on the transport network as a whole, storage of lithium-ion batteries, maintenance of electric vehicles, high prices, and the safety of BEVs in the road traffic system. The practical implications of BEVs’ positive and negative effects and challenges for increasing their implementation in Croatia are discussed. The results and findings from this research could present a base for policymakers and decisionmakers to formulate policies and strategies to improve the opportunities for the adoption of BEVs in Croatia.
1. Introduction
The global trend of an increase in the use of passenger cars operating on the principle of internal combustion is a problem in the entire transport system today. Along with the industry, the transport system is the biggest polluter, mainly due to the negative impact on the environment from the exhaust gases emitted by internal combustion engine vehicles, which have high emissions [1]. Until the end of the 20th century, petrol and diesel were indisputably the main fuel used for road transport motor vehicles. In the last ten years, it has been recognized that the continuous use of fossil fuels is unsustainable, partly due to the resulting CO2 emissions and the uncertain long-term availability of these types of fuels [2]. Electric vehicles are marking a revolution worldwide because of their environmental and socio-economic benefits [3]. The adoption of electric vehicles could bring significant changes to society, move the economy away from oil as the leading resource, and enable the exploration of other energy sources [1].
Along with the term electric vehicles comes the term “electric mobility”, which refers to an alternative transport system based on vehicles that use electricity as a drive [4]. According to [5], electric vehicles can be divided into three categories: hybrid, plug-in hybrid, and battery electric vehicles. Hybrid uses petrol and a smaller battery to recharge a standard internal combustion engine. Hybrid vehicles have consumption that increases by about 25% compared to standard internal combustion vehicles. As a result, this vehicle still has and emits carbon emissions, but significantly less than standard vehicles [5,6]. The plug-in hybrid is similar to a hybrid vehicle. It contains a larger battery, which can be charged by an electric network, regenerative braking, and a petrol engine. As a result, the plug-in hybrid continues to produce direct carbon emissions similar to a hybrid vehicle [5]. Several authors mention one more category of EVs, called fuel cells electrical vehicles (FCEVs). FCEVs are attractive due to “zero” emissions on the roads and are comparable to an ICEV in terms of driving range, but the high cost and lack of charging stations remain a major challenge for FCEVs. The battery charging is much longer than that of the hydrogen tank, but the continuity of power supply is less reliable than standard batteries used in electric vehicles [7,8,9,10,11,12]. Since there are no FCEVs registered in Croatia, this category will not be analysed in this paper [13]. The subject of this paper is battery electric vehicles (BEVs) since they are immediate “green” cars due to the lack of exhaust systems and carbon emissions. This type of vehicle does not contain an internal combustion engine and must be connected to recharging mains. However, a power plant that produces electricity can emit greenhouse gases, depending on the electricity production, similar to that of hybrid vehicles with external charging [5]. Electrifying transport is a promising approach to mitigating climate change. The introduction of BEVs on the markets has significantly impacted various areas, particularly affecting the electricity grid. Various policies have been implemented to encourage the development of BEVs, and the trend of acceptance of BEVs has increased in recent years. The continuous development of electric vehicle driving, electric batteries, and the charging infrastructure for electric vehicles has further improved EV technology and enabled wider use [14].
Norway has the largest number of passenger BEVs in Europe, followed by France and Germany. The lowest number of BEVs was recorded in Kosovo [15]. In Croatia, in the period from 2007 to 2020, an increase in the number of BEVs was observed. The reason for this trend can be attributed to the trust that owners of BEVs give to vehicle manufacturers, incentives in the form of subsidies offered by the state to customers, environmental awareness of new owners, various education and good customer awareness, the financial condition of customers, or a possible curiosity to change the vehicle and the current fuel they use. The European Union’s long-term goal of achieving a competitive, low-carbon economy is primarily based on enabling investment in environmental protection, significantly reducing energy consumption, switching to electric vehicles, and developing smart grids while promoting renewable energy sources to reduce greenhouse gas emissions by at least 80% by 2050 compared to 1990 levels. As transport is one of the leading systems responsible for emitting exhaust emissions in the European Union, the switching and acceptance of electric vehicles could make it possible to reduce them significantly [16]. The European Commission has set ambitious targets for reducing carbon dioxide (CO2) emissions in the transport system by 2050 [17]. In this context, most traffic decarbonization scenarios envisage and open the door to an increase in the number of electric vehicles on the market from 2030 to 2050. However, the implementation of BEVs brings some obstacles in the form of influential factors, such as vehicle batteries, driving range, costs of purchasing and owning a BEV, and charging stations for electric vehicles. These obstacles should be addressed from 2020 to 2030, as this is a crucial period for achieving electric mobility and acceptance of electric vehicles [18]. The research includes a detailed analysis of the state of BEV usage in Croatia and the determination of the possibility of greater use of BEVs.
This paper consists of six sections. After the introduction, the Section 2 presents a detailed overview of the advantages and disadvantages of BEVs and their implementation in the EU. The Section 3 describes the data and method. Section 4 explains the analysis of BEV usage in the Republic of Croatia, emphasizing passenger BEVs. Section 5 presents a discussion followed by conclusions in Section 6.
2. Background
2.1. Advantages and Disadvantages of Battery Electric Vehicles
Internal combustion engines have been the dominant propulsion choice for road vehicles for over a hundred years. The automotive industry is one of the biggest polluters in the world. Preventing environmental pollution and depleting oil resources for fuels leads to searching for new alternative solutions for energy sources used by vehicles. The advancement of science behind BEVs is crucial for preserving the environment and developing more innovative solutions to create a smarter planet. As alternatives are sought for energy sources, there is great interest in electric vehicles as possible solutions to reduce dependence on fossil fuels [5].
BEVs have several advantages over standard internal combustion engine vehicles (ICEVs). In terms of energy efficiency, electric motors convert 75% of the chemical energy from batteries into wheel drive compared to internal combustion engines that convert only 20% of the energy stored in gasoline. BEVs do not produce noise and work quietly, enabling quiet operation and stronger acceleration, and they require less maintenance than ICEVs [6]. In terms of environmental friendliness, BEVs do not emit any exhaust emissions and are independent of crude oils [19]. BEV combined with advanced hardware has a number of additional features that certainly increase the quality and safety of driving. For example, Tesla is constantly improving its in-vehicle hardware to achieve full autonomous vehicles; the latest full self-driving hardware upgrade offers navigate on autopilot, smart summon, auto lane change and autopark [20]. Despite the many advantages BEVs have over ICEVs, various shortcomings have been identified through literature analysis. An analysis of the relevant literature concludes that the influential factors that play a key role in the acceptance and adoption of electric vehicles can be classified into the following categories: technical-technological, economic, psychological, environmental and political.
The technical-technological influential factor for adopting and accepting BEVs is crucial to users and potential buyers. These factors include the technical characteristics of a BEV’s appearance, performance such as speed and acceleration, range of BEVs, infrastructure facilities in the form of charging stations, new technologies, batteries, and battery life cycle—from production to installation, recycling, and storage. According to numerous authors [21,22,23,24,25,26,27,28,29,30,31], the most significant technical-technological influential factor of BEVs is limited range, and as such, it is often interpreted in a negative context. ICEV can exceed up to three times the range with one fuel tank than a BEV with one battery charge [30]. A limited range of BEVs requires a dense charging station network to keep electric vehicles at a certain level. Adequate charging infrastructure is extremely important for BEV adoption, making a vicious circle because limited infrastructure is a barrier to BEV adoption, and investment in charging networks depends on the number of BEVs [23]. The disadvantages of batteries are limited battery longevity, battery range, and long battery recharging in fast or slow mode. An additional disadvantage is that the batteries are heavy and take up a lot of space [19,21,25,30,31,32,33,34,35,36,37,38,39,40,41,42,43]. The energy supply and storage present a significant technical problem. The batteries installed in the first-generation BEVs have a shorter life cycle than the rest of the car. The batteries also have a limited number of charging cycles [36]. BEV users pay great attention to performance, so they focus on vehicle weight, coefficient of aerodynamic drag, accurate engine size, and users find vehicle design very important [29,44]. Concerns among users arise when choosing a brand and size [45], while other technical factors are also important, such as top speed, after-sales maintenance, trunk space, acceleration, responsiveness, smoothness, and low noise [25,38,39,40,41]. The disadvantage compared to ICEV is that the vehicle’s problems cannot be fixed at home by the owner due to high-voltage technology [36].
The economic impact factor that includes the high cost of electric vehicles is a significant obstacle to widespread use. Most negative associations with BEVs include high purchase costs [5,21,32]. High purchase cost, range limitations, and long charging time of BEVs are perceived as disadvantages and crucial purchase criteria, so they are significantly associated with decreased intent to purchase electric vehicles [19,25,46,47]. Experts and non-experts in electromobility considered cost-related factors more important than social identity [46]. According to [48], the price of BEVs is a more significant barrier for BEV adoption than the range.
Psychological factors have been significant in deciding on BEV adoption [46,49,50] Potential BEV users may have a significant psychological barrier to a limited range of BEVs and a lack of charging stations. According to research, BEVs satisfy the range needs of a sizeable share of the driving population. However, customers still prefer vehicles with a higher range [51] because range anxiety is defined as psychological anxiety consumer experiences due to the limited range of a BEV and fear of unsatisfactory battery range to get to the target location [52,53]. Increased anxiety correlated with spare parts and BEV repairs also have been observed. These factors discourage potential users from purchasing BEVs because of a negative association between anxiety and BEV use [54]. Accurate remaining discharge energy (RDE) estimation can relieve passenger anxiety for mileage, which is very important for EVs, especially for pure EVs [55]. Environmental concern is a psychological factor, according to Lai [49], which is an important deciding factor for the purchase of BEVs.
Ecology as an influencing factor is vital in the transition from ICEV to more environmentally friendly vehicles. The environmental benefits of using BEVs and financial incentives are key motivating factors for adopting BEVs [45]. As the effects of global warming appear globally, the awareness of environmental protection is growing, so people recognize the positive potential of electric vehicles and the decision to buy a car is influenced by environmental concerns [56]. The environmental benefit of BEVs is still unknown. While BEVs are generally considered beneficial to the environment in terms of reducing harmful emissions, there are studies against their worth, especially regarding the increased fossil fuels used at power plants to generate electricity for charging BEVs [21,22]. Battery production significantly impacts the environment and resources, and battery materials recycling and remanufacturing present considerable environmental and economic values [57]. At the macro level, the global environmental impact may be worse with more electric cars than with modern, fuel-efficient ICEVs due to the way electricity is generated. On the other hand, BEVs benefit the local environment at the micro-level because of their lack of local emissions and low noise levels. Regarding the noise level, reduced noise can lead to more traffic accidents involving pedestrians and bicyclists [58].
The political factor is significant and can be positive or negative, and it mostly depends on the transport policy of specific countries and openness to change and development. Negative foreign policies as an influential factor may relate to the lack of interest or inconsistency of the governments of individual countries to promote electric mobility, too small amounts of subsidies, and a short period of subsidies. The government’s active policy support is significant for the initial market creation and full-scale diffusion of BEVs [59]. The central policies, such as subsidies, preferential tax, free parking, and driving privileges, positively affect the consumers’ adoption of BEVs [26,33,60,61]. Tax reduction policies are effective, while other policies, such as pricing, remain contestable [37]. In the United States, both the federal and state governments have taken direct subsidies, tax credits, or tax exemptions to stimulate consumers to purchase BEVs [59]. Private investors could increase recharging station density because individuals would accept considerable mark-ups on the electricity price for large-scale, fast-charging infrastructure [26].
A small number of papers present research in the field of safety of electric vehicles in road traffic, which we find as a significant shortcoming and insufficiently researched area because there is a need for more detailed analyses in this area. Further analyses in the paper have identified and shown some of the shortcomings faced by users of electric vehicles. Researching and reviewing other scientific papers also have shown that the topic of traffic accidents involving electric vehicles or the procedure in case of traffic accidents was not covered.
2.2. Overview of Electric Vehicles in Europe
Norway has been the only country globally that saw the majority of new vehicle sales being electric in 2019. [62]. The country is developing many incentive programs to support selling electric vehicles and zero emissions by 2025, including an acquisition tax and VAT exemption for BEV [63] and import taxes. In Norway, the two largest urban regions, Oslo and Bergen, had a share in registered electric vehicles above the national average, reaching 64% and 67% in 2019. Electric vehicles sales share accounted for 58% of sales in 2019. The Tesla Model 3 was the most popular vehicle in Norway among all EV models and ICEV [64]. Germany represents the largest European vehicle market and has a share of 3% in sales of EVs in 2019. The federal government has supported accepting financial subsidies of EUR 4000 for BEVs with a price less than EUR 60,000 [63] and an exemption from paying annual taxes on electric vehicles and fuel cell vehicles. Furthermore, tax reliefs for electric vehicle companies have been adopted [64]. The French EV market is characterized by steady growth with an annual increase of 25–35% since 2015. The purchase of electric vehicles is encouraged by a bonus system-malus based on the amount of CO2, offering up to EUR 6000 for purchasing a new EV. Furthermore, incentives for financing infrastructure are included and incentives for companies engaged in producing EVs in France [64]. Owners of BEVs have a 50% discount on registration, or are even exempt, depending on the region [63]. The capital Paris had the highest registration of electric vehicles, with a 4.1% share of the registrations. Electric vehicles in France account for 70% of sales in 2019. The Renault Zoe was the most popular electric vehicle in the country, accounting for 30% of electric vehicle registrations in 2019 [64].
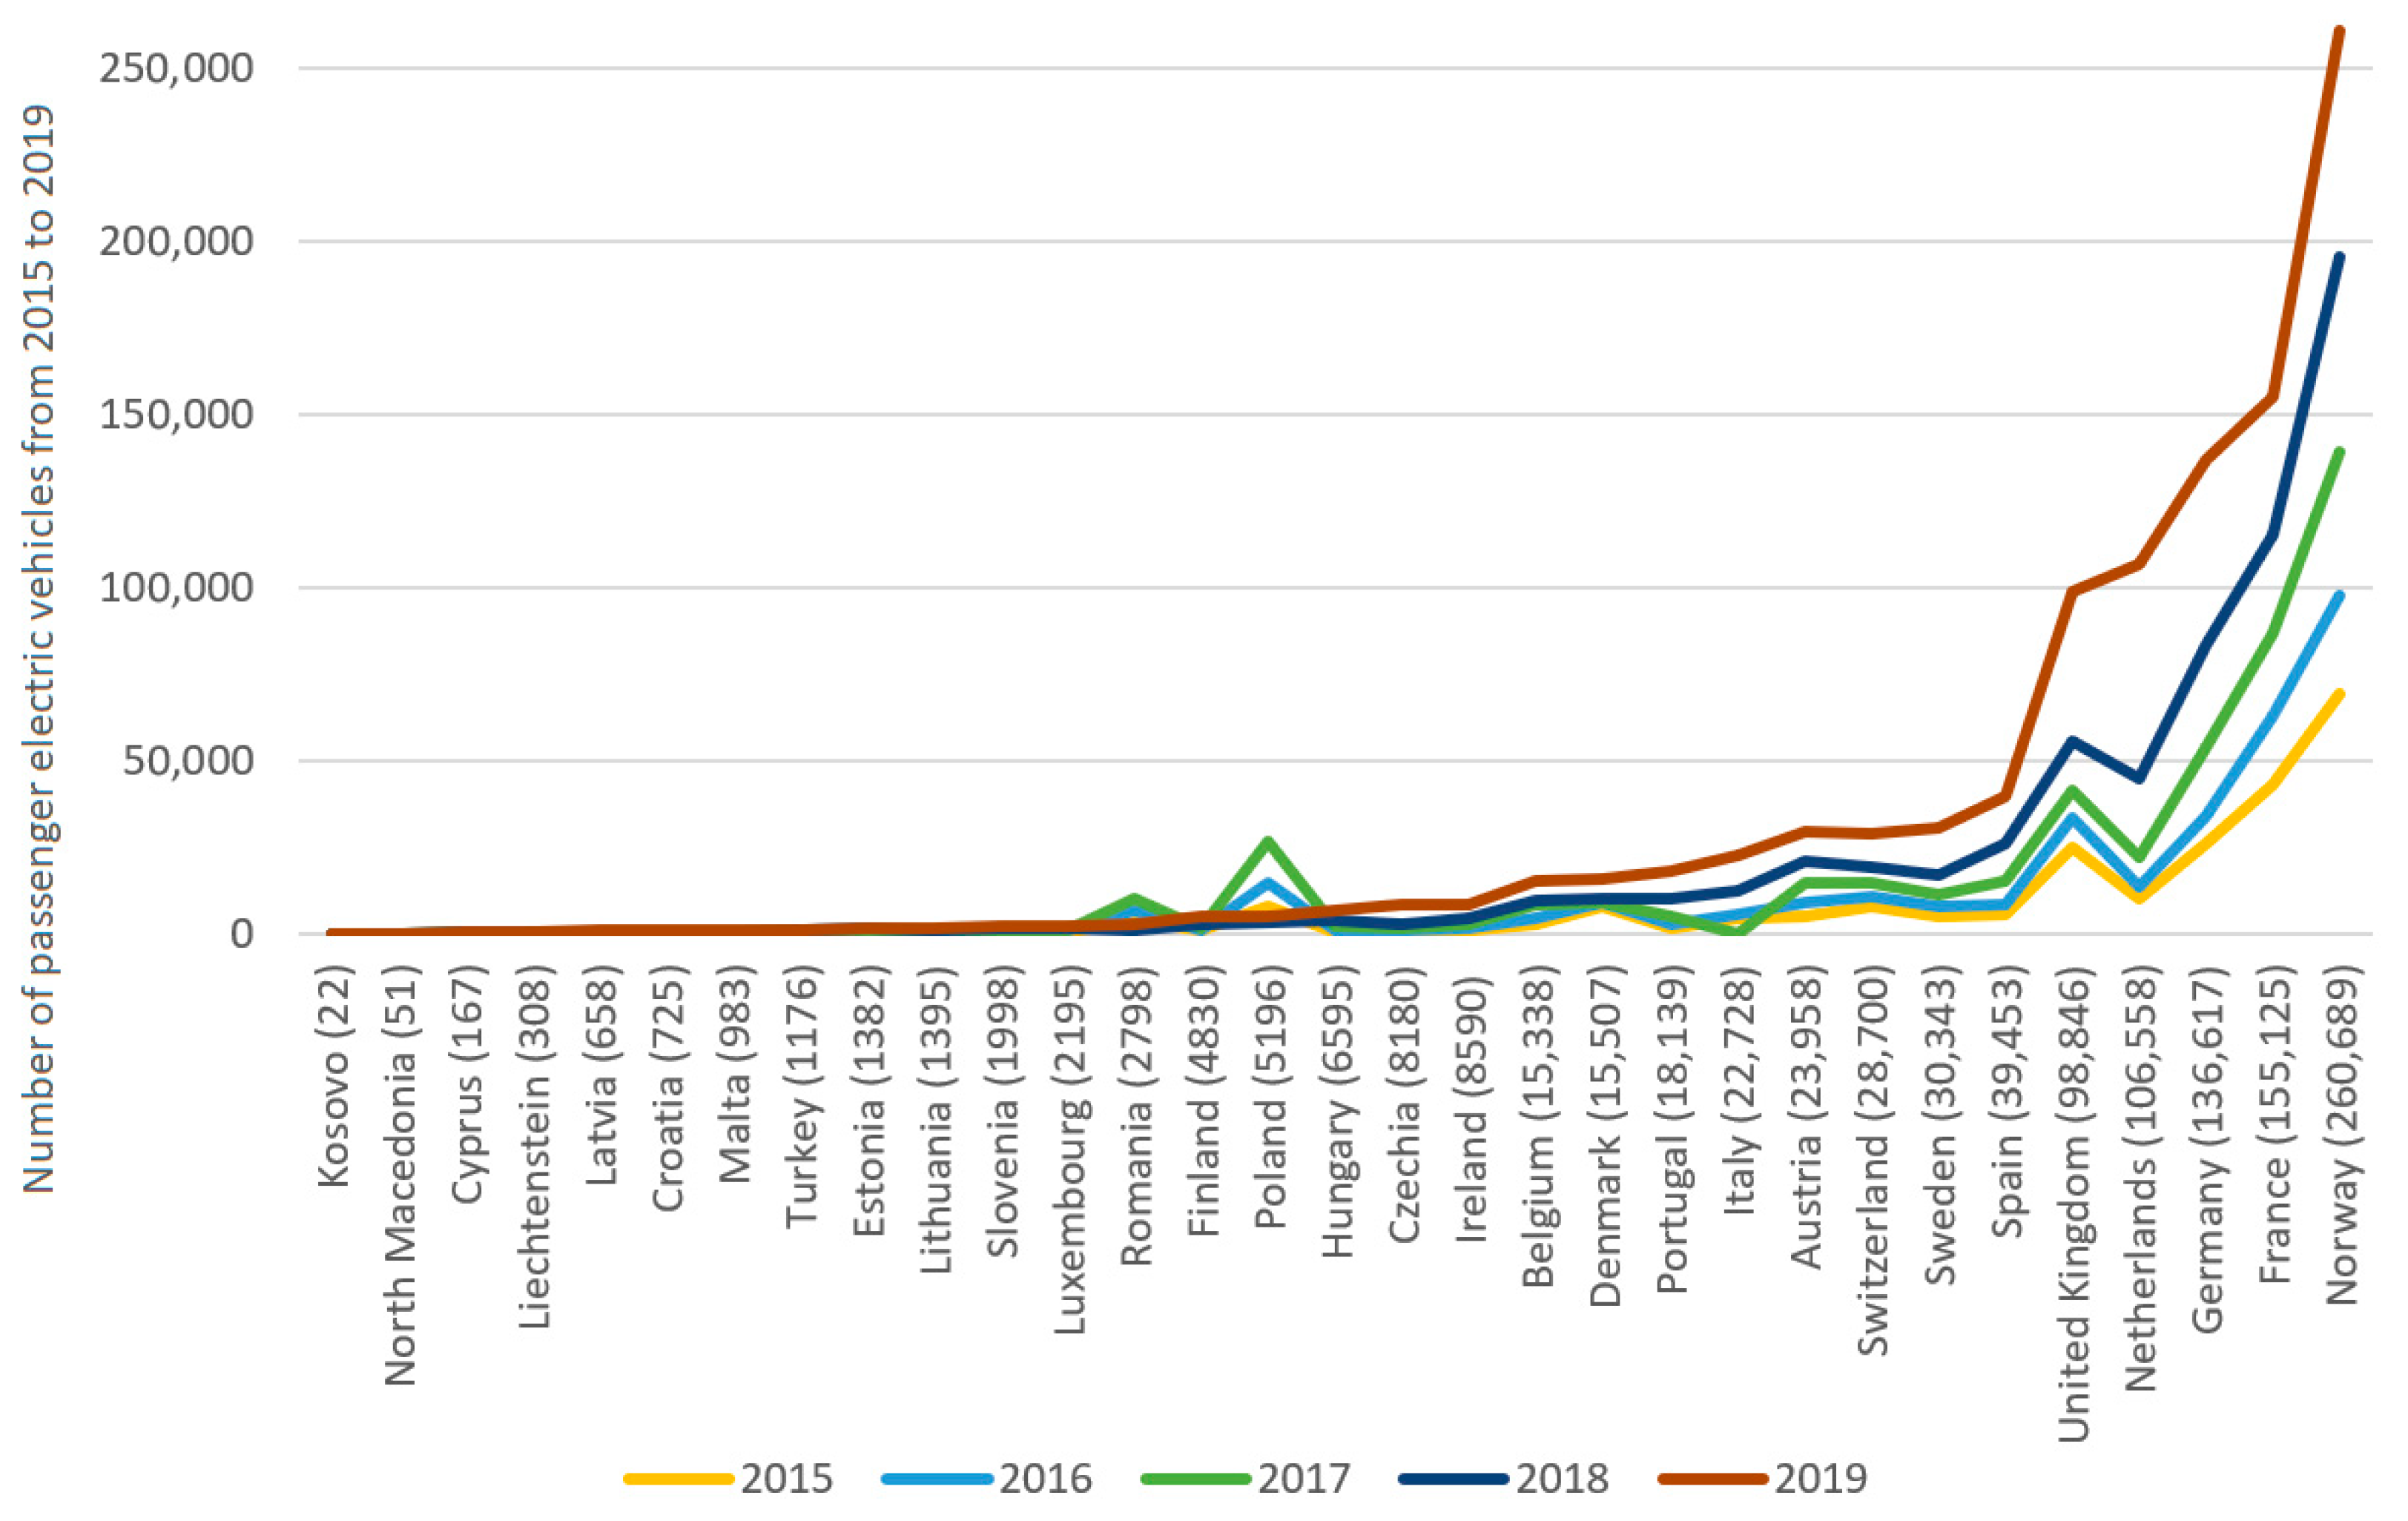
Figure 1 shows the number of passenger BEVs from 2015 to 2019. Norway has the largest number of passenger BEVs in Europe in this period (260,689 vehicles). Furthermore, more BEVs are visible in France (155,125 vehicles) and Germany (136,617 vehicles). Kosovo (22) and Northern Macedonia (51) have the smallest number of BEVs [15]. Data on the number of BEVs in some countries exist in several sources, but they are not fully harmonized.
3. Data and Method
This research focuses on two main segments: a detailed analysis of the current state of BEVs usage in Croatia and an analysis of electric mobility in other countries, to identify examples of good practices applicable in Croatia that would increase the use of BEVs. An electronic literature search of the Web of Science (WOS), Scopus, PubMed, and other relevant databases was performed to analyse the advantages and disadvantages of BEVs and their implementation in EU countries. Data in the case study were primarily obtained from the Center for Vehicles of Croatia (CVH). Part of the data was found online on their publicly available web pages, while the rest was collected from the STP CVH sector (technical inspection station) and the IT department. Croatian Telecom and ELEN online sources were used for charging station data and ESPAS (European Strategy and Policy Analysis System) and EAFO (European Alternative Fuels Observatory) data. Ordinance and Acts from The Peoples newspaper and data from The Environmental Protection and Energy Efficiency Fund and Energy Institute Hrvoje Požar were used for regulations and subsidies.
We used Power BI software to analyse large set of data collected from different sources, created our unique database, and visualized the processed data.
Statistical data over specific periods were used and analysed. The number of passenger BEVs over the years and their spatial and temporal distribution are shown within the overview of the BEVs in Croatia. The distribution of BEVs by the most represented manufacturers, types, and models of vehicles in Croatia is described. The technical support contains essential information about technical inspection, vehicle service, homologation and testing of vehicles, and vehicle conversion. The most common technical shortcomings of BEVs and obstacles when inspecting such passenger vehicles are also reviewed. The network of charging stations for electric vehicles in Croatia and existing measures for encouraging the use of BEVs are described. Finally, within the social aspect segment, a survey of BEV owners in Croatia was conducted in order to identify the most important factors of influence when buying and choosing a passenger electric vehicle.
4. Battery Electric Vehicles: Case Study Croatia
4.1. Overview of the Current Status of Passenger BEVs in Croatia
This paper focuses on passenger BEVs because significant growth has been observed in this category in recent years.
In Croatia, BEV usage is still in the development phase. Data on the number of electric vehicles have been recorded since 2007 when the first electric vehicle was present. Every year, the number of electric vehicles increases. In 2014, there were 74 passenger BEVs, while in 2018 there were 452, and in 2019 there were 730, which indicates an increasing trend. The peak was recorded in 2020 when 1343 passenger BEVs were recorded. Considering the data on the number of road vehicles in Croatia for 2020, it was noticed that the total number of motor vehicles was 2,195,588, of which 79% were in the M1 categories—passenger cars, including 1343 (0.08%) BEVs that are the subject of this paper [69,70,71].
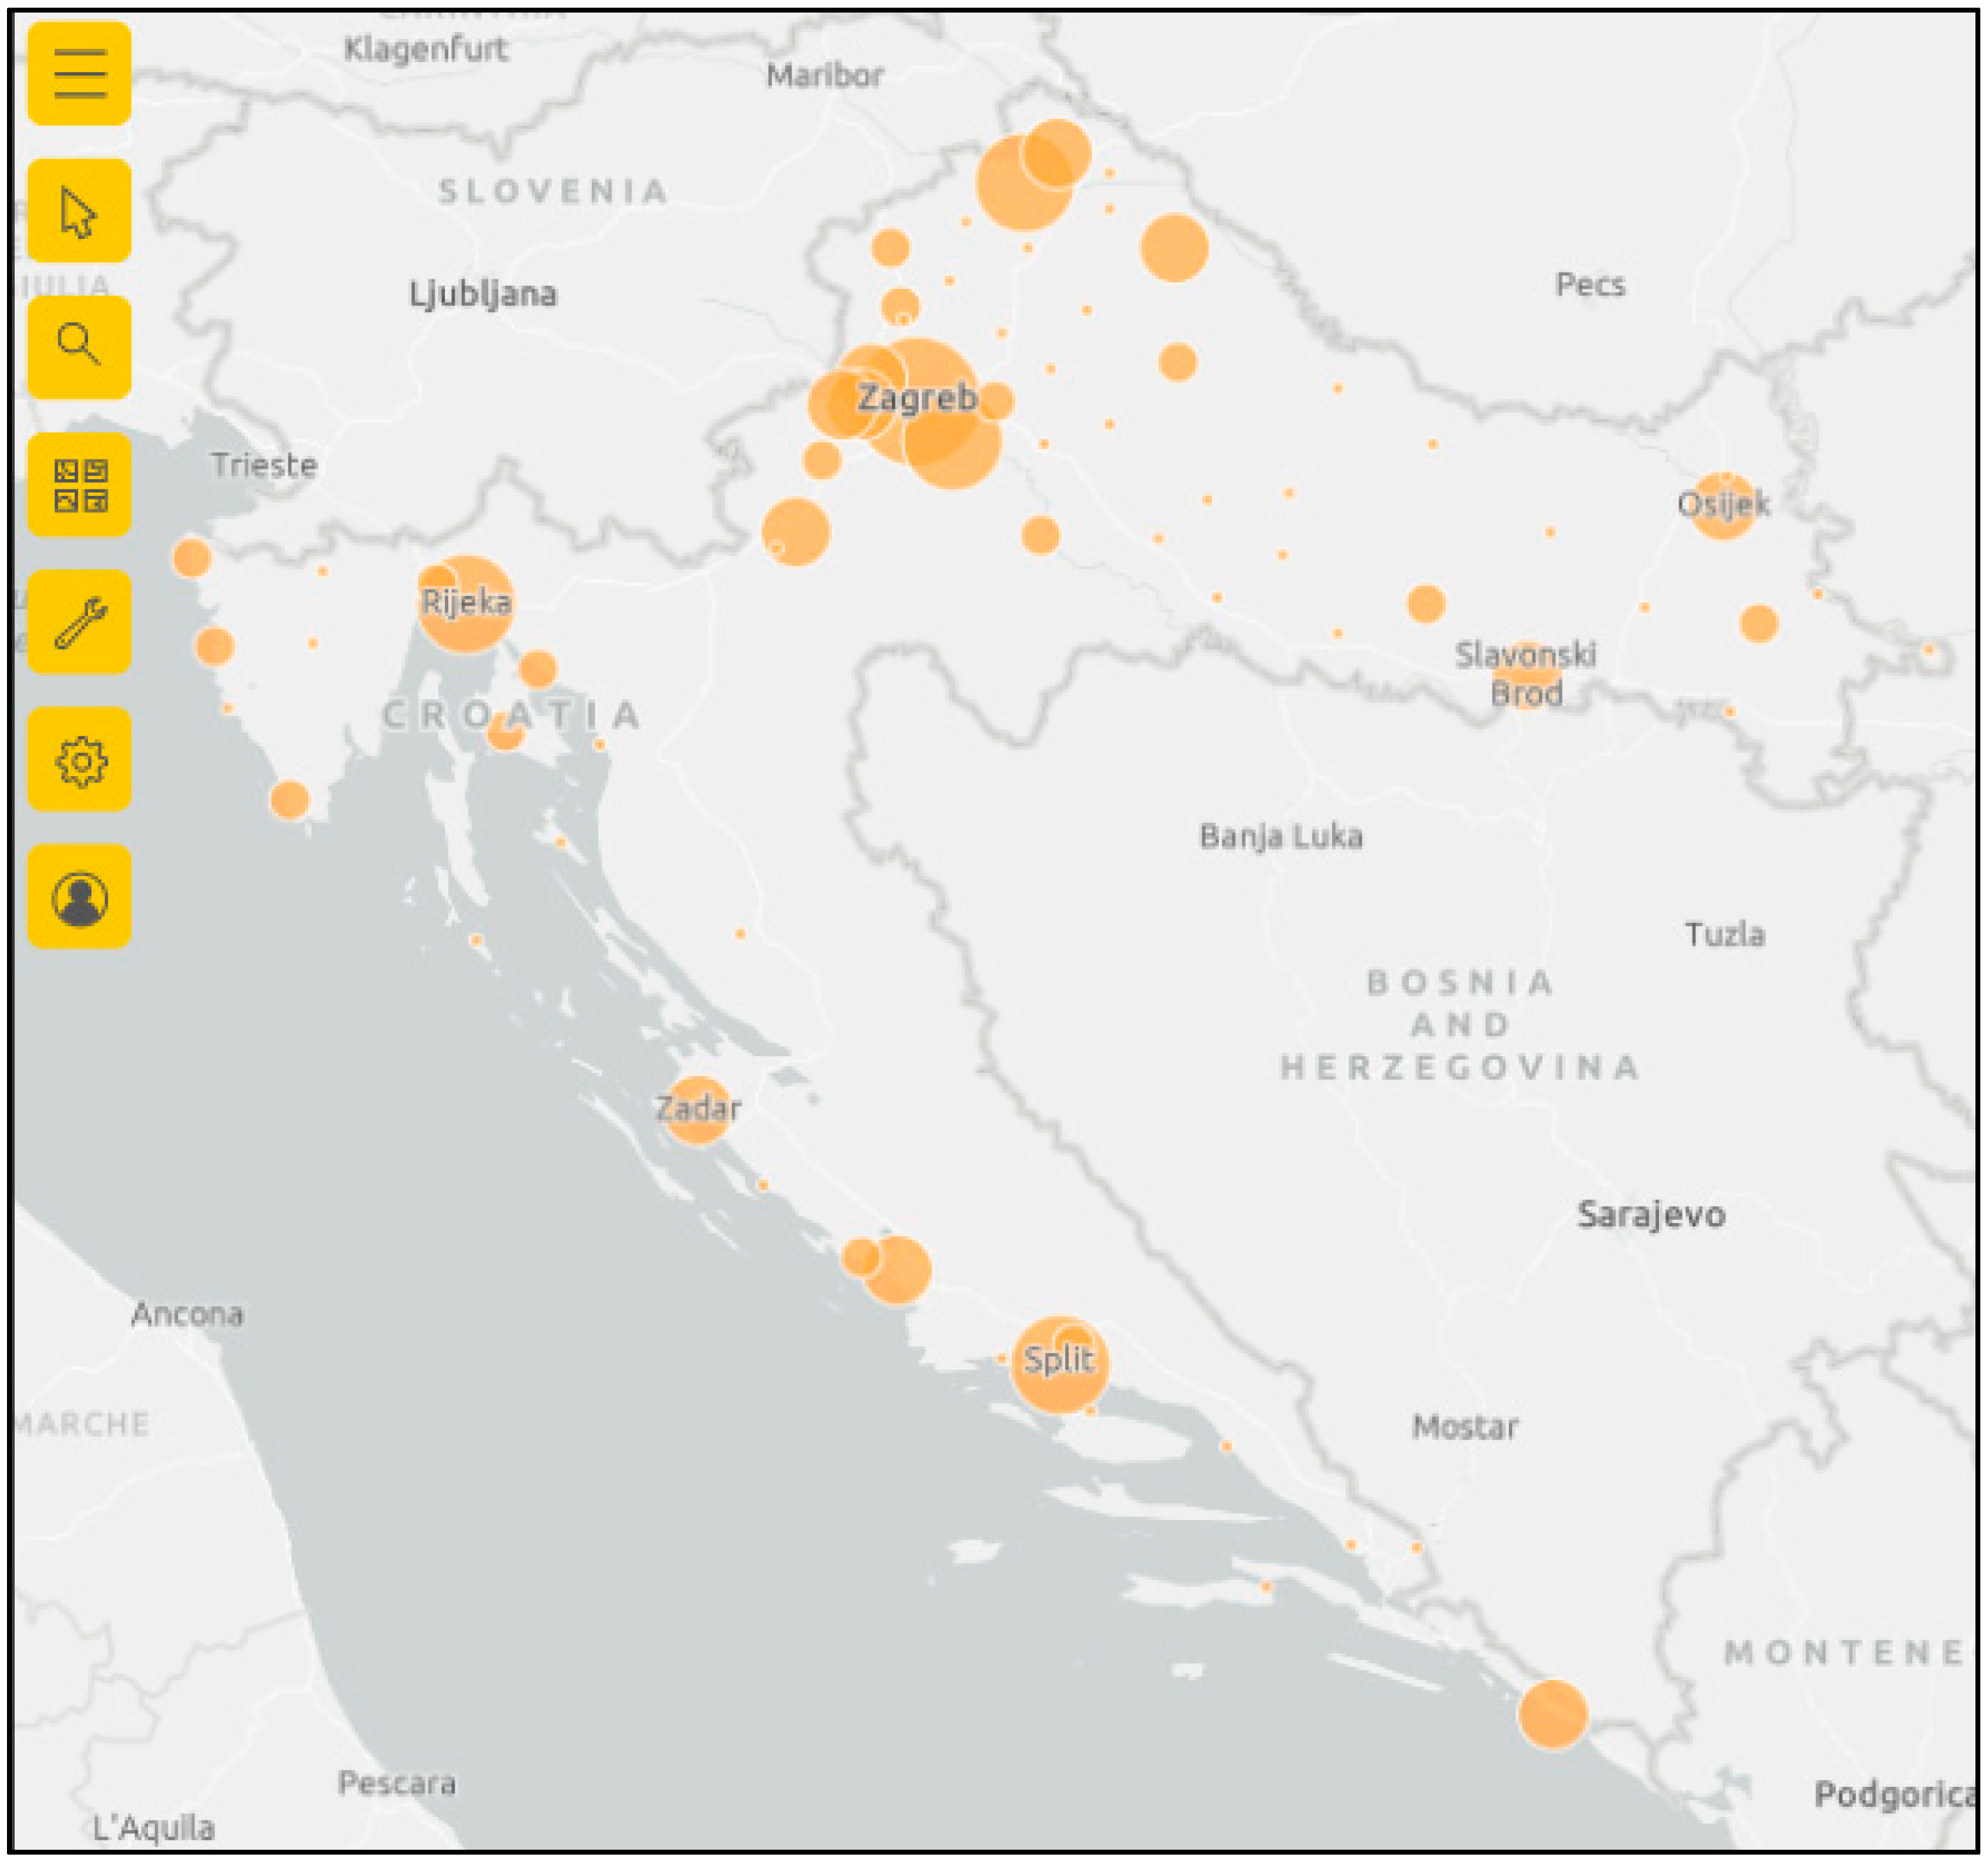
Passenger BEVs are distributed throughout Croatia in 73 cities. Figure 2 shows the spatial distribution of passenger BEVs in 2020. It is noticeable that, in 2020, out of 1343 registered passenger BEVs, the most significant number of vehicles was in the area of the capital Zagreb, at 42% or the 70 vehicles per 100,000 inhabitants [72]. There is a total of 313 passenger BEVs in Velika Gorica, or 9.9%, which means that more than 50% of the BEVs are in the gravitational area of the capital of Croatia. In the city of Rijeka, 7% of passenger BEVs were registered in 2020, which is 68 vehicles per 100,000 inhabitants. In Split, it is 34 vehicles per 100,000 inhabitants or 5%, while, in 2020, Osijek had 3% of BEVs (36 passenger BEVs per 100,000 inhabitants). According to the analysis of the number of passenger BEVs in 2015, there were 5 BEVs per 100,000 inhabitants in ZG, 7 BEVs in Rijeka, and 3 BEVs each in Split and Osijek [72]. The growth trend is visible through each observed year, which indicates the continuation of the growth trend in the future. Also, according to available data, it can be seen that cities and towns in the vicinity of Zagreb recorded a large number of BEVs (13% of BEVs in 2020 were registered in Zagreb County) [72].
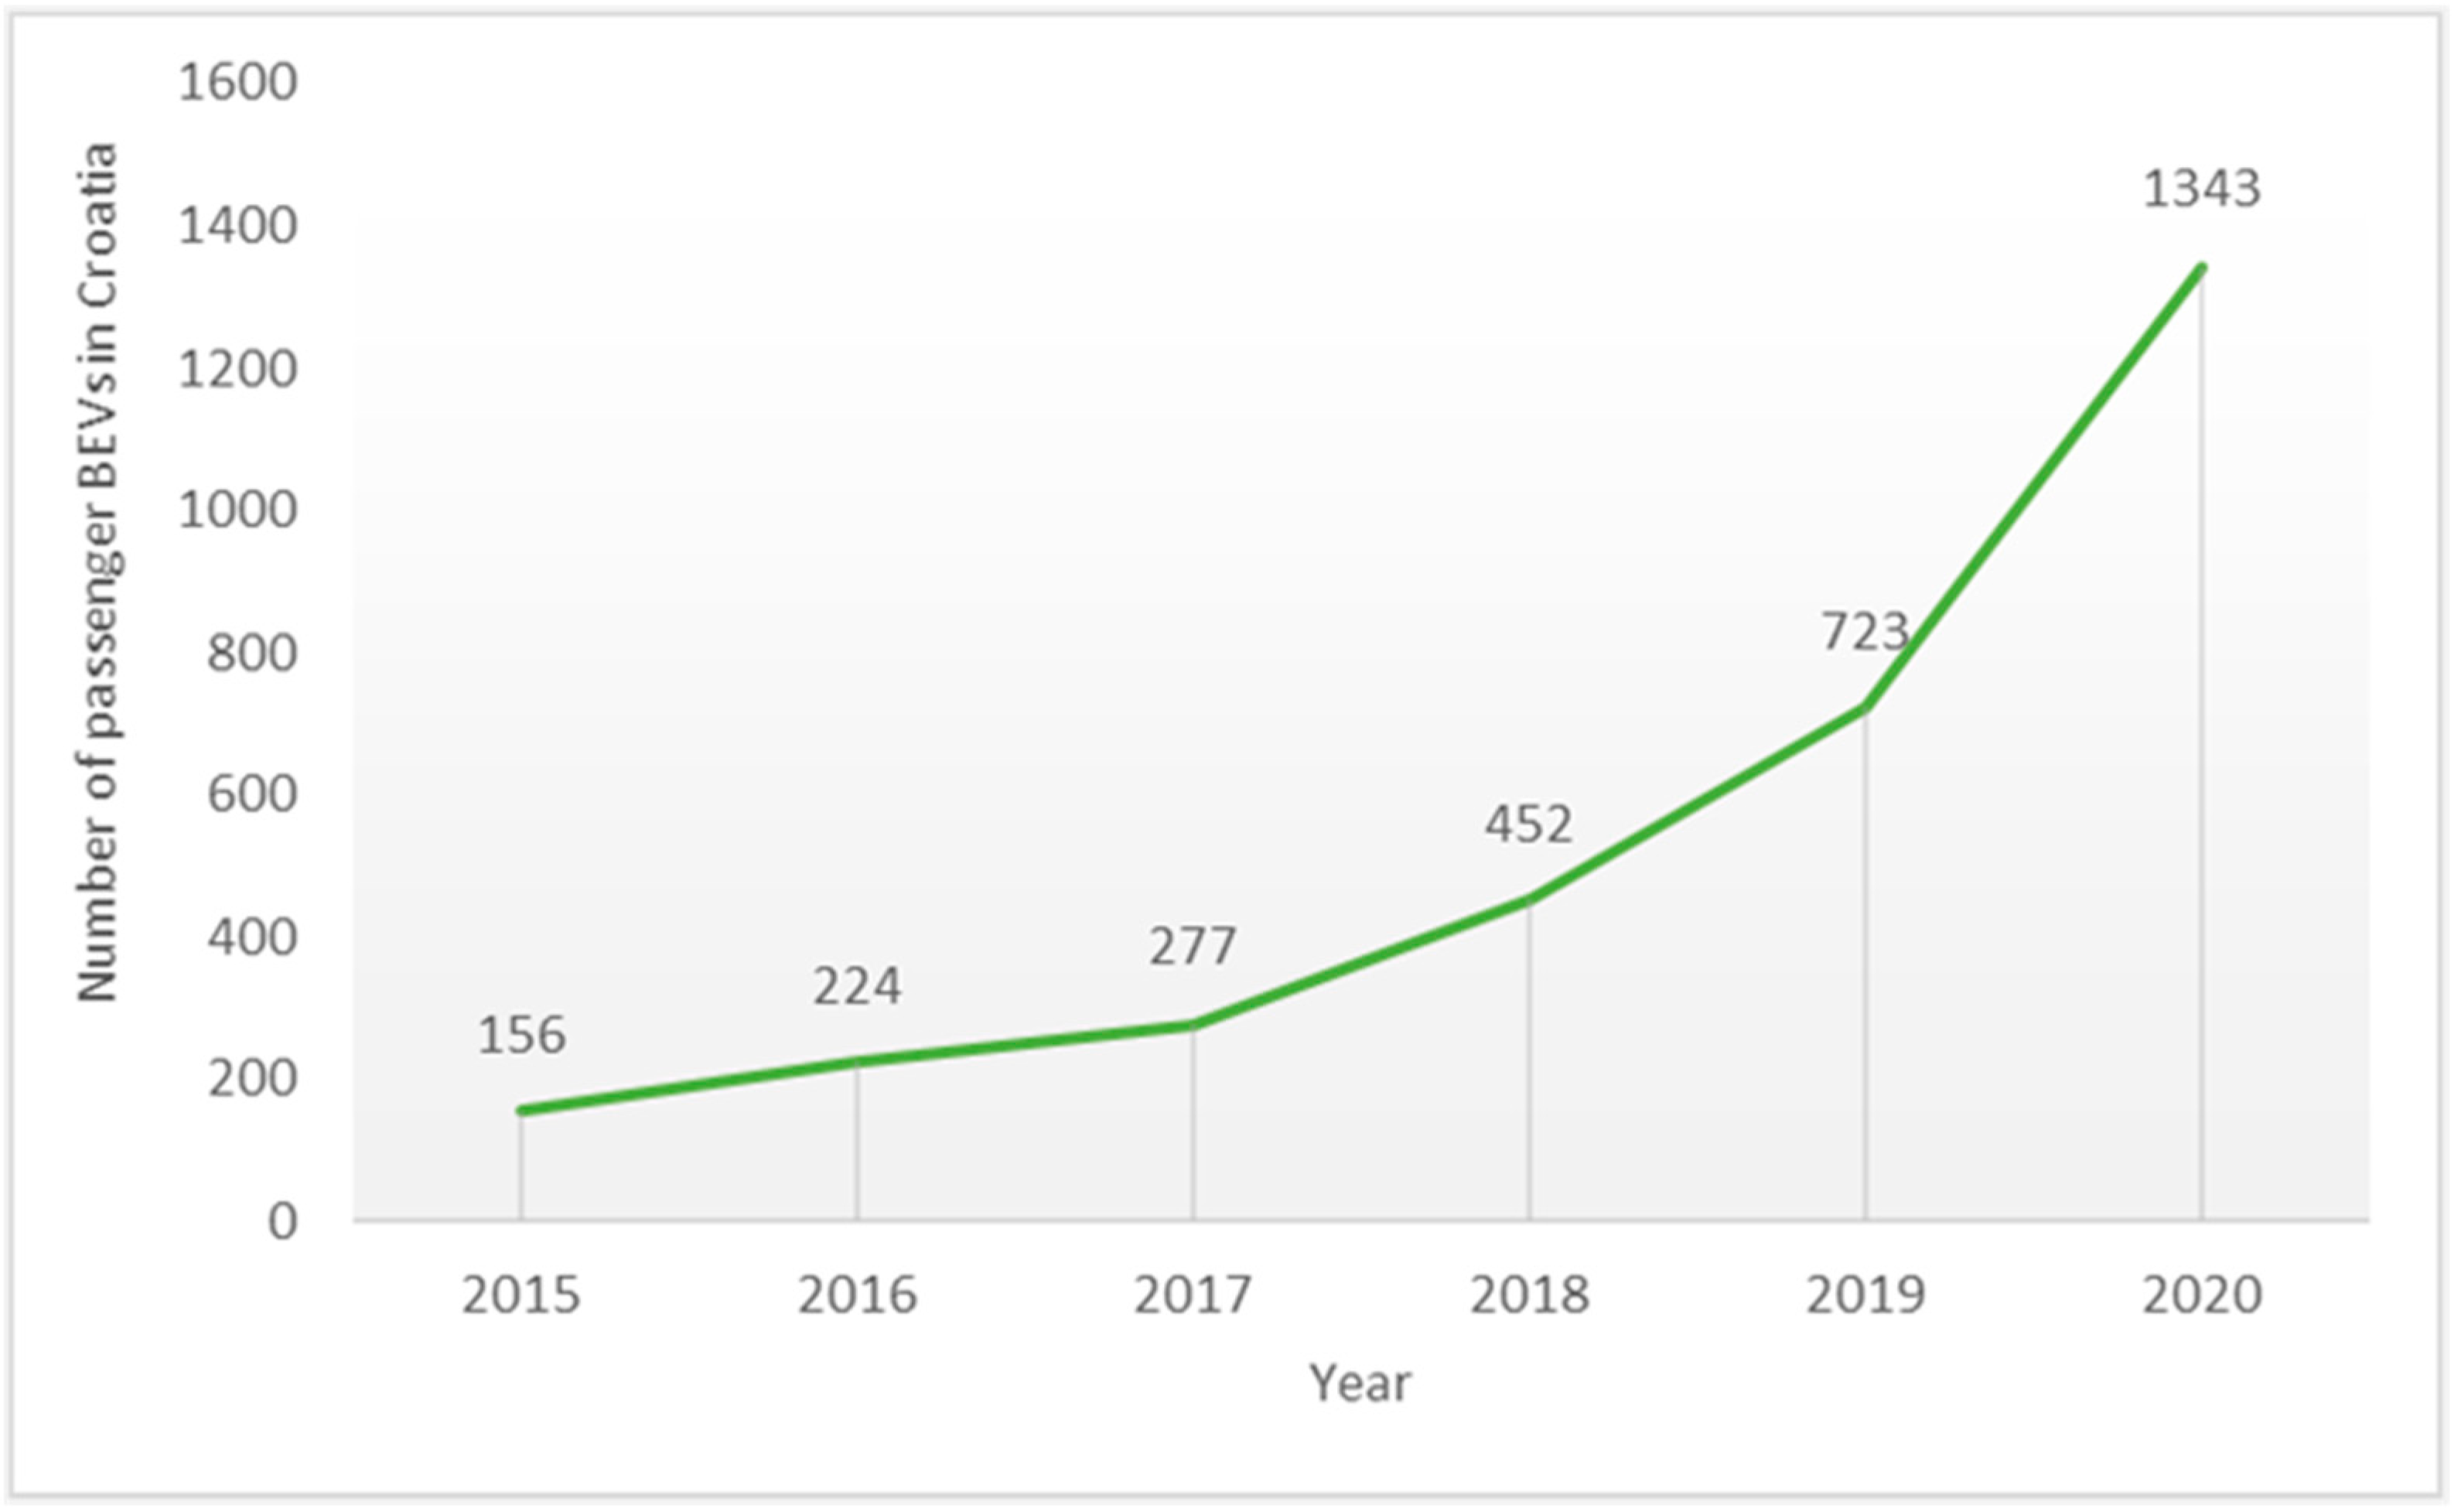
Statistical data on the number of electric vehicles in Croatia has been available since 2007 when the first passenger BEV was recorded [70,73]. Figure 3 shows the number of passenger BEVs in Croatia by years starting in 2015. As shown in Figure 3, 156 passenger BEVs were recorded in 2015, while in 2020 the peak for the observed period was reached, with a total of 1343 registered passenger BEVs [70,73]. The conclusion is that the growth trend is constant every year and it is expected to increase in the future.
4.2. Distribution of Passenger BEVs by Manufacturer, Type and Model
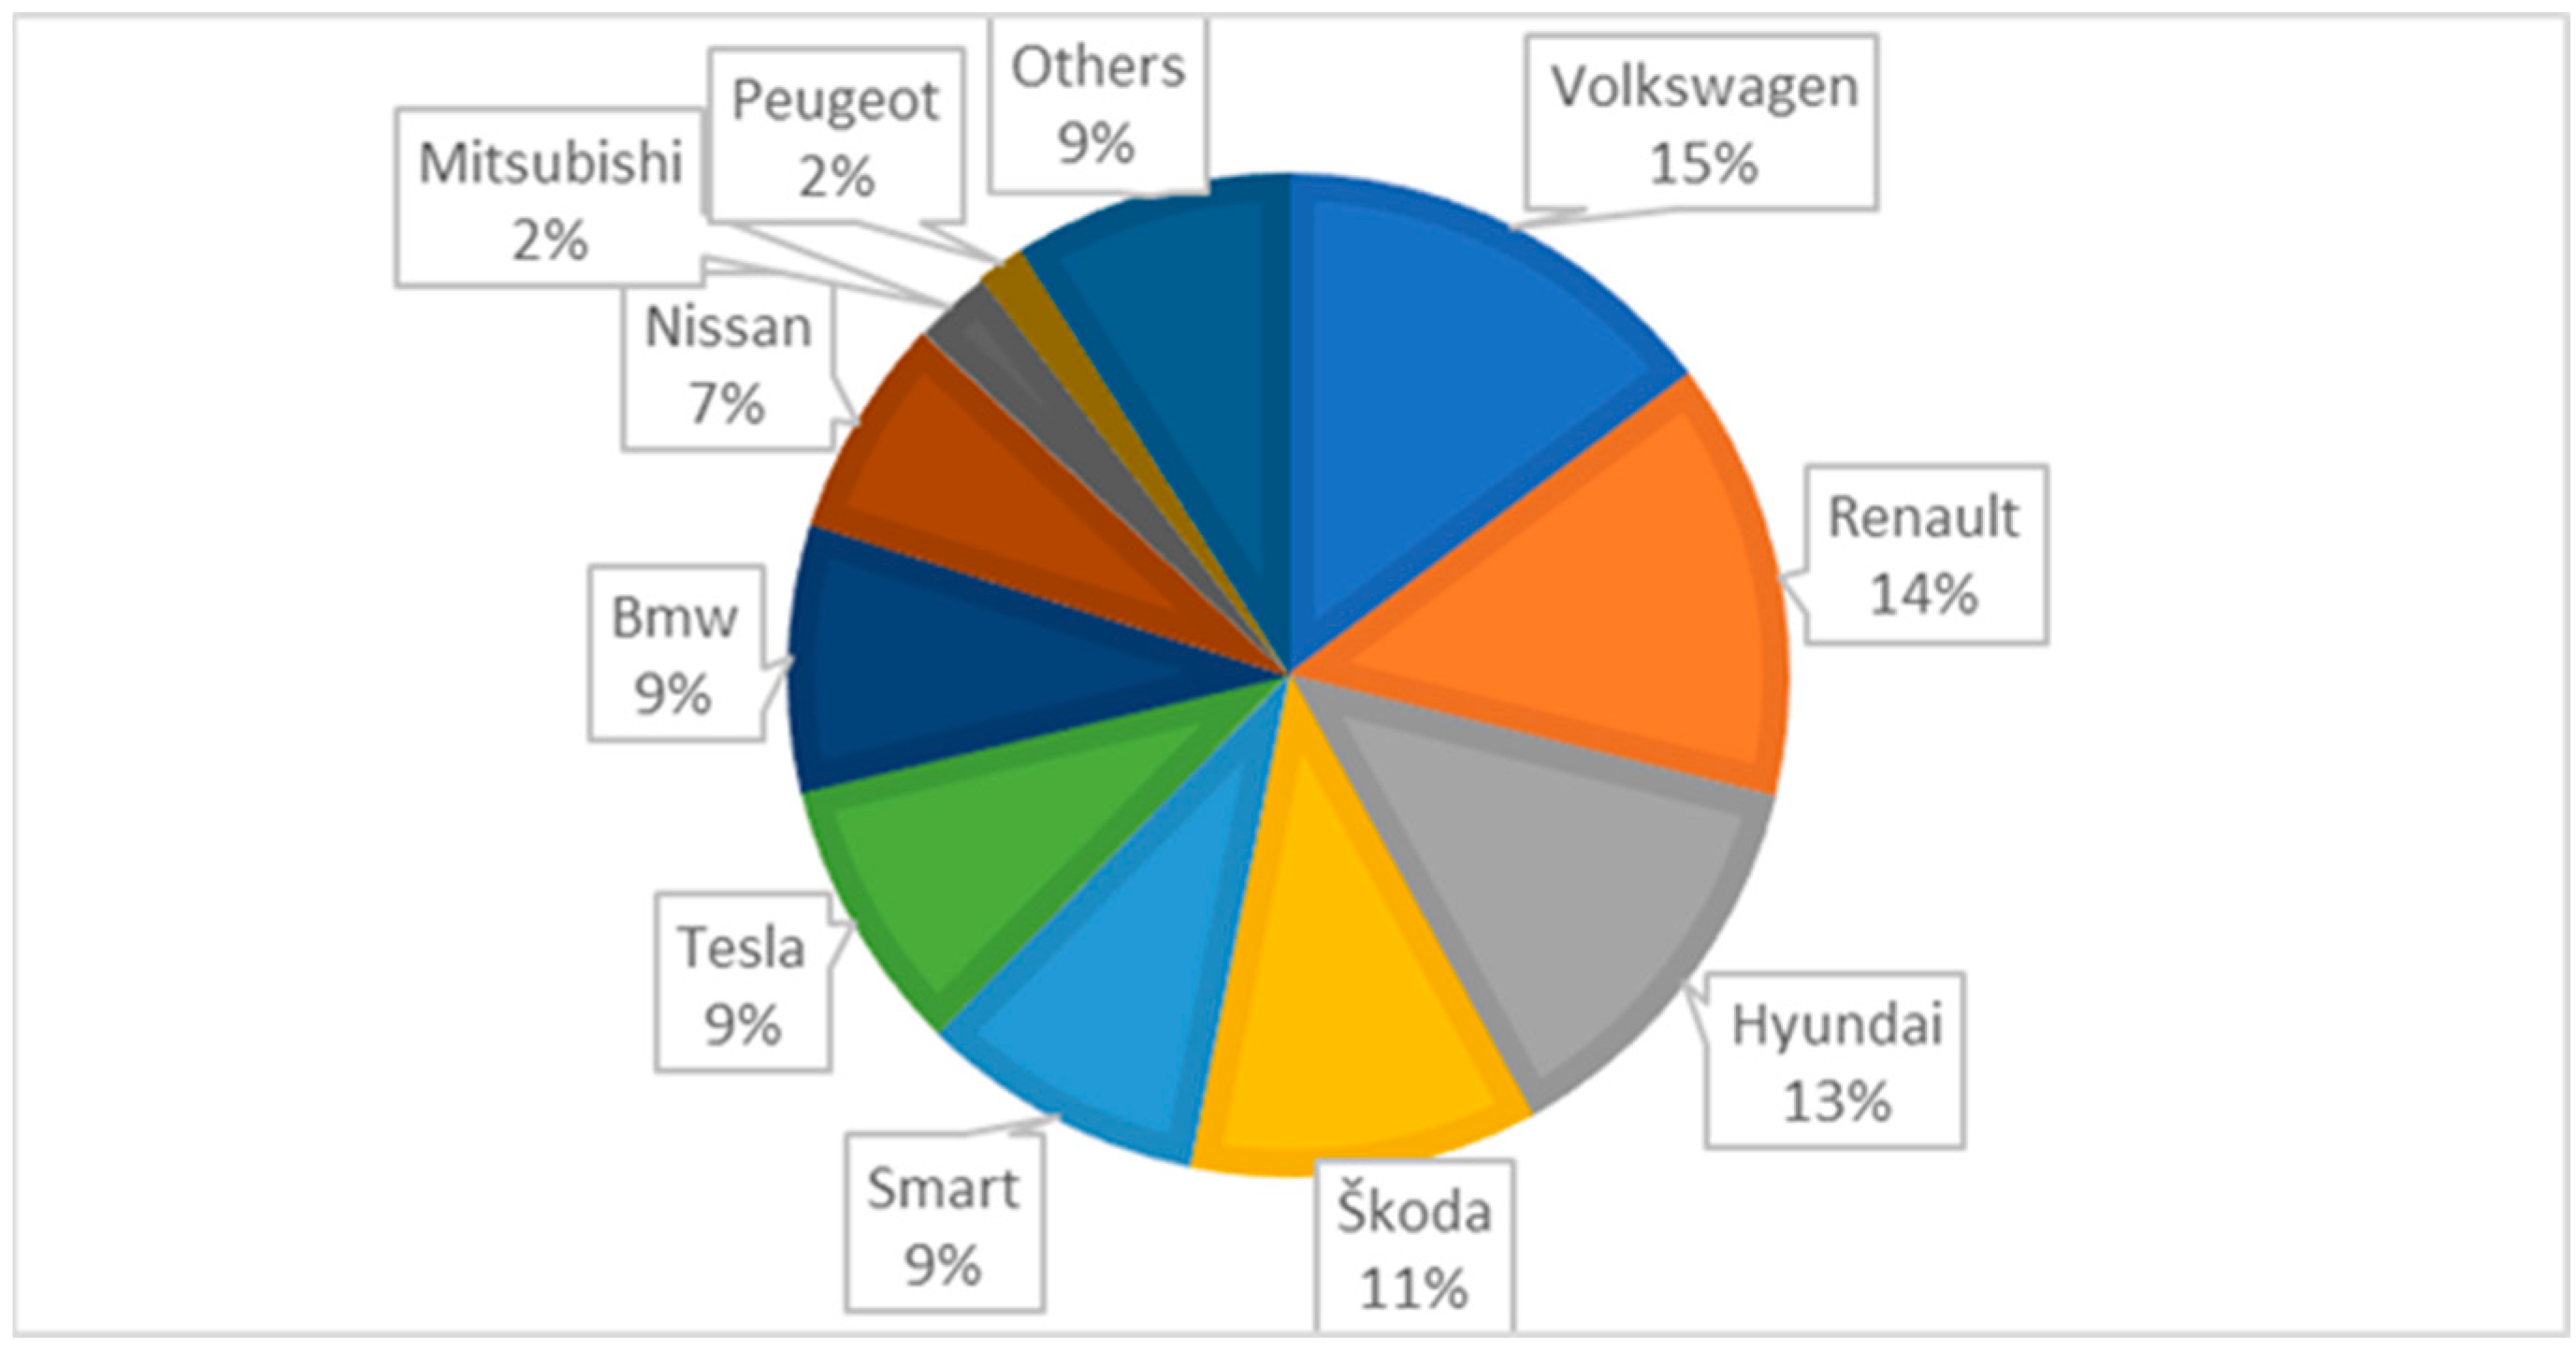
Data related to passenger BEVs by type and model refer to the available data for the last three years: 2018, 2019, and 2020. In this period in Croatia, the following brands of electric vehicles were present: Alfa Romeo, Audi, BMW, Citroen, Daewoo, DOK-ING, Fiat, Ford, Honda, Hyundai, JAC, Jaguar, Jeep, Kia, Mazda, Mercedes, MG, Mini, Mitsubishi, Nissan, Opel, Peugeot, Porsche, Rariro, Renault, Smart, Škoda, Taiqi, Tesla, Toyota, Trabant, Volkswagen, Yatian, and Zastava [72]. In 2018, most of the passenger BEVs were Volkswagen brand, where out of 132 vehicles, 46 were of the UP! model, the E-UP!. In 2019, out of 723 passenger BEVs, 146 vehicles were of the Volkswagen brand, with the most E-golf and E-UP models, each model with 26 BEVs. In 2020, out of 1343 passenger BEVs, 198 were Volkswagen, and 32 were model E-golf [72]. It was followed by the Renault brand, where out of 190, the Zoe type had the largest share of 33 vehicles. It was followed by the Hyundai brand, where there were 176 vehicles, of which 30 were Kona models. The share of passenger BEVs shown in Figure 4 concludes that in 2020 the Volkswagen brand predominated, with 15% of registered vehicles, followed by Renault (14%), Hyundai (13%), and Škoda (11%), while Smart, Tesla, and BMW had a total share of 9% each. All other brands had a total share of 9% [72].
4.3. Technical Support
As a part of technical support, the technical inspection, services, homologation, and conversion of ICEV to BEV were analysed.
The technical inspection of a passenger BEV begins after the vehicle registration with identification via the VIN mark and registration plate. Furthermore, as with other vehicles, it is checked in the following order: steering, braking, lighting and light signalling devices, devices providing average visibility, self-supporting bodywork, chassis and other parts, axles, wheels, tires and suspension, motor, electrical devices and installations, transmission mechanism, control and signalling devices, the device for connecting traction and trailer vehicles, vehicle equipment, and other devices and parts of the vehicle. The only significant difference in the technical inspection of a passenger BEV and any vehicle is that an eco-test is not performed because such vehicles are not subject to such testing and verification. Electric vehicles have many cables and high-voltage cables marked in orange and located inside the engine compartment. Such high-voltage cables and other cables can only be inspected visually without touching them, as there is a risk of electric shock and death [73]. If the high-voltage cables are visibly damaged, cracked, or uninsulated, or not securely fastened, such a vehicle must be declared technically defective.
In Croatia, authorized service for passenger BEVs is planned for the Tesla brand, located in Zagreb as part of the sales centre [74]. For other BEVs, repairs and services are performed in the existing authorized services of certain brands that specialize not only in electric vehicles but also in internal combustion engine vehicles.
Data related to vehicle homologation or conformity assessment of vehicles, as part of the import of vehicles from other countries, refer to 2014 to 2020. In that period, there were 530 passenger BEVs that underwent the conformity assessment procedure. The most significant number of vehicles refers to the Tesla brand—124 passenger BEVs—followed by BMW—100; Smart—100; Renault—55; and others. The most significant number of vehicles for which the conformity assessment procedure was conducted in Croatia were from Germany, with 216 passenger BEVs [72].
According to Croatian legislation, converting vehicles with internal combustion engines into vehicles with electric motors as propulsion unit is possible and permitted. A professional organization—the Center for Vehicles of Croatia—performs testing, following the Ordinance on Vehicle Testing (The People’s Newspaper 152/09 and 8/15) and other regulations applicable in this area. The basic regulations applicable to such vehicle conversion are the Road Traffic Safety Act [75], the Ordinance on Technical Conditions of Vehicles in Road Traffic [76], and the Ordinance on Vehicle Testing [77].
According to the available data from 2010 to 2020, 63 vehicle-testing procedures were conducted. The most were recorded in 2011, with 11 test procedures, and 12 test procedures for the conversion of ICEV in BEV in 2012 [72].
4.4. Technical Barriers of BEVs in Croatia
Obstacles detected in passenger BEVs presented in this paper relate to errors according to individual vehicle assemblies. During a technical inspection of passenger BEVs from 2013 to 2020, the following vehicle assemblies were inspected [72]:
- electrical devices and installations;
- control and signalling devices;
- engine, vehicle equipment, axles, wheels, tires, and suspension;
- other devices and parts of vehicles;
- transmission mechanism;
- self-supporting body, chassis, and other parts;
- coupling and towing vehicle connection;
- braking device;
- devices that allow average visibility;
- lighting and light signalling devices;
- steering devices.
Furthermore, according to the mentioned assemblies, the total number of observed deficiencies on passenger BEVs was 321, of which 82 were on braking devices; 79 on lighting and light signalling devices; 63 deficiencies were related to the axle, wheel, and tire assemblies, and suspension; and 38 on vehicle equipment. Afterward, 23 faults were found on the self-supporting body, chassis, and other parts, and 13 were identified on the steering assembly. The number of defects on the devices that enable average visibility was 12. Other assemblies had less than three faults [72].
4.5. Charging Stations for EVs in Croatia
There are three primary ways to charge an EV: plug-in charging, battery swapping, and wireless charging. Four charging modes via plug-in charging are available. They involve different combinations of power levels supplied by the charging station (expressed in kW), electric current used (AC or DC), and plug types. The charging time depends on charging technology and varies from 10 min to several hours [78].
The number of charging stations for electric vehicles in Croatia was 670 in 2020 [79]. There were only 68 charging stations in 2015, so a significant increase is represented and a step forward when adopting electric vehicles [79]. The most significant number of charging stations is located in the City of Zagreb, which is in line with the largest number of electric vehicles. Apart from the capital, the surroundings of Zagreb and larger cities have a more significant number of charging stations. In contrast, the rest of the country has just enough charging stations to drive throughout Croatia without fear that the vehicle will not reach the range from one charging station to another [80,81]. Croatia has 16.4 charging stations per 100,000 inhabitants, making it the twentieth country in the EU. There are 2 EVs per charging station which is the lowest number together with Slovakia compared to the rest of the observed countries.
The number of charging stations in the Member States of the European Union is not uniform concerning the number of BEVs. The Netherlands had the most significant number of charging stations in 2020—66,665—and also has the highest number of charging stations per 100,000 inhabitants [82].
When it comes to infrastructure facilities intended for electric vehicles, it is not only the data related to charging stations that are important. Namely, several additional contents must be met for the charging stations to be functional. It is also essential to consider the best locations for charging stations, the types of chargers, the number of available places, and charging times, whether fast charging or standard. From the time point of view, there are several forms of charging electric vehicles, so it is necessary to consider the accompanying facilities available at the charging stations’ locations, as waiting for a vehicle to charge can be monotonous for users and can cause discomfort and impact the driver’s psychological state. It is also necessary to pay attention to the operating instructions when charging electric vehicles, the driver’s information about charging cards, and the types of chargers and charging stations.
4.6. Instruments for Promoting BEV Adoption in Croatia
To promote the use of electric vehicles, the Croatia government launched a project to co-finance the purchase of energy-efficient vehicles. In addition, some of the stakeholders offer free charging stations, free public parking, and priority parking.
- (a)
- Electric vehicle co-financing program in Croatia
One of the key measures to promote energy efficiency in transport is to encourage energy-efficient vehicles. CO2 emissions in total domestic traffic amount to about 5.6 million tons, of which road transport accounts for almost 3 million tons [83]. The average passenger car in Croatia emits about 3 tons of CO2 per year. A hybrid vehicle emits 1 ton of CO2 per year, while BEVs emit zero and do not pollute the environment with noise [84]. To encourage cleaner transport and reduce air pollution in Croatia, in 2014 the project Driving Economically was launched. Citizens and companies are awarded grants to purchase energy-efficient vehicles with this project. From 2014 to 2020, the Fund for Environmental Protection and Energy Efficiency co-financed purchasing more than 4500 energy-efficient vehicles with HRK 153 million (EUR 20.4 million) [84]. There were only 13 electric vehicles in Croatia in 2012, while 1343 were registered in 2020. The Environmental Protection and Energy Efficiency Fund provided HRK 105 million (EUR 14 million) in 2021 to co-finance the purchase of energy-efficient vehicles—HRK 90 million (EUR 12 million) for private and legal persons and HRK 15 million (EUR 2 million) for the public sector [84]. The purchase was co-financed with up to 40% per vehicle, while the maximum incentives depended on the vehicle’s category [84].
- (b) Free charging stations for electric vehicles in Croatia
The charging service in Croatia is currently provided by Croatian Telecom and HEP, which give access to the most publicly available charging stations. It is to be expected that with the development of the electric mobility market in Croatia, new providers of electric vehicle-charging services will start to appear [85]. Regarding the charging stations of Croatian Telecom, there are two types of charging stations, considering how they are used. The first includes charging stations that do not require user identification. Charging station operators and service providers can easily choose different charging methods, which are not related to customer identification. Currently, charging is free at most publicly available charging stations. However, it is expected that with the emergence of a sufficient number of charging stations that can be conveniently accessed, their growing number will create preconditions for the introduction of commercial bases for the provision of charging services. The second type includes charging stations where user identification is required, which enables advanced services, such as real-time monitoring of the charging process and the possibility of booking the selected charging station. Identification is also needed to prevent unauthorized access to the bottling plant and allow easy payment for the charging service [85].
A list of charging stations is available on which charging must be paid [86]. The payment unit is in minutes and kWh, and prices are expressed in monetary currency (HRK—Croatian kuna). According to the locations and types of charging connections for vehicles, the minimum payment amount is HRK 0.15 (EUR 0.02) per minute, while the maximum amount is HRK 2.84 (EUR 0.38) per kWh. There are also other amounts, such as HRK 2.44 (EUR 0.33) per kWh, HRK 2.20 (EUR 0.30) per kWh, HRK 1.78 (EUR 0.24) per kWh, HRK 1.06 (EUR 0.14) per minute, HRK 1.95 (EUR 0.26) per kWh, HRK 2.60 (EUR 3.47) per kWh, HRK 0.30 (EUR 0.04) per minute, HRK 1.66 (EUR 0.22) per kWh, and HRK 2.50 (EUR 0.33) per kWh [86] (1 EUR = 7.5 HRK).
4.7. Social Aspect
To determine what is the most important factor for buyers to decide to buy and use a BEV, we surveyed current BEV users about their opinion of the most important influential factors when buying/choosing a passenger BEV. The survey consisted of the two basic questions as follows:
- When buying/choosing an electric vehicle, which of the two factors is more important to you: (a) Battery and everything related to battery charging (range, capacity, charging time, location of charging port); or (b) Costs (vehicle price, vehicle equipment, maintenance costs, vehicle insurance)?
- If you think there are other important influential factors when buying/choosing a passenger BEV, please write them down.
In the first question, we offered only two answers (battery and costs) because previous research described in Chapter 2 [21,22,23,24,25,26,27,28,29,30,31] has shown that these factors are the most important for potential buyers when buying a BEV. With the second open-ended question, we wanted to get the opinions of current users on other parameters relevant to the purchase of BEVs.
To easier find the current users and owners of BEVs, the survey was conducted with the help of the “Circuit” association, which brings together Croatian BEV owners. A survey was conducted on a sample of 175 respondents, already BEV users in Croatia; of these, 174 responded to the survey.
Regarding the first question, the survey results show that for 59% of respondents, battery and everything related to battery charging are the most important, while 41% of respondents chose the cost as a more relevant factor. Since the second question was open-ended, the answers were not unified, and therefore were more complex to process. We have structured them into four categories, according to content as follows:
- Batteries (battery life, price of battery replacement, warranty after battery replacement, recycling of vehicle battery and cost of battery replacement).
- Charging stations (number of available chargers, the possibility of charging at home, control of charging and air conditioning with a mobile phone, offer cheap portable chargers, charging price, charging station network, solar charging, charging power and number of possible charges).
- Other technical-technological influence factors (design, comfort, quality of workmanship, available vehicle colours, vehicle interior, larger luggage space in the vehicle and cable storage, availability and prevalence of services, mobile Internet inside the vehicle).
- Economic influence factors (road toll, battery and car warranty, the possibility of financing through leasing or credit, incentives when buying an electric vehicle throughout the year, free membership fee in associations for electric vehicles and free rides for vehicle buyers for several months).
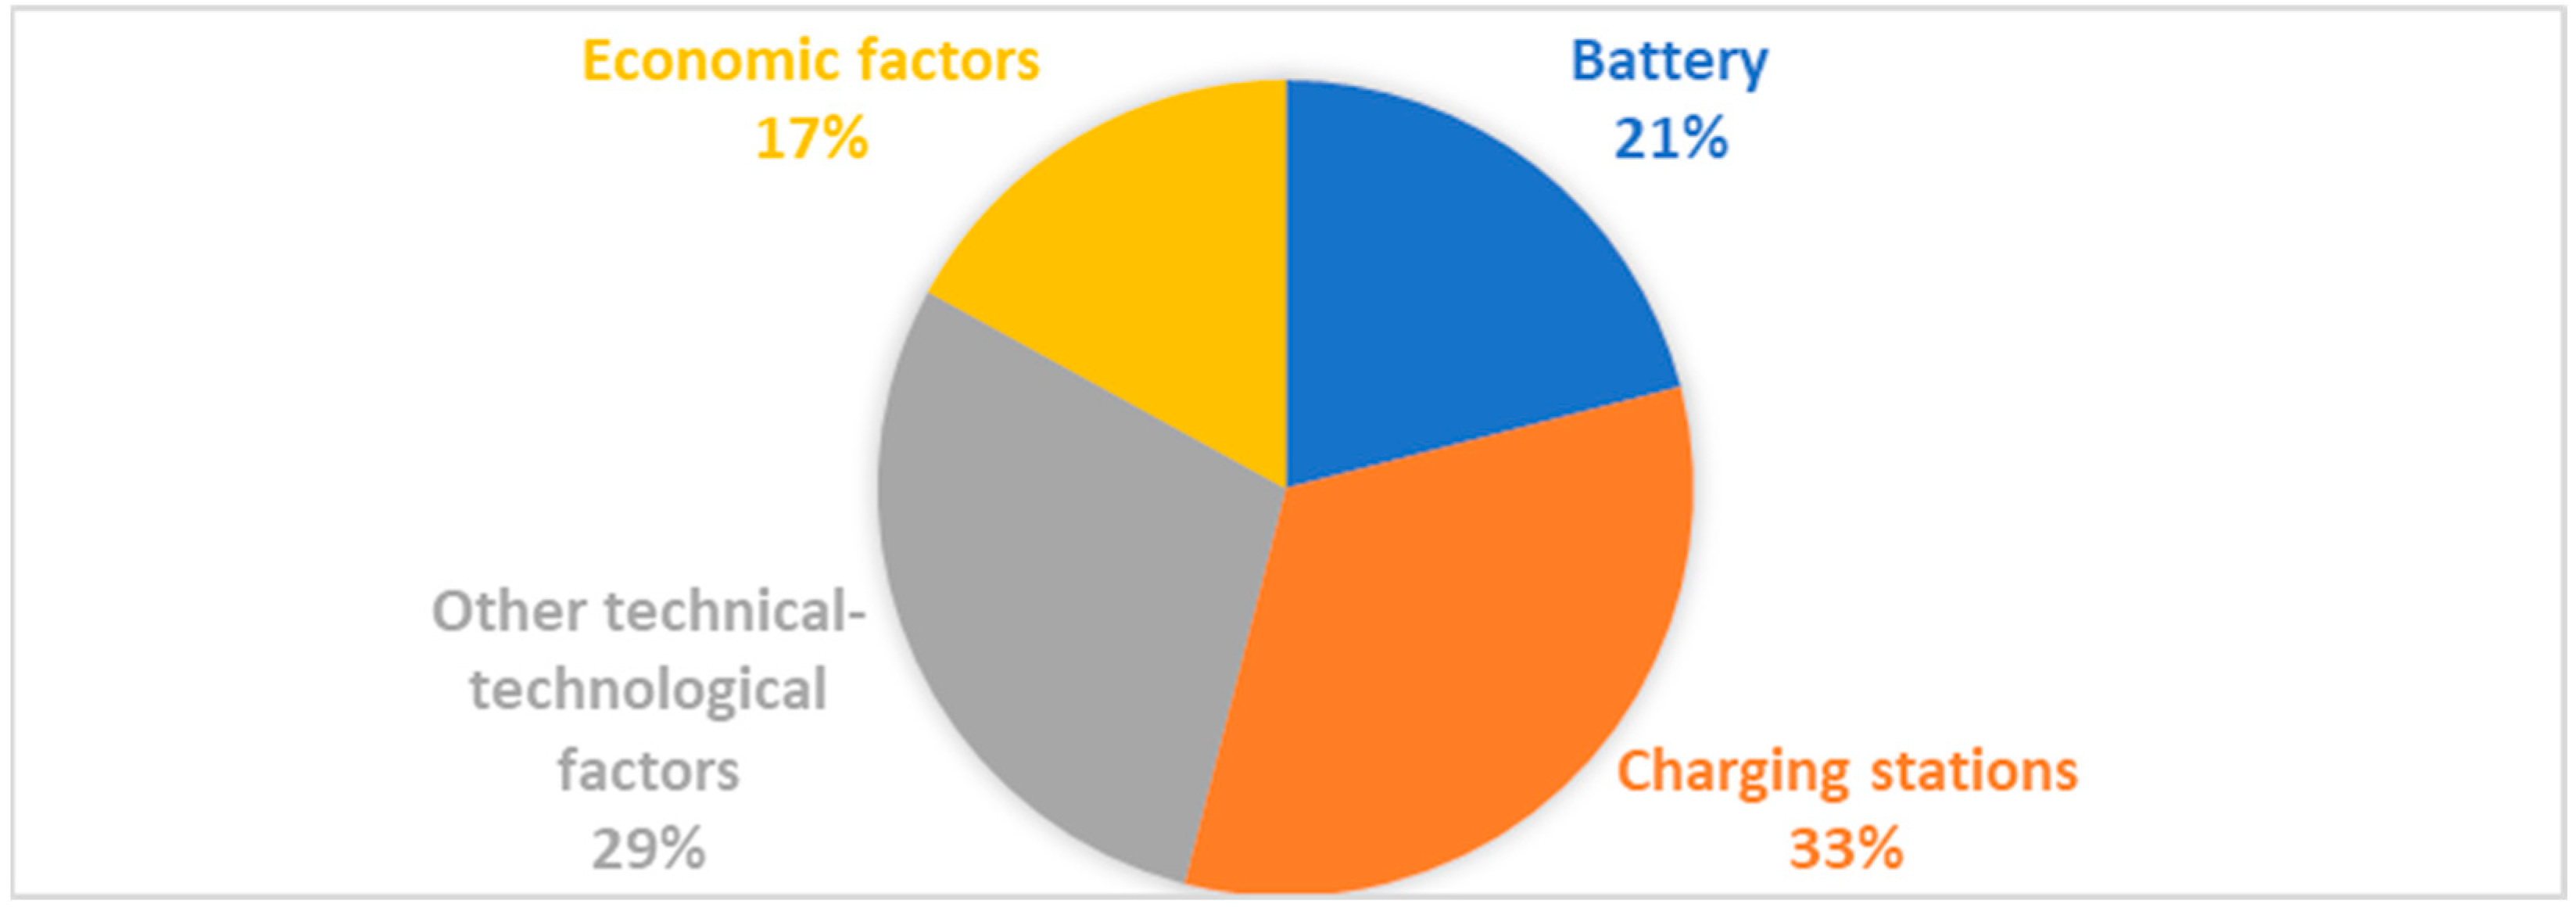
Figure 5 shows the results from the categorized data: 33% of respondents pointed out the network of public charging stations as the most important influencing factor; 21% refer to batteries, with battery life as the main factor; 29% concerned other technical and technological factors; and cost as an influencing factor is related to 17% answers. These results show that the technical-technological influencing factors (83%) are still more important for users than cost.
5. Discussion
The current situation of electric mobility in the form of electric vehicles indicates improvements and positive growth trends, which is a big step forward for a small country. The first available data for passenger BEVs in Croatia was in 2007, when one vehicle was present. Since 2010, exponential growth has begun, culminating in 2020 with 1343 passenger BEVs. Observing the spatial distribution, it can be concluded that in 2020 the most significant number (42%) of passenger BEVs was registered in the City of Zagreb, which is 70 vehicles per 100,000 inhabitants. Zagreb County had 13% passenger BEVs in the same year, which is a consequence of gravity towards Zagreb and the available infrastructure needed for the uninterrupted use of BEVs. Passenger BEVs are spread over 73 cities in Croatia. The growth trend is visible through each observed year, which indicates the continuation of the same growth trend in the future. Regarding the distribution of passenger BEVs by manufacturer, type, and model in the last three years of available data, every year the Volkswagen brand was in the lead, accounting for 15% in 2020, mostly E-Golf and E-UP, followed by Renault, Hyundai, Škoda, Smart, Tesla, BMW, and others. From 2014 to 2020, 530 passenger BEVs were imported into Croatia, of which 216 vehicles were from Germany. The most significant number of all imported vehicles was the Tesla brand—124 passenger BEVs—followed by 100 BMW BEVs, 100 Smart BEVs, and other brands. From 2010 to 2020, 63 ICEVs were converted into vehicles with an electric motor.
During the technical inspections of passenger BEVs from 2013 to 2020, 321 deficiencies were observed. In case of malfunction of the electric vehicle or breakdowns, inspection and service of the vehicle are performed by the authorized service centre of a particular vehicle manufacturer because there are no special services for electric vehicles. The stated lack of authorized services for electric vehicles is a possible reason for the lack of motivation of users toward BEVs. It results in fear of complications due to vehicle failure, and additional costs or prolonged waiting if service or parts procurement must be performed outside Croatia.
There were 670 charging stations for electric vehicles in Croatia in 2020, presenting 16.4 charging stations per 100,000 inhabitants. Compared to other EU member states, 19 have a larger number of inhabitants per one charging station than Croatia. One charging station services two passenger BEVs; that puts Croatia at the bottom of the EU regarding the number of vehicles per charging station. Currently, the ratio of charging stations to electric vehicles does not create problems for electromobility. The problem in Croatia is the spatial dispersion of charging stations. The most significant number of charging stations is located in Zagreb and its surroundings, which is in line with the largest number of electric vehicles. Croatia has many charging stations in larger cities, while charging stations in smaller places are rarely deployed. In order to prevent the vehicle from being too far to reach the charging station before the battery is discharged, pre-planning is necessary. From a time point of view, charging may take longer or shorter depending on the type of charger, so it is necessary to provide users with additional content while waiting.
In Croatia, the population is mainly focused on passenger ICEVs. It is challenging to change the consciousness of drivers when it comes to switching to environmentally-friendly vehicles. The age of the vehicle fleet also presents a problem, and for passenger vehicles it was almost 13 years in 2020 [71]. From 2014 to 2020, the Fund for Environmental Protection and Energy Efficiency co-financed purchasing more than 4500 energy-efficient vehicles. Given the constant growth in the number of personal BEVs in Croatia, the positive effect of this measure to encourage more BEV purchases can be seen. The purchase is co-financed with up to 40% per vehicle. Furthermore, charging at public charging stations is still free, significantly reducing variable costs and encouraging the transition to BEVs.
An analysis of the influential factors in purchasing and selecting BEVs in Croatia, presented in the survey, concludes that the technical-technological factor is most important for users or potential buyers of passenger BEVs. The most significant number of respondents highlighted the public charging station network as the most important influencing factor, together with the battery life factor and the vehicle design.
The range of electric vehicles belongs to technical-technological factors and represents the most significant barrier for users and potential customers. The best-selling electric vehicles in Croatia in 2020 were from VW, Renault, and Hyundai. An example of a journey from the capital Zagreb to the following largest cities of Rijeka, Osijek, and Split, and to Dubrovnik, which is taken as the farthest point from Zagreb, is presented for two models of BEV. The distance from Zagreb to Rijeka is 161 km, and the travel time is 1 h and 58 min [87]. It is 283 km from Zagreb to Osijek, with 2 h and 41 min [88]. The route length for Zagreb–Split is 411 km, and the travel time is 5 h and 22 min [89]. The last route shown is Zagreb–Dubrovnik, with a distance of 600 km and a duration of 7 h and 46 min [90]. The distances indicate one direction, using highways where possible. The first vehicle type used in the example is the E-GOLF, the best-selling VW BEV type in 2020. Its electric range is 190 km, the time required for charging from 0 km to 190 km is 5 h and 15 min at a charging speed of 36 km/h, or 36 min from 19 km to 152 km if it is a fast charge (220 km/h) [91]. Based on known data on travel time and distance to selected cities in Croatia, only the city of Rijeka can be reached by the chosen vehicle without charging because the distance is 161 km and the vehicle’s electric range is 190 km. Traveling to the city of Osijek requires one stop at the charging station for charging; that prolongs the trip by an additional 36 min in case of fast charging, or 5 h and 15 min for slow charging, while on the section Zagreb–Split the driver has to stop twice to charge the battery. The most distant selected city is Dubrovnik, and on the way from Zagreb, it is necessary to stop at the charging stations three times considering the distance of 600 km. The use of a fast charger extends the trip for 108 min, but if a slow charger is used, the journey is extended to a total of 23 h and 31 min—almost one day. A large amount of travel time can be seen in the example of traveling with E-GOLF for all routes, except to Rijeka.
The second type of vehicle is the Hyundai, type KONA, which has the best technical characteristics, emphasizing the range in the three best-selling BEV brands in Croatia in 2020. This vehicle has a range of 395 km, with a charging time of 7 h from 0 km to 395 km at a charging speed of 58 km/h, and a speed of 370 km/h in the case of fast charging (44 min from 40 km to 316) [92]. It is more reliable and easier to travel with the Hyundai KONA on routes Zagreb–Rijeka and Zagreb–Osijek. The remaining routes, Zagreb–Split and Zagreb–Dubrovnik, require one stop at charging stations, which indicates the importance of range in electric vehicles. With a range of 395 km, it is easier to overcome long distances and reach the desired destinations. However, when standing at charging stations, there are repeated problems with the waiting time for charging, which is 7 h for the Hyundai KONA to be fully charged (0–395 km) or 44 min of fast charging for 319 km. Travel and use of BEVs in Zagreb and its surroundings is acceptable due to the best investment and development of infrastructure and a quality network of charging stations. Traveling longer distances is still highly questionable due to the insufficient growth of charging stations and the long time required to charge vehicles. The largest number of charging stations is located in Zagreb and its surroundings, while other large cities have a smaller number of charging stations. In other parts of Croatia, very few charging stations make it difficult to travel by electric vehicles. The uneven distribution of charging stations creates a significant problem during the tourist season because charging stations on routes to the coast are congested, so charging time is added to the duration of the trip and time spent in the charging queue. Therefore, it is necessary to set up a denser network of charging stations at resorts and gas stations on motorways, where electric vehicles often travel long distances. A major problem identified during the study of BEVs in Croatia and other countries is the unavailability of data and a large number of sources that are not harmonized. It applies, for example, to the number of BEVs and the number of charging stations, which is a limitation in research; however, the harmonization of statistical databases is a space for future research.
6. Conclusions
Climate change is a crucial issue today, and it is needed to work accordingly to reduce the negative impacts of transport on people and the environment. Electromobility is a turning point towards a sustainable transport system. Many influential factors need to be met to ensure the most effortless transition to electric vehicles in road transport. According to previous research and our research in this study, technical-technological factors provide the most room for improving and increasing the competitiveness of electric vehicles, primarily in the batteries segment, which includes the production and high costs, service life, and disposal of unusable batteries. Then comes systematic development and increases in the number of charging stations for electric vehicles in different locations, to allow uninterrupted movement of electric vehicles regardless of the range of an individual vehicle and the duration of charging. The most significant barrier for users and potential customers is range and range anxiety, which can be solved with further investments that can influence the development of batteries and charging networks. Along with economic factors, the high vehicle prices and maintenance prices present a significant problem.
From only 13 personal BEVs in 2012 to 1343 vehicles in 2020, Croatia has shown significant progress in accepting passenger BEVs, influenced by policy instruments for promoting BEV adoption in Croatia. In 2020, the number of charging stations with two vehicles per station was sufficient, while the spatial dispersion is problematic because road sections in Croatia have a minimal number of charging stations. In addition to existing measures, which include a larger number of charging stations and their proper deployment throughout Croatia, further requirements are better marketing, development of service networks and service workshops for electric vehicles, education of persons involved in the maintenance of BEVs, and development of technology for disposal and storage of electric batteries. More BEV services and parts would certainly positively impact customer attitudes.
In the Republic of Croatia, the population’s distrust of new technologies and electromobility represents a problem; therefore, the education and awareness of users and potential buyers of electric vehicles are important. Residents are not sufficiently acquainted with the advantages of BEV, charging types, the spread of the network of charging stations, and the range required to move freely throughout the territory of the Republic of Croatia. The number of users and buyers of passenger BEVs primarily depends on the purchasing power of residents. Given the low purchasing power of the Croatian population, it can be concluded that little or no fuel costs can be a significant factor in the transition from ICEV to BEV. However, given the high cost of buying vehicles and possible services and repairs that are also expensive, the likelihood is that some users will be insufficiently motivated to purchase an electric vehicle. Given also the age of the vehicle fleet in the Republic of Croatia, it can be concluded that the majority are used vehicles for which there are still no subsidies, and with subsidies for the new BEVs, many citizens cannot afford such investments. We propose the following measures that can increase the number of passenger BEVs in Croatia: more frequent co-financing of the purchase of electric vehicles (implementation of co-financing several times a year compared to the current one where the most significant incentives are given to companies) and co-financing and incentives for the purchase of used electric vehicles of a certain age (as not all Croatian citizens are able to buy new electric vehicles, perhaps increasing the share of BEVs among passenger cars could be acted upon by encouraging imports and imports of used electric vehicles from other countries); to direct incentives to parts of Croatia with fewer BEVs; adjusting the prices of electric vehicles in accordance with the purchasing power of citizens in Croatia; reducing tolls for electric vehicle users; abolishing environmental fees and lower registration costs for electric vehicle users; reducing customs, duties, imports, and inputs of electric vehicles in the territory of Croatia, which are a problem when buying vehicles in general; and the abolition of various levies related to vehicles in Croatia in general. An overview of the effectiveness of measures in the countries with the highest number of BEVs (Norway, France and Germany) is given in Section 2.2. It can be seen that measures to co-finance the purchase of BEVs and exemption from taxes or registration are very effective, so we believe that developing a package of measures to encourage electromobility would positively impact the adoption of BEVs in Croatia.
Author Contributions
Conceptualization, M.E., M.J. and D.B.; methodology, D.B.; software, M.E., M.J. and D.B.; validation, M.E., M.J. and D.B.; formal analysis, M.E. and M.J.; investigation, M.E. and M.J.; resources, M.E., M.J. and D.B.; data curation, M.E.; writing—original draft preparation, M.E. and M.J.; writing—review and editing, D.B.; visualization, M.E., M.J. and D.B.; supervision, D.B.; project administration, M.E.; funding acquisition, M.J. and D.B. All authors have read and agreed to the published version of the manuscript.
Funding
This research received no external funding.
Institutional Review Board Statement
Not applicable.
Informed Consent Statement
Not applicable.
Data Availability Statement
Not applicable.
Conflicts of Interest
The authors declare no conflict of interest.
References
- Brown, S.; Pyke, D.; Steenhof, P. Electric vehicles: The role and importance of standards in an emerging market. Energy Policy 2010, 38, 3797–3806. [Google Scholar] [CrossRef]
- Kemp, R.; Blythe, Z.P.; Brace, C.J.; James, P.; Jones-Parry, R.; Thielens, D.; Thomas, M.; Wenham, R.; Urry, J. Electric Vehicles Charged with Potential; The Royal Academy of Engineering: London, UK, 2010. [Google Scholar]
- Dharmakheerthi, C.H.; Mithulananthan, N.; Saha, T. Overview of the impact of plug-in electric vehicles on the power grid. In Proceedings of the 2011 IEEE PES Innovative Smart Grid Technologies, Perth, WA, Australia, 13–16 November 2011; pp. 1–8. [Google Scholar]
- Sanden, B.A. System Perspectives on Electromobility, Chalmers University of Technology. 2017. Available online: http://www.chalmers.se/en/areas-of-advance/energy/publications-media/systems-perspectives/Pages/Systems-Perspectives-on-Electromobility.aspx (accessed on 18 August 2021).
- Dutta, P.; Boulanger, A.; Anderson, R.N.; Wu, L. An Innovative Approach to Vehicle Electrification for Smart Cities. In Handbook of Research on Social, Economic, and Environmental Sustainability in the Development of Smart Cities; IGI Global: Hershey, PA, USA, 2015; pp. 193–212. [Google Scholar]
- Roos, D. Does Hybrid Car Production Waste Offset Hybrid Benefits? HowStuffWorks. Available online: https://science.howstuffworks.com/science-vs-myth/everyday-myths/does-hybrid-car-production-waste-offset-hybrid-benefits.htm (accessed on 22 April 2021).
- Chan, C.C.; Chau, K.T. Modern Electric Vehicle Technology; Oxford University Press: Oxford, UK, 2001. [Google Scholar]
- Chau, K.T. Hybrid vehicle. In Alternative Fuels for Transportation; Ramadhas, A.S., Ed.; CRC Press: Boca Raton, FL, USA, 2010; pp. 361–391. [Google Scholar]
- Chau, K.T. Pure electric vehicles. In Alternative Fuels and Advanced Vehicle Technologies for Improved Environmental Performance: Towards Zero Carbon Transportation; Folkson, R., Ed.; Elsevier: Amsterdam, The Netherlands; Woodhead Publishing: Sawston, UK, 2014; pp. 655–684. [Google Scholar]
- Rao, Z.; Wang, S. A review of power battery thermal energy management. Renew. Sustain. Energy Rev. 2011, 15, 4554–4571. [Google Scholar] [CrossRef]
- Brunet, K.; Kotelnikova, A.; Ponssard, J. The Deployment of BEV and FCEV in 2015; Research Report; Department of Economics, Ecole Polytechnique, CNRS: Palaiseau, France, 2015. [Google Scholar]
- Gis, W.; Merkisz, J. The development status of electric (BEV) and hydrogen (FCEV) passenger cars park in the world and new research possibilities of these cars in real traffic conditions. Combust. Engines 2019, 178, 144–149. [Google Scholar] [CrossRef]
- The Fuel Cells & Hydrogen Observatory (FCHO). Available online: https://www.fchobservatory.eu/observatory/technology-and-market/net-number-of-fcev-net (accessed on 19 June 2022).
- Yong, Y.J.; Ramachandaramurthy, K.V.; Miao, K.T.; Mithulananthan, N. A review on the state of the art technologies of electric vehicles, its impact and prospects. Renew. Sustain. Energy Rev. 2015, 49, 365–385. [Google Scholar] [CrossRef]
- Eurostat. Available online: https://ec.europa.eu/eurostat/web/products-datasets/-/road_eqr_carpda (accessed on 7 May 2021).
- Biresselioglu, M.E.; Kaplan, M.D.; Yilmaz, B.K. Electric mobility in Europe: A comprehensive review of motivators and barriers in decision making processes. Transp. Res. Part A 2018, 109, 1–13. [Google Scholar] [CrossRef]
- European Commission: 2050 Long-Term Strategy. Available online: https://ec.europa.eu/clima/eu-action/climate-strategies-targets/2050-long-term-strategy_en (accessed on 7 May 2021).
- Statharas, S.; Siskos, P.M.; Zazias, G.; Capros, P. Factors Influencing Electric Vehicle Penetration in the EU by 2030: A Model-Based Policy Assessment. Energies 2019, 12, 2739. [Google Scholar] [CrossRef] [Green Version]
- Carley, S.; Krause, R.; Lane, B.; Graham, J. Intent to Purchase a Plug-In Electric Vehicle: A Survey of Early Impressions in Large US Cities. Transp. Res. Part D Transp. Environ. 2013, 18, 39–45. [Google Scholar] [CrossRef]
- Tesla. Available online: https://www.tesla.com/support/full-self-driving-computer (accessed on 19 June 2022).
- Egbue, O.; Long, S. Barriers to widespread adoption of electric vehicles: An analysis of consumer attitudes and perceptions. Energy Policy 2012, 48, 717–729. [Google Scholar] [CrossRef]
- Weldon, P.; Morrissey, P.; O’Mahony, M. Long-Term Cost of Ownership Comparative Analysis between Electric Vehicles and Internal Combustion Engine Vehicles. Sustain. Cities Soc. 2018, 39, 578–591. [Google Scholar] [CrossRef]
- Coffman, M.; Bernstein, P.; Wee, S. Electric Vehicles Revisited: A Review of Factors That Affect Adoption. Transp. Rev. 2016, 37, 79–93. [Google Scholar] [CrossRef]
- Lieven, T. Policy measures to promote electric mobility—A global perspective. Transp. Res. Part A Policy Pract. 2015, 82, 78–93. [Google Scholar] [CrossRef] [Green Version]
- Lieven, T.; Muhlmeier, S.; Henkel, S.; Walker, J. Who will buy electric cars? An empirical study in Germany. Transp. Res. Part D Transp. Environ. 2011, 16, 236–243. [Google Scholar] [CrossRef]
- Hackbarth, A.; Madlener, R. Consumer preferences for alternative fuel vehicles: A discrete choice analysis. Transp. Res. Part D Transp. Environ. 2013, 25, 5–17. [Google Scholar] [CrossRef] [Green Version]
- Li, W.; Long, R.; Chen, H.; Jichao, G. A review of factors influencing consumer intentions to adopt battery electric vehicles. Renew. Sustain. Energy Rev. 2017, 78, 318–328. [Google Scholar] [CrossRef]
- Harrison, G.; Thiel, C. An exploratory policy analysis of E-mobility and related infrastructure in Europe. Technol. Forecast. Soc. Chang. 2017, 114, 165–178. [Google Scholar] [CrossRef]
- Mruzek, M.; Gajdač, I.; Kučera, L.; Barta, D. Analysis of Parameters Influencing Electric Vehicle Range. Procedia Eng. 2016, 134, 165–174. [Google Scholar] [CrossRef] [Green Version]
- Eberle, U.; von Helmolt, R. Sustainable transportation based on electric vehicle concepts: A brief overview. Energy Environ. Sci. 2010, 3, 689–699. [Google Scholar] [CrossRef]
- Yang, T.; Long, R.; Li, W.; Rehman, S.U. Innovative Application of the Public-Private Partnership Model to the Electric Vehicle Charging Infrastructure in China. Sustainability 2016, 8, 738. [Google Scholar] [CrossRef] [Green Version]
- Cecere, G.; Corrocher, N.; Guerzoni, M. Price or performance? A probabilistic choice analysis of the intention to buy electric vehicles in European countries. Energy Policy 2018, 118, 19–32. [Google Scholar] [CrossRef] [Green Version]
- Li, W.; Long, R.; Chen, H. Consumers’ evaluation of national new energy vehicle policy in China: An analysis based on a four paradigm model. Energy Policy 2016, 99, 33–41. [Google Scholar] [CrossRef]
- Bunce, L.; Harris, M.; Burgess, M. Charge up then charge out? Drivers’ perceptions and experiences of electric vehicles in the UK. Transp. Res. Part A Policy Pract. 2014, 59, 278–287. [Google Scholar] [CrossRef]
- Beggs, S.; Cardell, S.; Hausman, J. Assessing the potential demand for electric cars. J. Econom. 1981, 17, 1–19. [Google Scholar] [CrossRef]
- Dombrowski, U.; Engel, C.; Schulze, S. Changes and challenges in the after sales service due to the electric mobility. In Proceedings of the 2011 IEEE International Conference on Service Operations, Logistics and Informatics, Beijing, China, 10–12 July 2011; pp. 77–82. [Google Scholar]
- Liao, F.; Molin, E.; van Wee, B. Consumer preferences for electric vehicles: A literature review. Transp. Rev. 2017, 37, 252–275. [Google Scholar] [CrossRef] [Green Version]
- Jansen, A.F.; Cherchi, E.; Mabit, S.L. On the stability of preferences and attitudes before and after experiencing an electric vehicle. Transp. Res. Part D Transp. Environ. 2013, 25, 24–32. [Google Scholar] [CrossRef] [Green Version]
- Skippon, S.; Garwood, M. Responses to battery electric vehicles: UK consumer attitudes and attributions of symbolic meaning following direct experience to reduce psychological distance. Transp. Res. Part D Transp. Environ. 2011, 16, 525–531. [Google Scholar] [CrossRef]
- Hoen, A.; Koetse, M.J. A choice experiment on alternative fuel vehicle preferences of private car owners in The Netherlands. Transp. Res. Part A Policy Pract. 2014, 61, 199–215. [Google Scholar] [CrossRef]
- Burgess, M.; King, N.; Harris, M.; Lewis, E. Electric vehicle drivers’ reported interactions with the public: Driving stereotype change? Transp. Res. Part F Traffic Psychol. Behav. 2013, 17, 33–44. [Google Scholar] [CrossRef]
- Bockarjova, M.; Steg, L. Can protection motivation theory predict pro-environmental behavior? Explaining the adoption of electric vehicles in the Netherlands. Glob. Environ. Change-Hum. Policy Dimens. 2014, 28, 276–288. [Google Scholar] [CrossRef]
- Lebeau, K.; Van Mierlo, J.; Lebeau, P.; Mairesse, O.; Macharis, C. Consumer attitudes towards battery electric vehicles: A large-scale survey. Int. J. Electr. Hybrid Veh. 2013, 5, 28–41. [Google Scholar] [CrossRef]
- Potoglou, D.; Kanaroglou, P.S. Household demand and willingness to pay for clean vehicles. Transp. Res. Part D Transp. Environ. 2007, 12, 264–274. [Google Scholar] [CrossRef]
- Verma, M.; Verma, A.; Khan, M. Factors Influencing the Adoption of Electric Vehicles in Bengaluru. Transp. Dev. Econ. 2020, 6, 17. [Google Scholar] [CrossRef]
- Barth, M.; Jugert, P.; Fritsche, I. Still underdetected–social norms and collective efficacy predict the acceptance of electric vehicles in Germany. Transp. Res. Part F Traffic. Psychol. Behav. 2016, 37, 64–77. [Google Scholar] [CrossRef]
- Hidrue, M.; Parsons, G.; Kempton, W.; Gardner, M. Willingness to pay for electric vehicles and their attributes. Energy Econ. 2011, 33, 686–705. [Google Scholar] [CrossRef] [Green Version]
- Adepetu, A.; Keshav, S. The relative importance of price and driving range on electric vehicle adoption: Los Angeles case study. Transportation 2017, 44, 353–373. [Google Scholar] [CrossRef]
- Lai, I.; Liu, Y.; Sun, X.; Zhang, H.; Xu, W. Factors influencing the behavioural intention towards full electric vehicles: An empirical study in Macau. Sustainability 2015, 7, 12564–12585. [Google Scholar] [CrossRef] [Green Version]
- Schuitema, G.; Anable, J.; Skippon, S.; Kinnear, N. The role of instrumental, hedonic and symbolic attributes in the intention to adopt electric vehicles. Transp. Res. Part A Policy Pract. 2013, 48, 39–49. [Google Scholar] [CrossRef]
- Franke, T.; Krems, J.F. What drives range preferences in electric vehicle users? Transp. Policy 2013, 30, 56–62. [Google Scholar] [CrossRef]
- Yang, K.; Forney, J.C. The moderating role of consumer technology anxiety in mobile shopping adoption: Differential effects of facilitating conditions and social influences. J. Electron. Commer. Res. 2013, 14, 334–347. [Google Scholar]
- Noel, L.; de Rubens, G.Z.; Sovacool, B.K.; Kester, J. Fear and loathing of electric vehicles: The reactionary rhetoric of range anxiety. Energy Res. Soc. Sci. 2019, 48, 96–107. [Google Scholar] [CrossRef]
- Sundaravej, T. Empirical validation of unified theory of acceptance and use of technology model. J. Glob. Inf. Technol. Manag. 2010, 13, 5–27. [Google Scholar]
- Lai, X.; Huang, Y.; Gu, H.; Han, X.; Feng, X.; Dai, H.; Zheng, Y.; Ouyang, M. Remaining discharge energy estimation for lithium-ion batteries based on future load prediction considering temperature and ageing effects. Energy 2022, 238, 121754. [Google Scholar] [CrossRef]
- Razak, M.I.M.; Yusuf, A.M.; Mashahadi, F.; Alias, Z.; Othman, M.Z. Intention to Purchase Hybrid Cars in Malaysia: An overview. Int. J. Econ. Commer. Manag. 2014, 2, 1–13. [Google Scholar]
- Lai, X.; Chen, Q.; Tang, X.; Zhou, Y.; Gao, F.; Guo, Y.; Bhagat, R.; Zheng, Y. Critical review of life cycle assessment of lithium-ion batteries for electric vehicles: A lifespan perspective. eTransportation 2022, 12, 100169. [Google Scholar] [CrossRef]
- Klöckner, C.A.; Nayum, A.; Mehmetoglu, M. Positive and negative spillover effects from electric car purchase to car use. Transp. Res. Part D 2013, 21, 32–38. [Google Scholar] [CrossRef] [Green Version]
- Zhang, X.; Xie, J.; Rao, R.; Liang, Y. Policy Incentives for the Adoption of Electric Vehicles across Countries. Sustainability 2014, 6, 8056–8078. [Google Scholar] [CrossRef] [Green Version]
- Zhang, Y.; Yu, Y.; Zou, B. Analyzing public awareness and acceptance of alternative fuel vehicles in China: The case of EV. Energy Policy 2011, 39, 7015–7024. [Google Scholar] [CrossRef]
- Helveston, J.P.; Liu, Y.; Feit, E.M.; Fuchs, E.; Klampfl, E.; Michalek, J.J. Will subsidies drive electric vehicle adoption? Measuring consumer preferences in the U.S. and China. Transp. Res. Part A Policy Pract. 2015, 73, 96–112. [Google Scholar] [CrossRef] [Green Version]
- Guardian. Available online: https://www.theguardian.com/environment/2021/jan/05/electric-cars-record-market-share-norway (accessed on 15 May 2021).
- Pinto, B.; Barata, F.; Soares, C.; Viveiros, C. Fleet Transition from Combustion to Electric Vehicles: A Case Study in a Portuguese Business Campus. Energies 2020, 13, 1267. [Google Scholar] [CrossRef] [Green Version]
- European Electric Vehicles Factbook. Available online: https://theicct.org/sites/default/files/publications/EV-EU-Factbook-2020.pdf (accessed on 11 May 2021).
- Eurostat. Available online: https://ec.europa.eu/eurostat/databrowser/view/ROAD_EQS_CARPDA__custom_1427422/default/table?lang=en (accessed on 23 May 2021).
- Rijksdienst voor Ondernemend Nederland: Elektrisch Rijdenop op (de) Weg–Voertuigen en Laadpunten: Overzicht Tot en Met. 2020. Available online: https://www.rvo.nl/sites/default/files/2021/03/Elektrisch%20Rijden%20op%20-%20de%20-%20weg%20-%20voertuigen%20en%20laadpunten%20-%20jaaroverzicht%202020.pdf (accessed on 28 June 2021). (In Dutch).
- The Road to Electric-In Charts and Data—RAC. Available online: https://www.rac.co.uk/drive/electric-cars/choosing/road-to-electric/ (accessed on 20 June 2021).
- Electromobility in Austria. Available online: https://www.bmk.gv.at/dam/jcr:2b2fd1e4-4629-4985-a350-419f5d7c95b3/Facts_Figures_2020_01_E.pdf (accessed on 7 June 2021).
- Center for Vehicles of Croatia. Available online: https://www.cvh.hr/media/3687/s03__pregled_broja_neispravnosti_po_sklopovima_2020.xlsx (accessed on 20 April 2021). (In Croatian).
- Center for Vehicles of Croatia. Available online: https://www.cvh.hr/media/3698/s12__broj_vozila_s_elektricnim_i_hibridnim_pogonom_2007do2020.pdf (accessed on 24 May 2021). (In Croatian).
- Center for Vehicles of Croatia. Available online: https://www.cvh.hr/media/3696/s11__prosjecna_starost_po_vrstivozila_2007do2020.pdf (accessed on 25 May 2021). (In Croatian).
- Emanović, M. (Center for Vehicles of Croatia, Zagreb, Croatia). Unpublished Internal Company Document. 2021. (In Croatian)
- Center for Vehicles of Croatia. Available online: https://www.cvh.hr/media/2358/cvh_bilten_155_web.pdf (accessed on 19 May 2021). (In Croatian).
- Tesla Service Express Zagreb. Available online: https://www.tesla.com/hr_HR/findus/location/service/zagrebservice (accessed on 28 September 2021).
- Road Traffic Safety Act (“Official Gazette” Numbers 67/08, 48/10, 74/11, 80/13, 158/13, 92/14, 64/15, 108/17, 70/19 and 42/20); Official gazette of the Republic of Croatia: Zagreb, Croatia, 2008. (In Croatian)
- Ordinance on Technical Conditions of Vehicles in Road Traffic (“Official Gazette” numbers 85/16, 24/17, 70/19 and 60/20); Official gazette of the Republic of Croatia: Zagreb, Croatia, 2016. (In Croatian)
- Ordinance on Vehicle Testing (“Official Gazette” 152/09 and 8/15); Official gazette of the Republic of Croatia: Zagreb, Croatia, 2009. (In Croatian)
- European Strategy and Policy Analysis System (ESPAS). Available online: https://espas.secure.europarl.europa.eu/orbis/document/electric-vehicles-europe (accessed on 25 May 2021).
- European Alternative Fuels Observatory. Available online: https://www.eafo.eu/countries/croatia/1727/summary (accessed on 20 May 2021).
- ELEN. Available online: https://elen.hep.hr/en (accessed on 27 May 2021).
- Croatian Telecom Recharge Spots. Available online: https://hr.rechargespots.eu/#/portal/locations (accessed on 27 June 2021).
- European Alternative Fuels Observatory. Available online: https://www.eafo.eu/electric-vehicle-charging-infrastructure (accessed on 27 May 2021).
- Energy Institute Hrvoje Požar. Available online: https://eihp.hr/ (accessed on 27 May 2021).
- The Environmental Protection and Energy Efficiency Fund. Available online: https://www.fzoeu.hr/hr/sufinanciranje-nabave-energetski-ucinkovitijih-vozila/7713 (accessed on 16 May 2021). (In Croatian).
- E-mobility—Croatian Telecom. Available online: https://www.hrvatskitelekom.hr/poslovni/ict/e-mobilnost (accessed on 26 May 2021). (In Croatian).
- E-mobility—Croatian Telecom Price List for Charging. Available online: https://hrvatskitelekom.hr/ResourceManager/FileDownload.aspx?rId=14116&rType=2 (accessed on 16 May 2021). (In Croatian).
- Google Maps. Available online: https://www.google.com/maps/dir/Zagreb/Rijeka/@45.5602873,14.9349978,10z/data=!3m1!4b1!4m13!4m12!1m5!1m1!1s0x4765d692c902cc39:0x3a45249628fbc28a!2m2!1d15.9819189!2d45.8150108!1m5!1m1!1s0x4764a12517aabe2d:0x373c6f383dcbb670!2m2!1d14.442176!2d45.3270631 (accessed on 25 August 2021).
- Google Maps. Available online: https://www.google.com/maps/dir/Zagreb/Osijek/@45.4842427,16.7767553,9z/am=t/data=!4m13!4m12!1m5!1m1!1s0x4765d692c902cc39:0x3a45249628fbc28a!2m2!1d15.9819189!2d45.8150108!1m5!1m1!1s0x475ce7a869728075:0x5b8c725621a41195!2m2!1d18.6955144!2d45.5549624 (accessed on 25 August 2021).
- Google Maps. Available online: https://www.google.com/maps/dir/Zagreb/Split,+21000/@44.6541333,14.9373706,8z/data=!3m1!4b1!4m13!4m12!1m5!1m1!1s0x4765d692c902cc39:0x3a45249628fbc28a!2m2!1d15.9819189!2d45.8150108!1m5!1m1!1s0x13355dfc6bbcf517:0xa1798ff631b49f98!2m2!1d16.4401935!2d43.5081323 (accessed on 25 August 2021).
- Google Maps. Available online: https://www.google.com/maps/dir/Zagreb/Dubrovnik/@44.2269343,15.7041236,8z/data=!3m1!4b1!4m13!4m12!1m5!1m1!1s0x4765d692c902cc39:0x3a45249628fbc28a!2m2!1d15.9819189!2d45.8150108!1m5!1m1!1s0x134b8ba20835e87d:0x400ad50862bd500!2m2!1d18.0944238!2d42.6506606 (accessed on 25 August 2021).
- Electric Vehicle Database. Available online: https://ev-database.org/car/1087/Volkswagen-e-Golf (accessed on 22 August 2021).
- Electric Vehicle Database. Available online: https://ev-database.org/car/1423/Hyundai-Kona-Electric-64-kWh (accessed on 22 August 2021).
Figure 1.
Statistics on the number of passenger BEVs in the EU + EFTA + UK + Turkey countries from 2015 to 2019. Source: Made by the authors according to [65,66,67,68].

Figure 2.
Spatial distribution of passenger BEVs in Croatia in 2020.

Figure 3.
The trend of increasing the number of passenger BEVs in Croatia by years.

Figure 4.
Distribution of passenger BEVs in Croatia by the manufacturer in 2020.

Figure 5.
Survey results: share of identified influencing factors for BEV users in Croatia.

Publisher’s Note: MDPI stays neutral with regard to jurisdictional claims in published maps and institutional affiliations. |
© 2022 by the authors. Licensee MDPI, Basel, Switzerland. This article is an open access article distributed under the terms and conditions of the Creative Commons Attribution (CC BY) license (https://creativecommons.org/licenses/by/4.0/).
Share and Cite
MDPI and ACS Style
Emanović, M.; Jakara, M.; Barić, D. Challenges and Opportunities for Future BEVs Adoption in Croatia. Sustainability 2022, 14, 8080. https://0-doi-org.brum.beds.ac.uk/10.3390/su14138080
AMA Style
Emanović M, Jakara M, Barić D. Challenges and Opportunities for Future BEVs Adoption in Croatia. Sustainability. 2022; 14(13):8080. https://0-doi-org.brum.beds.ac.uk/10.3390/su14138080
Chicago/Turabian StyleEmanović, Marko, Martina Jakara, and Danijela Barić. 2022. "Challenges and Opportunities for Future BEVs Adoption in Croatia" Sustainability 14, no. 13: 8080. https://0-doi-org.brum.beds.ac.uk/10.3390/su14138080
Note that from the first issue of 2016, this journal uses article numbers instead of page numbers. See further details here.