Article

RUSLE Model Evaluation of the Soil and Water Conservation Ratio of the Guizhou Province in China between 2000 and 2019

1
College of Forestry, Guizhou University, Guiyang 550025, China
2
Research Institute of Forestry, Chinese Academy of Forestry, Beijing 100091, China
*
Author to whom correspondence should be addressed.
Sustainability 2022, 14(13), 8219; https://0-doi-org.brum.beds.ac.uk/10.3390/su14138219
Submission received: 20 May 2022 / Revised: 1 July 2022 / Accepted: 3 July 2022 / Published: 5 July 2022
(This article belongs to the Special Issue Effects of Soil Conservation Practices on Sediment Yield)

Abstract

:
The soil and water conservation ratio (SWCR), which is a quantitative index for measuring the control degree of soil and water loss, is equal to the percentage of the land areas with a slight erosion intensity in the study area. The dynamic change in the SWCR reflects the dynamic process of realizing a specific soil and water conservation goal in a certain stage. The objectives of this study were to evaluate the change in the SWCR in the Guizhou Province in this century and to analyze its causes. The temporal and spatial variations of soil erosion intensity and SWCR were measured based on GIS technology and revised universal soil loss equation (RUSLE). The results showed that the spatial pattern of soil erosion intensity in the Guizhou Province was high in the west and low in the southeast, and that the soil erosion characteristics were obviously different between karst and non-karst areas. In the karst areas, the land with a moderate and above erosion intensity (>3 t hm−2 y−1 in the karst area; >25 t hm−2 y−1 in the non-karst area) accounted for 28.20–34.78% of the total area, while only accounting for 2.39–2.72% in the non-karst areas. From 2000 to 2019, the mean intensity of soil erosion decreased from 13.97 to 10.83 t hm−2 y−1, and the SWCR increased from 32.95% to 35.31%. According to the change in erosion intensity grades, 22.30% of the whole province’s erosion grade changed from high to low, especially in the west, with a high erosion intensity. Meanwhile, about 11.99% of the land in the central, eastern and southeastern regions, was where the erosion intensity showed a slight increase and the spatial distribution showed sporadic patch distribution characteristics, which may be related to an increase in infrastructure investment in the Guizhou Province in recent years. A large number of production and construction projects caused the destruction of surface vegetation and also caused patchy soil erosion. The spatial and temporal characteristics of the soil erosion and the SWCR in the Guizhou Province between 2000 and 2019 were mastered through this study, and our results provide an important basis for further scientific and reasonable soil and water conservation planning work.

1. Introduction

Soil erosion leads to a loss of soil nutrients [1,2], and land degradation caused by soil erosion is one of the main threats to environment and human security in the 21st century [3,4,5]. Soil erosion is also a major environmental and ecological problem in China, especially in the Loess Plateau in northwest China, the black soil area in northeast China and the karst area in southwest China [6,7].
Guizhou Province in the center of the southwest karst is one of the regions with serious soil erosion in China because it has the largest contiguous exposed area of carbonate rocks and the strongest karst development in China [8]. The ecological environment is extremely fragile, and it has a low resistance to erosion. In previous periods, due to the double pressures of population overload and social and economic backwardness, soil erosion in the karst areas has intensified, rock desertification has developed rapidly, and the ecological environment has deteriorated [9,10,11]. Due to the special geological and geomorphic environment and climate conditions in the karst areas, the natural soil formation rate is slow, the soil loss tolerance is low, and serious soil erosion leads to a decline in soil fertility, a thinning of the soil layer and an expansion of rocky desertification [12,13]. In recent years, with the attention of policy makers on ecological protection and the rapid development of local societies and economies, more and more investment has been made to control soil erosion and rock desertification in this region, and the ecological environment has been improved. In this process, the spatial pattern of land use and land cover changed greatly, which will inevitably lead to a change in the soil erosion environment and erosion characteristics in the region; however, there are few quantitative evaluation results on the temporal and spatial characteristics of soil erosion and soil and water conservation in this region.
The soil and water conservation ratio (SWCR) [14] is a recently proposed (2019) parameter to measure the control degree of soil and water loss. A regional calculation of the SWCR is usually based on the assessment of different soil erosion intensity areas; however, at the watershed or regional scale, the quantitative evaluation of soil erosion has always been a difficulty in soil erosion research due to the heterogeneity of the erosion environment and the complexity of the driving mechanism. In this regard, scholars of various countries have carried out a significant number of explorations to build soil erosion prediction models to simulate the amount of soil and water loss at different scales, such as the RUSLE [15], WEPP [16], CSLE [17] and EUROSEM [18] models. Among these models, the RUSLE model is the most widely applied [19]. Due to its simple structure and few parameters, the required data are relatively easy to obtain, and the main factors affecting soil erosion are considered with minimal data and calculation requirements. The simulation results at the large-scale level have been recognized by scholars at home and abroad. In the past 40 years, it has been widely used in the soil erosion studies at the regional scale, national scale and global scale in more than 100 countries [20]. The RUSLE model was originally developed from field plots and small watersheds, but some recent studies have shown its unique advantages over other models when applied to large scales. For instance, Karamage et al. [21] evaluated the soil erosion status of different land cover types in Uganda using the RUSLE model, and predicted the impact of support practices on soil loss reduction. Panagos et al. [22] estimated the soil erosion in Europe in 2010 by using the RUSLE model, and generated a map of the soil loss in the European Union with a resolution of 100 m. Borrelli et al. [23,24] quantitatively estimated soil erosion on a global scale based on the RUSLE model and assessed the impact of global land use change on soil erosion from 2001 to 2012. In subsequent studies, they built the RUSLE-based Global Soil Erosion Modeling platform (GloSEM), and the change characteristics of global soil erosion under different land use and climate change scenarios from 2015 to 2070 were predicted. In the above studies, at the national, continental and global scales, the RUSLE model was applied to evaluate the effect of support practices, to simulate soil erosion and study the spatial–temporal patterns of soil erosion, and to predict soil erosion under different environmental conditions in the future. It can be seen that the RUSLE model has certain advantages and application prospects, and is a reliable method in large-scale soil erosion simulations; however, there is a lack of a SWCR study based on the RUSLE model because the SWCR is a new concept, especially in karst regions with a fragile ecological environment.
In the studies of soil erosion simulations in karst areas, the RUSLE model is also used, but most of them are implemented at the watershed scale, with relatively few applications at the regional scale [10,25]. Chen et al. [26] estimated the annual average soil erosion rate of the Mawoshan Karst Basin in northwest Guizhou from 1980 to 2000 based on the RUSLE model, and analyzed the sensitivity of each sub-model. Wang et al. [27], based on the GIS and RUSLE models, applied the geodetector method to study the quantitative attribution of soil erosion in karst areas of different geomorphic types in the Sanchahe River Basin. Based on the RUSLE model and geodetector method, their studies explored the soil erosion status and quantitatively attributed the main influencing factors in the study area. Under the complex soil erosion environmental conditions in the karst areas, these pioneering studies provided a certain basis for large-scale soil erosion simulations in karst areas, and illustrated the applicability of the RUSLE model in those karst areas; however, these studies only assessed the soil erosion intensity at a karst watershed scale. At larger scales, such as a region scale, the study area may include both karst and non-karst regions. The rate of soil formation in a karst region is 10–40 times less than that of a non-karst region [28], leading to a soil loss tolerance that is different for the different landform area and a soil erosion intensity classification is entirely different; therefore, the study area should be divided into two landform types to more accurately measure the soil erosion intensity and SWCR at a regional scale.
As the center of the karst region in southwest China and being an important ecological barrier in the upper reaches of the Yangtze River and Pearl River, the Guizhou Province has strong representativeness and a practical significance for a quantitative evaluation of the soil erosion in this region [29]. The objective of this study was to simulate the soil erosion in the Guizhou Province from 2000 to 2019 by using the RUSLE model, to analyze the temporal and spatial variation characteristics of soil erosion and various elements influencing the occurrence of soil erosion in the RUSLE model, to identify the current value of the SWCR in the study area, and to analyze its change trend during the study period. Additionally, an evaluation of the effect of soil and water conservation in the Guizhou Province in the previous 20 years was conducted. This will provide a scientific basis for soil and water conservation and ecological environment evaluation in the Guizhou Province and in karst regions.

2. Materials and Methods

2.1. Study Site

The study area is located in the Guizhou Province, east of the Yunnan-Guizhou Plateau (103°36′~109°35′ E; 24°37 to 29°13′ N) (Figure 1). Guizhou Province is the center of the karst distribution in southwest China and is an important water conservation area and ecological security barrier area in the upper reaches of the Yangtze River and the Pearl River. The province is about 595 km long from east to west and about 509 km from north to south, with a total area of 17.6 × 10⁴ km2. The terrain west of the study area is higher than in the east, tilting from the middle to the north, east and south, and the average altitude is about 1100 m. The climate is warm and humid, belonging to the subtropical warm and humid monsoon climate zone, which is characterized by simultaneous heat and precipitation, an obvious rainy season and having high precipitation. Guizhou has complex natural conditions and various soil types, including yellow soil, lime soil, red soil and purple soil. Among them, the distribution of yellow soil is largest. The general distribution of the soil types in the province is as follows: the red soil is mainly distributed in the south and east; yellow soil is widely distributed in the central and northern regions, and purple soil is concentrated in the northwest corner. In addition, except for the eastern part of the southeast, there are large areas of lime soil distribution in the whole province. Karst and non-karst environments account for about 70% and 30% of the area, respectively. In the karst region, the soil layer is shallow, and the soil erosion and rocky desertification are serious. According to the data, from 2000 to 2018, the province invested about CNY 1.87 × 10⁴ million in the ecological environment construction of soil and water conservation, covering an area of 3.05 × 10⁴ km2. From 2005 to 2016, the area of rocky desertification in the Guizhou Province decreased by 25.5%, or about 8460 km2. In recent years, the social and economic development of Guizhou Province has been rapid. The province has vigorously implemented the “Big Ecology” strategy, and intensified the soil and water conservation and control of karst rocky desertification. In 2016, Guizhou Province became one of the first batch of national ecological civilization pilot zones, achieving remarkable achievements in ecological environment construction.

2.2. Data Sources

The main data of this study are: the daily precipitation data, land cover data, vegetation index data, soil data, digital elevation data and the karst distribution data in the Guizhou Province. The specific data sources and accuracy information are shown in Table 1.
The basic data are divided into the S1 period (2000–2004), S2 period (2005–2009), S3 period (2010–2014) and S4 period (2015–2019). After obtaining the above basic data, the coordinates were unified as an Albers_Conic_Equal_Area, and the spatial resolution was uniformly sampled to 12.5 m for analyzing the soil erosion characteristics.

2.3. Methods

2.3.1. Soil Erosion Intensity Calculation

In this study, the revised universal soil loss equation (RUSLE) [15] was used to estimate the soil erosion in the Guizhou Province from 2000 to 2019.
The RUSLE equation is:
A = R × K × L S × C × P
where, A represents the soil erosion rate (t hm−2 y−1); R is the rainfall erosivity factor (MJ mm hm−1 h−1 y−1); K is the soil erodibility factor (t hm2 h MJ−1 hm−2 mm−1); LS is the slope length and slope steepness factor; C is the land cover and management factor; P is the support practice factor. LS, C and P factors are dimensionless.
(1)
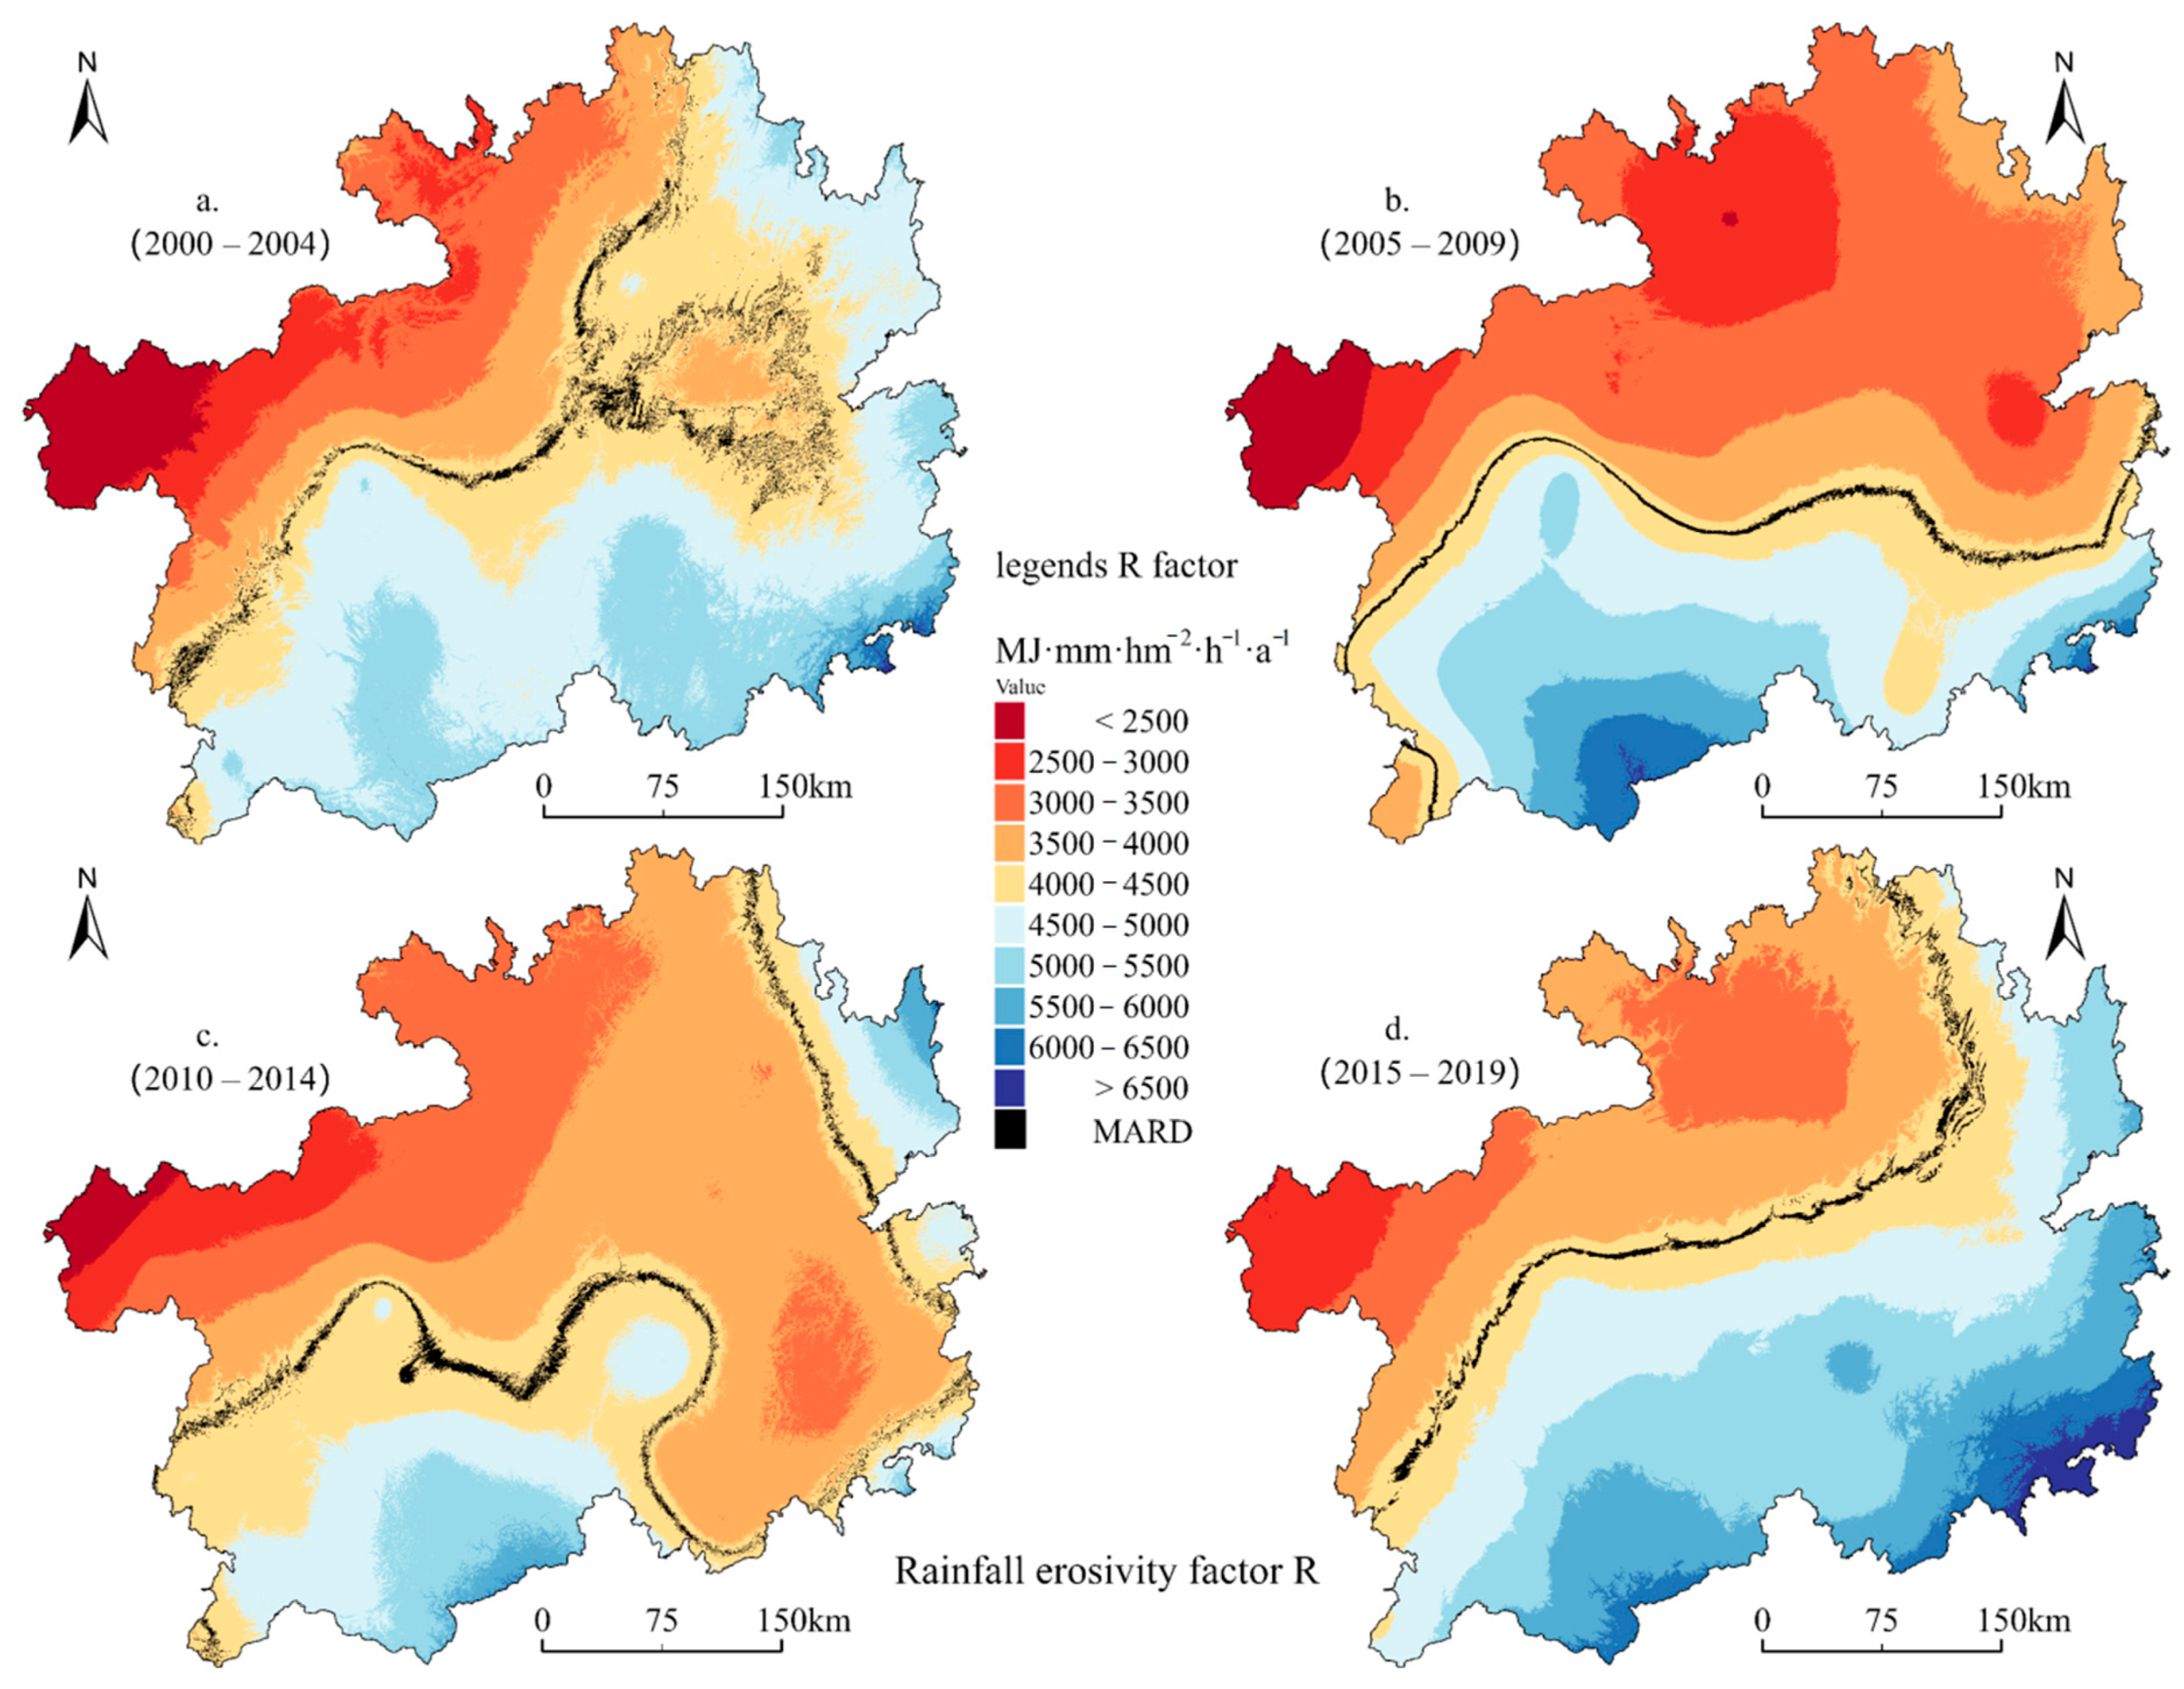
Rainfall erosivity factor (R). Rainfall erosivity is a measure parameter of the soil erosion caused by rainfall. R reflects the potential erosion due to rainfall factors on the soil, and it is the main driving force of soil erosion. The monthly and annual mean rainfall erosivity in each station were determined by using the daily rainfall observation data from 49 meteorological stations in Guizhou Province and its surrounding areas and the R factor of the whole study area was obtained by using the co-kriging interpolation method. In this paper, the rainfall erosivity calculation method is a daily rainfall-erosivity model established by Yu and Rosewell [31] and modified by Xie et al. [32], which was proved by Zhu et al. [33] to be suitable for the calculation of rainfall erosivity in the karst areas of southern China. The equation is as follows:
R d a y = 0.2686 [ 1 + 0.5412 cos ( π 6 j 7 π 6 ) ] P d 1.7265
where, Rday is the rainfall erosivity on a day in month j, and Pd is the rainfall of that day (mm), monthly and annual rainfall erosivity is the sum of the daily rainfall erosivity (MJ mm hm−1 h−1 y−1). The daily erosive rainfall threshold was set to 12 mm.
(2)
Soil erodibility factor (K). The K factor is an indicator of the soil detachment and transport by raindrop impact and surface flow. Soil with a strong erosion resistance has a low K value, and, vice versa, the K value is high. The conventional calculation methods of the soil erodibility factor are considered to be overestimated in China and are not suitable for direct use, thus they need to be calibrated [34]. The K factor calculation method modified by Zhang et al. [35] was adopted in this paper. The equation is as follows:
K E P I C = { 0.2 + 0.3 exp [ 0.0256 S A N ( 1 S I L 100 ) ] } × ( S I L C L A + S I L ) 0.3 × [ 1.0 0.25 C C + exp ( 3.72 2.95 C ) ] × [ 1.0 0.7 S N 1 S N 1 + exp ( 5.51 + 22.9 S N 1 ) ]
K D g = 7.594 { 0.0017 + 0.0494 exp [ 0.5 ( log ( D g ) + 1.675 0.6986 ) 2 ] }
D g = exp ( 0.01 i n f i ln m i )
K E P I C r = 0.01383 + 0.5158 K E P I C
K D g r = 0.00911 + 0.5507 K D g
K = 0.1317 { 0.0041 + 1.2978 [ 1 2 ( K E P I C r + K D g r ) ] }
where KEPIC is the K value obtained by the EPIC model [36] calculation method, KDg is the K value of the Shirazi formula [15,37], SAN is the sand content (%), SIL is the silt content (%), CLA is the clay content (%), C is the soil organic carbon content (%), SN1 = 1 − SAN/100, Dg is the geometric mean diameter, and mi is the arithmetic mean of the particle size limits (mm). The figure of 0.1317 is a factor to convert the soil erodibility index to the SI metric unit of t hm2 h MJ−1 hm−2 mm−1.
(3)
Slope length and steepness factors (LS). The LS factor shows the combining effect of the slope length (L) and slope steepness (S) that shows the topographical influences on soil erosion, and usually shows an accelerated effect on soil erosion. In karst areas, the topographic fluctuations vary greatly, and a low-resolution DEM may underestimate the impact of topographic changes on the soil erosion simulation. In this paper, we used the LS calculation method in CSLE [17] to calculate the LS factor value, realized by the LS-Tools developed by Zhang et al. [38]. The expression is as follows:
L = ( λ 22.13 ) m
m = { 0.2 , θ 1 0.3 , 1 < θ 3 0.4 , 3 < θ 5 0.5 , θ > 5
S = { 10.8 sin θ + 0.03 , θ < 5 16.8 sin θ 0.50 , 5 θ < 1 0 21.9 sin θ 0.96 , θ 1 0
where λ is the slope length (m), and m is a variable length slope exponent. McCool’s [39] S factor calculation method is adopted when the slope is less than 10°, and Liu’s [40] S factor calculation method is adopted for a steep slope when the slope is greater than 10°. S is the slope steepness factor; θ is the slope value.
(4)
Vegetation cover and management factor (C). The vegetation cover and management factor is used to represent the impact of vegetation cover and management measures on soil erosion. It is defined as the ratio of soil loss under certain surface cover and management measures to the soil loss under the same conditions under timely ploughing and a continuous fallow control. The C value also depends on the amount of erosive rainfall in the different growing periods of crops, and the annual average C value is weighted according to the annual monthly distribution of rainfall erosivity. Borrelli et al. [23] estimated global soil erosion at a large scale and calculated the C-factor values for agricultural and non-agricultural land, respectively. Li et al. [41] adopted this method and, based on the crop composition of each province in China, the weighted average C factor value of the cultivated land in each province was calculated. Our study area was the Guizhou Province, which is between the national large-scale and the large watershed scale. The calculation of the C factor value by using the above methods cannot well show the spatial distribution of the C factor value of agricultural land. The method of calculating the C factor value was based on the vegetation coverage proposed by Cai et al. [42]. This method has been applied to the calculation of the C factor value at the watershed scale in the karst area [43,44]. The method of Borrelli et al. [23] was adopted to calculate the C value of non-agricultural land, and the method of Cai et al. [42] to calculate the C value of agricultural land in this paper, and expression is as follows:
f = N D V I N D V I s o i l N D V I v e g N D V I s o i l
where, f is the fractional vegetation coverage (FVC) (%) in each season; NDVI is the NDVI value of each month; NDVIsoil is the NDVI value of bare soil or a non-vegetation covered area; NDVIveg is the NDVI value of the pixels completely covered by vegetation. In the absence of measured data at the large scale, the cumulative percentages of 5% and 95% are usually selected as the NDVIsoil and NDVIveg thresholds, respectively:
C A = { 1 f = 0 0.6508 0.3436 lg ( f ) , 0 < f 78.3 % 0 f > 78.3 %
where CA is the value of C of the agricultural land; f is the vegetation coverage.
Referring to the method of Borrelli et al., the C value of non-agricultural land was calculated by the land use type and fractional vegetation coverage, and the expression is as follows:
C N A = MIN ( C L C ) + Range ( C L C ) × ( 1 f )
where CNA is the value of C of the non-agricultural land; f is the vegetation coverage. The range of CNA for each land cover (LC) is as follows (Table 2):
C = i = 1 n R i C i
where C is the annual average C value; i is the plant growth season (month); Ri is the percentage of rainfall erosivity in month i in annual rainfall erosivity; Ci is the value of C in month i.
(5)
Support practices factor (p). The soil and water conservation support practices factor is the ratio of soil loss under certain surface conditions to soil loss on the control surface under the same conditions when planting along a slope without the support measure. The p value ranges from 0 to 1, and the smaller the p value is, the more obvious the effect of soil and water conservation measures on the soil erosion control is. The p factor is also one of the most difficult factors to determine. At a large scale, it is difficult for a support practice to be specific; therefore, the p value is usually not considered [45]. At the large watershed scale, the p factor is usually assigned according to land use. The scale of this study was between the national scale and the large watershed scale; therefore, it was reasonable to assign the p factor by land use. In this study, the p values of the different land use types were acquired from previous studies of karst areas in southwest China [43,46,47,48], that is, Woodlands, Shrubby land and Bare land were 1. The Water body and Impervious surfaces were 0, in the Rainfed cropland they were 0.4, and 0.15 in the Irrigated cropland fields.

2.3.2. Soil and Water Conservation Ratio Calculation

The soil and water conservation ratio (SWCR) is a new evaluation index of soil and water conservation and was proposed in 2019. It is generally divided into a current value and long-term target value. The current value of the SWCR is an important reflection of the regional soil and water conservation status, and it is the ratio of the area where erosion intensity is a slight degree to the total study area [14], as follows:
S W C R = S l i g h t   e r o s i o n   a r e a S t u d y   a r e a × 100 %
Guizhou Province is located in the center of the karst region in southwest China, and the karst distribution area accounts for about 70% of the total area of the province. Owing to the high and steep mountain karst area, with a shallow soil layer, where the majority of the carbonate rock acid insoluble content is low (less than 10%) [28], the soil formation is slow, and the soil loss tolerance is small [12,13,49], using the same standard of soil erosion intensity in a karst area and non-karst area is obviously inaccurate [12]. Scientific division of the soil erosion intensity level is particularly important in the study area; therefore, the present Soil Erosion Classification Standard (SL 190-2007) was used as the classification basis of the soil erosion intensity in the non-karst areas. The classification of soil erosion intensity in the karst areas was based on the Technical Standard for Comprehensive Control of Soil erosion in Karst Areas (SL 461-2009) (Table 3).

3. Results

3.1. Spatial and Temporal Characteristics of Soil Erosion Factors in Guizhou Province

In this paper, the rainfall erosivity was estimated based on the daily rainfall. The spatial pattern of rainfall erosivity in the Guizhou Province is generally low in the northwest and high in the southeast. There are several high-value belt regions in northeast, southeast and southwest Guizhou, and the rainfall erosivity in northwest Guizhou is the lowest (Figure 2). The mean annual rainfall erosivity in the Guizhou Province from 2000 to 2019 was 4154 MJ mm hm−1 h−1 y−1. From 2000 to 2009, the rainfall erosivity decreased from 4209 MJ mm hm−1 h−1 y−1 to 3921 MJ mm hm−1 h−1 y−1. From 2010 to 2019, the rainfall erosivity showed an increasing trend (from 3945 MJ mm hm−1 h−1 y−1 to 4539 MJ mm hm−1 h−1 y−1). The mean value of the rainfall erosivity had little change from 2005 to 2015 and increased slightly from 2000 to 2019.
From 2000 to 2019, the variation range of the rainfall erosivity in the eastern and northeastern parts of Guizhou Province was more severe, and the variation in the central and the western parts was more moderate. In order to directly reflect the overall change and spatial pattern of the rainfall erosivity, an overall multi-annual average R-value distribution zone (MARD) (black area in Figure 2) was described by 25 MJ mm hm−1 h−1 y−1 as the buffer radius based on the multi-annual average rainfall erosivity of the four periods. Based on the mean distribution belt, the R value less than the mean was considered to be the low value region, and the R value greater than the mean was considered to be the high value region.
In the S1 period, the MARD was wave-shaped, starting from northern Guizhou, southward to the northern part of the center urban zone in central Guizhou, and then westward to the junction of Yunnan and Guizhou. In this period, a large area MARD was distributed in eastern Guizhou, and the transition of the high value region to a mean value region and low value region was gentle. In the S2 period, the rainfall erosivity decreased as a whole, and the MARD moved southward as a whole. The MARD divided the study area into two areas with an almost equal area from the middle of the study area along the latitude direction. The northern part of the study area became all low-value areas, and the transition between high and low values was hard. The mean value of the rainfall erosivity in the S3 period was roughly the same as that in the S2 period, but the distribution pattern was very different. The MARD continued to move southward in general, with a small movement in the west and a large movement in the east and even moved to the southeast boundary of the study area. A high value area reappeared again in the northeast corner. The areas less than the multi-year average in the S3 period occupied 63.56% of the total area of the Guizhou Province. During the S4 period, the MARD significantly shortened and moved to the northwest, the rainfall erosivity of the whole province increased significantly and the high-value area occupied most of the area.
There was a negative correlation between the vegetation cover and soil erosion, that is, the vegetation cover inhibited the soil erosion. In the RUSLE model, the higher the vegetation coverage, the closer the C factor value is to zero. The vegetation cover factor C and rainfall erosivity factor R in Guizhou Province was opposite in the spatial distribution. In general, the C value was higher in the west and lower in the southeast, and the muti-annual average of the province was 0.0658 (Figure 3). The distribution of a low C value was most concentrated in the southeast non-karst area of the province. Different from the rainfall erosivity, the C value was high in the middle of the study area, which was due to the fact that this area belongs to the urban economic belt of central Guizhou, and the vegetation coverage is relatively low in this area. Since 2000, the vegetation status of the Guizhou Province has shown a trend of obvious improvement on the whole. Except for the S3 period, the vegetation coverage increased and C value decreased in each period. The mean value of C in the S1 period was 0.0677, in the S2 period was 0.0623, in the S3 period was 0.0674, and in the S4 period was 0.0600. From the perspective of spatial distribution, most of the study area in the S1 period belonged to the high-value region, except for the southeast region and a part of the northern region (which belong to the non-karst area). Compared with the S1 period, the C value in most regions of the province decreased in the S2 period, and the mean value decreased from 0.0677 to 0.0623. In the S3 period, the C value in the study area increased slightly compared with the S2 period, and part of the C value in southeast Guizhou showed signs of increasing, but was still decreased compared with the S1 period. The vegetation in the north of the study area and the karstic trough valley area showed a good recovery, and the C value decreased in patches. For the S4 period, the distribution pattern of the C value in the study area had changed significantly. Low-value regions occupied most of the province area, and the high-value centers gradually moved to the main urban areas in the central part of the province. Due to the development of urbanization and the expansion of urban areas, there were some signs showing the C value also increased in other urban regions and counties, more or less.
From S1 to S4, the mean p values of Guizhou Province were 0.8092, 0.8094, 0.8082 and 0.8077, respectively, showing a decreasing trend on the whole. Figure 4 shows the distribution of the p factor in S4 and the change of p from S1 to S4. The spatial distribution characteristics of the p value and C value were highly similar, but their values were opposite. The p values showed a basic pattern of the lower value distributed in the urban areas and the higher value distributed in the suburbs and cropland.
The K factor reflects the sensitivity of the soil to erosion caused by rainfall, and the higher the value is, the more likely that soil erosion will occur in the process of rainfall. The mean value of the K factor in the Guizhou Province was 0.0118 t hm2 h MJ−1 hm−2 mm−1, and the minimum value was 0 t hm2 h MJ−1 hm−2 mm−1 (mainly in urban areas, water areas and some areas with a shallow soil layer). Because there is no soil in this area or the soil layer is extremely shallow, the attribute value of the soil layer thickness was 0 in the soil database, and it was considered that there was no soil to be eroded in this area; therefore, the K value was 0 t hm2 h MJ−1 hm−2 mm−1. The maximum value was 0.0146 t hm2 h MJ−1 hm−2 mm−1. The spatial distribution characteristics of the soil erodibility factor K (Figure 5b) in Guizhou Province were mainly as follows: the large areas with high values were concentrated in the east, the middle and high values mixtures were distributed in the southwest, and the north, central and southern regions were mainly distributed with low values.
The LS factor reflects the effect of topography on soil erosion, which is usually accelerated during the soil erosion process. The LS factor of Guizhou Province (Figure 5a) generally presented a pattern of low value in the middle, and high value in the surrounding areas, with an average value of 13.37. Geomorphic types control the characteristics of the natural ecological environment and restrict the intensity of regional soil erosion from a macro perspective [29]. The spatial heterogeneity of the LS value in Guizhou Province was high, which was related to the complex topography conditions of the Guizhou Province. Guizhou Province is the only province in China that has no plains distribution. It has high mountains and steep slopes, and the terrain is very fragmented. The low LS values were mainly distributed in the central karst plateau region, and the high LS values were mainly distributed in the western Beipanjiang karst valley region, the southern peak cluster depression region, the northeastern karst trough valley region and the southeastern non-karst region (the karst zoning reference to the rocky desertification control project in China). There was a high value belt along the main channel of the Wujiang River basin in the central and northern parts.

3.2. Changes in Soil Erosion

3.2.1. Characteristics of Soil Erosion (Quantity) Variation

After calculating each factor of the RUSLE model, the soil erosion intensity in the study area and two subzones (e.g., the karst and non-karst areas) were calculated through the model formula. The results show that the average soil erosion rate of the Guizhou Province showed a downward trend (Table 4) during the 20 years from 2000 to 2019, which decreased from 13.97 t hm−2 y−1 in the S1 period (2000–2004) to 12.43 t hm−2 y−1 in the S2 period (2005–2009), 12.85 t hm−2 y−1 in the S3 period (2010–2014) and 10.83 t hm−2 y−1 in the S4 period (2015–2019). Compared with the S1 period, the average soil erosion rate in the S2, S3 and S4 periods decreased by 11.00%, 7.98% and 22.42%, respectively. According to the calculation results of soil erosion in the karst area and non-karst area, the average soil erosion rate in the karst area in the four different periods were 15.09 t hm−2 y−1, 12.84 t hm−2 y−1, 13.75 t hm−2 y−1 and 11.26 t hm−2 y−1, respectively, whereas the average soil erosion rate in the non-karst area was 11.34 t hm−2 y−1, 11.46 t hm−2 y−1, 10.74 t hm−2 y−1 and 9.84 t hm−2 y−1, respectively. The average soil erosion rate in the non-karst areas was less than the average soil erosion rate in the whole province, and it was also less than the average soil erosion rate in the karst areas. From the perspective of a time variation, the soil erosion rate in the karst and non-karst areas showed an overall decreasing trend from S1 to S4, which was consistent with the change in soil erosion in the whole province.
The soil erosion was classified and counted according to intensity levels, and the results are shown in Figure 6. In general, the area of slight erosion accounted for the largest proportion in the Guizhou Province, followed by light erosion, and the area of both soil erosion intensities showed a trend in fluctuation and an increase with the time change. On the contrary, the other erosion grades showed a decreasing trend. From S1 to S4, the proportion of moderate-erosion intensity and above in the study area was 37.50%, 33.07%, 35.38% and 30.59%, respectively, showing a decreasing trend, indicating that the area of the more than moderate-erosion intensities had obtained a gradual control and decrease.
For the two subzones with karst and non-karst areas, it was found that the area occupied by a different soil erosion intensity grade in the two regions had obvious differences (Figure 6). The distribution characteristics of the erosion intensity in the non-karst areas were similar to that in the whole province, that is, with the increase in the soil erosion intensity grade, the area occupied by this erosion intensity grade gradually decreased, and the slight erosion areas also accounted for the largest proportion in the non-karst areas. From S1 to S4, the proportion of the non-karst areas with a moderate and above erosion intensity in the study area was 2.72%, 2.64%, 2.53% and 2.39%, respectively, and the area with a higher erosion level decreased gradually. In the karst area, the proportion of the moderate and above soil erosion area was large, and the proportion of the area of erosion intensity grade in the karst area was larger than that of the corresponding soil erosion intensity grade in the non-karst area except for the slight-erosion. From S1 to S4, the area of moderate and above erosion intensity in the karst area accounted for 34.78%, 30.43%, 32.85% and 28.20% of the study area, respectively.
The above results show that the proportion of the area with a moderate and above erosion intensity in the Guizhou Province presented a decreasing trend from 2000 to 2019, the area with a slight erosion intensity and light erosion intensity gradually increased, and the erosion intensity grade continuously converted from a high erosion intensity to a low erosion intensity.
The transfer matrix of the soil erosion intensity indicates the specific change mode and change area of the soil erosion intensity grade in each period. It can be seen from Figure 7 that the change in soil erosion intensity grade mainly converted into the adjacent grade (i.e., the area shown around the green square in Figure 7), and the main conversion pattern was from a high erosion grade to a low erosion grade. In particular, light erosion showed the greatest change and the convert pattern of the soil erosion was mainly from moderate to light and from light to slight. For instance, 1224.01 × 103 hm2 of the moderate erosion transferred to light erosion from 2000 to 2019.
Further, the transfer characteristics of the soil erosion intensity grades were extracted for an analysis of the soil erosion change, and the results are shown in Table 5. From the S1 to S4 periods, the change in the soil erosion intensity grade in the study area mainly showed that the erosion downgraded (e.g., a soil erosion intensity downgrade in 22.30% of the regions, and upgrade in 11.99% of the regions). In the different research periods, the change trend in erosion intensity grade shows a certain difference. From the S1 period to the S2 period, 12.98% of the area of the soil erosion intensity grade showed a characteristic downgrade sequentially, and 4.65% of the area showed the characteristic of an across-grade transfer to a low level. From S2 to S3, the proportion of soil erosion intensity upgrade was larger than that of the downgrade, with 7.39% of the area presenting the characteristic of a sequential grade down, and 2.36% of the area showing the characteristic of an across-grade transfer to a low level; however, in the same period, the soil erosion grade of a 14.27% area upgraded, and the soil erosion intensity grade of a 3.21% area changed from a low grade to high grade with the characteristic of an across-grade. From S3 to S4, the upgrade ratio gradually decreased, and the downgrade ratio increased again. Although the rainfall erosivity increased significantly during the S4 period, the soil erosion continued to decrease.

3.2.2. Spatial Distribution Characteristics of Soil Erosion

From the perspective of the spatial distribution of soil erosion (Figure 8), the spatial distribution pattern of the soil erosion intensity grade in the Guizhou Province was consistent from 2000 to 2019, with a common pattern of low intensity in the east and high intensity in the west. There were some contiguous low-value areas in the southeast, south and north, which mainly were distributed in the non-karst areas. The high value areas of soil erosion were mainly distributed in the high altitude area of the west, in the northwest area, in the Beipanjiang River basin of the southwest and the surrounding gorge area, and in the karst trough valley area of the northeast. From 2000 to 2019, the erosion intensity grade of the whole province showed a decreasing trend, and the erosion intensity grade of each high value area was an obvious downgrade; however, the erosion intensity in the western Beipanjiang River basin was still the most intense, and the erosion intensity grade in the central and southeastern parts of the study area showed the trend of a slow increase.
The spatial distribution of the soil erosion intensity grade changes (Figure 9) showed that more than 70% of the soil erosion intensity grade had not changed during the adjacent period, and the change in the erosion intensity grade in the different periods was mainly a sequential grade change, with a slight area of across-grade change. From the S1 period to the S2 period, the regions with a downgraded soil erosion intensity were scattered and this was distributed in all sub-areas of the province. From S2 to S3, the intensity of the soil erosion continued to downgrade in the west and in some parts of the south, and there were signs of erosion upgrade in the central, east, northeast and in some parts of the sensitive south areas. A large part of the areas with erosion upgrading (38.83%) were the areas in which erosion had downgraded in the previous period. Because these areas were in high erosion-sensitive areas, the erosion intensity was an easy change with the change in erosion factors. From S3 to S4, the downgraded areas of soil erosion intensity in the western and northern regions increased again, and the grade of the soil erosion intensity in the central region and the urban fringe of each county showed signs of upgrading. A 36.46% portion of the upgraded areas were the downgraded areas in the previous period and the proportion of re-upgrades in downgrade areas decreased. Compared with the S1 period, the grade distribution pattern of the soil erosion intensity changed significantly in the S4 period. The proportion of the downgrade areas was 22.30% of the province, mainly in the west and northwest. The intensity of soil erosion increased in some sporadic areas in the east and southeast.

3.3. Changes of SWCR

The SWCR is a standard to measure the control degree of soil and water loss, which can not only reflect the final and phased goals of regional soil and water conservation, but also reflect the dynamic process of realizing the definite goals through soil and water conservation work in a certain stage.
According to the calculation and analysis of the soil erosion in the previous step, with the decrease in soil erosion intensity, the SWCR in the Guizhou Province showed an increasing trend from 2000 to 2019, rising from 32.95% in the S1 period to 35.16% in the S2 period. The SWCR in the S3 period decreased by 1.11% compared with the S2 period, and it rose to 35.31% in the S4 period (Table 6). These results indicate that the soil erosion in Guizhou Province is gradually decreasing, the SWCR is gradually increasing, and the ecological environment is gradually improving. The variation trend of the SWCR in the karst and non-karst areas was basically similar with that in the whole province, but the SWCR in the non-karst areas was much higher than that in the karst areas. The average soil erosion rate and SWCR of the study area were closer to that of the karst area, but different from that of the non-karst area, because the study area was a more than 70% karst area and a less than 30% non-karst area.

4. Discussion

4.1. Accuracy and Uncertainty Assessment and Particularity

At the regional scale, the model method is the only way to evaluate soil erosion and soil and water conservation; however, due to the limitation of model accuracy, the simulation results may be uncertain. Based on the previous research results in this area, the calculation of the sub-model elements (e.g., the R, K and C factors) and the data analysis methods were improved to improve the simulation’s accuracy. In this study, the daily rainfall data of 49 weather stations around the study area from 2000 to 2019 were used to calculate the monthly rainfall erosivity and the calculation method of the rainfall erosivity was proved by Zhu et al. [33] to be suitable for the karst area in southwest China. The K factor calculation method modified by Zhang et al. [35] was adopted to avoid an overestimation of the soil erodibility. Using 458 MODIS NDVI data from 2000 to 2019, monthly NDVI values were obtained by using the internationally accepted maximum value composite method (MVC). Then, the monthly FVC was calculated with the 5-year average monthly NDVI. Finally, the C factor of the agricultural lands and non-agricultural lands were calculated by the method of annual distribution of rainfall erosivity combined with land use data. The MVC method reduces the influence of cloud and other factors to a certain extent, and the mean value synthesis method limits the influence of interannual rainfall variation and cloud cover variation on the NDVI, while further reducing and eliminating the influence of outliers [23]. Considering the monthly distribution of rainfall erosivity, the simulation results could then be closer to the actual situation. The combination of the above methods can improve the accuracy of soil erosion estimation in large scale regions without measured data. Secondly, the previous model estimates of the soil erosion in karst areas mostly estimate the soil erosion status in a certain year based on the time scale of years. In this study, the average annual rate of soil erosion in each period was calculated over a period of five years. This can reduce the influence of the annual fluctuation of the soil erosion rate on the spatial and temporal characteristics of soil erosion under the influence of special environmental conditions (for example, with extreme dry or rainfall periods in a certain year). Thirdly, the soil erosion intensity grade of the karst and non-karst regions was classified according to different soil erosion intensity classification standards, and the spatial differences of the soil erosion grade based on the soil loss tolerance in the karst and non-karst regions were fully considered.
Compared with previous results (Table 7), the estimated results of this study had some differences in their specific values due to the methods, basic data and scales, but the distribution pattern and change rules of the soil erosion were similar. Zeng et al. [43] simulated soil erosion in the Yinjiang County, Guizhou Province based on the RUSLE model and observed that the soil erosion rates in 2000, 2005 and 2013 were 25.09 t hm−2 y−1, 21.53 t hm−2 y−1 and 18.84 t hm−2 y−1, respectively. All were greater than the provincial average in this study. The Yinjiang County is located in the karst trough valley area in the northeast of the Guizhou Province, which is a serious area of soil erosion; therefore, the soil erosion rate in this area was higher than the provincial average. Wang et al. [27] and Gao et al. [47] estimated soil erosion in the Sanchahe River Basin using RUSLE considering the rock bare rate, observing that the soil erosion rates in 2010 and 2015 were 11.37 t hm−2 y−1 and 12.22 t hm−2 y−1, respectively. In this paper, the soil erosion rates of the same period were similar to this. In addition, the proclamation of soil and water loss in the Guizhou Province showed that the average soil erosion rates in Guizhou Province from 2000 to 2005 and from 2006 to 2010 were 14.32 t hm−2 y−1 and 13.61 t hm−2 y−1, respectively. This is close to the results of this study. Based on the same classification method of soil erosion intensity (SL190-2007) with the proclamation, the SWCR in this paper was 62.78%, 67.84%, 65.15% and 70.49%, respectively. The overall trends and values are close to the results of the proclamation of soil and water loss.
The assessment results of the soil and water conservation in different research areas have their own particularity due to different environmental characteristics. Mohammed et al. [52] estimated the risk of soil erosion in southern Syria based on RUSLE, and observed that the average soil erosion rate was 137.4 t hm−1 y−1 in the region. The soil erosion was serious in 5% of the region, which contributed to most of the soil erosion. The remaining 95% of the region was in an acceptable range of erosion rates, that is, the SWCR in the region was 95%. The results reported by Vijith et al. [53] showed the average soil erosion rate in a selected region in the tropical forests of the Baram River basin, Sarawak, Malaysia and indicated that the soil erosion rate increased from 4.02 t hm−1 y−1 in 1991 to 24.24 t hm−1 y−1 in 2015, and the area ratio of a low soil erosion intensity to the study area decreased from 84.2% to 12.7%. In other words, the SWCR reduced by approximately 70%. Singh and Panda’s [54] study showed that in a small agricultural watershed of eastern India, the average soil erosion rate was 3.68 t hm−1 y−1, and the SWCR was 82.63%. Ostovari’s [55] study of the Dembecha Watershed, Northwestern Ethiopia showed that the average soil erosion rate was 5.7 t hm−1 y−1 and the SWCR was 73.64%. The threshold of soil loss tolerance in the first three articles was 5 t hm−1 y−1, while in the last it was 12 t hm−1 y−1. It can be seen from the above existing studies that there are similar soil erosion rates in different regions, but their SWCRs may be very different. Different regions have different soil loss tolerances due to environmental differences (the lithology, climate, and weathering, etc.); therefore, it may be inaccurate to adopt a unified evaluation standard to assess the SWCR in a large area. In the Guizhou Province, karst landforms have a wide distribution, which are characterized by a slow soil formation rate (slower than 10–40 times compared to non-karst areas) [28], shallow soil layers and serious rock desertification. In some areas with serious rock desertification, there is no soil to erode, so that the soil erosion in these areas will be overestimated more or less [43,47]. Due to the existence of a special surface and underground dual three-dimensional hydrological structure in karst areas, the coexistence of surface and underground erosion also affects the accuracy of the RUSLE simulation results in those karst areas to a certain extent [10,25], but the underground soil erosion in karst areas is very light (with a sediment concentration less than 0.05 g/L) [56]. In a large region, the underground soil erosion is less than 5% of the total soil erosion [57]; therefore, the effect of underground soil erosion on karst soil erosion is slight at a regional scale. In order to make the study results more reliable, this study adopted different soil erosion classification standards for the karst regions and non-karst regions, and calculated and analyzed the differences in soil erosion and SWCR between the karst regions and non-karst regions, which had more reference value for the evaluation of the soil and water conservation in this area.

4.2. The Main Effect Factors of Soil Erosion Change

This study used the method of assigning values according to the land use types to generate the p value data layer; therefore, the p value was closely related to the land use. If the low p value land area, such as the Impervious surface increased, this would drive p value decreases and if a high p value land class, such as Woodlands increased, this would drive an increase in p value. Different from the R factor and C factor, it is difficult to observe the spatial pattern of a p factor change under the global perspective of the scale of this study; therefore, it was necessary to analyze the p value change with the help of the land cover change.
The analysis of land use changes (Table 8) shows that the Woodlands had the largest increased area and it was mainly transformed from a Transitional woodland-shrub, Sparse vegetation land and Cropland. This was related to the implementation of ecological restoration measures since 2000 in the Guizhou Province, such as the Green for Grain Project and Hillsides Enclosure for Afforestation Project, that have achieved remarkable results; thus, the area of Woodlands increased significantly.
According to the method of assigning the p value to land cover in this paper, Impervious surfaces such as buildings were considered to have no erosion, and their p value was 0; areas with better vegetation such as Woodlands were considered to have no soil and water conservation measures, and their p value was the largest (p = 1). The increase in Woodlands area would inevitably lead to an increase in p value; however, the p value decreased during S1 to S4. This is because when the Woodlands area was increasing due to an ecological restoration project, the social economy of the Guizhou Province was also developing rapidly, the urbanization process and urban expansion were also in rapid progress, and the investment in road transportation infrastructure was increasing, thus leading to a rapid increase in the Impervious surface areas such as buildings and roads during this period. During the study period, a total of 1521.49 km2 was converted to Impervious surfaces, which was only less than the amount of Woodlands, Transitional woodland-shrub and Cropland. Although the transfer-in amount of Impervious surface was less than that of the high p value land such as the Woodlands, most of the Woodlands was from Transitional woodland-shrub land and Sparse vegetation land. The Transitional woodland-shrubs had the same p value as the Woodlands, so that this type of land use change did not lead to a p value change; however, the p values changed during the transfer-in of Impervious surfaces, and the change rate of the p value per unit area was large with a change from Woodlands to Impervious surfaces, i.e., the response of the p value to an Impervious surface change was more sensitive than that of the Woodlands. In Table 8, the red numbers represent the area of p value increases due to land use change (6129.24 km2), and the blue numbers represent the area of p value decreases (6970.12 km2). The area of the decreasing part of the p value was large; therefore, the average p value showed a decreasing trend.
The increase in Impervious surfaces increased the area of slight erosion to some extent; however, we cannot posit that urban expansion inhibits the occurrence of soil erosion, because the area of soil erosion rate decline caused by the above reasons was 1520.75 km2, which only accounted for 0.67% of the total area of the soil erosion rate decline in this period. Due to the limited update frequency of the data, we believe that the terrain and soil did not change in the short term; therefore, only rainfall, vegetation cover and land use change were the main factors causing soil erosion change. During the study period, the rainfall erosivity generally increased due to global climate change, while the soil erosion continued to decrease. This indicates that there were important soil erosion inhibitory factors. Although the increase in Impervious surfaces led to a decrease in soil erosion, this was insignificant. It can be seen from Table 8 that the transfer amount of Woodlands was the largest, and the increase in Woodlands represents the improvement in vegetation; hence, the decrease in the soil erosion rate in the study area was attributed to an improvement in the vegetation status, which inhibited the occurrence and development of soil erosion. With the gradual improvement in the vegetation conditions, the vegetation cover continued to increase, and its inhibition of soil erosion became more prominent.
From 2000 to 2019, although the soil erosion intensity decreased overall, a part of the region increased in each period, with the increased area distributed in the central, southeast and eastern regions of the study area (Figure 9). This is related to vegetation destruction and land cover change due to rapid urbanization and the increasing intensity of human activities, such as production and construction projects in the recent years. An increase in the rainfall erosivity due to climate change also played a role. The appearance of patchy soil erosion areas was related to the destruction of the original vegetation in the process of urbanization, which was similar to the results obtained by Li et al. [41]. In the S3 and S4 periods, 38.83% and 36.46%, respectively, of the regions with an increased erosion intensity grade were the regions which had a downgraded soil erosion intensity in the previous period. This phenomenon (an erosion intensity downgrade and then an upgrade again) reflects the vulnerability of the ecological environment in the karst areas. The reasons for the above phenomena are as follows: although the vegetation coverage is relatively high in this region and most of the vegetation is in good condition, the soil erodibility factors in this region are distributed in a large part of the area with medium and high values, and the soil is easily eroded by rainfall. In addition, the terrain in this part of the region is complex, with the elevation rising from the east to the west, a steep slope and a relatively large slope length value, which results in a large slope length factor value, and which provides good topographic conditions for the occurrence of soil erosion. Moreover, from 2000 to 2019, the rainfall erosivity in the Guizhou Province showed a trend of decreasing first and then increasing, and the eastern part of the Guizhou Province was located in the high value distribution area of rainfall erosivity, which provided strong external force conditions for the occurrence of soil erosion in this region. Due to rapid urban expansion in recent years, the NDVI value representing the vegetation status in the urban and surrounding areas of the study area decreased sharply. The changes of the above conditions have formed a certain number of sensitive areas prone to soil erosion in the study area and as long as the vegetation status deteriorates or land use changes, it is highly likely to cause soil erosion in those areas without soil erosion and to increase the intensity of soil erosion in the areas where soil erosion has already occurred. This shows that the work of soil and water conservation has achieved success in this period, but that it is still necessary to strengthen the existing achievements.

5. Conclusions

Soil erosion in the Guizhou province from 2000 to 2019 was calculated based on the RUSLE method. During the study periods, the soil erosion intensity continued to decline, the SWCR increased gradually except for the S3 period (2010–2014), the soil erosion had obtained control, and the ecological environment gradually improved. The current value of the SWCR is 35.31%.
The distribution of soil erosion in Guizhou mainly presents the pattern of a western high and southeast low, and the soil and water conservation condition in the non-karst area overall is better than that of the karst area. The non-karst area is mainly characterized by slight erosion and light erosion, and the area above the moderate erosion grade only accounts for 2.39–2.72% of the total area of the study area. The area above moderate erosion in the karst area is relatively large, accounting for 30.59–37.50% of the study area.
From 2000 to 2019, a soil erosion intensity of 22.30% of the whole province was a downgrade, and that of 11.99% was an upgrade; thus, there exists the phenomenon of an erosion intensity downgrade and then an upgrade. The downgrade regions are distributed all over the province, and the significant downgrade regions are mainly distributed in the western part of the Guizhou Province. Meanwhile, the upgrade areas are scattered in the central, eastern and southeastern parts of the Guizhou Province. Most of the upgrade areas are distributed in sensitive areas prone to soil erosion; therefore, the supervision and management of soil and water conservation in those sensitive areas should be strengthened.

Author Contributions

Conceptualization, L.Z. and F.F.; methodology, F.F.; software, W.Y.; validation, Q.F., C.F. and R.Z.; formal analysis, Q.F.; investigation, Q.F.; resources, F.F.; data curation, F.F.; writing—original draft preparation, F.F.; writing—review and editing, F.F., Q.F. and L.Z.; visualization, F.F.; supervision, L.Z.; project administration, L.Z.; funding acquisition, L.Z. All authors have read and agreed to the published version of the manuscript.

Funding

This research was funded by the Science and Technology Project of Guizhou Province of China (QKHZC [2022]YB202) and the Project for Talented Young Scientists of Guizhou Province of China (QJHKYZ [2021]025).

Institutional Review Board Statement

Not applicable.

Informed Consent Statement

Not applicable.

Data Availability Statement

Data are available upon request from the corresponding author.

Conflicts of Interest

The authors declare no conflict of interest.

References

  1. Alewell, C.; Ringeval, B.; Ballabio, C.; Robinson, D.A.; Panagos, P.; Borrelli, P. Global Phosphorus Shortage Will Be Aggravated by Soil Erosion. Nat. Commun. 2020, 11, 4546. [Google Scholar] [CrossRef] [PubMed]
  2. Ayoubi, S.; Rabiee, S.; Mosaddeghi, M.R.; Abdi, M.R.; Abbaszadeh Afshar, F. Soil Erosion and Properties as Affected by Fire and Time after Fire Events in Steep Rangelands Using 137Cs Technique. Arab. J. Geosci. 2021, 14, 113. [Google Scholar] [CrossRef]
  3. Keesstra, S.; Mol, G.; De Leeuw, J.; Okx, J.; Molenaar, C.; De Cleen, M.; Visser, S. Soil-Related Sustainable Development Goals: Four Concepts to Make Land Degradation Neutrality and Restoration Work. Land 2018, 7, 133. [Google Scholar] [CrossRef] [Green Version]
  4. Ayoubi, S.; Mokhtari, J.; Mosaddeghi, M.R.; Zeraatpisheh, M. Erodibility of Calcareous Soils as Influenced by Land Use and Intrinsic Soil Properties in a Semiarid Region of Central Iran. Environ. Monit. Assess. 2018, 190, 192. [Google Scholar] [CrossRef]
  5. Amundson, R.; Berhe, A.A.; Hopmans, J.W.; Olson, C.; Sztein, A.E.; Sparks, D.L. Soil Science. Soil and Human Security in the 21st Century. Science 2015, 348, 1261071. [Google Scholar] [CrossRef] [PubMed] [Green Version]
  6. Li, Z.; Cao, W.; Liu, B.; Luo, Z. Current status and developing trend of soil erosion in China. Sci. Soil Water Conserv. 2008, 6, 57–62. [Google Scholar] [CrossRef]
  7. Liu, B.; Xie, Y.; Li, Z.; Liang, Y.; Zhang, W.; Fu, S.; Yin, S.; Wei, X.; Zhang, K.; Wang, Z.; et al. The Assessment of Soil Loss by Water Erosion in China. Int. Soil Water Conserv. Res. 2020, 8, 430–439. [Google Scholar] [CrossRef]
  8. Rao, E.; Xiao, Y.; Ouyang, Z.; Yu, X. National Assessment of Soil Erosion and Its Spatial Patterns in China. Ecosyst. Health Sustain. 2015, 1, 1–10. [Google Scholar] [CrossRef] [Green Version]
  9. Jiang, Z.; Lian, Y.; Qin, X. Rocky Desertification in Southwest China: Impacts, Causes, and Restoration. Earth-Sci. Rev. 2014, 132, 1–12. [Google Scholar] [CrossRef]
  10. Chen, H.S.; Feng, T.; Li, C.Z.; Fu, Z.Y.; Lian, J.J.; Wang, K.L. Characteristic of soil erosion in karst region of southwest China: Research advance and prospective. J. Soil Water Conserv. 2018, 32, 10–16. [Google Scholar] [CrossRef]
  11. Wang, S.-J.; Liu, M.; Zhang, D.-F. Karst Rocky Desertification in Southwestern China: Geomorphology, Landuse, Impact and Rehabilitation. Land Degrad. Dev. 2004, 15, 115–121. [Google Scholar] [CrossRef]
  12. Cao, J.H.; Jiang, Z.C.; Yang, D.S.; Pei, J.G.; Yang, H.; Luo, W.Q. Grading of soil erosion intensity in southwest karst area of China. Sci. Soil Water Conserv. 2008, 6, 1–7, 20. [Google Scholar] [CrossRef]
  13. Zhang, X.B.; Wang, S.J.; Cao, J.H.; Wang, K.L.; Meng, T.Y.; Bai, X.Y. Characteristics of water loss and soil erosion and some scientific problems on karst rocky desertification in Southwest China karst area. Carsologica Sin. 2010, 29, 274–279. [Google Scholar]
  14. Pu, C.Y. Scientific determination and application of soil and water conservation rate. Soil Water Conserv. China 2021, 1–3. [Google Scholar] [CrossRef]
  15. Renard, K.G.; Foster, G.R.; Weesies, G.A.; Mccool, D.K.; Yoder, D.C. Predicting Soil Erosion by Water: A Guide to Conservation Planning with the Revised Universal Soil Loss Equation (RUSLE). In Agriculture Handbook No. 703; U.S. Department of Agriculture (USDA): Washington, DC, USA, 1997. [Google Scholar]
  16. Nearing, M.; Foster, G.R.; Lane, L.J.; Finkner, S.C. A Process-Based Soil Erosion Model for USDA-Water Erosion Prediction Project Technology. Trans. ASAE 1989, 32, 1587–1593. [Google Scholar] [CrossRef]
  17. Liu, B.Y.; Zhang, K.L.; Xie, Y. An Empirical Soil Loss Equation. In Proceedings of the 12th ISCO Conference, Beijing, China, 26–29 May 2002; pp. 21–25. [Google Scholar]
  18. Morgan, R.P.C.; Quinton, J.N.; Smith, R.E.; Govers, G.; Poesen, J.W.A.; Auerswald, K.; Chisci, G.; Torri, D.; Styczen, M.E. The European Soil Erosion Model (EUROSEM): A Dynamic Approach for Predicting Sediment Transport from Fields and Small Catchments. Earth Surf. Process. Landf. 1998, 23, 527–544. [Google Scholar] [CrossRef]
  19. Borrelli, P.; Alewell, C.; Alvarez, P.; Ayach Anache, J.A.; Baartman, J.; Ballabio, C.; Bezak, N.; Biddoccu, M.; Cerda, A.; Chalise, D.; et al. Soil Erosion Modelling: A Global Review and Statistical Analysis. Sci. Total Environ. 2021, 780, 146494. [Google Scholar] [CrossRef]
  20. Alewell, C.; Borrelli, P.; Meusburger, K.; Panagos, P. Using the USLE: Chances, Challenges and Limitations of Soil Erosion Modelling. Int. Soil Water Conserv. Res. 2019, 7, 203–225. [Google Scholar] [CrossRef]
  21. Karamage, F.; Zhang, C.; Liu, T.; Maganda, A.; Isabwe, A. Soil Erosion Risk Assessment in Uganda. Forests 2017, 8, 52. [Google Scholar] [CrossRef]
  22. Panagos, P.; Borrelli, P.; Poesen, J.; Ballabio, C.; Lugato, E.; Meusburger, K.; Montanarella, L.; Alewell, C. The New Assessment of Soil Loss by Water Erosion in Europe. Environ. Sci. Policy 2015, 54, 438–447. [Google Scholar] [CrossRef]
  23. Borrelli, P.; Robinson, D.A.; Fleischer, L.R.; Lugato, E.; Ballabio, C.; Alewell, C.; Meusburger, K.; Modugno, S.; Schuett, B.; Ferro, V.; et al. An Assessment of the Global Impact of 21st Century Land Use Change on Soil Erosion. Nat. Commun. 2017, 8, 2013. [Google Scholar] [CrossRef] [PubMed] [Green Version]
  24. Borrelli, P.; Robinson, D.A.; Panagos, P.; Lugato, E.; Yang, J.E.; Alewell, C.; Wuepper, D.; Montanarella, L.; Ballabio, C. Land Use and Climate Change Impacts on Global Soil Erosion by Water (2015–2070). Proc. Natl. Acad. Sci. USA. 2020, 117, 21994–22001. [Google Scholar] [CrossRef] [PubMed]
  25. Ma, Q.H.; Zhang, K.L. Progresses and prospects of the research on soil erosion in karst area of southwest China. Adv. Earth Sci. 2018, 33, 1130–1141. [Google Scholar] [CrossRef]
  26. Chen, H.; Takashi, O.; Wu, P. Assessment for Soil Loss by Using a Scheme of Alterative Sub-Models Based on the RUSLE in a Karst Basin of Southwest China. J. Integr. Agric. 2017, 16, 377–388. [Google Scholar] [CrossRef] [Green Version]
  27. Wang, H.; Gao, J.B.; Hou, W.J. Quantitative attribution analysis of soil erosion in different morphological types of geomorphology in karst areas: Based on the geographical detector method. Acta Geogr. Sin. 2018, 73, 1674–1686. [Google Scholar] [CrossRef]
  28. Wang, K.; Zhang, C.; Chen, H.; Yue, Y.; Zhang, W.; Zhang, M.; Qi, X.; Fu, Z. Karst Landscapes of China: Patterns, Ecosystem Processes and Services. Landsc. Ecol. 2019, 34, 2743–2763. [Google Scholar] [CrossRef] [Green Version]
  29. Xiong, K.N.; Li, J.; Long, M.Z. Features of soil and water loss and key issues in demonstration areas for combating karst rocky desertification. Acta Geogr. Sin. 2012, 67, 878–888. [Google Scholar] [CrossRef]
  30. Zhang, X.; Liu, L.; Chen, X.; Gao, Y.; Xie, S.; Mi, J. GLC_FCS30: Global Land-Cover Product with Fine Classification System at 30m Using Time-Series Landsat Imagery. Earth Syst. Sci. Data 2021, 13, 2753–2776. [Google Scholar] [CrossRef]
  31. Yu, B.; Rosewell, C.J. An Assessment of a Daily Rainfall Erosivity Model for New South Wales. Aust. J. Soil Res. 1996, 34, 139–152. [Google Scholar] [CrossRef]
  32. Xie, Y.; Yin, S.; Liu, B.; Nearing, M.A.; Zhao, Y. Models for Estimating Daily Rainfall Erosivity in China. J. Hydrol. 2016, 535, 547–558. [Google Scholar] [CrossRef] [Green Version]
  33. Zhu, D.; Xiong, K.; Xiao, H. Multi-Time Scale Variability of Rainfall Erosivity and Erosivity Density in the Karst Region of Southern China, 1960–2017. Catena 2021, 197, 104977. [Google Scholar] [CrossRef]
  34. Zhang, K.L.; Shu, A.P.; Xu, X.L.; Yang, Q.K.; Yu, B. Soil Erodibility and Its Estimation for Agricultural Soils in China. J. Arid Environ. 2008, 72, 1002–1011. [Google Scholar] [CrossRef]
  35. Zhang, K.; Yu, Y.; Dong, J.; Yang, Q.; Xu, X. Adapting & Testing Use of USLE K Factor for Agricultural Soils in China. Agric. Ecosyst. Environ. 2019, 269, 148–155. [Google Scholar] [CrossRef]
  36. Sharpley, A.N.; Williams, J.R. EPIC Erosion/Productivity Impact Calculator: 1. Model Documentation; U.S. Department of Agriculture Technical Bulletin No. 1768: Washington DC, USA, 1990.
  37. Shirazi, M.A.; Boersma, L. A Unifying Quantitative Analysis of Soil Texture. Soil Sci. Soc. Am. J. 1984, 48, 142–147. [Google Scholar] [CrossRef]
  38. Zhang, H.; Yang, Q.; Li, R.; Liu, Q.; Moore, D.; He, P.; Ritsema, C.J.; Geissen, V. Extension of a GIS Procedure for Calculating the RUSLE Equation LS Factor. Comput. Geosci. 2013, 52, 177–188. [Google Scholar] [CrossRef]
  39. McCool, D.K.; Brown, L.C.; Foster, G.R.; Mutchler, C.K.; Meyer, L.D. Revised Slope Steepness Factor for the Universal Soil Loss Equation. Trans. ASAE 1987, 30, 1387–1396. [Google Scholar] [CrossRef]
  40. Liu, B.; Nearing, M.; Risse, M. Slope Gradient Effects on Soil Loss for Steep Slopes. Trans. ASAE 1994, 37, 1835–1840. [Google Scholar] [CrossRef]
  41. Li, J.L.; Sun, R.H.; Xiong, M.Q.; Yang, G.C. Estimation of soil erosion based on the RUSLE model in China. Acta Ecol. Sin. 2020, 40, 3473–3485. [Google Scholar] [CrossRef]
  42. Cai, C.F.; Ding, S.W.; Shi, Z.H.; Huang, L.; Zhang, G.Y. Application of USLE model and geographic information IDRISI to predict soil erosion in small watersheds. J. Soil Water Conserv. 2000, 14, 19–24. [Google Scholar] [CrossRef]
  43. Zeng, C.; Wang, S.; Bai, X.; Li, Y.; Tian, Y.; Li, Y.; Wu, L.; Luo, G. Soil Erosion Evolution and Spatial Correlation Analysis in a Typical Karst Geomorphology Using RUSLE with GIS. Solid Earth 2017, 8, 721–736. [Google Scholar] [CrossRef] [Green Version]
  44. Niu, L.; Shao, Q. Soil Conservation Service Spatiotemporal Variability and Its Driving Mechanism on the Guizhou Plateau, China. Remote Sens. 2020, 12, 2187. [Google Scholar] [CrossRef]
  45. Xiong, M.; Sun, R.; Chen, L. Global Analysis of Support Practices in USLE-Based Soil Erosion Modeling. Prog. Phys. Geogr.-Earth Environ. 2019, 43, 391–409. [Google Scholar] [CrossRef]
  46. Feng, T.; Polyakov, V.; Wang, K.-L.; Zhang, X.; Zhang, W. Soil Erosion Rates in Two Karst Peak-Cluster Depression Basins of Northwest Guangxi, China: Comparison of the RUSLE Model with 137Cs Measurements. Geomorphology 2016, 253, 217–224. [Google Scholar] [CrossRef]
  47. Gao, J.; Wang, H. Temporal Analysis on Quantitative Attribution of Karst Soil Erosion: A Case Study of a Peak-Cluster Depression Basin in Southwest China. Catena 2019, 172, 369–377. [Google Scholar] [CrossRef]
  48. Xu, Y.; Luo, D.; Peng, J. Land Use Change and Soil Erosion in the Maotiao River Watershed of Guizhou Province. J. Geogr. Sci. 2011, 21, 1138–1152. [Google Scholar] [CrossRef]
  49. Wang, S.J.; Ji, H.B.; Ouyang, Z.Y.; Zhou, D.Q.; Zheng, L.P.; Li, T.Y. A preliminary study of weathering into soil of carbonate rocks. Sci. China Ser. 1999, 29, 441–449. [Google Scholar] [CrossRef]
  50. Qian, Q.H.; Wang, S.J.; Bai, X.Y.; Zhou, D.Q.; Tian, Y.C.; Li, Q.; Wu, L.H.; Xiao, J.Y.; Zeng, C.; Chen, F. Assessment of soil erosion in karst critical zone based on soil loss tolerance and source-sink theory of positive and negative terrains. Acta Geogr. Sin. 2018, 73, 2135–2149. [Google Scholar] [CrossRef]
  51. Cao, Y.; Wang, S.J.; Bai, X.Y.; Li, H.W.; Chen, F.; Wang, M.M.; Wu, L.H.; Xu, Y.; Li, Q.; Tian, S.Q.; et al. Spatial-temporal evolution processes and simulation of future soil erosion scenario in the karst valley of southern China. Acta Ecol. Sin. 2019, 39, 6061–6071. [Google Scholar] [CrossRef]
  52. Mohammed, S.; Alsafadi, K.; Talukdar, S.; Kiwan, S.; Hennawi, S.; Alshihabi, O.; Sharaf, M.; Harsanyie, E. Estimation of Soil Erosion Risk in Southern Part of Syria by Using RUSLE Integrating Geo Informatics Approach. Remote Sens. Appl. Soc. Environ. 2020, 20, 100375. [Google Scholar] [CrossRef]
  53. Vijith, H.; Dodge-Wan, D. Spatio-Temporal Changes in Rate of Soil Loss and Erosion Vulnerability of Selected Region in the Tropical Forests of Borneo during Last Three Decades. Earth Sci. Inform. 2018, 11, 171–181. [Google Scholar] [CrossRef]
  54. Singh, G.; Panda, R.K. Grid-Cell Based Assessment of Soil Erosion Potential for Identification of Critical Erosion Prone Areas Using USLE, GIS and Remote Sensing: A Case Study in the Kapgari Watershed, India. Int. Soil Water Conserv. Res. 2017, 5, 202–211. [Google Scholar] [CrossRef]
  55. Ostovari, Y.; Ghorbani-Dashtaki, S.; Bahrami, H.-A.; Naderi, M.; Dematte, J.A.M. Soil Loss Estimation Using RUSLE Model, GIS and Remote Sensing Techniques: A Case Study from the Dembecha Watershed, Northwestern Ethiopia. Geoderma Reg. 2017, 11, 28–36. [Google Scholar] [CrossRef]
  56. Fang, Q.; Zhao, L.; Hou, R.; Fan, C.; Zhang, J. Rainwater Transformation to Runoff and Soil Loss at the Surface and Belowground on Soil-Mantled Karst Slopes under Rainfall Simulation Experiments. CATENA 2022, 215, 106316. [Google Scholar] [CrossRef]
  57. Wei, X.; Yan, Y.; Xie, D.; Ni, J.; Loáiciga, H.A. The Soil Leakage Ratio in the Mudu Watershed, China. Environ. Earth Sci. 2016, 75, 721. [Google Scholar] [CrossRef]
Figure 1. Locations, karst distributions, and weather stations distributions of the study area.
Sustainability 14 08219 g001
Figure 2. Spatial distribution of rainfall erosivity in Guizhou Province from 2000 to 2019. (a) S1; (b) S2; (c) S3; (d) S4.
Sustainability 14 08219 g002
Figure 3. Spatial distribution of C factor in Guizhou Province from 2000 to 2019. (a) S1; (b) S2; (c) S3; (d) S4.
Sustainability 14 08219 g003
Figure 4. Spatial distribution and the change in p factor in Guizhou Province. (a) P_S4; (b) S1 to S4.
Sustainability 14 08219 g004
Figure 5. Spatial distribution of LS factor and K factor in Guizhou Province. (a) LS factor; (b) K factor.
Sustainability 14 08219 g005
Figure 6. Proportions of different soil erosion intensity grades in karst area and non-karst areas of Guizhou Province from 2000 to 2019.
Sustainability 14 08219 g006
Figure 7. Transfer matrix of soil erosion intensity in Guizhou Province from 2000 to 2019. (a) S1–S2; (b) S2–S3; (c) S3–S4; (d) S1–S4.
Sustainability 14 08219 g007
Figure 8. Spatial distribution of soil erosion intensity grade in Guizhou Province from 2000 to 2019. (a) S1; (b) S2; (c) S3; (d) S4.
Sustainability 14 08219 g008
Figure 9. Changes in soil erosion intensity in Guizhou Province from 2000 to 2019.
Sustainability 14 08219 g009
Table 1. Basic data.
Data TypeAccuracySourceDataset Name
Daily rainfall dataset from 2000 to 2019-China Meteorological Data Service Centre (http://data.cma.cn/, accessed on 9 July 2021)Daily data set of Surface climatic data in China
Land cover dataset from 2000 to 202030 mEarth big data science and engineering data sharing service system (https://data.casearth.cn/, accessed on 21 March 2022)GLC_FCS30-1985_2020 [30]
Normalized vegetation index from 2000 to 2020250 m(https://earthexplorer.usgs.gov/, accessed on 9 April 2022)MOD13Q1 V61
Soil dataset250 mFAQ SoilGrids (https://www.isric.org/explore/soilgrids/faq-soilgrids, accessed on 15 February 2022)FAQ SoilGrids
Digital elevation model12.5 mAlaska Satellite Facility Distributed Active Archive Centers (ASF DAAC) (https://search.asf.alaska.edu/#, accessed on 7 December 2021)ALOS PALSAR 12.5 m DEM
Karst distribution-Karst Data Center, Chinese Academy of Sciences (http://www.karstdata.cn/, accessed on 22 January 2021)Karst types and distribution map in Guizhou 1
1 Karst distribution data are scanned image files in the format of .jpg, which need to be geographically registered and vectorized.
Table 2. Values of C-factor for the non-agricultural land.
GroupCNA
Woodlands0.0001–0.003
Shrublands and grasslands0.01–0.15
Transitional woodland-shrub0.01–0.15
Barren or sparsely vegetated0.1–0.5
Water body and Impervious surfacesNodata
others1
Note: In order to avoid the conflict between land type and vegetation coverage caused by different data sources (for example, the original land cover is Woodlands, but the FVC calculated by NDVI is extreme low), the original land type was fine-tuned in combination with the land type and FVC. Woodlands, Shrublands and Grasslands with an FVC less than 0.15 were modified as Sparsely vegetated, Woodlands with an FVC between 0.15 and 0.4 were modified as Transitional woodland-shrub, and Sparsely vegetated with an FVC greater than 0.15 was modified as Sparsely vegetated or Shrublands.
Table 3. Soil erosion intensity grading in the study area (unit: t hm−2 y−1).
Slight
Erosion
Light
Erosion
Moderate
Erosion
Intense ErosionExtremely Intense ErosionSevere
Erosion
Non-karst area<55~2525~5050~8080~150>150
Karst area<0.50.5~33~1515~3030~60>60
Table 4. Average soil erosion rate in the study area.
IndicatorsRegionArea fraction (%)2000–20042005–20062010–20142015–2019
Soil erosion rate
(t hm−2 y−1)
Non-karst area29.9711.3411.4610.749.84
Karst area70.0315.0912.8413.7511.26
Total100.0013.9712.4312.8510.83
Table 5. The proportions of soil erosion intensity grade change in the study area (%).
Type of Erosion Intensity Grade ChangeStage
S1–S2S2–S3S3–S4S1–S4
Grade constant73.3375.9873.3365.71
Upgrade9.0414.2710.1811.99
Sequential upgrading6.9411.068.608.74
Across-grade upgrading2.093.211.583.25
Downgrade17.639.7516.4922.30
Sequentially downgrading12.987.3911.6414.52
Across-grade downgrading4.652.364.857.79
Table 6. Average soil erosion rate and soil and water conservation ratio in the study area.
IndicatorsRegionArea Fraction (%)2000–20042005–20062010–20142015–2019
Soil and water
conservation ratio (SWCR) (%)
Non-karst area29.9770.8773.5572.6273.99
Karst area70.0316.7218.7317.5418.75
Total100.0032.9535.1634.0535.31
Table 7. Obtained previous research data.
Study AreaTimescaleErosion Rate
(hm−2 y−1)
Soil and Water
Conservation Ratio (%)
Reference
Yinjiang County, Guizhou Province200025.09 Zeng et al. (2017) [43]
200521.53
201318.84
Sanchahe River Basin,
Guizhou Province
201011.37 Wang et al. (2018) [27]
201512.22 Gao et al. (2019) [47]
Maotiaohe river basin, Guizhou Province200228.2 Xu et al. (2011) [48]
200726.37
South China201524.73 Qian et al. (2018) [50]
Mawoshan Karst Basin in northwest Guizhou1980–200030.24 Chen et al. (2017) [26]
Karst trough valley200021.61 Cao et al. (2019) [51]
20055.76
20105.57
20151.04
Guizhou Province2000–201810.51 Niu et al. (2020) [44]
Guizhou Province2000–200514.3258.46The proclamation of soil and water loss in Guizhou Province
2006–201013.6168.63
2011–2015 72.29
2018 72.60
2019 72.92
Guizhou Province2000–200413.9462.78This study 1
2005–200912.4367.84
2010–201412.8565.15
2015–201910.8370.49
1 In order to make them comparable, the soil and water conservation ratios listed in this table are based on (SL 190-2007) only, the same as the proclamation of soil and water loss in Guizhou Province.
Table 8. Land cover transfer matrix in the S1–S4 periods (unit: km2).
S1\S4ISWBICRCBAWLSVGLSLTWSLWoLTotal
IS-0.3966.16104.57002.458.040.041.061.00183.71
WB0.78-10.318.4800.0010.322.690.056.958.1647.73
IC167.7012.93-660.5600.007.383.660.8510.8519.89883.84
RC1161.4476.27836.46-0.000.01240.42382.76325.03916.123331.417269.92
BA0.00000.01-000.010000.02
WL0.00000.000-0.0000000.01
SV23.2219.1712.27387.170.000-129.1216.612028.221786.264402.04
GL86.096.024.29368.560.000.0038.72-1.69129.92304.56939.86
SL0.330.330.46169.59004.511.26-44.12806.931027.53
TWSL38.6517.0124.141310.2200663.84197.94137.13-15,895.6518,284.57
WoL43.2834.7037.282132.540.000.00258.24154.13886.602226.14-5772.92
Total1521.49166.81991.365141.700.010.011225.89879.621368.005363.3822,153.8738,812.14
Note: (IS: Impervious surfaces; WB: Water body; IC: Irrigated cropland; RC: Rainfed cropland; BA: Bare areas; WL: Wetlands; SV: Sparse vegetation; GL: Grassland; SL: Shrubland; TWSL: Transitional woodland-shrub; WoL: Woodlands) The red font represents the area of the type of change where p increased and the blue font represents the area of the type of change where p decreased.
Publisher’s Note: MDPI stays neutral with regard to jurisdictional claims in published maps and institutional affiliations.

