
Influences of Urban Bikeway Design and Land Use on Bike Collision Severity: Evidence from Pohang in South Korea


1
Department of Spatial Environment System Engineering, Handong Global University, 558, Buk-gu, Pohang 37554, Korea
2
Institute for Global Education, UNAI Korea, 325 Bongeunsa-ro, Gangnam-gu, Seoul 06103, Korea
*
Author to whom correspondence should be addressed.
Sustainability 2022, 14(14), 8397; https://0-doi-org.brum.beds.ac.uk/10.3390/su14148397
Submission received: 13 June 2022
/
Revised: 6 July 2022
/
Accepted: 7 July 2022
/
Published: 8 July 2022
(This article belongs to the Special Issue Tendencies and Strategies of Active Mobility to Promote Urban Sustainable Transportation Systems)
Abstract
:Since the COVID-19 pandemic significantly impacted mobility patterns, bicycle use and bikeway infrastructure have been spotlighted worldwide. Even before the pandemic, the Korean government expanded bike networks by enacting a national policy. However, issues with bikeway quality have grown significantly due to the excessive installation of bike infrastructure without due consideration given to land use and road conditions. This study aims to investigate bike collision severity based on various kinds of bikeways and land use data from Pohang city, which has a remarkably expanded bikeway network. Bike collision data were analyzed using binary logistic regression. The results indicate that collision severity is associated with the ineffective separation of bikeways, walkway design and pavement materials on side paths, uncleared bike lanes, and land use of planned parks and open spaces. Policymakers can consider these factors to enhance the safety of bikeway networks. These findings highlight the need for bikeway policy improvements for well-designed and managed paved bikeways, particularly on the side paths and in park areas, which ensure pedestrian and cyclist safety.
1. Introduction
Since the recent outbreak of COVID-19, serious concerns regarding public transportation have emerged, such as user density on metros and buses [1]. Recently, bicycle use has been underscored as the healthiest and most sustainable mode of transportation [2,3]. Bicycles have been receiving attention in sociocultural and environmental realms because they support pollution abatement, energy conservation, traffic control, and healthy lifestyles [4,5,6,7,8]. Thus, there is high demand for bicycle lane expansion worldwide and many cities plan to increase their construction: 50 km in Paris, France [9], 100 km in Liverpool, England [10], 40 km in Brussels, Belgium [11], 76 km in Bogota, Colombia, 21 km in Barcelona, Spain, 35 km in Milan, Italy, and 100 km in New York City, USA [12,13]. Seoul, the capital of South Korea, also announced a plan to expand its bikeway network by 390 km [13].
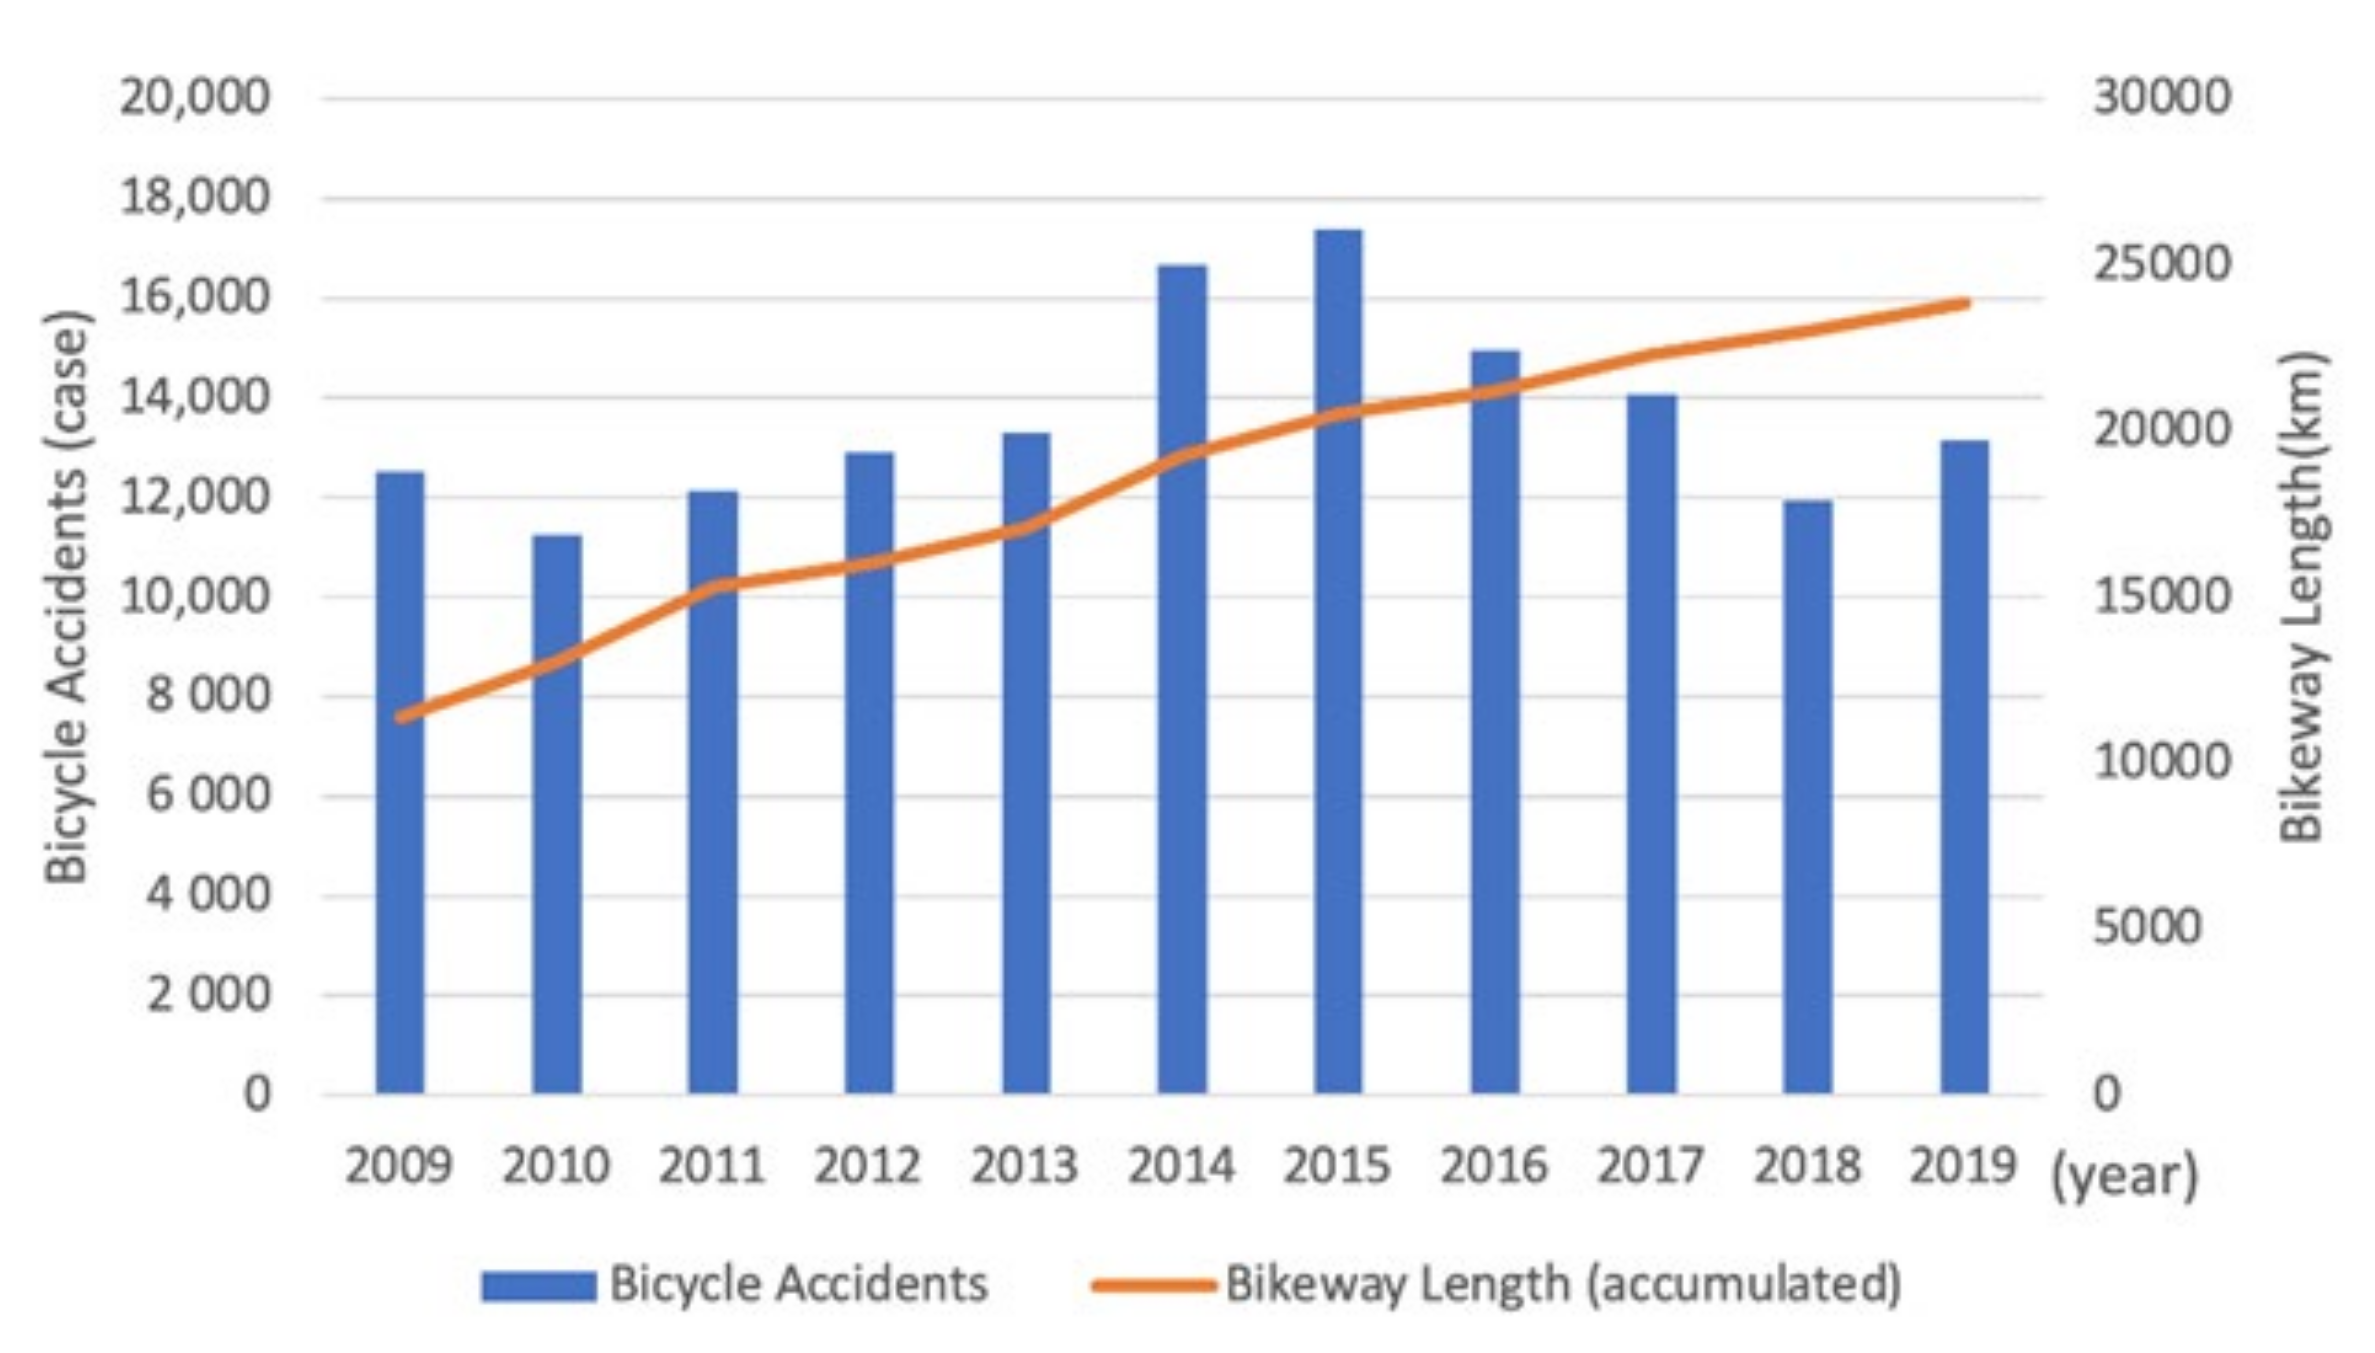
The 2009 public policy initiative of low-carbon green development encouraged bike use in South Korea, and subsequently the Master Plan of National Bicycle Policy (2010) and the Basic Plan of National Bikeways (2010) have been implemented. Most cities in South Korea have competitively expanded bikeway networks on urban and regional scales. Owing to the government’s efforts, nationwide bikeways more than doubled from 11,387 km in 2009 to 23,849 km in 2019. However, many cities have only concentrated on the quantitative expansion of the length of the bikeway network [14]. There was no consideration of existing roads, sidewalk conditions, and land use along anticipated bikeway installations. To construct more bike lanes, a part of or the entire sidewalk was converted to bike lanes with different pavement materials; thus, both pedestrians and cyclists were exposed to the danger of collisions and safety issues [15]. However, reports of collision have significantly increased in unorganized bikeways, which are forcefully installed on narrow roads and in residential and commercial areas. Other types of bikeways are not well-integrated with existing transportation systems, posing a serious safety threat to cyclists. The number of bike collisions was 7940 in 2005 and has steadily increased every year. The number of collisions increased to 17,366 cases in 2015 and approximately 13,157 collision cases were reported in 2019 (Figure 1).
Moreover, despite the remarkable expansion of bikeways, the modal share rate of bicycles in South Korea is only 1.6%, below that of the Netherlands (27%), which is a cycling country [16,17]. This result unequivocally shows that the expansion of bikeways is not sufficient to encourage bicycle use. The safety of the bikeway environment can encourage bicycle use as a primary means of commute or for recreational purposes [18]. Thus, it is time to establish delicate strategies for the qualitative improvement of bikeways to ensure cyclists’ safety and ultimately facilitate bicycle use. Consequently, the main objective of this study is to investigate the relationships between bikeway design factors and collision severity for cyclists through binary logistic regression analysis, and to suggest tactful bikeway planning for cyclists’ safety and the qualitative improvement of bikeways. Particularly, this study deals with land use as one of the significant independent factors of the binary logistic regression analysis to understand the comprehensive urban context in which bikeways have been constructed.
The originality of this study lies in spotlighting the design factors of bikeways that can improve the bikeway environment. Given that existing literature has mostly focused on cyclists’ demographical characteristics, cyclists’ behaviors, and road infrastructures, bikeway designs have not been sufficiently examined. Thus, this study can contribute to significant design guidelines for more comprehensive bikeway planning and design.
2. Literature Review
Several studies on bike collisions have been conducted around road intersections [19,20,21,22,23,24,25,26] as they are a common site for bike collisions. However, there is a difference between bike collisions at intersections and in single-road environments. While bike collisions on a single road usually depend on the bike infrastructure [27,28,29], collisions at intersections are significantly influenced by biker behaviors. Thus, the collision severity is less determined by bike infrastructure compared to external factors in the case of cars, such as the amount of traffic, speed, rotation type, and legal violations. This imposes a serious limitation on explaining single-road bike collisions. Thus, studies on such collisions could help expand existing literature.
Various environmental factor studies have been conducted in relation to bike collisions. Reportedly, bikers’ blood alcohol levels can affect the severity of biker injury during a collision [29]. Many collisions in Toronto and Vancouver occurred while opening the doors of cars parked along the street [30]. In a factor analysis of collision severity for 4961 cyclists in England, the main contributing factors were revealed as gender, age, weekly cycling distance, cycling experience, stopping behavior at red lights, and the frequency of using minor roads compared to major ones [31]. Poliziani et al. [32] classified cyclists in Bologna, Italy based on three characteristics: risky and hasty (RHC), inexperienced and inefficient (IIC), and sly and informed (SIC), and proved the relations between the three typologies of cyclists’ characteristics and route choices. Furthermore, Walker et al. [33] demonstrated the relations between the average waiting time of cyclists and the three behavioral typologies mentioned above. These results may imply that depending on cyclists’ characteristics, their travel route choice can be diffused, which is related to bike traffic and even collisions. Meanwhile, road infrastructure environments, such as road obstacles and pavement conditions were the main causes of biker collisions in Switzerland [34]. In the context of South Korea, weather; time; age; gender; collision types; land use; speed limit; riverside areas; separated bikeways; and road environments such as crosswalks, streetlights, and speed bump installations were influential factors for bike collision severity [35,36].
The contribution of this study is to especially focus on the design factors of bikeways to explain bicycle collision severity and suggest tactful bikeway planning strategies with design perspectives toward qualitative improvements and enhanced cyclist safety. While existing literature has extensively investigated the environmental determinants of the severity of bicycle collisions, few studies have examined the association between characteristics of bikeway designs and cyclist collisions. Since the necessity of separate bike lanes in most cities is debated [37], some scholars have also highlighted that bikeway planning should be critically integrated within the framework of urban traffic planning and management [38,39]. Moreover, Beyeon, Im, and Yun highlighted the necessity of land use patterns with different bikeway designs and typologies, because the bikeway environment is intermingled with road width, pedestrian density, the intensity of vehicle traffic, and the street environment, all of which are closely associated with land use patterns [40]. Therefore, this study also considers land use patterns as a significant factor to comprehensively discuss the relationships between bicycle collision severity and bikeway designs. Consequently, this study involves a binary logistic regression analysis to explore the correlation between bicycle collision severity and diverse independent variables including bikeway types and land use patterns.
3. Materials and Methods
3.1. Site Selection and Data Collection
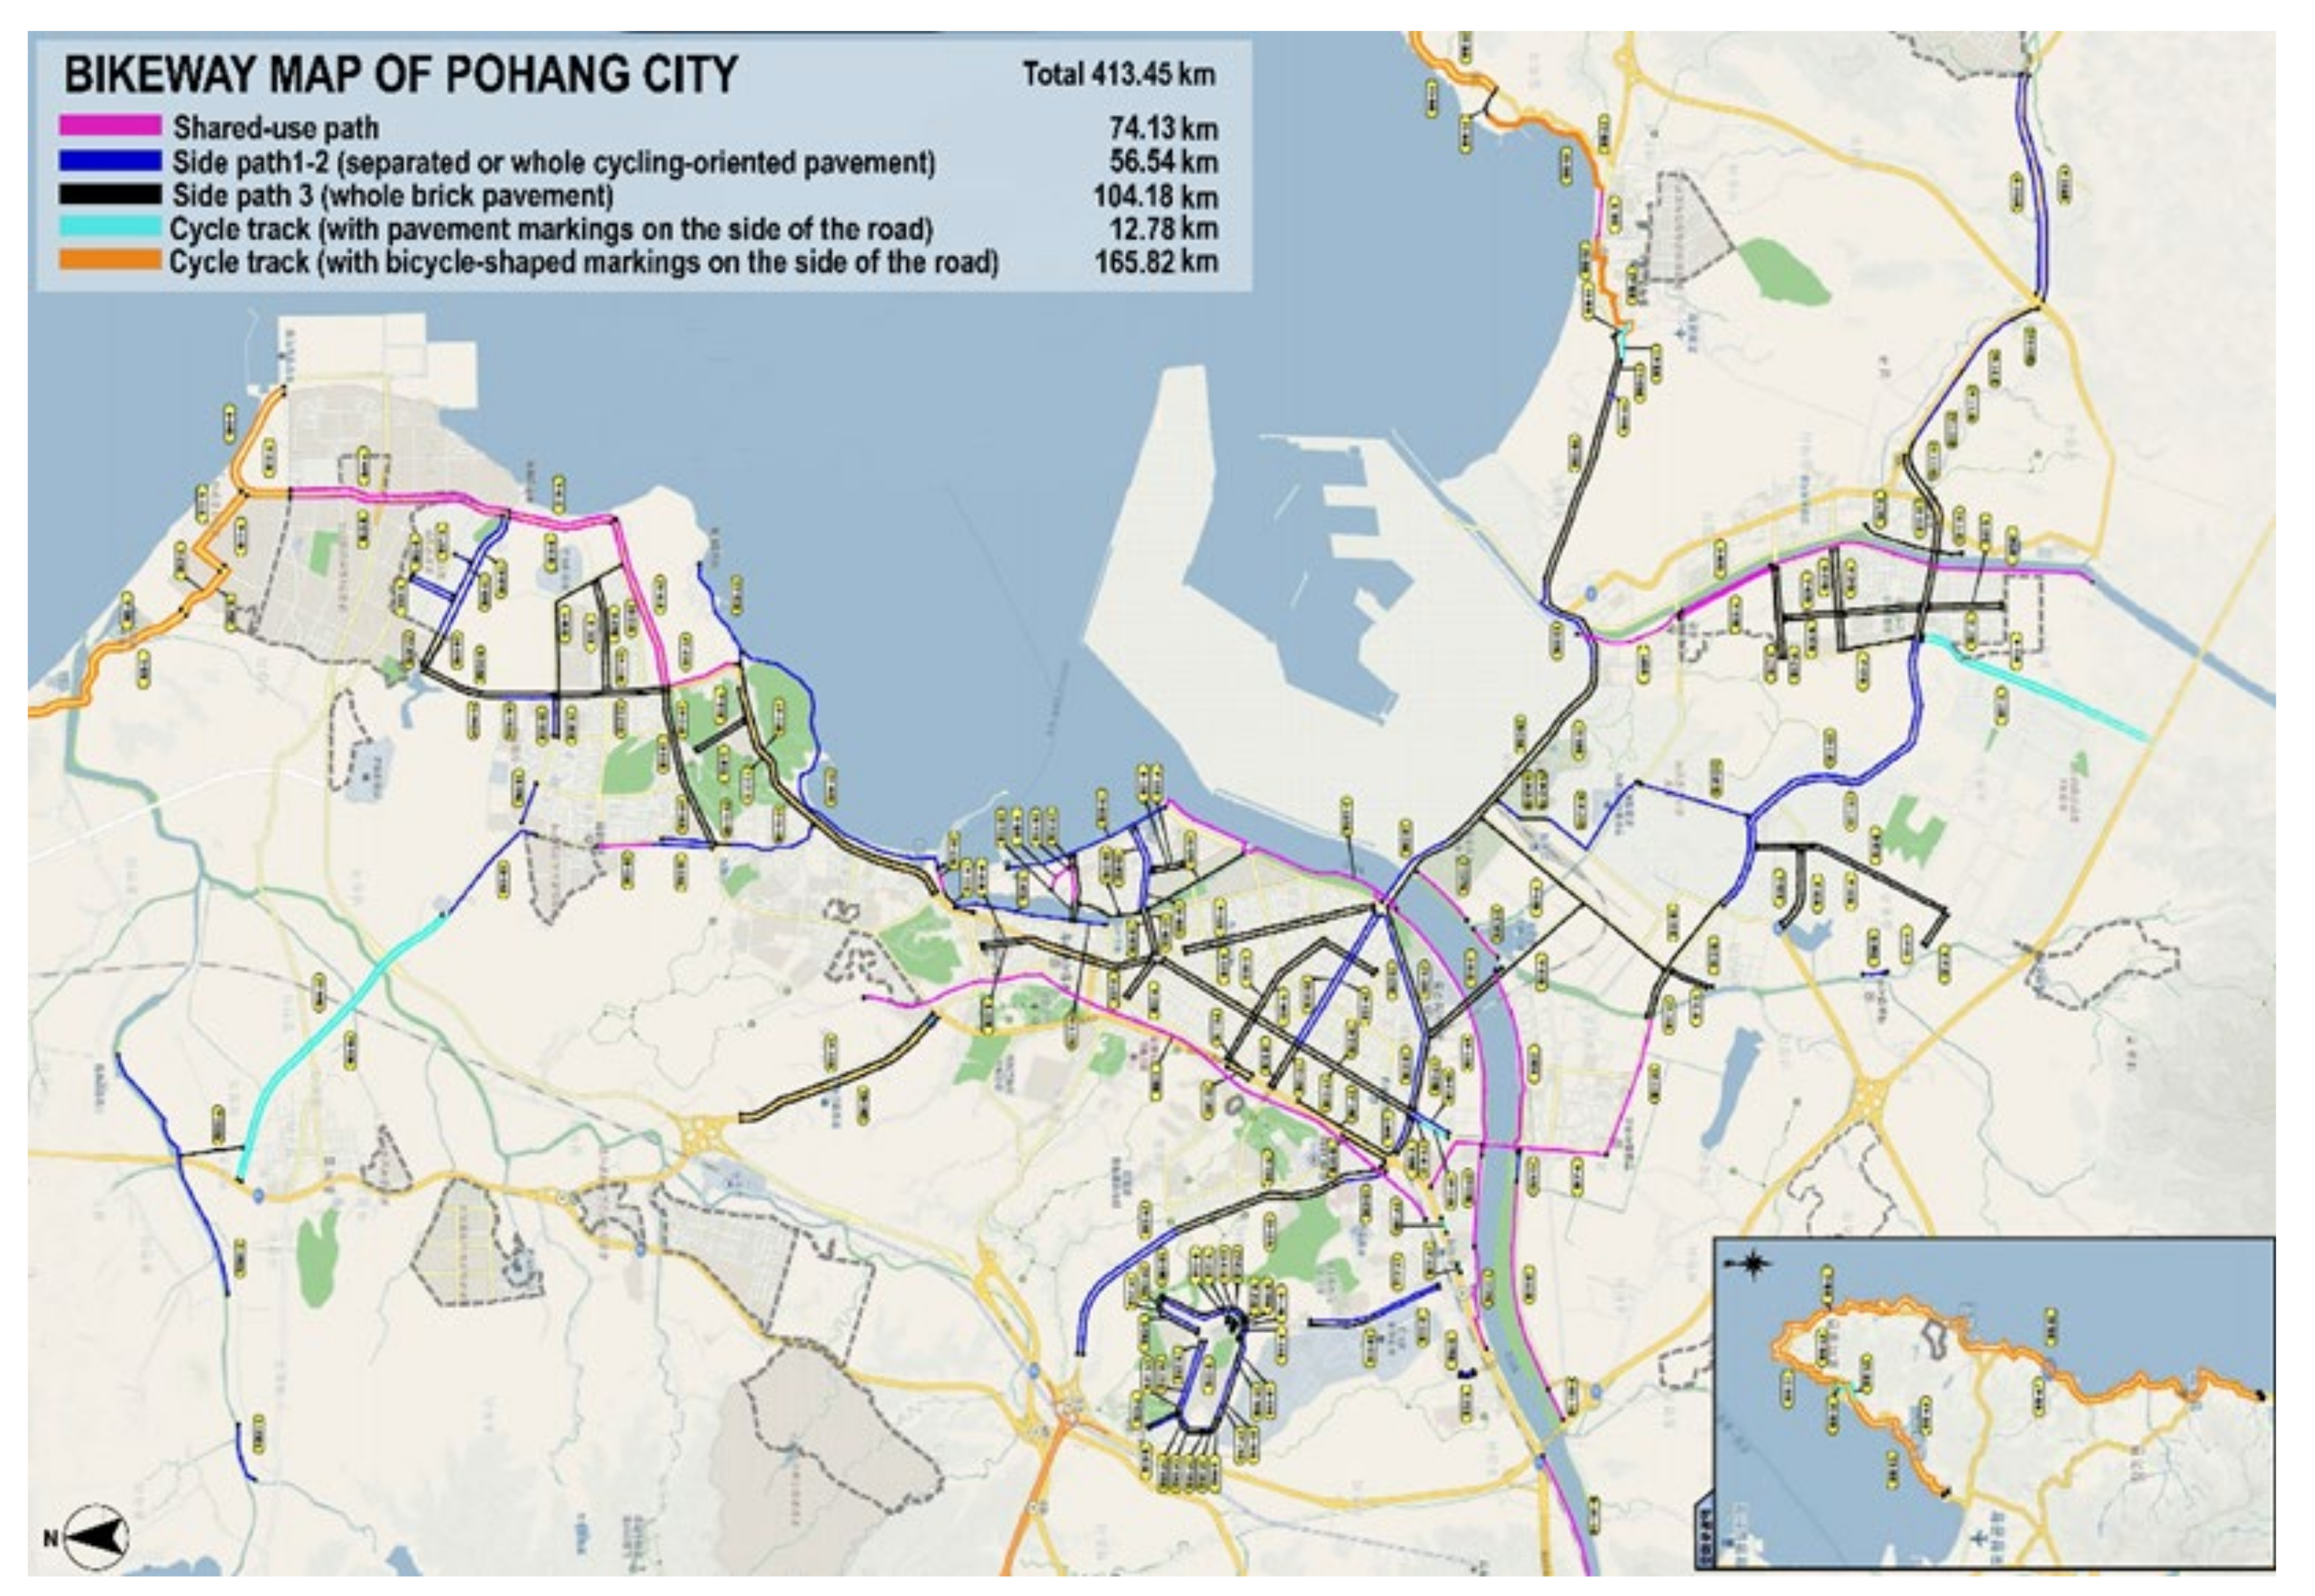
The spatial scope of this research is Pohang city in South Korea, which has remarkably extended its bikeway network over the last decade. Since the Action Plan for Cycling Promotion per the national policy was enacted, the city has installed considerable bikeway infrastructure on existing roads and streets. As a result, the total bikeway length in the city increased 12 times from 2011 (34 km) to 2018 (413.45 km) (Figure 2). Although the bikeway infrastructure has considerably increased, the number of bicycle users has not significantly risen; yet, many bike collisions have been continuously reported, including 170 cases in 2011, 217 in 2013, 255 in 2015, 212 in 2017, and 201 in 2019 [41]. Therefore, Pohang is a suitable city for investigating this research question.
Data on bike collisions were collected from the Traffic Accident Analysis System (TAAS), which is a national database of injury records, by sending a formal request for data collection. The data are accumulated from the police and insurance companies in the system and they include only collisions of human-powered bicycles. We collected the TAAS data of 1904 bike collision cases in Pohang from 2011 to 2019, but 185 cases were removed due to unidentified information. Further, 854 road intersection cases were excluded. Finally, we found that 865 collision cases occurred in bikeway areas which were then used for our investigation. To examine bikeway design types and conditions, bikeway site visits and observations were conducted in Pohang from March to August in 2020. Land use and other data on bikeways were provided by Pohang city and derived from the 2018 Master Plan of Bikeway City Pohang.
3.2. Analytical Modelling
Using a binary logistic regression model, this study aimed to explore the independent variables of bikeway types and land use. The binary logistic regression model is useful when the dependent variable is categorical and takes only two values, 0 or 1. Given that cyclists’ collision severity can be separated to minor (0) and major (1) as a dependent variable, using the binary logistic regression model is appropriate in this analysis. The binary logistic regression function can be derived by logit transformation, which is a functional conversion taking a natural logarithm to odds ratio.
The transformed odds ratio is equivalent to a linear regression function as follows:
Here, : Odds Ratio of the Dependent Variable
: Coefficient of Regression
: Independent Variable
By simplifying Equation (1), the final binary logistic regression function can be derived as follows:
Here, : Collision Severity of Cyclist (Dependent Variable)
: Minor Collision, : Major Collision
: Cyclist Collision Severity Impact Variable (Independent Variable)
: Coefficient of Logistic Regression Mode
3.3. Variable Selection for the Binary Logistic Regression
This study aims to evaluate the correlation between the severity of collisions of cyclists and bike lane classification, and the influencing factors, including land use. The severity of bike collisions is defined as “the victim suffering minor, major, or fatal injury” [20]. The National Police Agency of Korea officially defines minor and major injury as requiring less than and over three weeks of medical treatment, respectively. The cases of fatal injury in this study did not exceed 1%, and thus, the severity of collisions was classified as minor and major severity (major and fatal). Thus, the dependent variables were set up as minor injury (0) and major injury (1). Considering the literature review, TAAS dataset, and our research purpose, the six independent categorical variables selected were gender, age, time, road surface condition, land use, and bikeway type (see Table 1).
The novelty of this study lies in analyzing correlations of bicycle collision severity especially with bikeway types, which has not been considered in previous studies. However, the four official bikeway types defined by the Korean government have not reflected the real urban context, although there has been a notable increase in the country’s bikeway length. Hence, the four official bikeway types were further divided into six types based on site visits and field observations of the detailed design of side paths. Although there are various pavement sizes and compositions in the existing sidewalk, this bikeway type is most commonly installed. During the last nine years in Pohang, most collisions have occurred with this bikeway type. Thus, this design needs to be understood in greater detail. Table 2 shows detailed descriptions of the independent variables of the six bikeway types.
This study also seeks to understand the influence of land use on bikeway designs and bicycle collision severity. As the TAAS data provide coordinates of all bicycle collisions during the period, land use information regarding specific sites of bicycle collisions could be utilized for analysis.
In the binary logistic regression, each categorical independent variable should be divided into all its values called dummy variables, and one value is extracted as a reference variable to contrast with the remaining dummy variables with respect to the dependent variable. Hence, “female” in gender, “under 30” in age, “night” in time, “others” in road surface condition, “residential” in land use, and “no lane” in bikeway type were designated as the respective reference variables.
4. Results
4.1. Descriptive Statistics
Table 3 shows the descriptive statistics for the collision severity of 865 cyclists who experienced bicycle collisions between 2011 and 2019 in Pohang city. The collision frequency of males was almost three times higher than that of females. The cyclists from the older age group (50 s and 60 s) experienced the largest number of collisions. More collisions occurred during the daytime and dry conditions on the bikeway road surface, but collisions that were more serious occurred on wet bikeway surfaces. Most of the collisions occurred in residential and commercial areas, and minor collisions were more frequent than major collisions. However, the land use of parks and open spaces showed more cases in the major severity group. Major collisions were more frequent than minor collisions in types 2, 3, and 4.
4.2. Binary Logistic Regression
Table 4 shows the results of the binary logistic regression analysis. The variables with a significance level of less than 5% indicate positive (+) values in the odds ratio (OR) of this analysis and are expressed as follows: 50–69 years of age (OR: 1.512), over 70 years of age (OR: 2.008), parks and open spaces (OR: 2.283), T2 (OR: 2.601), T4 (OR: 2.161), and T5 (OR: 1.556). This means that cyclists of the age group 50 to 69 years have 1.512 times the possibility of major collision severity compared to the group under 30 years (reference variable). The group over 70 years is 2.008 times more likely to experience a major collision than the group under 30. For land use, the possibility of major collision severity in parks and open spaces is 2.283 times higher than that in residential areas (reference variable). For bikeway types, T2 (cycle track) had a 2.601 times higher rate of major collisions than T0 (no lane, reference variable), and T4 (side path 2 with separated cycling pavement) had a 2.161 times higher rate of major collisions than T0. In the case of T5 (side path 3: whole brick pavement), a 1.556 times greater risk of major collision severity compared to T0 was noted.
5. Discussion
The research results indicate the importance of bikeway design and location, which influence bike collision severity; thus, they have critical implications for safe bikeway environment planning. Transportation policymakers need to devise more detailed design guidelines and regulations on safety and public health to encourage bicycle use.
5.1. Need for Clear and Solid Separation between Bikeways and Roadways in Parks and Open Spaces
Many cyclists in South Korea often ride bicycles in parks and open spaces for leisure. There were 43 minor collisions (45.7%) and 51 major collisions (54.3%) in these areas, resulting in 94 cases. Although these are fewer in number compared to the collisions in residential and commercial areas, major injuries occur more frequently than minor injuries. Moreover, the possibility of having major collisions is 2.283 times greater than in residential areas. Therefore, it is necessary to manage bikeways in parks and open spaces to ensure the safety of cyclists.
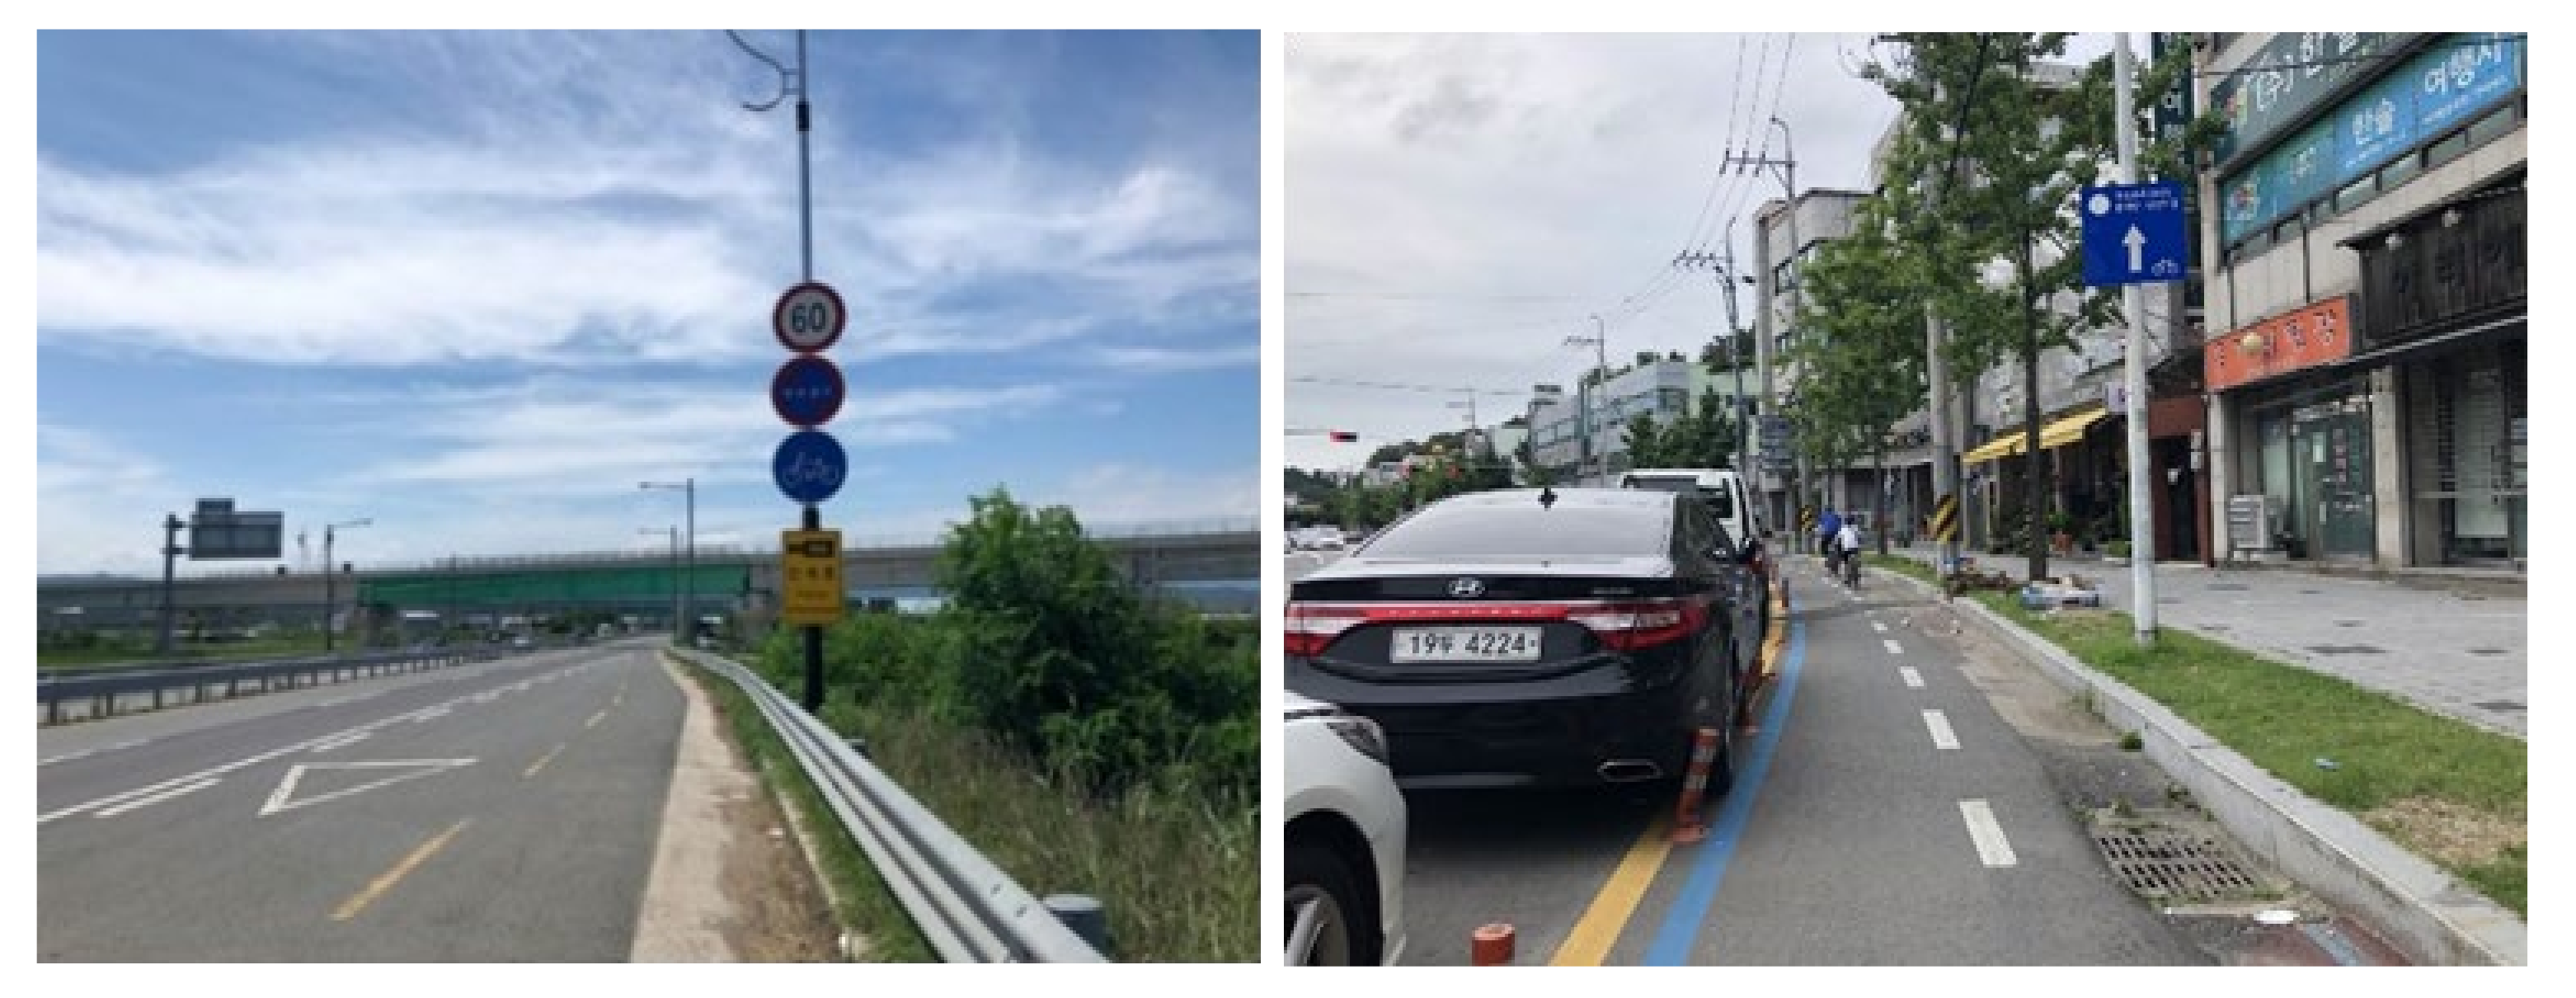
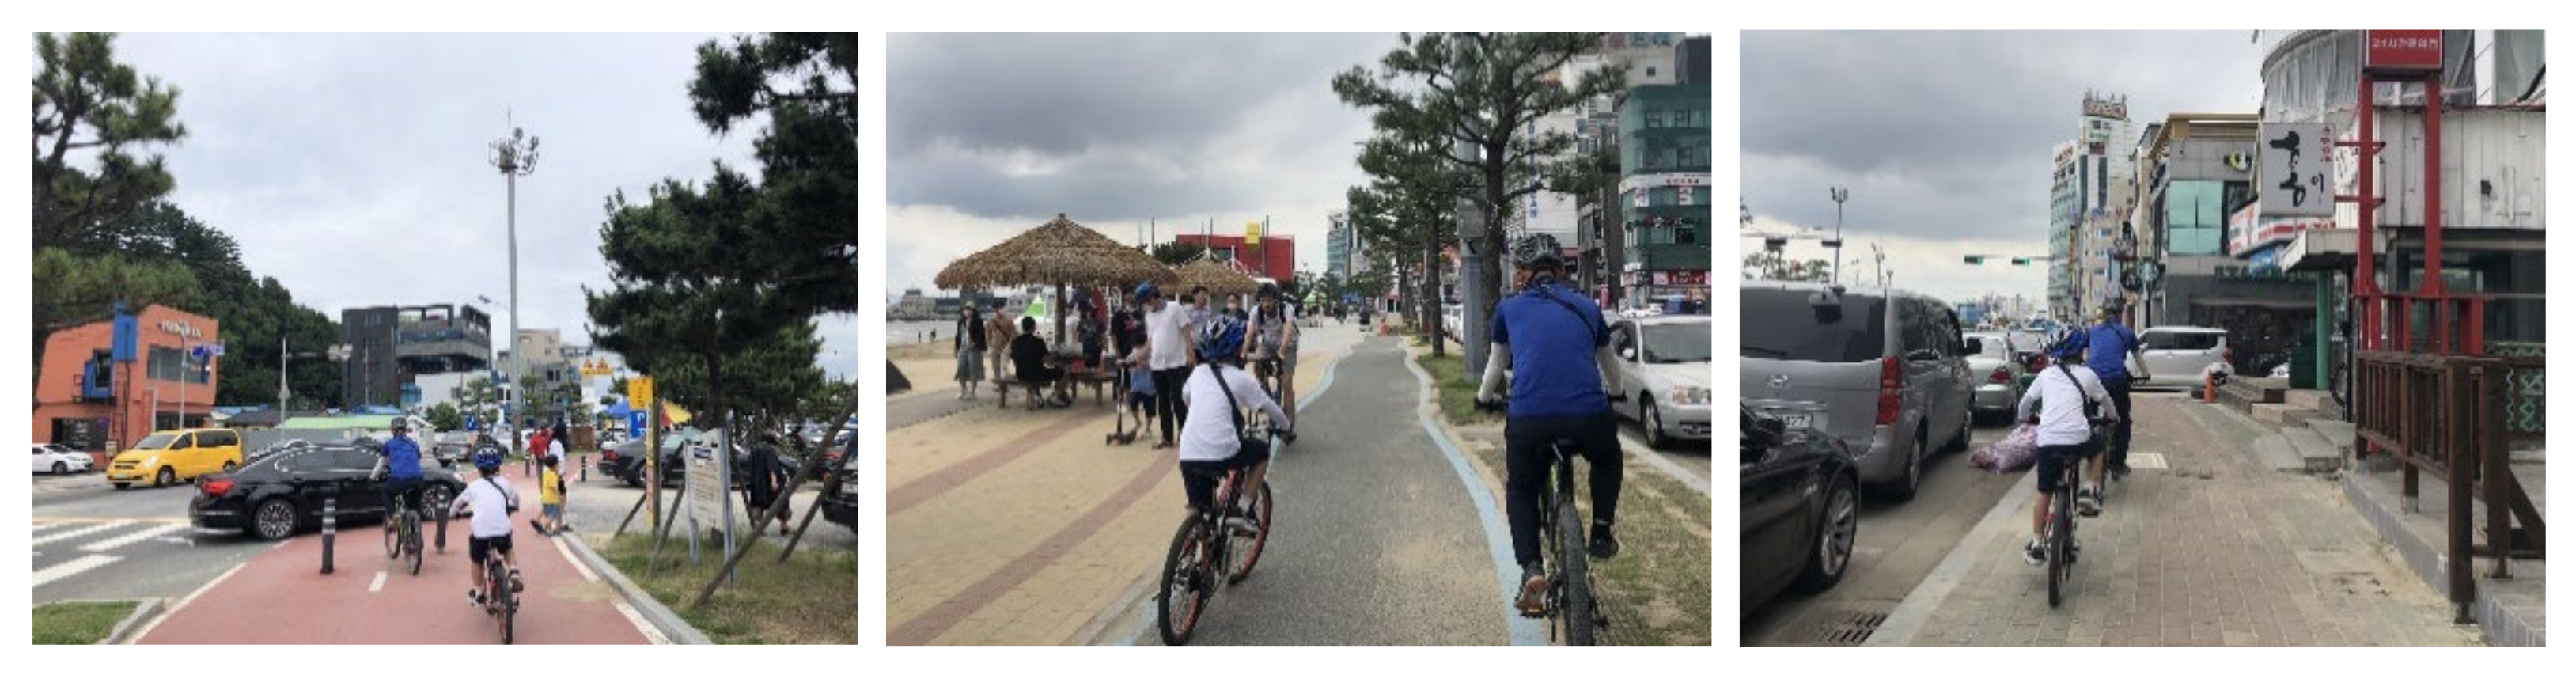
T2 (cycle track), which is designated based on motorized traffic by stripping, signage, and pavement markings, is the most frequent type constructed in parks and open spaces (Figure 3). Pavement marking, particularly, has been used to construct this type of track. In this case, however, if a car is parked on the cycle track, cyclists need to maneuver onto the driving lane to avoid it. Moreover, this type of bikeway is usually constructed on the outskirts of a city with high-speed cars and heavy transit of large cargo trucks [42]. Sometimes cycle tracks have physical barriers such as tubular markers, bollards, and raised curbs. Unfortunately, many cars park in the lanes breaking the physical barrier (Figure 3). For these reasons, cyclists have not enjoyed the preferential or exclusive use of these bikeways.
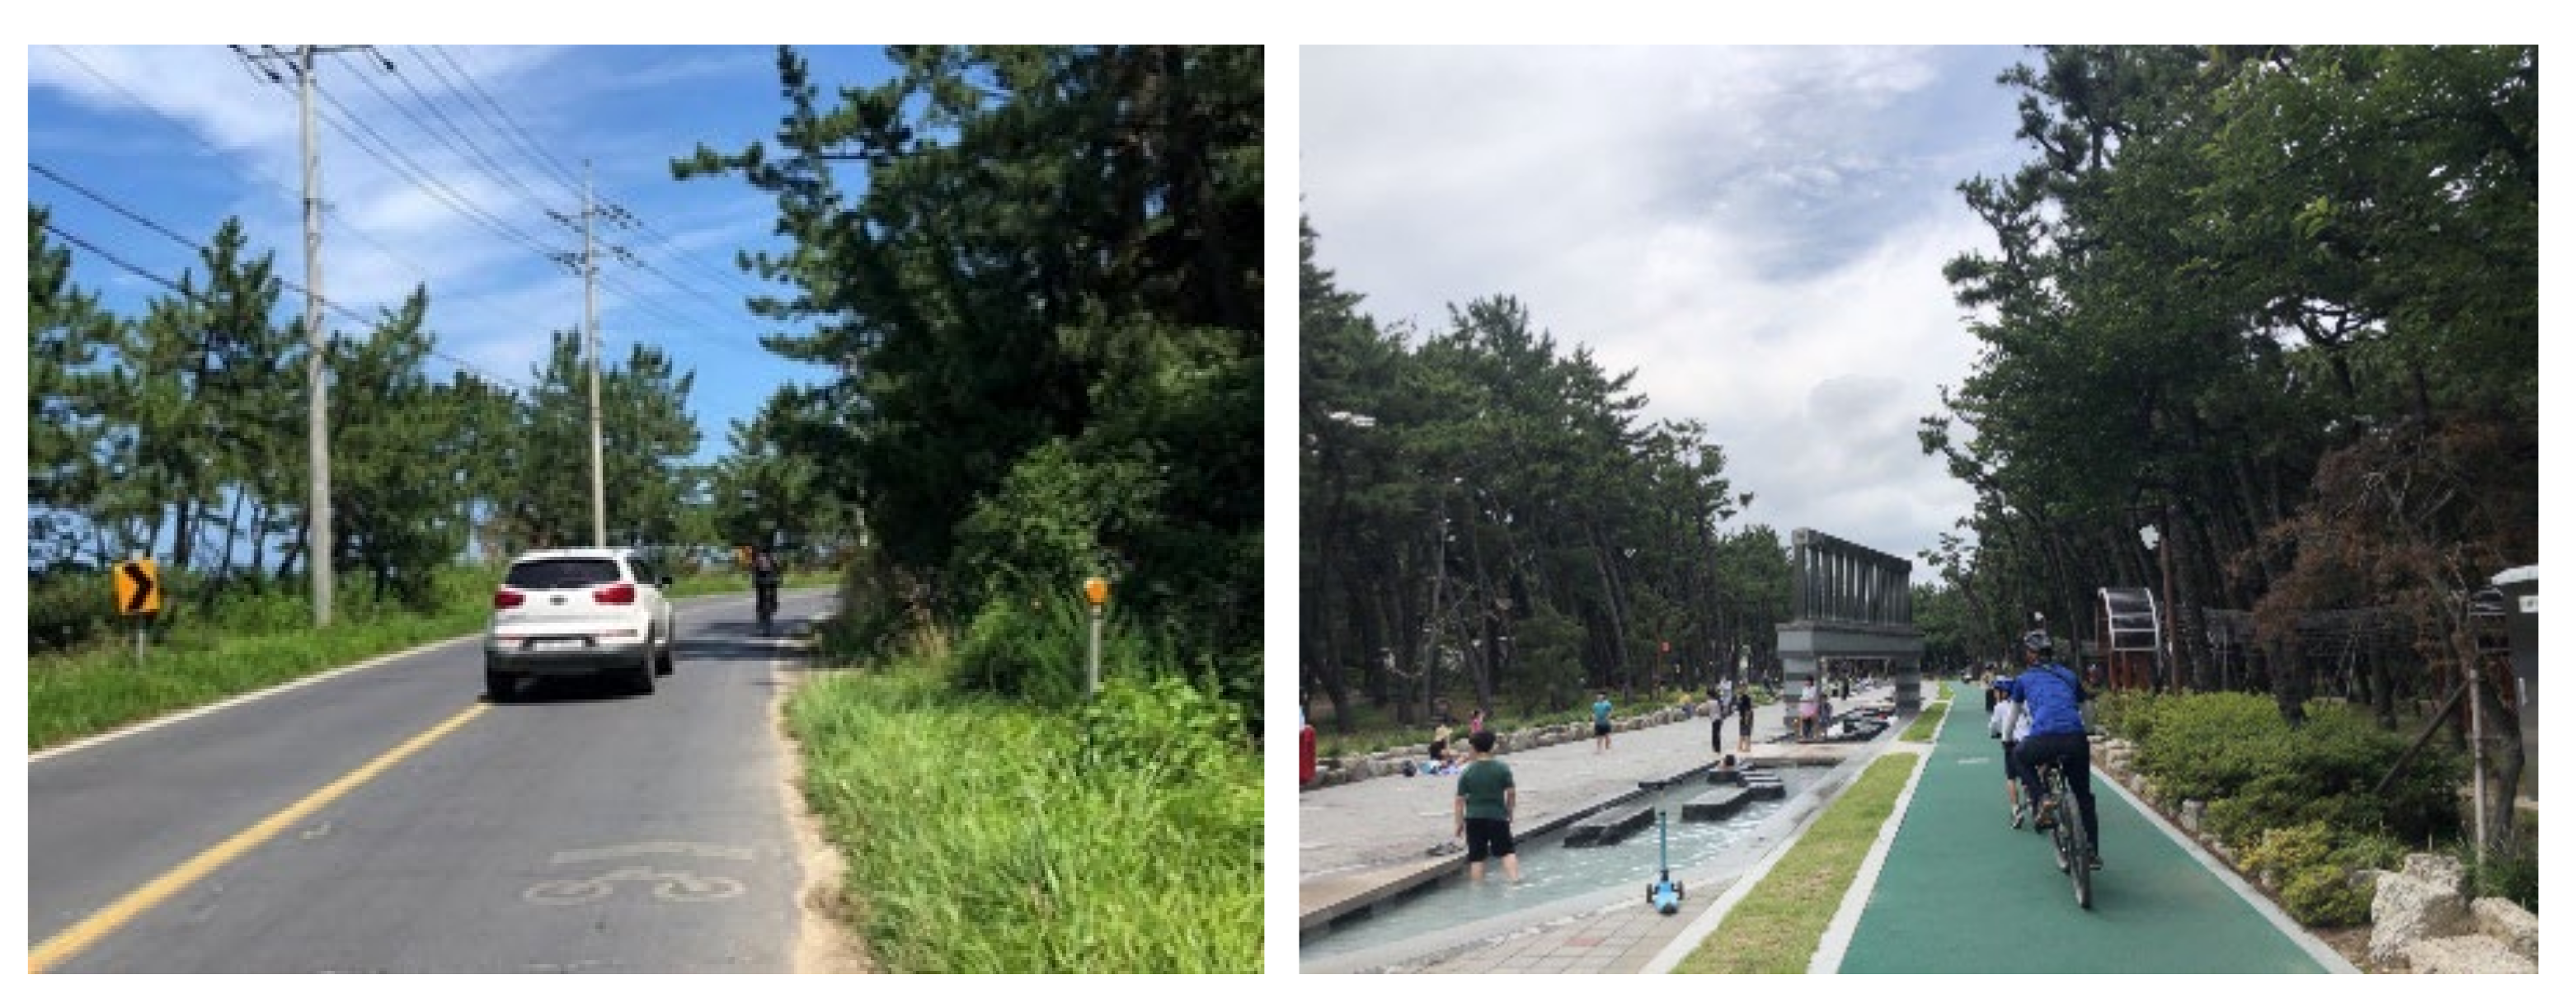
Additionally, some cycle tracks let cyclists share the road with motor vehicles using bicycle-shaped pavement marking on the side of the road (Figure 4). Although this kind of design has been observed in areas with low car traffic, motorists travel at high speeds due to the low traffic. Furthermore, because of the winding roads, it is difficult for motorists travelling at high speeds to notice cyclists; therefore, there is a high risk of cars crashing into the rear of bicycles. For instance, 19 minor collisions (48.7%) and 20 major collisions (51.3%) occurred in T2, resulting in 39 cases, and there is a 2.601 times greater possibility of major collision severity than T0. On the contrary, T1 (shared-use path), which is also constructed mostly in parks and open spaces, shows only a total of four collisions with two major cases over the same period (Figure 4). T1 has been constructed mostly in parks and riversides, showing a clear delineation from traffic lanes and even the walkway. Therefore, policymakers should consider expanding the T1 concept that divides the bikeways from the other pathways. If the road can no longer be widened, such work must be carried out even if it shrinks the traffic lanes.
5.2. Importance of Pavement Materials in Side Paths
Due to the narrow width of roads in residential and commercial areas, side paths (T3, T4, T5), which are used by both pedestrians and cyclists, are commonly constructed nationwide (Figure 5). However, the quantitative expansion of the length of the bikeway network concentrating excessively on the side paths has further compromised the safety of cyclists. In contrast to the case of T0 without the division between motorists, cyclists, and pedestrians, only cyclists and pedestrians use the side path, which entails high speeding by cyclists. In the T5 (side path 3 with whole brick pavement), which is the most prevalent bikeway type in South Korea, cyclists who are no longer obstructed by motor vehicles can speed freely, which can lead to more severe collisions for cyclists than T0. The research results show that in the case of T5, there is a 1.556 times greater possibility of major collision severity than T0.
T4 (side path 2: separated cycling pavement), in which the bikeway is differentiated from the walkway by its pavement, is a more developed type than T5. However, cycling-oriented pavements, such as permeable cement concrete for separation, incite more high-speed cyclists. Above all, such separation has not been effective; pedestrians have often been seen to ignore the separation and freely wander in both bikeways and walkways. According to the research results, in the case of T4, there is a 2.161 times greater possibility of major collision severity than T0. Therefore, the government should refrain from constructing the side paths without consideration of its qualitative improvement; the side paths should ensure a conspicuous separation between walking and cycling through durable physical barriers.
However, in many districts, it is impossible to separate them due to narrow sidewalks. In this case, an entirely cycling-oriented pavement was recommended. In the last nine years, the number of collisions in T3 (side path 1: whole cycling pavement) was 7.04 and 17.16 times less than T4 and T5, respectively. The number of major collisions in T3 was 6.92 and 13.76 times less than T4 and T5, respectively. These results are related to the shared space density and diversity of movement directions. which Alsaleh et al. [43] have emphasized in the study of behavioral analysis of cyclist and pedestrian interactions; pedestrian-oriented pavements, such as brick pavements (T5), make pedestrians freely move in more unexpected directions than T3. Thus, cyclists travelling at high speeds can hit pedestrians who may not see them approaching fast enough.
5.3. Importance of Non-Motorist-Centric Design in Low-Volume Streets without Sidewalks
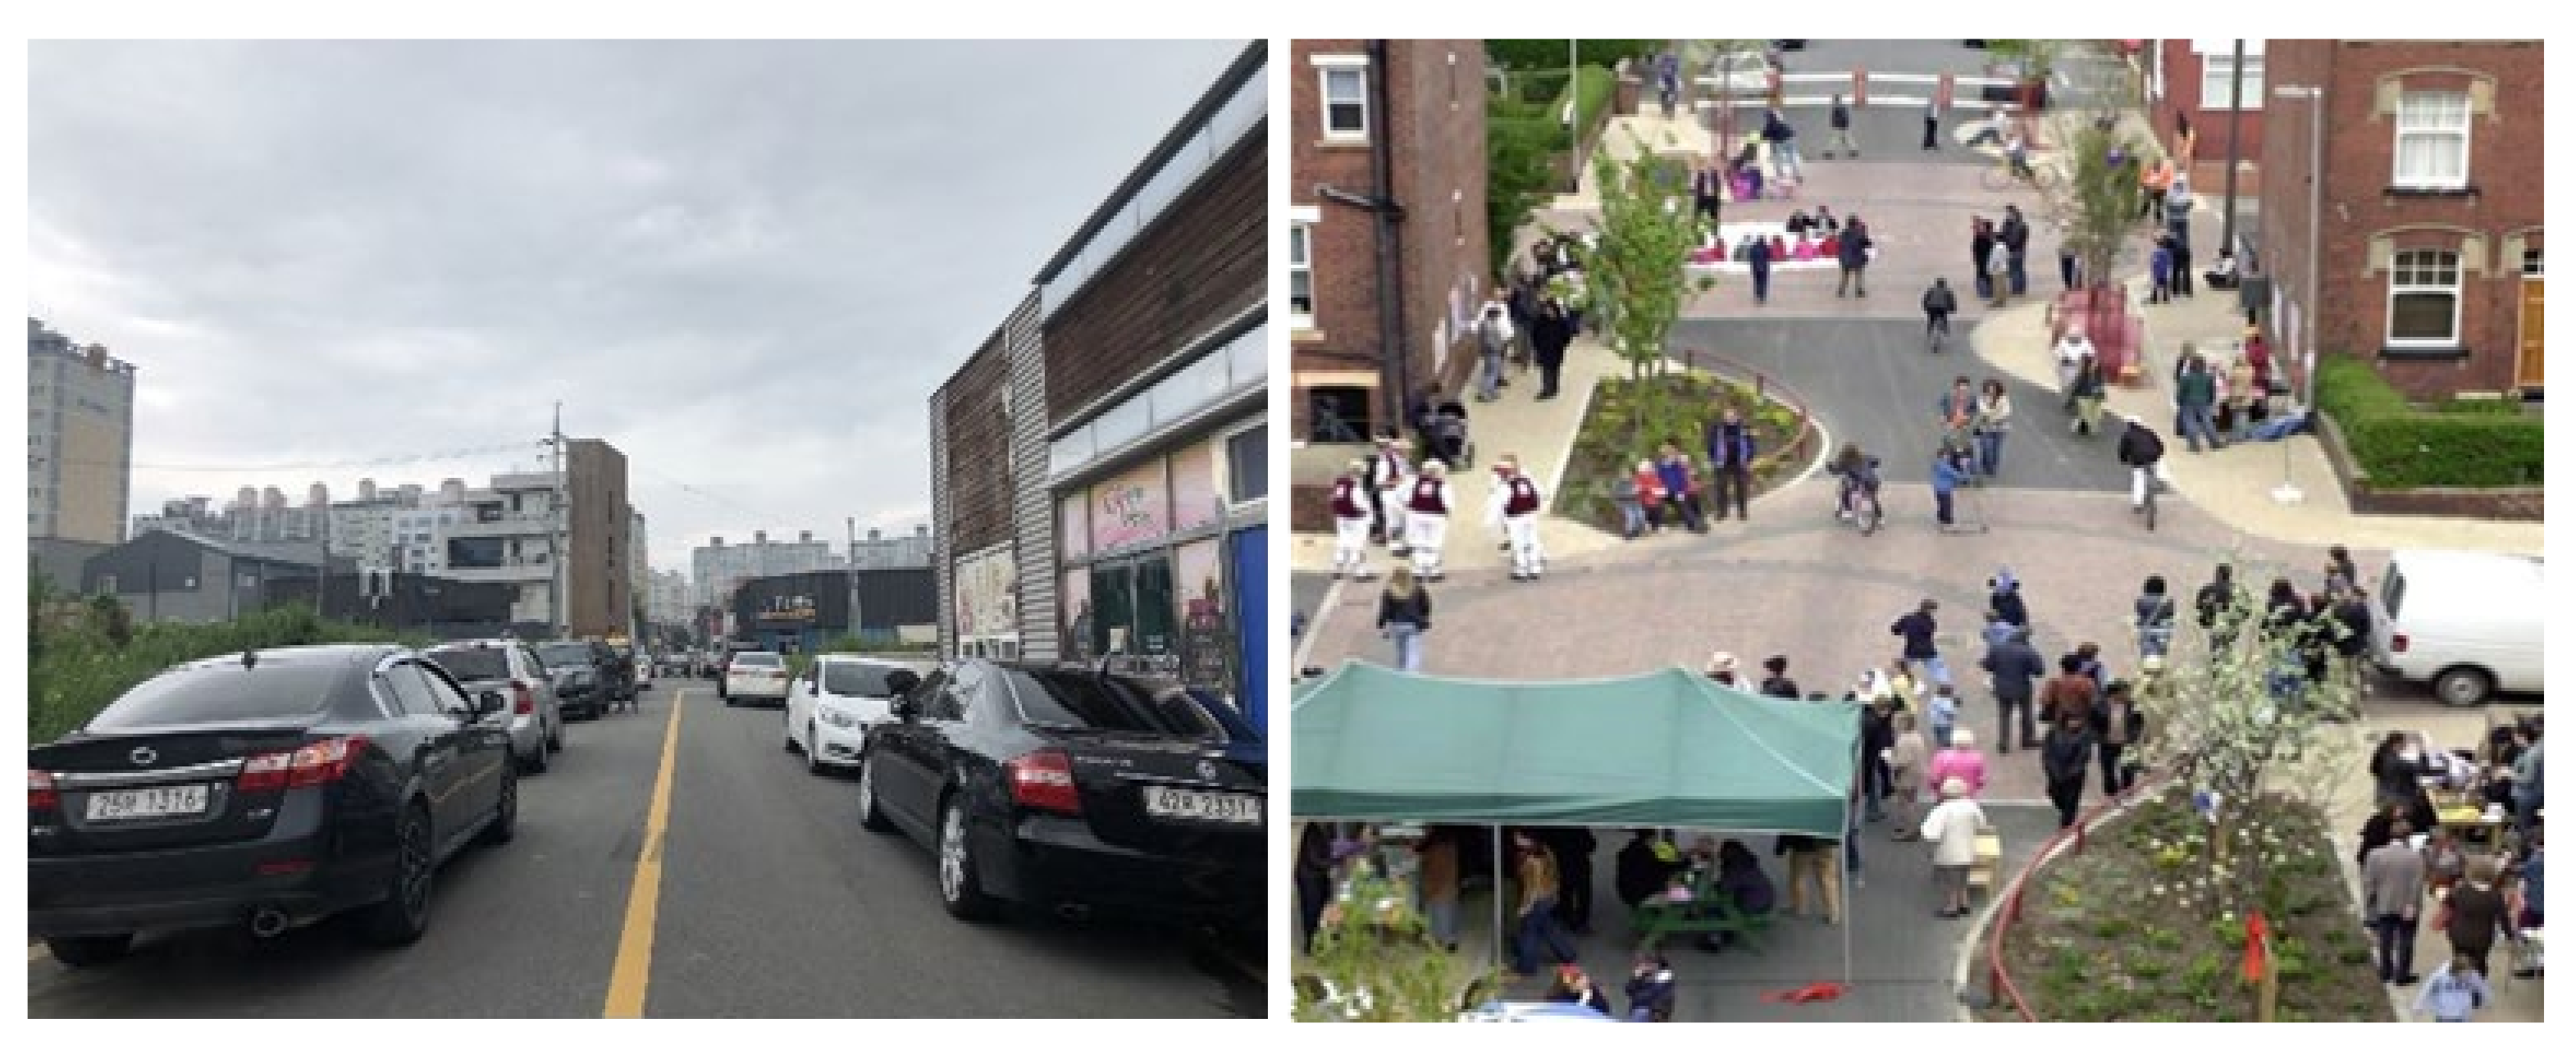
Numerous low-volume residential and commercial streets in Korea were designed without sidewalks. T0 (no lane) is representative of these streets (Figure 6). According to Korean law, under the Promotion of the Use of Bicycles Act, T0 is not classified as a bike lane. However, it is prudent to consider it as a type of bikeway and redesign it to de-emphasize motor vehicle transportation on the streets.
In low-volume streets such as T0, pedestrians, cars, and bicycles were found to be mixed haphazardly. Although most T0s are in residential and commercial areas where pedestrians and cyclists have considerable movement, they have a traditional auto-centric paradigm; all the road designs are focused on car traffic. Thus, cyclists are forced to slow down with caution. For this reason, 65.6% of the collisions at T0 showed minor severity. However, considering 192 bike collisions at T0, which is the second largest number of cases of the six types, it is necessary to redesign these narrow, auto-centric, and pedestrian heavy streets to ensure the public safety of cyclists and pedestrians.
In the late 1960s, “Woonerf,” the first Dutch street to achieve livable conditions and safety, was developed by urban designers, urban planners, and traffic engineers, alongside the participation of residents [44]. They replaced bricks with serpentine lanes and placed street furniture (e.g., trees and benches), which successfully forced motorists to slow down and be careful, without a conspicuous separation between motorists and non-motorists [45]. Furthermore, an increase was observed in the social interaction and satisfaction level of the residents in Woonerf, as well as a decline in collision cases [46]. This concept of shared streets has been widespread in many countries and adopted globally [47,48]. This design concept of enhanced health and safety in neighborhoods should also be applied to T0 streets in South Korea. For the concept to be well-implemented in T0, policymakers must consider initial physical changes, such as street furniture or a winding street design that strengthens the non-motorist-priority environment of the street.
6. Conclusions
Despite the government’s efforts over the past decade to extend the length of bikeways, the ill-considered extension did not include the safety factor with respect to pedestrians and cyclists. This has resulted in the construction of low-quality bikeways across the country. With the increasing proliferation of interest in bicycle use during the pandemic, this problem will become even more prominent. Thus, an analysis of the problems of bikeways must be conducted to plan for safer bikeway construction. To analyze this issue, Pohang city, one of the world’s most active cities for bicycle usage, was investigated. Binary logistic regression was used to identify factors affecting the severity of bike collisions. The key factor is the bikeway type, which is reclassified into six types based on lane design, pavement materials, and land use types at the collision location. The study results indicate that the land use of parks and open spaces and bikeway types of T2 (cycle track), T4 (side path 2: separated cycling pavement), and T5 (side path 3: whole brick pavement) are correlated with bike collision severity. Therefore, T2 in parks and open spaces is needed to install clear and solid physical division, which can conspicuously designate bikeways by reducing the width or the number of lanes. Additionally, the government should refrain from constructing side paths, without serious consideration of road conditions, for the sake of quantitative expansion of bikeways. While constructing a side path, it is necessary to install physical barriers on the separated lanes to separate the bikeway from the walkway. If the narrow roads present an unavoidable limitation for separation, cycling-oriented pavement is recommended. It is also necessary to deal with T0 (no lane) as a bikeway. It should be redesigned to mitigate the dominance of motor vehicles on the streets. This study is significant in that it analyzed each reclassified bikeway and proposed design solutions for optimal safety. Based on this study, policymakers could consider clear separation from motorways and safe road designs that factor in cycling-oriented pavements, ensuring pedestrian and cyclist safety compared to low-volume streets without sidewalks.
This study has certain limitations. The TAAS data used in this study are created based on data received by the police and insurance companies; thus, if the severity of the injury is low or if it is a single collision, it may not have been reported. Therefore, there is a possibility of missing data. Further, the data included only human-powered bicycle collisions. Given that there has been an increase of users of electric bikes (E-bikes) and kickboards (E-kickboards) in South Korea, further investigation of E-bike and E-kickboard collision severity with bikeway design can be conducted. Additionally, if more comprehensive factors that can influence collision severity and bikeway design (such as bike traffic and characteristics of cyclists) are utilized for future studies, more delicate strategies may emerge to improve bikeway designs and enhance cyclist safety. Lastly, this study depends on collision datasets reported by the agencies; more in-depth interviews with injured bikers can contribute to better accuracy of the study findings. Future studies could focus more on qualitative analysis with in-depth surveys to better assess collision circumstances and conditions.
Author Contributions
Conceptualization, J.L. and D.S.; data curation, J.L.; formal analysis, J.L.; investigation, J.L. and D.S.; methodology, J.L. and D.S.; project administration, D.S.; resources, J.L.; software, J.L.; supervision, D.S.; validation, D.S.; visualization, J.L.; writing—original draft preparation, J.L.; writing—review and editing, D.S.; funding acquisition, D.S. Both authors have read and agreed to the final version of the manuscript submitted for publication. All authors have read and agreed to the published version of the manuscript.
Funding
This work was supported by the National Research Foundation of Korea (NRF) grant funded by the Korea government (MSIT) (No. 2022R1G1A1006825).
Institutional Review Board Statement
Ethnical review and approval were waived for this study, as the research was conducted using information available to the general public and not collecting personal identification information.
Informed Consent Statement
Informed consent was obtained from all subjects involved in the study.
Data Availability Statement
The TASS data are publicly available from TASS, http://taas.koroad.or.kr/ (accessed on 3 April 2020).
Acknowledgments
We are grateful to the staff of TAAS who allowed us to collect the accident data. Additionally, we would like to thank the officials of Pohang city for their assistance in providing the bikeway map. Finally, we thank our anonymous reviewers for their valuable input on our manuscript.
Conflicts of Interest
The authors declare that there are no conflict of interest.
References
- Ro, C. Will COVID-19 Make Urban Cycling More Inclusive? Available online: https://www.bbc.com/worklife/article/20200724-will-covid-19-make-urban-cycling-more-inclusive (accessed on 30 June 2020).
- Park, S.; Kim, B.; Lee, J. Social Distancing and Outdoor Physical Activity During the COVID-19 Outbreak in South Korea: Implications for Physical Distancing Strategies. Asia Pac. J. Public Health 2020, 32, 360–362. [Google Scholar] [CrossRef] [PubMed]
- Kurkcu, A.; Gokasar, I.; Kalan, O.; Timurogullari, A.; Altin, B. Insights into the Impact of COVID-19 on Bicycle Usage in Colorado Counties. arXiv 2021, arXiv:2101.10130. [Google Scholar]
- Buehler, T.; Handy, S. Fifty years of bicycle policy in Davis, California. Transp. Res. Rec. 2008, 2074, 52–57. [Google Scholar] [CrossRef]
- Handy, S.L.; Xing, Y.; Buehler, T.J. Factors associated with bicycle ownership and use: A study of six small US cities. Transportation 2010, 37, 967–985. [Google Scholar] [CrossRef]
- De Nazelle, A.; Nieuwenhuijsen, M.J.; Antó, J.M.; Brauer, M.; Briggs, D.; Braun-Fahrlander, C.; Cavill, N.; Cooper, A.R.; Desqueyroux, H.; Fruin, S. Improving health through policies that promote active travel: A review of evidence to support integrated health impact assessment. Environ. Int. 2011, 37, 766–777. [Google Scholar] [CrossRef]
- Macmillan, A.; Connor, J.; Witten, K.; Kearns, R.; Rees, D.; Woodward, A. The societal costs and benefits of commuter bicycling: Simulating the effects of specific policies using system dynamics modeling. Environ. Health Perspect. 2014, 122, 335–344. [Google Scholar] [CrossRef] [Green Version]
- Götschi, T.; Garrard, J.; Giles-Corti, B. Cycling as a part of daily life: A review of health perspectives. Transp. Rev. 2016, 36, 45–71. [Google Scholar] [CrossRef] [Green Version]
- Woods, M. Paris’s Temporary Bike Lanes to Become Permanent after Hidalgo’s Re-Election. Available online: https://www.rfi.fr/en/france/20200701-paris-temporary-bike-lanes-to-become-permanent-after-hidalgo-re-election-mayor-green-pollution-cars (accessed on 1 July 2020).
- LiverpoolExpress. Temporary Cycle Network to Aid City’s COVID-19 Recovery. Available online: https://liverpoolexpress.co.uk/temporary-cycle-network-to-aid-citys-covid-19-revovery/ (accessed on 13 March 2020).
- Hankyung. The Return of Bicycle in COVID-19. Available online: https://www.hankyung.com/international/article/202006236405Y (accessed on 23 June 2020).
- UCL. Pop-Up Bike Lanes: A Rapidly Growing Transport Solution Prompted by Coronavirus Pandemic. Available online: https://www.uci.org/news/2020/pop-up-bike-lanes-a-rapidly-growing-transport-solution-prompted-by-coronavirus-pandemic (accessed on 4 June 2020).
- Junhyeok, B. One Hour in Seoul by Bicycle but…The Reality Is, a Amphibian on the Road. Available online: https://www.sedaily.com/NewsView/1Z42NZNG78 (accessed on 18 June 2020).
- Chae, M.-K. Improvement of Standard about Design for Bicycle Path as Public Space. J. Basic Des. Art 2012, 13, 441–451. [Google Scholar]
- Sin, H.-C.; Jo, H.-Y. Re-establishing User-Oriented Bicycle Road Types. Transp. Technol. Policy 2007, 4, 7–19. [Google Scholar]
- Stoffers, M. Cycling as heritage: Representing the history of cycling in The Netherlands. J. Transp. Hist. 2012, 33, 92–114. [Google Scholar] [CrossRef]
- Wooseok, J.; Jeungeun, Y. Bicycle Highway, Innovation for Future Cities; Gyeonggi Research Institute: Suwon, Korea, 2018; pp. 1–21. [Google Scholar]
- Buehler, R.; Dill, J. Bikeway networks: A review of effects on cycling. Transp. Rev. 2016, 36, 9–27. [Google Scholar] [CrossRef]
- Wachtel, A.; Lewiston, D. Risk factors for bicycle-motor vehicle collisions at intersections. ITE J. (Inst. Transp. Eng.) 1994, 64, 30–35. [Google Scholar]
- Oh, J.-T.; Kim, E.-C.; Kim, D.-H. A study on the bicycle accident injury severity at urban intersections. J. Korean Soc. Civ. Eng. 2007, 27, 389–395. [Google Scholar]
- Kim, E.; Oh, J.; Kim, M. A Study on Crash Causations for Bicycles in Signalized Intersections Using Non-linear Regression Models. J. Korea Plan. Assoc. 2007, 42, 261–272. [Google Scholar]
- Kim, D.-H.; Cho, H.-S.; Kim, E.-C. A study on bicycle accident patterns at urban intersections. Int. J. Highw. Eng. 2008, 10, 117–125. [Google Scholar]
- Schepers, J.; Kroeze, P.; Sweers, W.; Wüst, J. Road factors and bicycle–motor vehicle crashes at unsignalized priority intersections. Accid. Anal. Prev. 2011, 43, 853–861. [Google Scholar] [CrossRef]
- Kim, M.; Kim, E.; Oh, J.; Jun, J. Critical factors associated with bicycle accidents at 4-legged signalized urban intersections in South Korea. KSCE J. Civ. Eng. 2012, 16, 627–632. [Google Scholar] [CrossRef]
- Hwang, J.-H. A Preliminary Study on Intersection Geometric Designs Considering Safety of Crossing Bicycle-Focusing on Curve Radius of Pavement Edge at Intersection. KSCE J. Civ. Environ. Eng. Res. 2014, 34, 637–643. [Google Scholar] [CrossRef] [Green Version]
- Lee, Y.; Hwang, Y.; Sung, K.; Kim, S.; Lee, J. Analysis of Bicycle Accident Patterns at Intersections. In Proceedings of the Korean Society Automotive Engineers Conference, Daegu, Korea, 16–19 November 2016; pp. 794–797. [Google Scholar]
- Klop, J.R.; Khattak, A.J. Factors influencing bicycle crash severity on two-lane, undivided roadways in North Carolina. Transp. Res. Rec. 1999, 1674, 78–85. [Google Scholar] [CrossRef]
- Bíl, M.; Bílová, M.; Müller, I. Critical factors in fatal collisions of adult cyclists with automobiles. Accid. Anal. Prev. 2010, 42, 1632–1636. [Google Scholar] [CrossRef]
- Li, G.; Baker, S.P.; Smialek, J.E.; Soderstrom, C.A. Use of alcohol as a risk factor for bicycling injury. JAMA 2001, 285, 893–896. [Google Scholar] [CrossRef] [PubMed] [Green Version]
- Teschke, K.; Frendo, T.; Shen, H.; Harris, M.A.; Reynolds, C.C.; Cripton, P.A.; Brubacher, J.; Cusimano, M.D.; Friedman, S.M.; Hunte, G. Bicycling crash circumstances vary by route type: A cross-sectional analysis. BMC Public Health 2014, 14, 1205. [Google Scholar] [CrossRef] [PubMed] [Green Version]
- Hollingworth, M.A.; Harper, A.J.; Hamer, M. Risk factors for cycling accident related injury: The UK Cycling for Health Survey. J. Transp. Health 2015, 2, 189–194. [Google Scholar] [CrossRef]
- Poliziani, C.; Rupi, F.; Mbuga, F.; Schweizer, J.; Tortora, C. Categorizing three active cyclist typologies by exploring patterns on a multitude of GPS crowdsourced data attributes. Res. Transp. Bus. Manag. 2021, 40, 100572. [Google Scholar] [CrossRef]
- Walker, J.; Poliziani, C.; Tortora, C.; Schweizer, J.; Rupi, F. Nonparametric Regression Analysis of Cyclist Waiting Times across Three Behavioral Typologies. ISPRS Int. J. Geo-Inf. 2022, 11, 169. [Google Scholar] [CrossRef]
- Hertach, P.; Uhr, A.; Niemann, S.; Cavegn, M. Characteristics of single-vehicle crashes with e-bikes in Switzerland. Accid. Anal. Prev. 2018, 117, 232–238. [Google Scholar] [CrossRef]
- Park, B.H. Analysis on accident severity of bicycle in the case of Cheongju. Res. Inst. Ind. Sci. Technol. 2013, 27, 83–90. [Google Scholar]
- Hwang, S.; Lee, S. Analysis of Neighborhood Environmental Factors Affecting Bicycle Accidents and Accidental Severity in Seoul, Korea. J. Korea Plan. Assoc. 2018, 53, 49–66. [Google Scholar] [CrossRef]
- Hudson, M.; Levy, C.; Nicholson, J.; Macrory, R.; Snelson, P. Bicycle Planning: Policy and Practice; Transport Research Laboratory: Crowthorne, UK, 1982. [Google Scholar]
- Byoungcheol, L.; SeungKeun, K.; Hyoseung, C. A bikeway planning process by users. Archit. Inst. Korea 1995, 15, 231–461. [Google Scholar]
- Park, B.H. Type development and application of bicycle roads. Chungbuk Dev. Rev. 1997, 8, 195–219. [Google Scholar]
- Byeon, W.H.; Im, H.Y.; Yun, E.J. The Cycleway Types by Land Uses Analysis. J. Korean Soc. Transp. 2010, 28, 19–28. [Google Scholar]
- Pohang City. Master Plan of Bikeway City; Pohang City Hall: Pohang, Korea, 2018; pp. 52–68. [Google Scholar]
- Kim, J.H.; Kim, J.T.; Jeon, W.H. A Study on Characteristics of Lateral Wheel Path to Avoid Bicycle on Rural Highway Road Side. In Proceedings of the Korean Society of Transportation Conference, Jeju, Korea, 18–19 February 2016; pp. 93–98. [Google Scholar]
- Alsaleh, R.; Hussein, M.; Sayed, T. Microscopic behavioural analysis of cyclist and pedestrian interactions in shared spaces. Can. J. Civ. Eng. 2020, 47, 50–62. [Google Scholar] [CrossRef]
- Gharehbaglou, M.; Khajeh-Saeed, F. Woonerf; A Study of Urban Landscape Components on Living Streets. MANZAR Sci. J. Landsc. 2018, 10, 42–51. [Google Scholar]
- Collarte, N. The Woonerf Concept. In Rethinking a Residential Street in Somerville; Urban and Environmental Policy and Planning Department, Tufts University: Medford, MA, USA, 2012. [Google Scholar]
- Ben-Joseph, E. Changing the residential street scene: Adapting the shared street (Woonerf) concept to the suburban environment. J. Am. Plan. Assoc. 1995, 61, 504–515. [Google Scholar] [CrossRef]
- Karndacharuk, A.; Wilson, D.J.; Dunn, R. A review of the evolution of shared (street) space concepts in urban environments. Transp. Rev. 2014, 34, 190–220. [Google Scholar] [CrossRef]
- Jayakody, R.R.; Keraminiyage, K.; Alston, M.; Dias, N. Design Factors for a Successful Shared Street Space (SSS) Design. Int. J. Strateg. Prop. Manag. 2018, 22, 278–289. [Google Scholar] [CrossRef]
Figure 1.
Increasing bike collisions and new bikeway installation (Source: Ministry of the Interior and Safety and Road Traffic Authority, 2020).
Figure 1.
Increasing bike collisions and new bikeway installation (Source: Ministry of the Interior and Safety and Road Traffic Authority, 2020).

Figure 2.
2018 Pohang city bikeways map (most recent) (Source: [41]).
Figure 2.
2018 Pohang city bikeways map (most recent) (Source: [41]).

Figure 3.
T2-cycle track: with a signage on the side of the road (left), T2- cycle track: tubular markers broken by parked cars (right) (Source: authors).
Figure 3.
T2-cycle track: with a signage on the side of the road (left), T2- cycle track: tubular markers broken by parked cars (right) (Source: authors).

Figure 4.
T2-cycle track: Bicycle-shaped marking on the side of the road (left), T1-shared-use path, which is the most appropriate bikeway design (right) (Source: authors).
Figure 4.
T2-cycle track: Bicycle-shaped marking on the side of the road (left), T1-shared-use path, which is the most appropriate bikeway design (right) (Source: authors).

Figure 5.
T3-side path 1 (left), T4-side path 2 (middle), T5-side path 3 (right) (Source: authors).

Figure 6.
T0-no lane (left); serpentine and pedestrian-oriented Woonerf Street (right) (Source: Copyright from methleys.headstogether.org/. The photo on the left is taken by the authors).
Figure 6.
T0-no lane (left); serpentine and pedestrian-oriented Woonerf Street (right) (Source: Copyright from methleys.headstogether.org/. The photo on the left is taken by the authors).


Table 1.
Independent variables and descriptions.
| Variables | Description | |
|---|---|---|
| Gender | Gender of cyclists (Female: 0, Male: 1) | |
| Age | Under 30 | Reference variable |
| 30–49 | Age of cyclists (<30: 0, 30–49: 1) | |
| 50–69 | Age of cyclists (<30: 0, 50–69: 1) | |
| Over 70 | Age of cyclists (<30: 0, ≥70: 1) | |
| Time | Time of collision cases(Night: 0, Day: 1) | |
| Road surface condition | Road surface condition of collision cases (Others: 0, Dry: 1) | |
| Land use | Residential | Reference variable |
| Commercial | Cases of collisions on roads in commercial areas (Residential: 0, Commercial: 1) | |
| Industrial | Cases of collisions on roads in industrial areas (Residential: 0, Industrial: 1) | |
| Parks and open spaces | Cases of collisions on roads in parks and open spaces (Residential: 0, Parks and open spaces: 1) | |
| Bikeway type | T0: No lane | Reference variable |
| T1: Shared-use path | Bake lane clearly isolated; bike lane in the park (T0: 0, T1: 1) | |
| T2: Cycle track | Bike lane separated from the road by pavement markings or signages (T0: 0, T2: 1) | |
| T3: Side path 1 | Bike lane with whole cycling pavement on the sidewalk (T0: 0, T3: 1) | |
| T4: Side path 2 | Bike lane with separated cycling-oriented pavement on the sidewalk (T0: 0, T4: 1) | |
| T5: Side path 3 | Bike lane with whole brick pavement on the sidewalk (T0: 0, T5: 1) | |
Note: Nighttime designated as 06:00–17:59 and daytime designated as 18:00–05:59.
Table 2.
Detailed descriptions of the six types of bikeways.
| Type | Description | Example | |
|---|---|---|---|
| T0 | No lane | No distinction between car traffic, walkway, and bikeway/Usually paved with asphalt |  |
| T1 | Shared-use path | Mostly constructed near parks and rivers Clearly isolated road and sidewalks by vertical and horizontal way/Usually paved with asphalt, concrete, or unsealed surface with granular materials |  |
| T2 | Cycle track | Separated horizontally from the traffic lane by tubular marker, pavement marking, signage, vertically from sidewalk by raised curb/Sometimes sidewalk is not constructed/Usually paved with asphalt |  |
| T3 | Side path 1 (whole cycling pavement) | Dual lane horizontally separated from the road for bicycles and pedestrians with a bike-only pavement/Usually paved with colored asphalt, bituminous slurry, concrete, or unsealed surface with granular materials |  |
| T4 | Side path 2 (separated cycling pavement) | Dual lane vertically separated from the road for bicycles and pedestrians with a separation of cycling-oriented pavements and sidewalk blocks/Usually paved with asphalt, concrete, and bituminous slurry |  |
| T5 | Side path 3 (whole brick pavement) | Dual lane vertically separated from the road for bicycles and pedestrians with sidewalk blocks/Usually paved with sidewalk blocks |  |
Source: Authors.
Table 3.
Descriptive statistics of the 865 victims who experienced bike collisions.
| Collision Severity (Case) | ||||
|---|---|---|---|---|
| Minor | Major | Total | ||
| Total | 495 | 370 | 865 | |
| Gender | Female | 127 | 98 | 225 |
| Male | 368 | 272 | 640 | |
| Age | Under 30 | 129 | 65 | 194 |
| 30–49 | 80 | 55 | 135 | |
| 50–69 | 195 | 159 | 354 | |
| Over 70 | 91 | 91 | 182 | |
| Time | Day | 375 | 283 | 658 |
| Night | 120 | 87 | 207 | |
| Road surface condition | Dry | 478 | 348 | 826 |
| The others | 17 | 22 | 39 | |
| Land use | Residential | 268 | 156 | 424 |
| Commercial | 168 | 151 | 319 | |
| Industrial | 16 | 12 | 28 | |
| Parks and open spaces | 43 | 51 | 94 | |
| Bikeway type | T0 | 126 | 66 | 192 |
| T1 | 2 | 2 | 4 | |
| T2 | 19 | 20 | 39 | |
| T3 | 12 | 13 | 25 | |
| T4 | 86 | 90 | 176 | |
| T5 | 250 | 179 | 429 | |
Table 4.
Results of the binary logistic regression.
| Variable | OR | 95% CI | p-Value |
|---|---|---|---|
| Gender | |||
| Female | 1.000 | ref. | - |
| Male | 0.945 | (0.678–1.317) | 0.737 |
| Age | |||
| Less than 30 | 1.000 | ref. | - |
| 30–49 | 1.320 | (0.816–2.137) | 0.258 |
| 50–69 | 1.512 | (1.028–2.225) | 0.036* |
| Over 70 | 2.008 | (1.308–3.084) | 0.001** |
| Time | |||
| Night | 1.000 | ref. | - |
| Day | 1.090 | (0.780–1.524) | 0.613 |
| Road surface condition | |||
| Others | 1.000 | ref. | - |
| Dry | 0.578 | (0.295–1.132) | 0.110 |
| Land use | |||
| Residential | 1.000 | ref. | - |
| Commercial | 1.216 | (0.863–1.712) | 0.264 |
| Industrial | 0.990 | (0.436–2.248) | 0.982 |
| Parks and open spaces | 2.283 | (1.403–3.715) | 0.001 ** |
| Bikeway type | |||
| T0: No lane | 1.000 | ref. | - |
| T1: Shared-use path | 1.619 | (0.204–12.880) | 0.649 |
| T2: Cycle track | 2.601 | (1.003–4.234) | 0.049 * |
| T3: Side path 1 | 2.103 | (0.883–5.009) | 0.093 |
| T4: Side path 2 | 2.161 | (1.324–3.527) | 0.002 ** |
| T5: Side path 3 | 1.556 | (1.065–2.275) | 0.022 * |
Note: “OR” represents the odds ratio. “CI” stands for confidence interval. “ref” means reference variable. ** denotes 1% significance level; * denotes 5% significance level. The Hosmer–Lemshow test was conducted to assess how well the model fits the data by comparing the observed and expected frequencies of events and non-events. The test’s p-value is 0.973, which is larger than the 5% significance level. Additionally, the model’s classification accuracy was 61.0%. Therefore, there was no error in the model structure.
Publisher’s Note: MDPI stays neutral with regard to jurisdictional claims in published maps and institutional affiliations. |
© 2022 by the authors. Licensee MDPI, Basel, Switzerland. This article is an open access article distributed under the terms and conditions of the Creative Commons Attribution (CC BY) license (https://creativecommons.org/licenses/by/4.0/).
Share and Cite
MDPI and ACS Style
Lee, J.; Seo, D. Influences of Urban Bikeway Design and Land Use on Bike Collision Severity: Evidence from Pohang in South Korea. Sustainability 2022, 14, 8397. https://0-doi-org.brum.beds.ac.uk/10.3390/su14148397
AMA Style
Lee J, Seo D. Influences of Urban Bikeway Design and Land Use on Bike Collision Severity: Evidence from Pohang in South Korea. Sustainability. 2022; 14(14):8397. https://0-doi-org.brum.beds.ac.uk/10.3390/su14148397
Chicago/Turabian StyleLee, Juseung, and Ducksu Seo. 2022. "Influences of Urban Bikeway Design and Land Use on Bike Collision Severity: Evidence from Pohang in South Korea" Sustainability 14, no. 14: 8397. https://0-doi-org.brum.beds.ac.uk/10.3390/su14148397
Note that from the first issue of 2016, this journal uses article numbers instead of page numbers. See further details here.