
Experiment and Model Study on the Destination of 3,5,6-Trichloro-2-pyridinol in the Purple Soil of Southwestern China with a High Ratio of Biochar Applied

Abstract
:1. Introduction
2. Materials and Methods
2.1. Experiments
2.1.1. Preparations of the Soil Columns
2.1.2. Breakthrough Curve Experiment
2.1.3. Measurement of the TCP and Br−
2.2. Simulation of the BTCs in Adsorption Process
2.3. Tracing the Release of TCP and its Simulation
2.3.1. Tracing the Release of TCP
2.3.2. The First-Order Decay Kinetics
3. Results
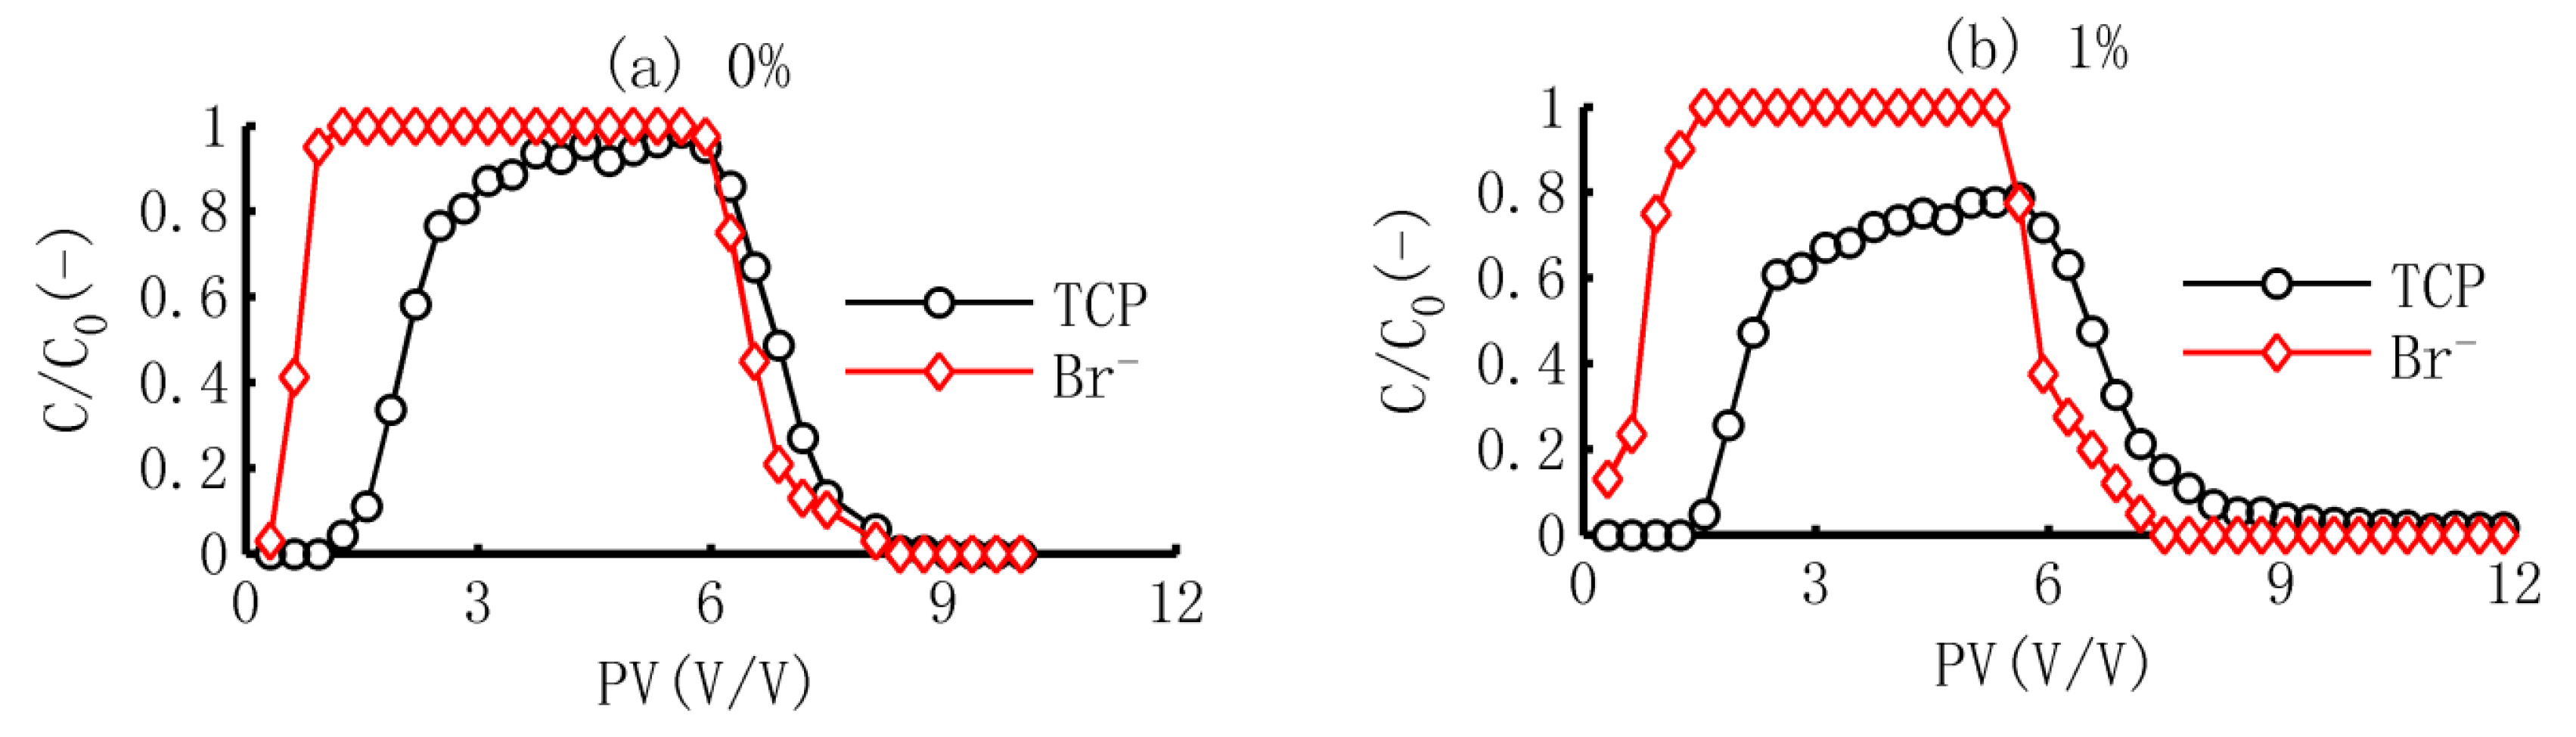
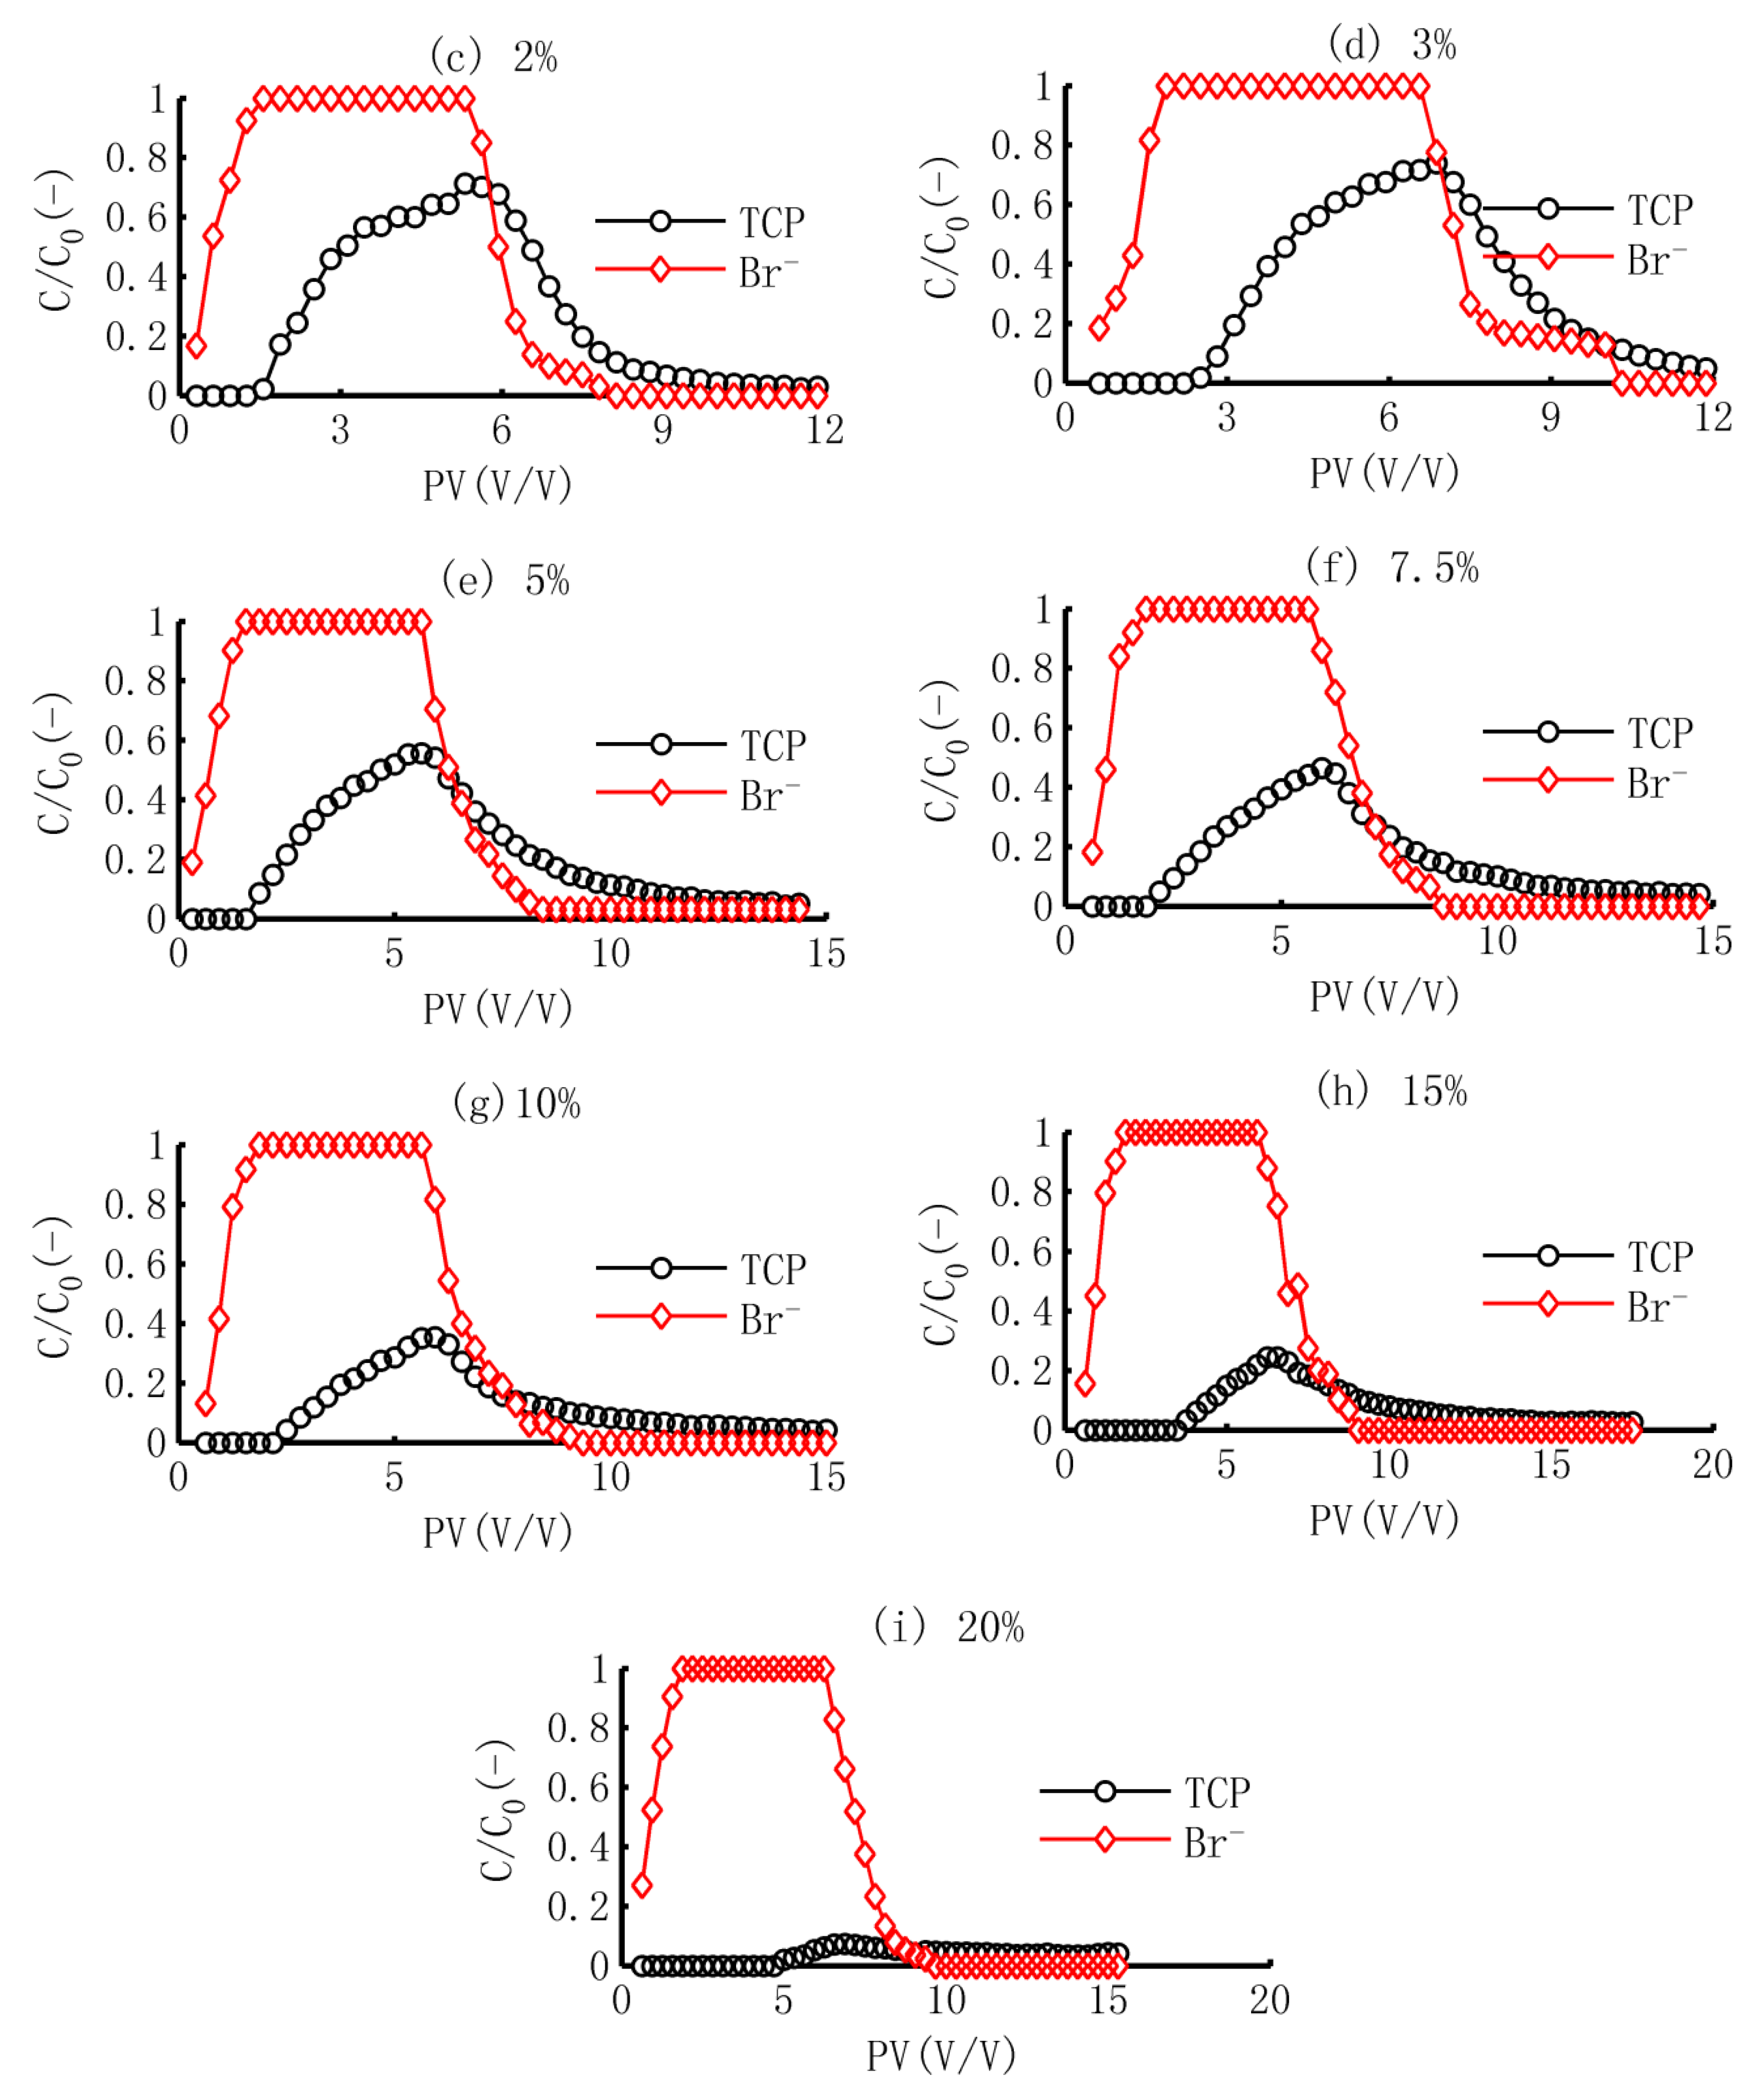
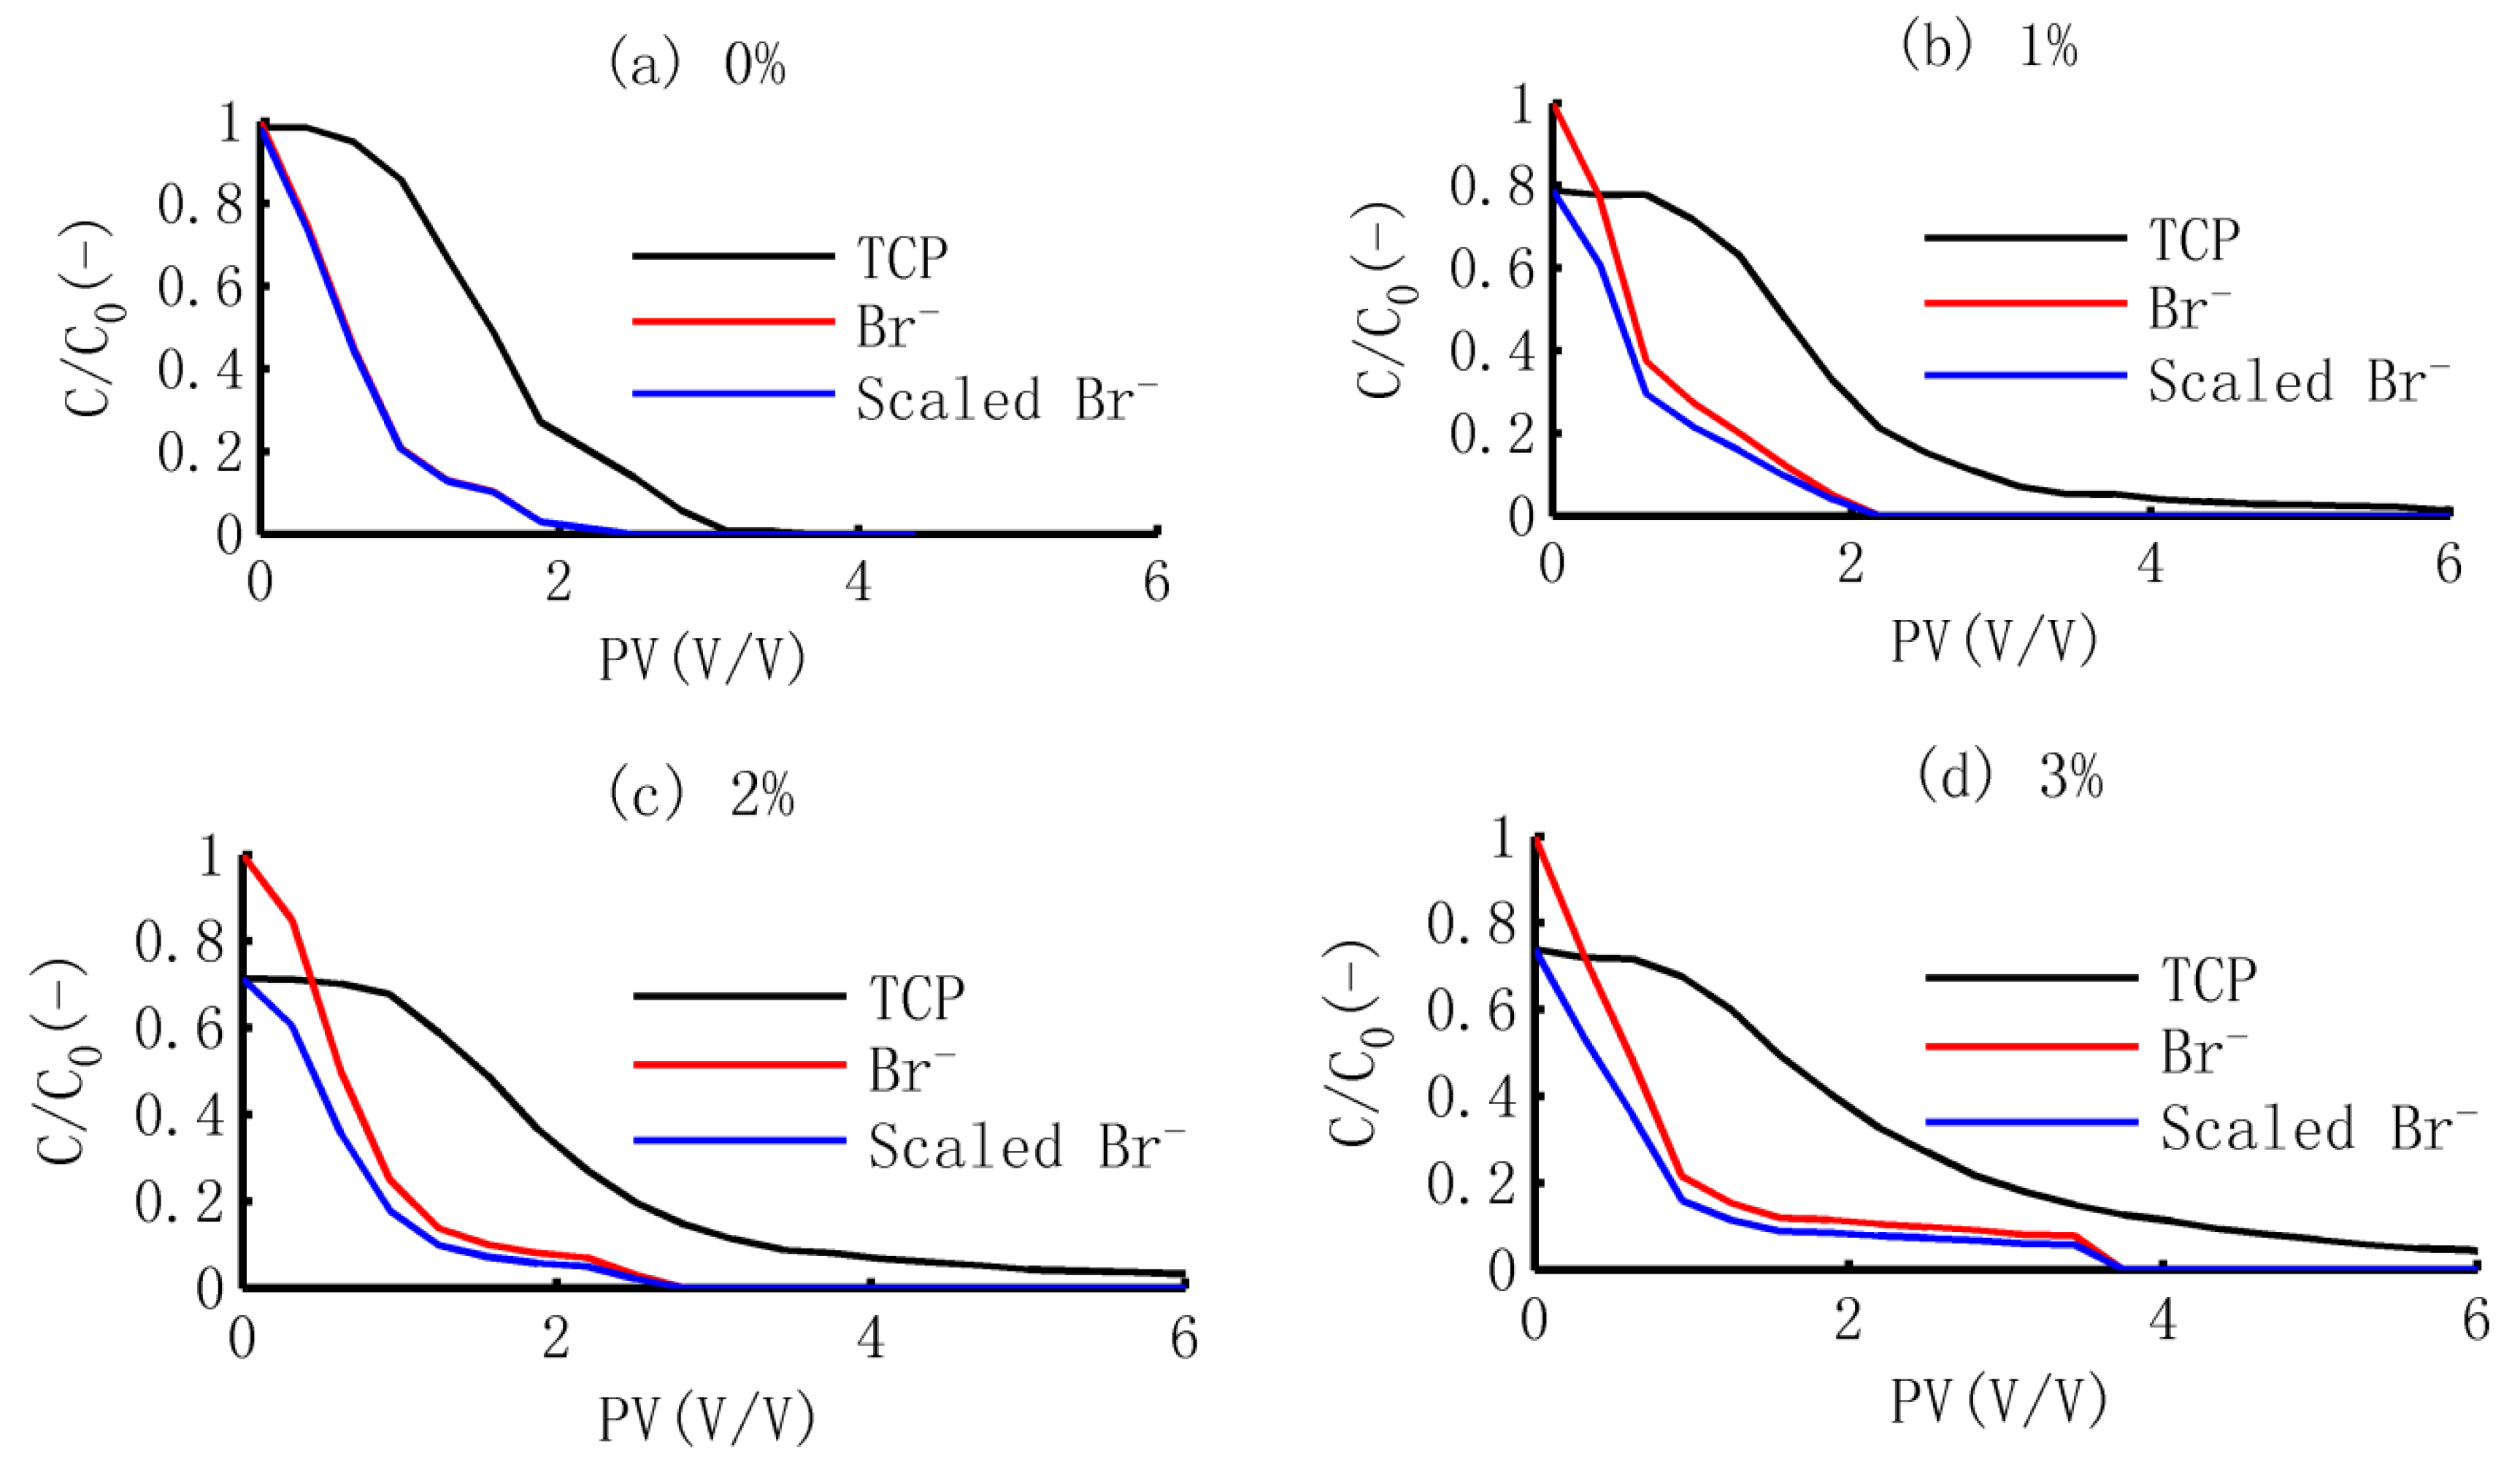
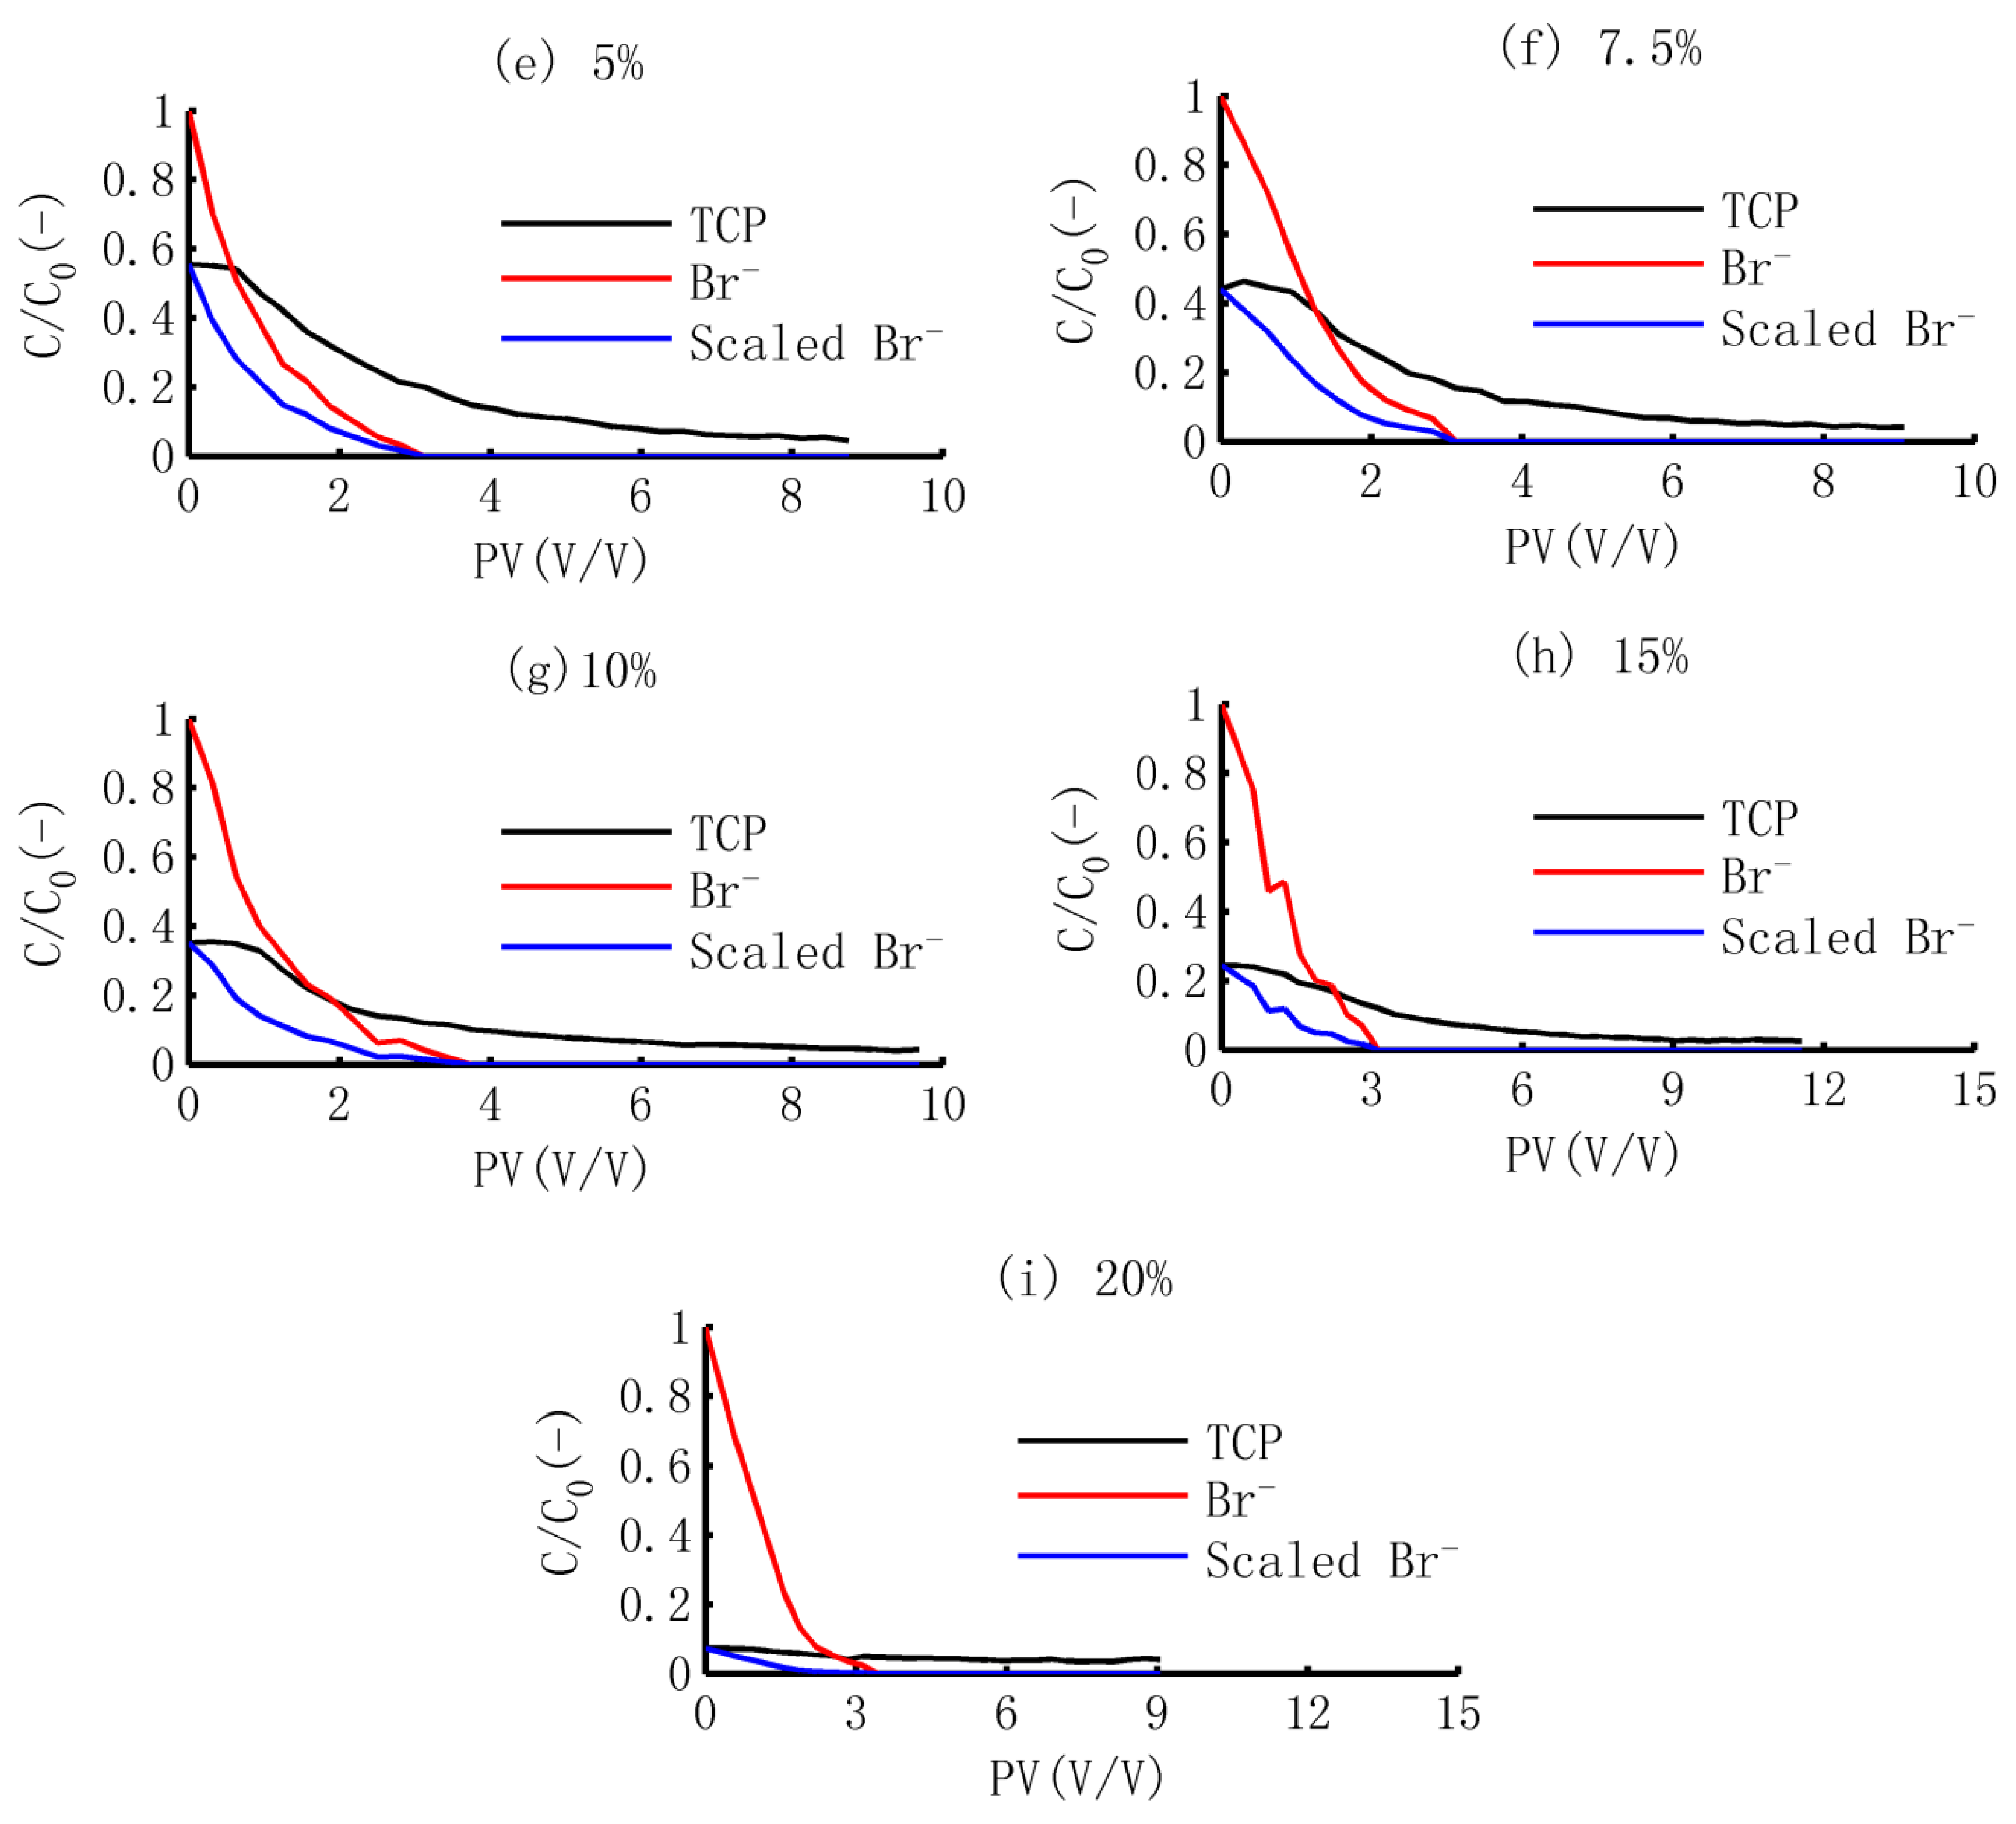
3.1. The BTCs of TCP and Br−
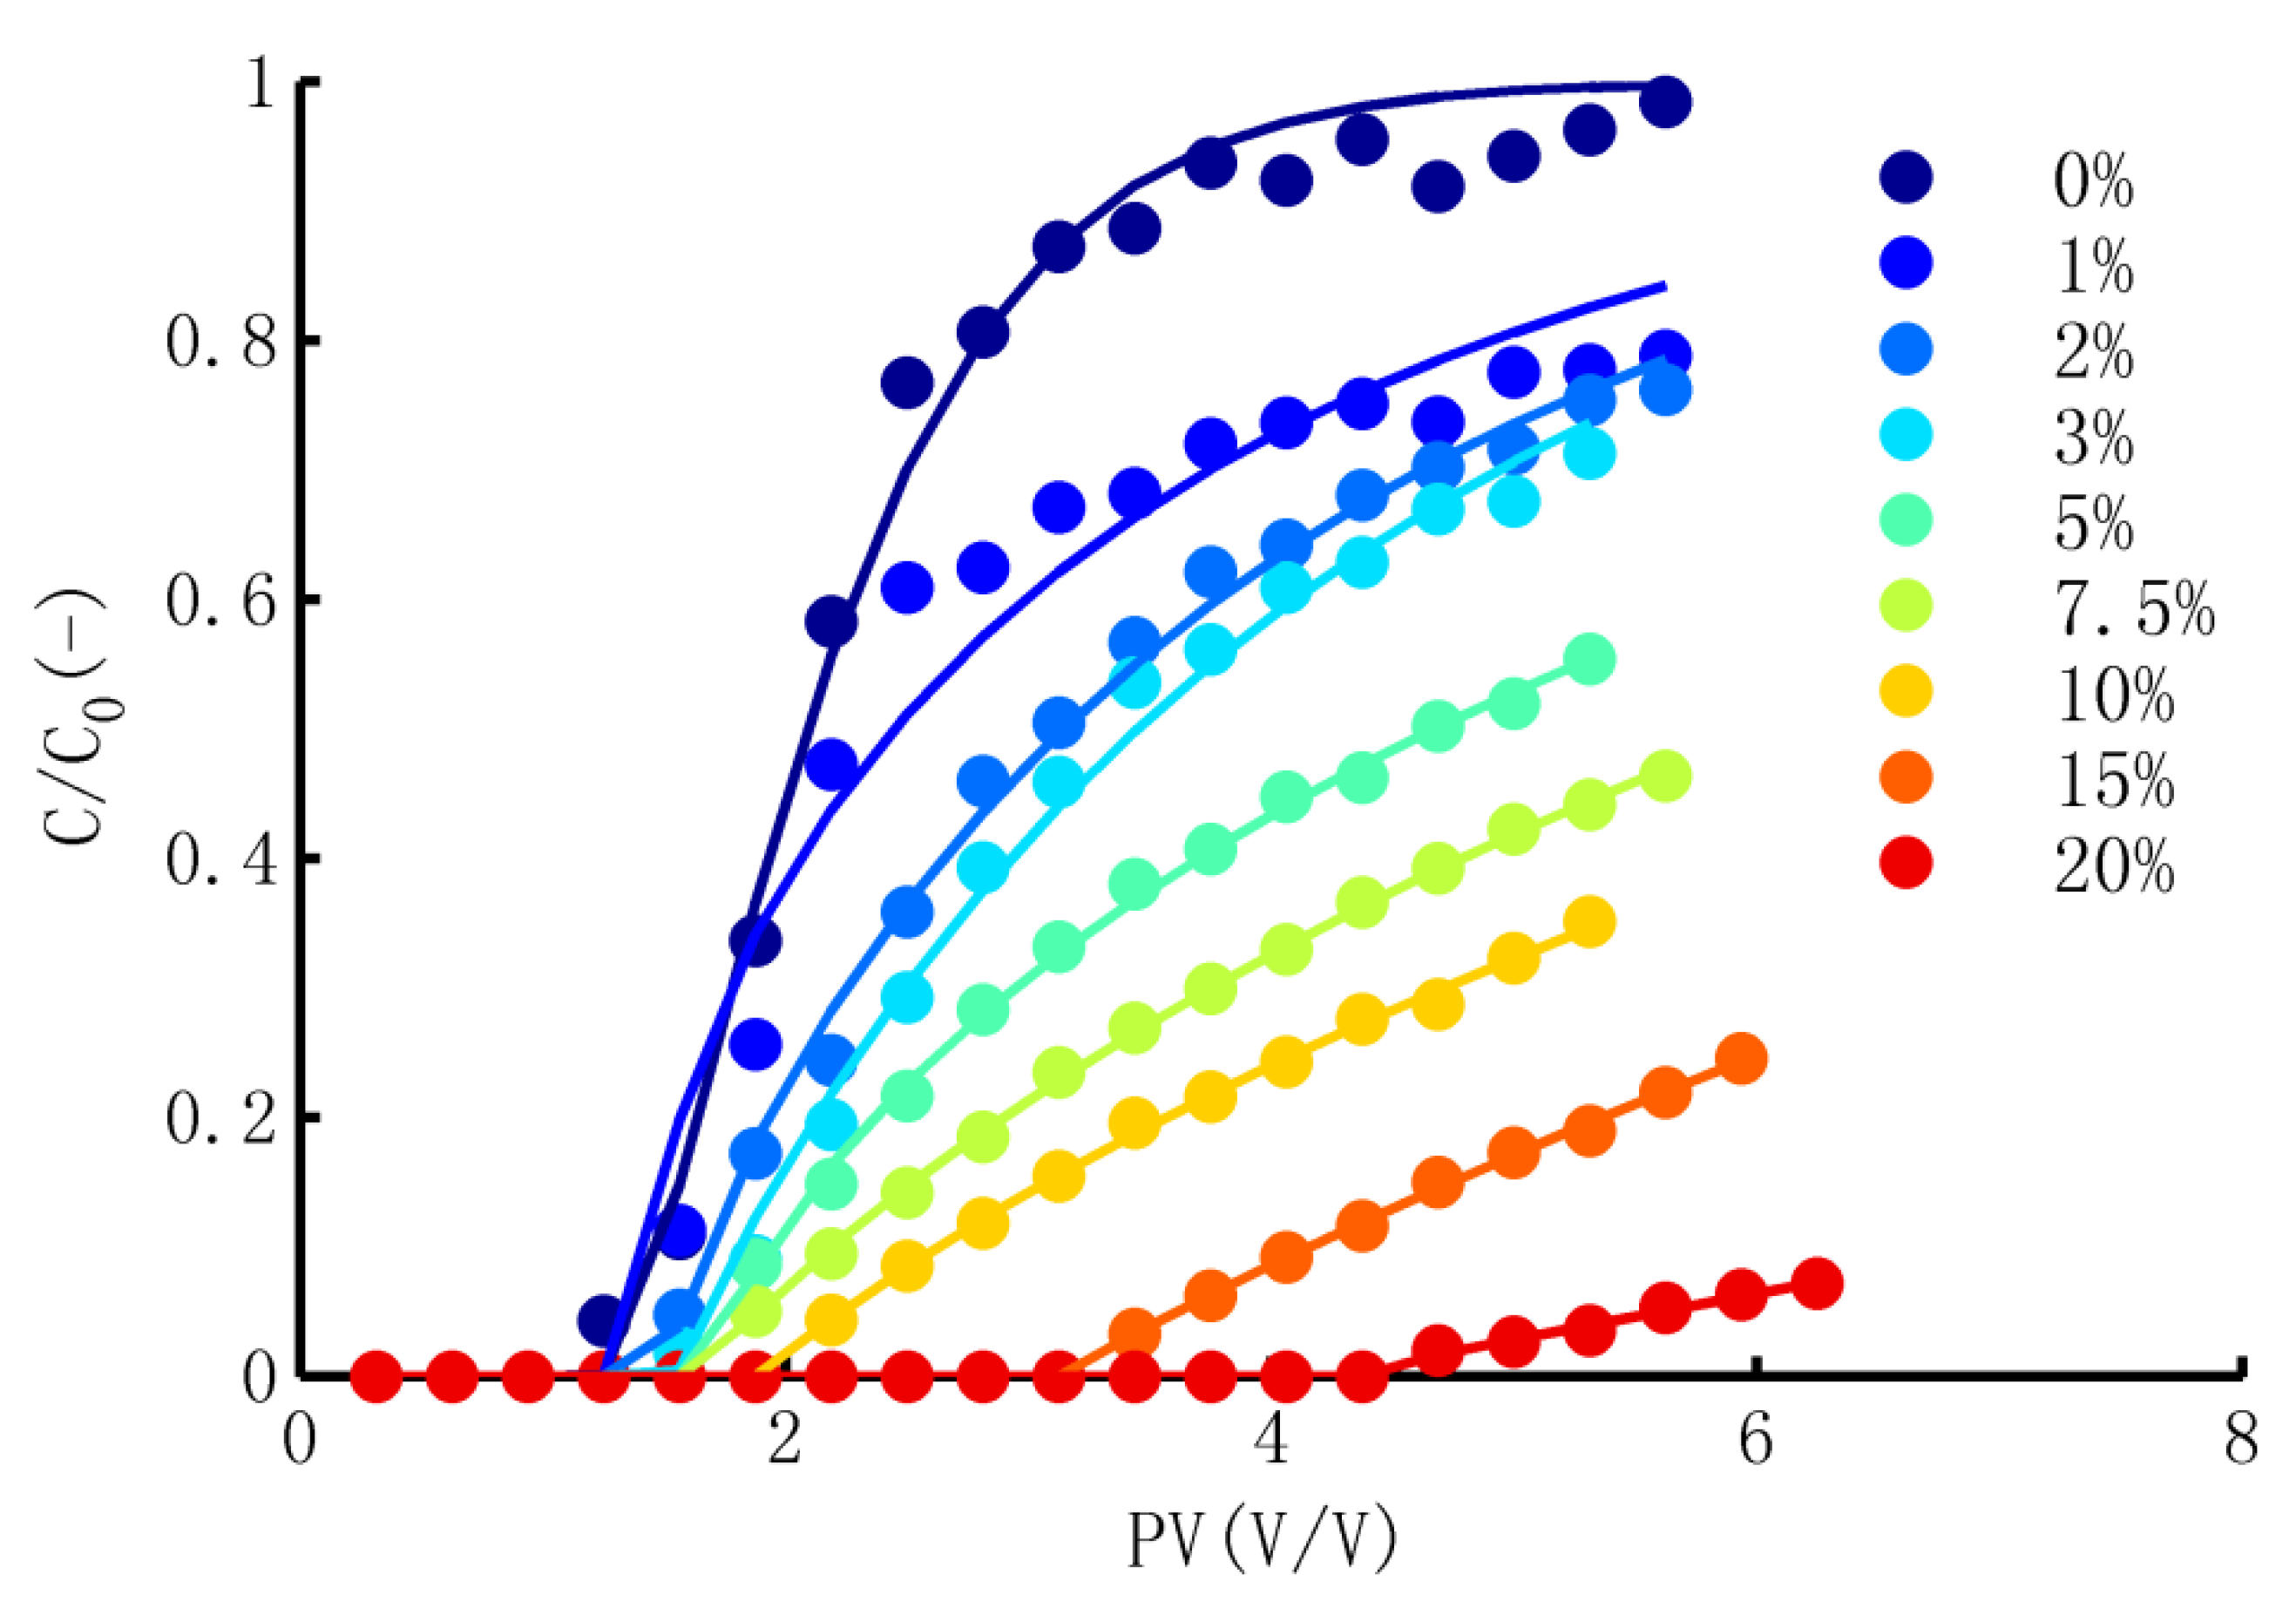
3.2. Simulation of TCP in Adsorption Process
- (1)
- Performance of the Model
- (2)
- Meanings of the parameters
- ①
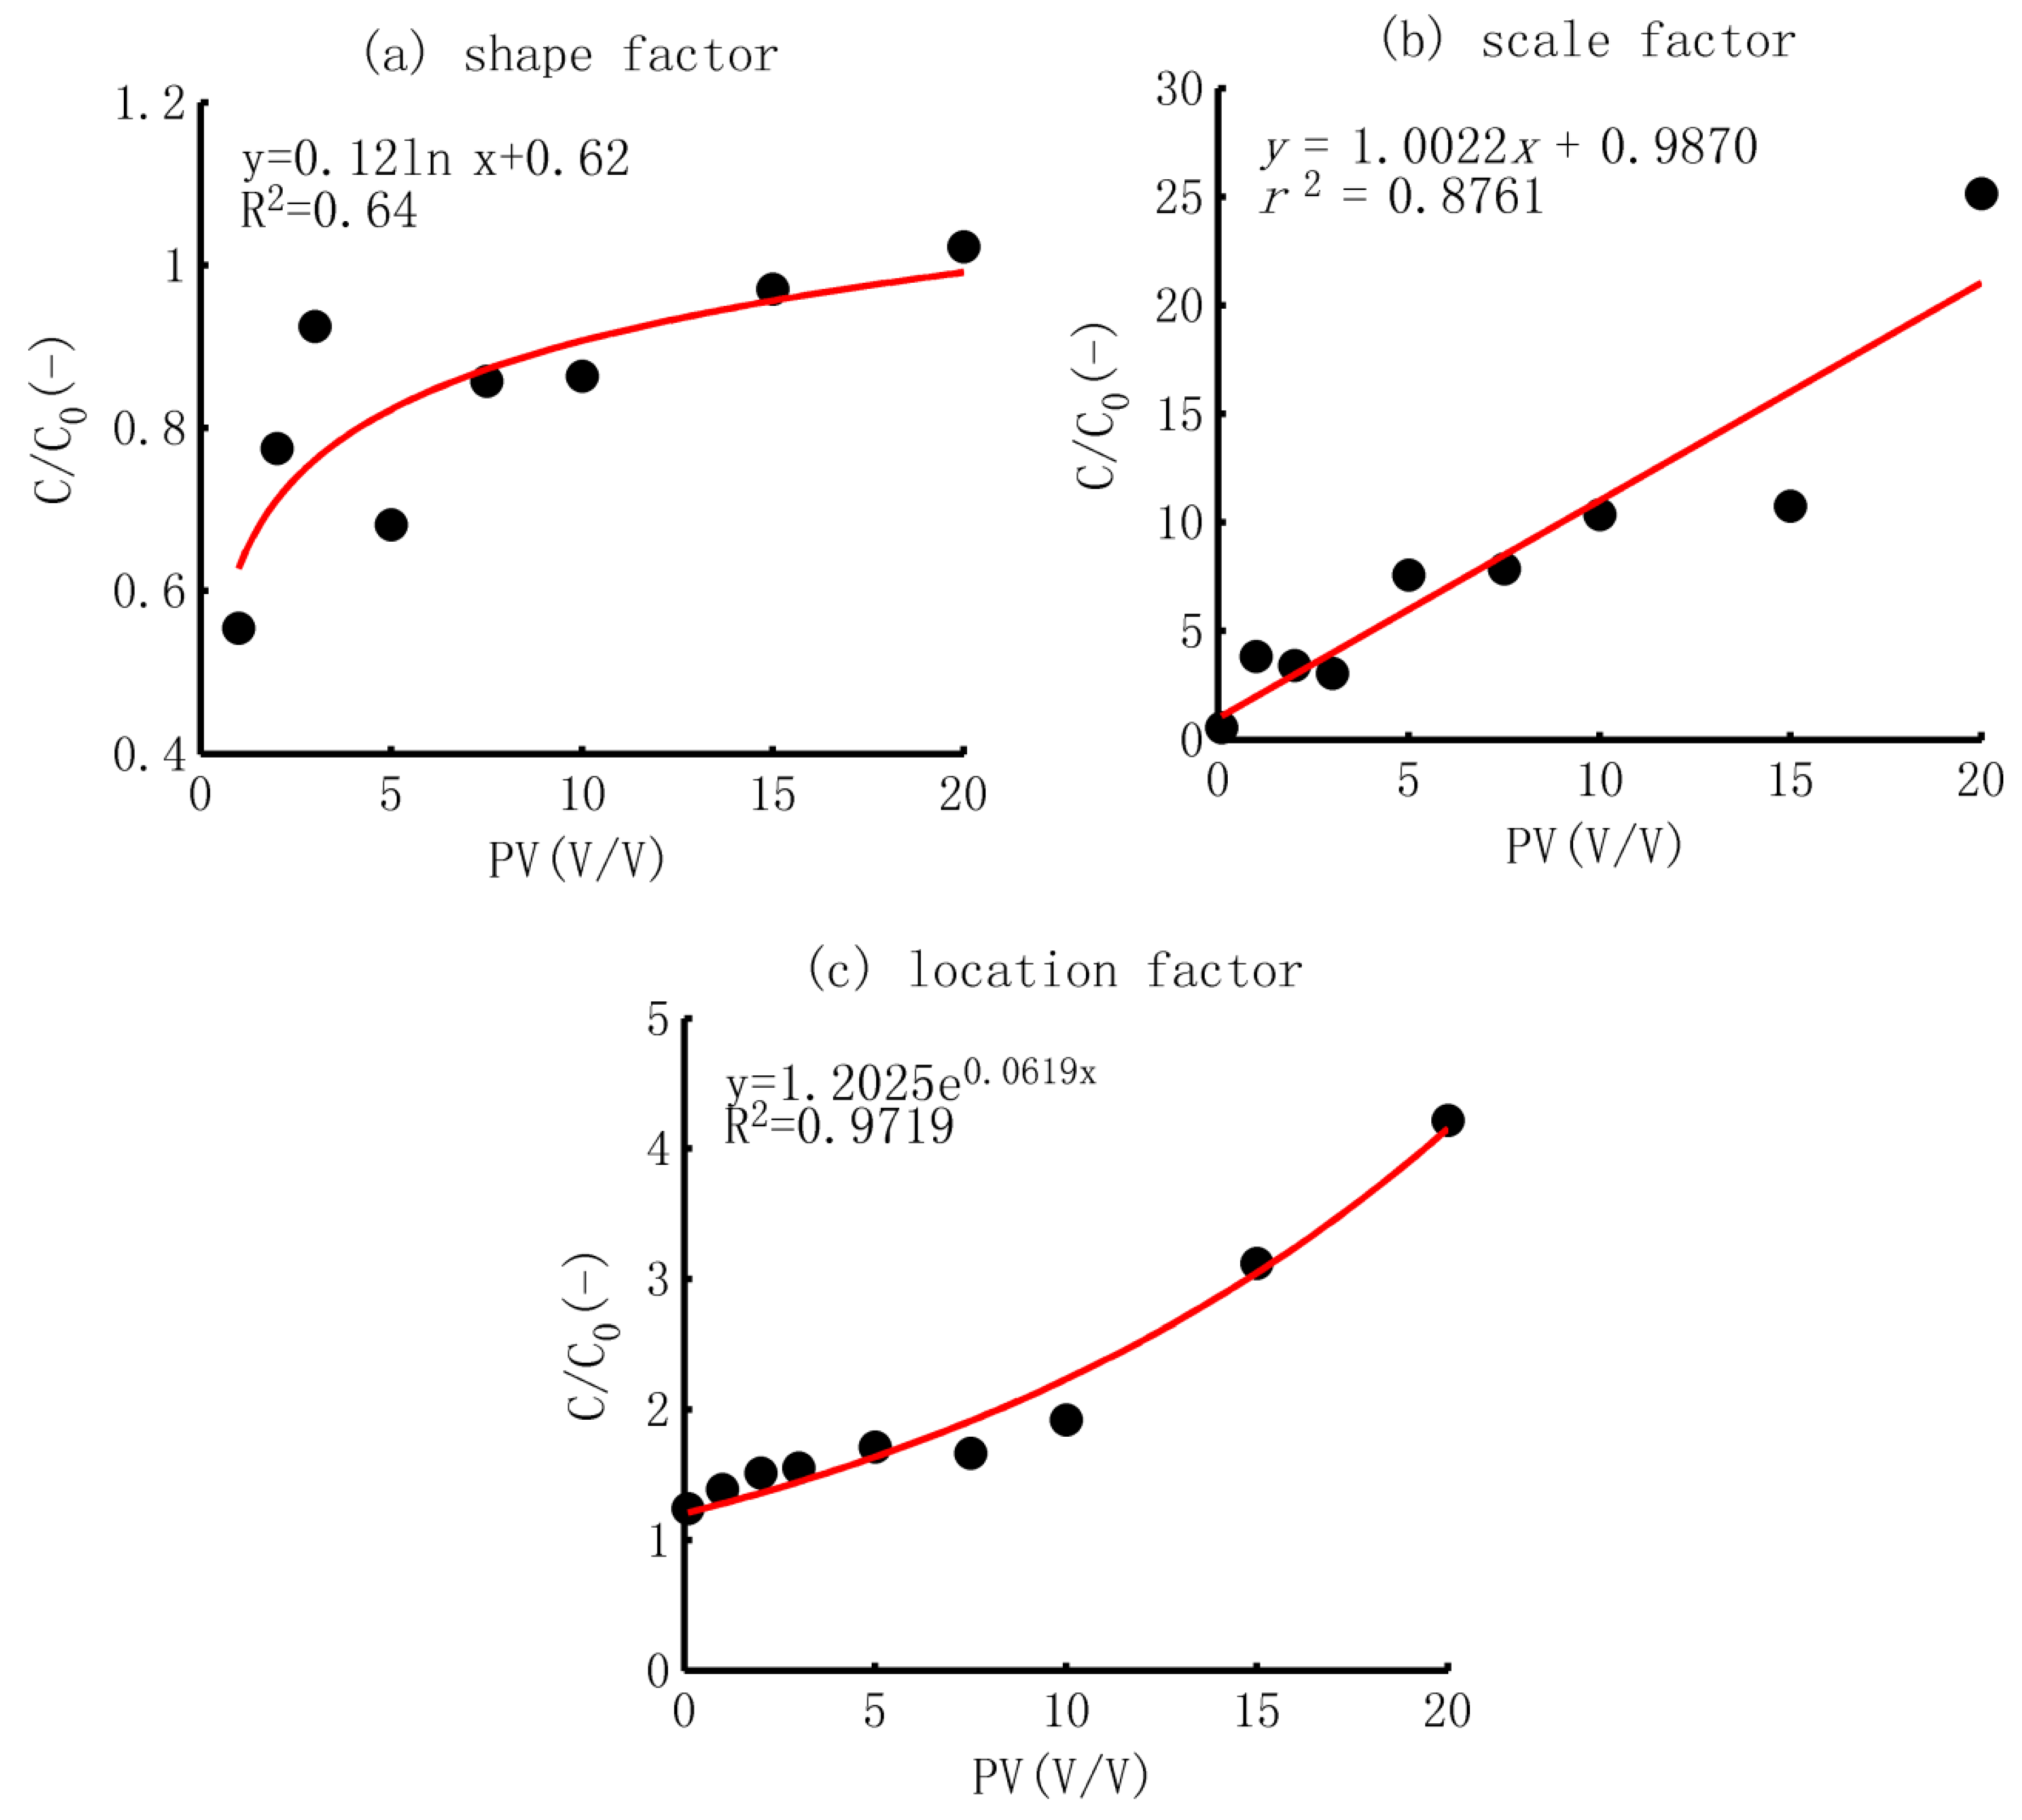
- Shape factor α. The shape factor generally displays two types: larger than one and equal to or less than one. The first type was observed in the soil column without biochar application, showing a maximum shape factor of 1.82. The shape factors of the other soil samples were smaller than one. In addition, after a scatter analysis and curve fitting, it was found that the shape factors that were less than one increased logarithmically with a rise in the biochar application rate, as shown in Figure 3a.
- ②
- Scale factor β. The scale factor showed a linear trend with the increase in the biochar application rate, as shown in Figure 3b. Based on the CDF of the gamma distribution, the scale factor was correlated with the arithmetic mean; a larger scale factor meant a larger adsorption ability and a smaller rate of decrease.
- ③
- Location factor γ. The location factor increased exponentially with the ratio of biochar application, as shown in Figure 3c. The location factor reflected that the inputted TCP was absorbed completely by the soil if the amount was smaller than this value. The exponential increase pattern also implied that the location factor would not increase substantially when the biochar application rate was smaller than 5%, but the rate of increase would be much larger in soil mixed with a higher content of biochar.
- (3)
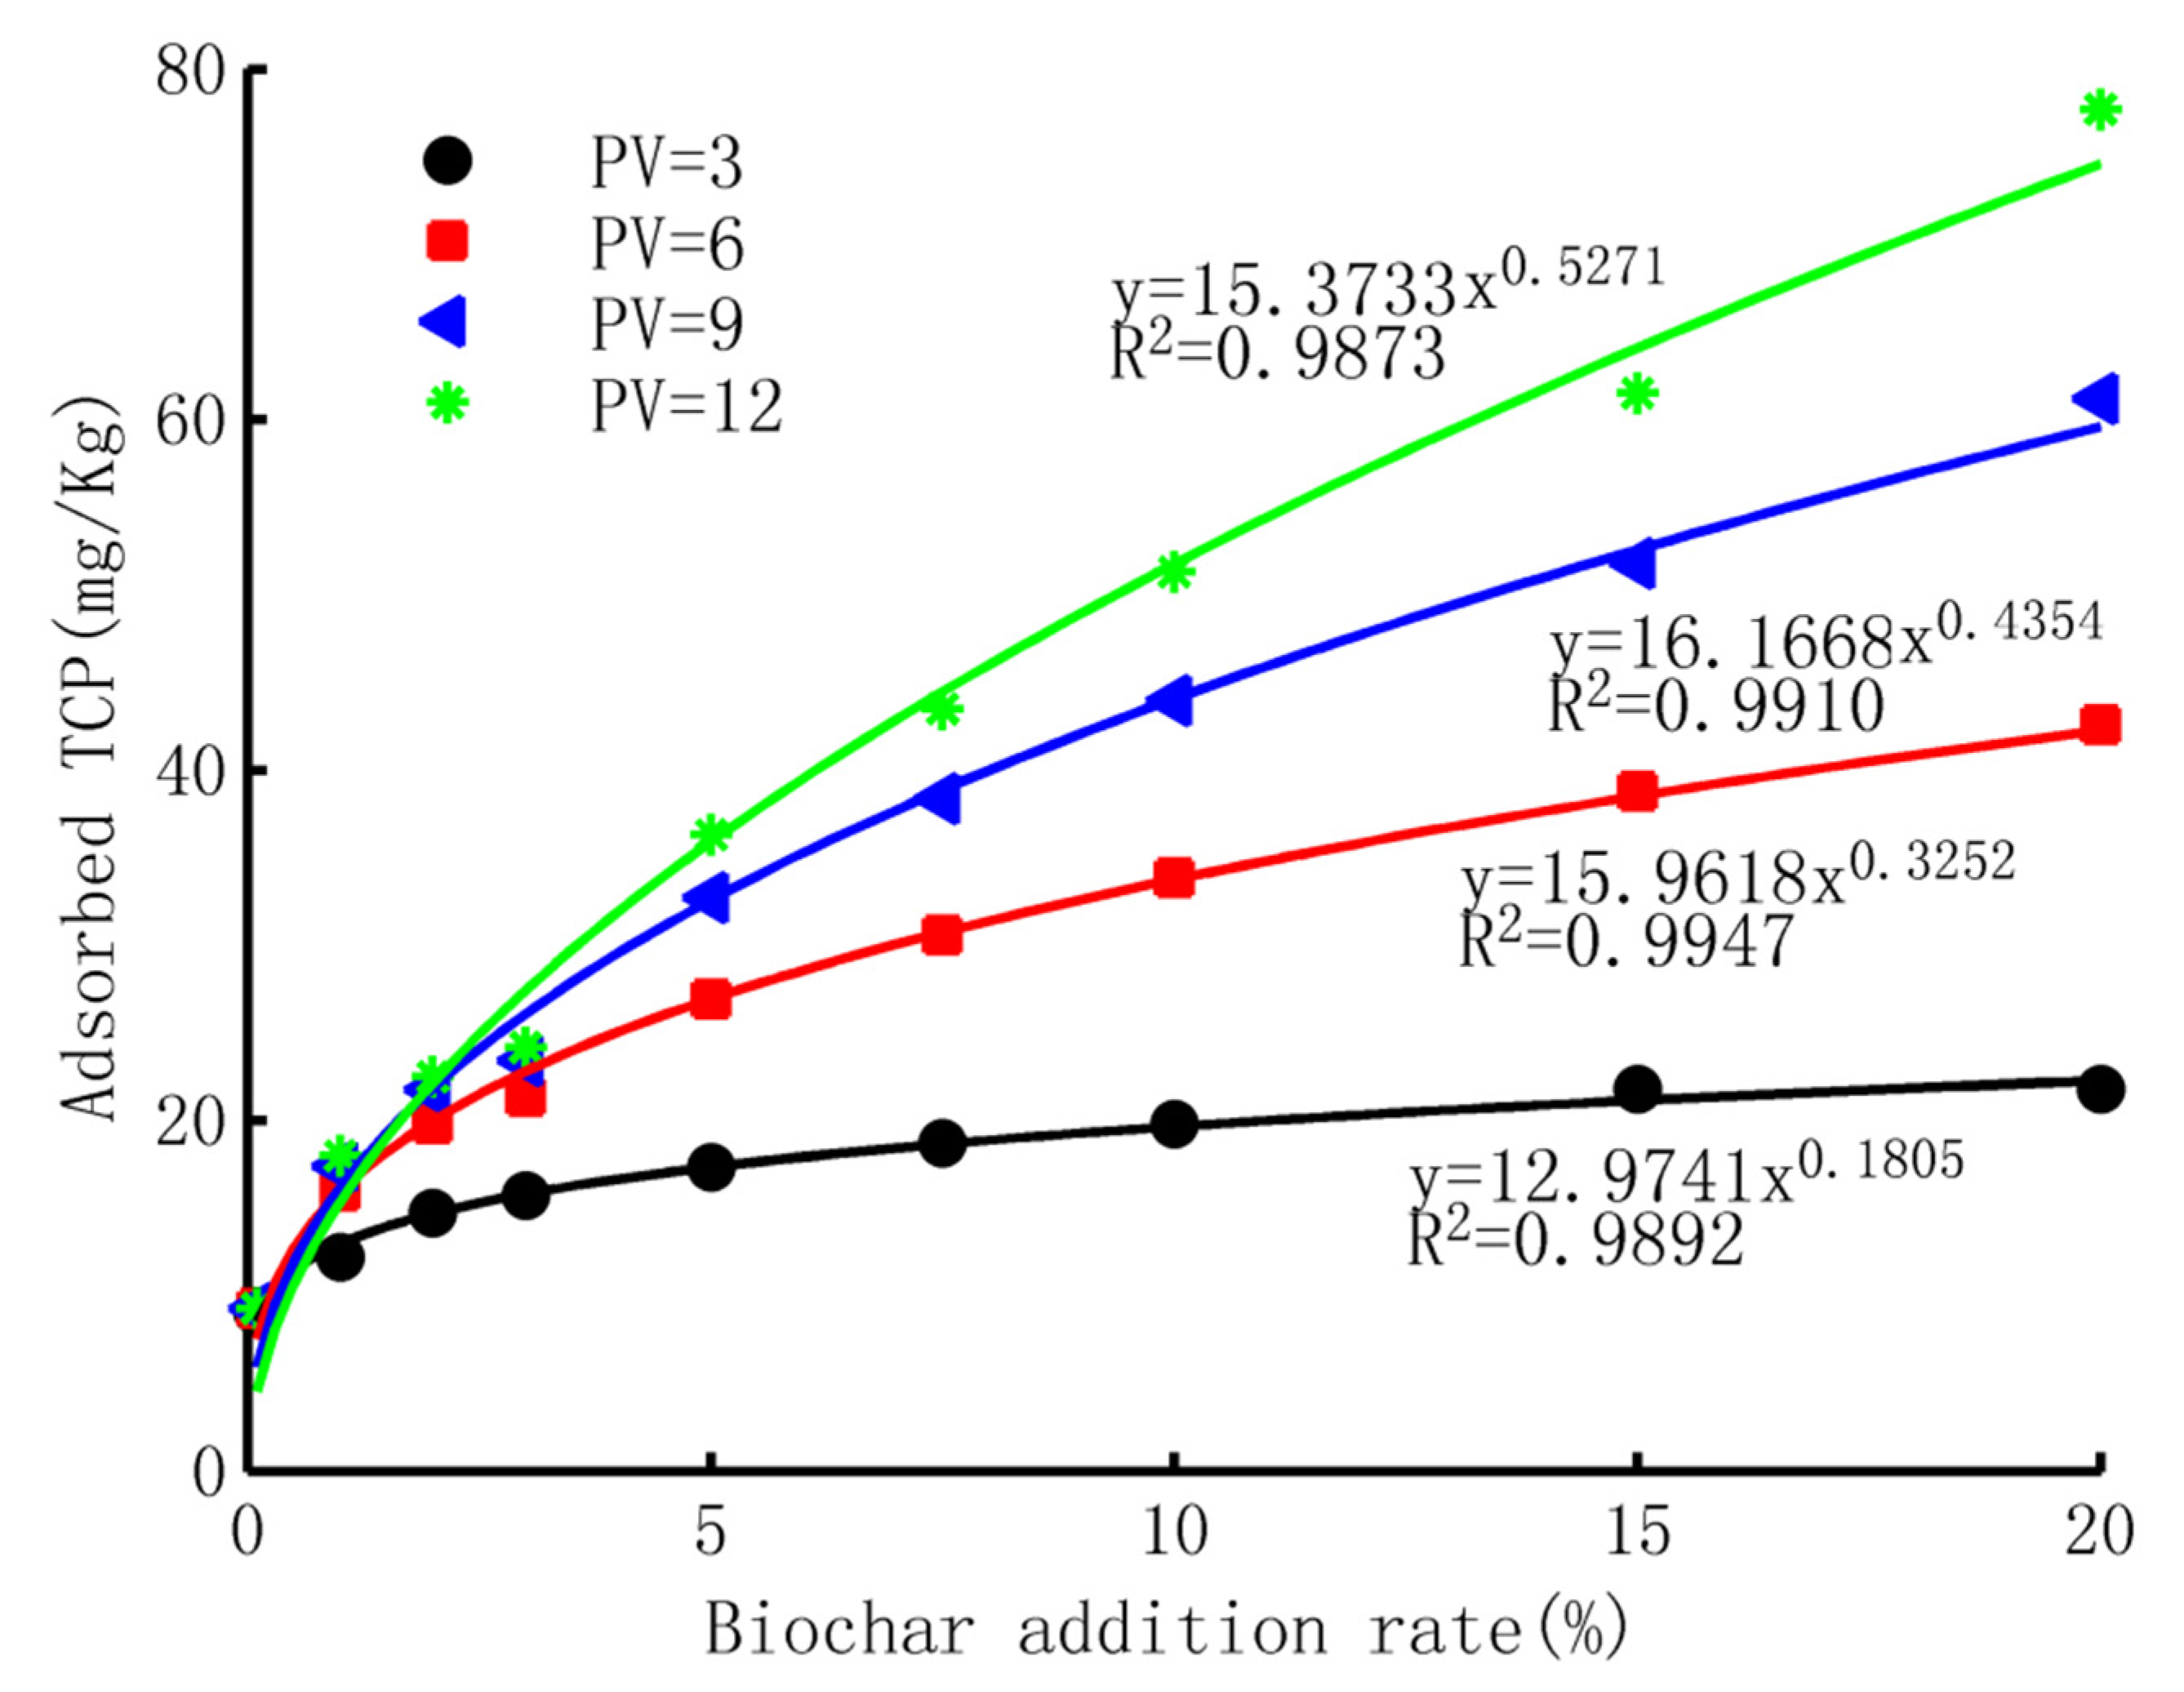
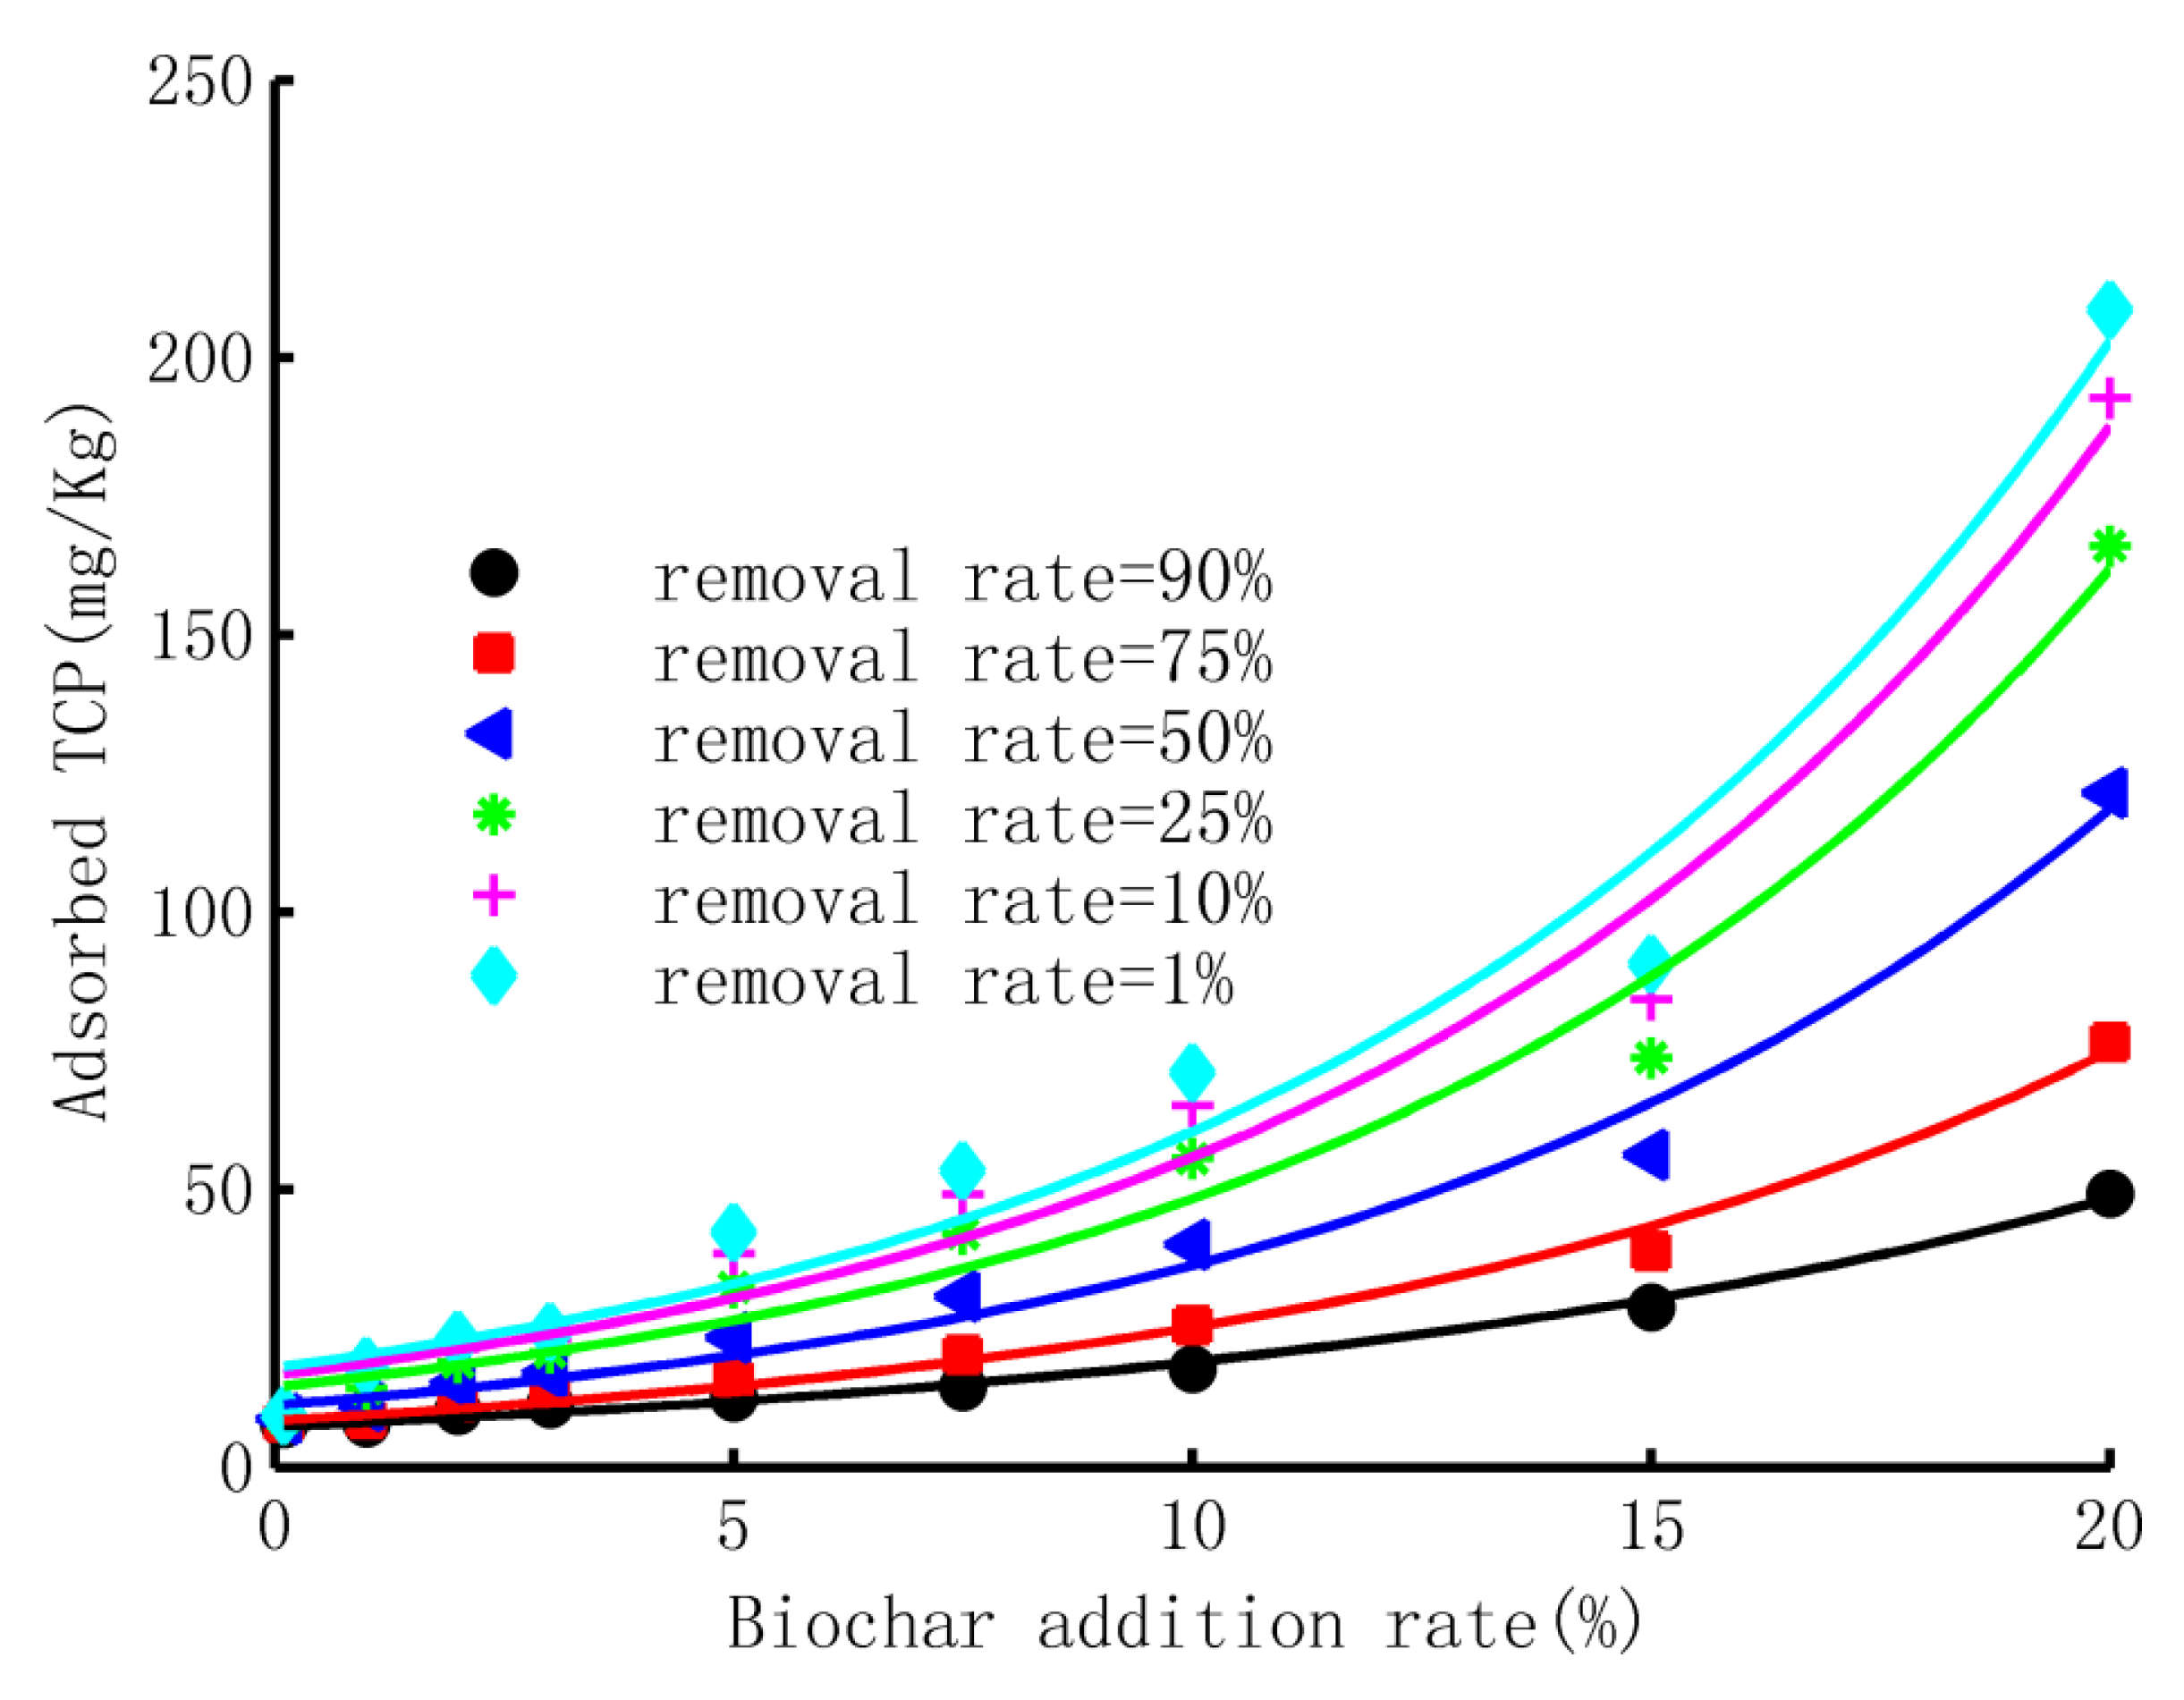
- Adsorbed TCP Versus biochar application rate
- (4)
- The adsorption ability of biochar-mixed soil
3.3. The Desorption Process
3.3.1. Scaled BTCs of Br−
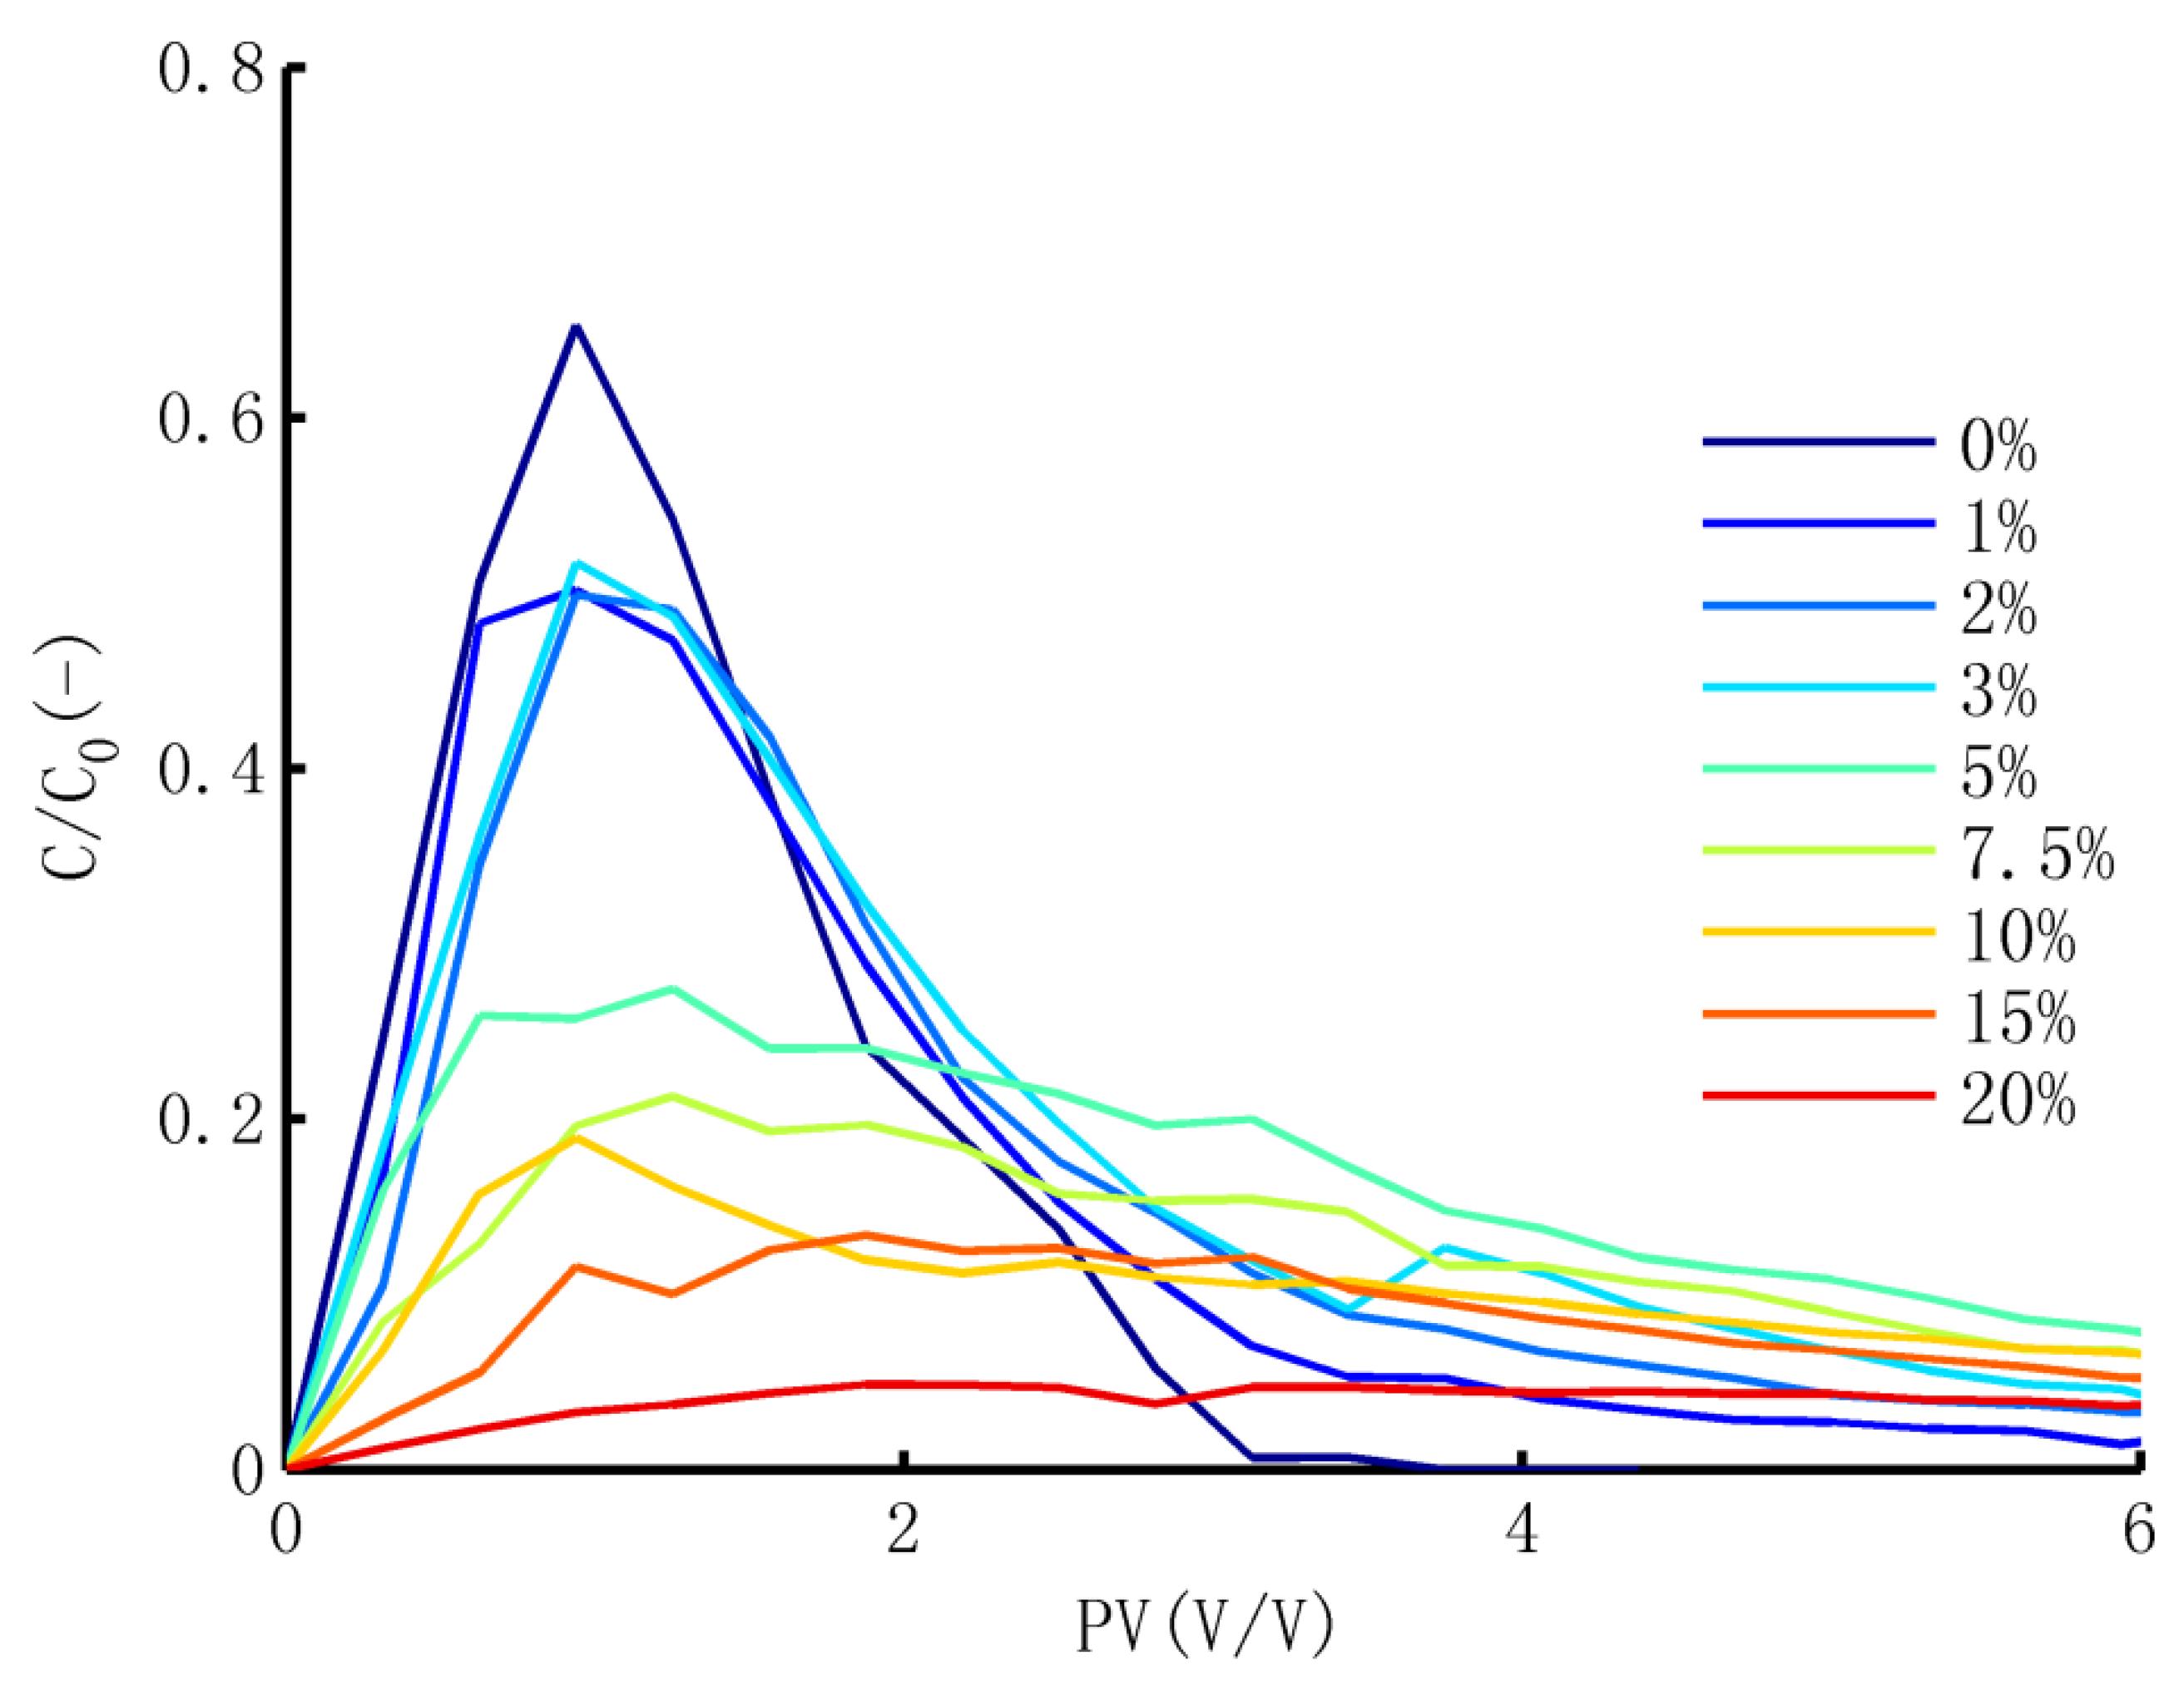
3.3.2. Dynamic Release of TCP
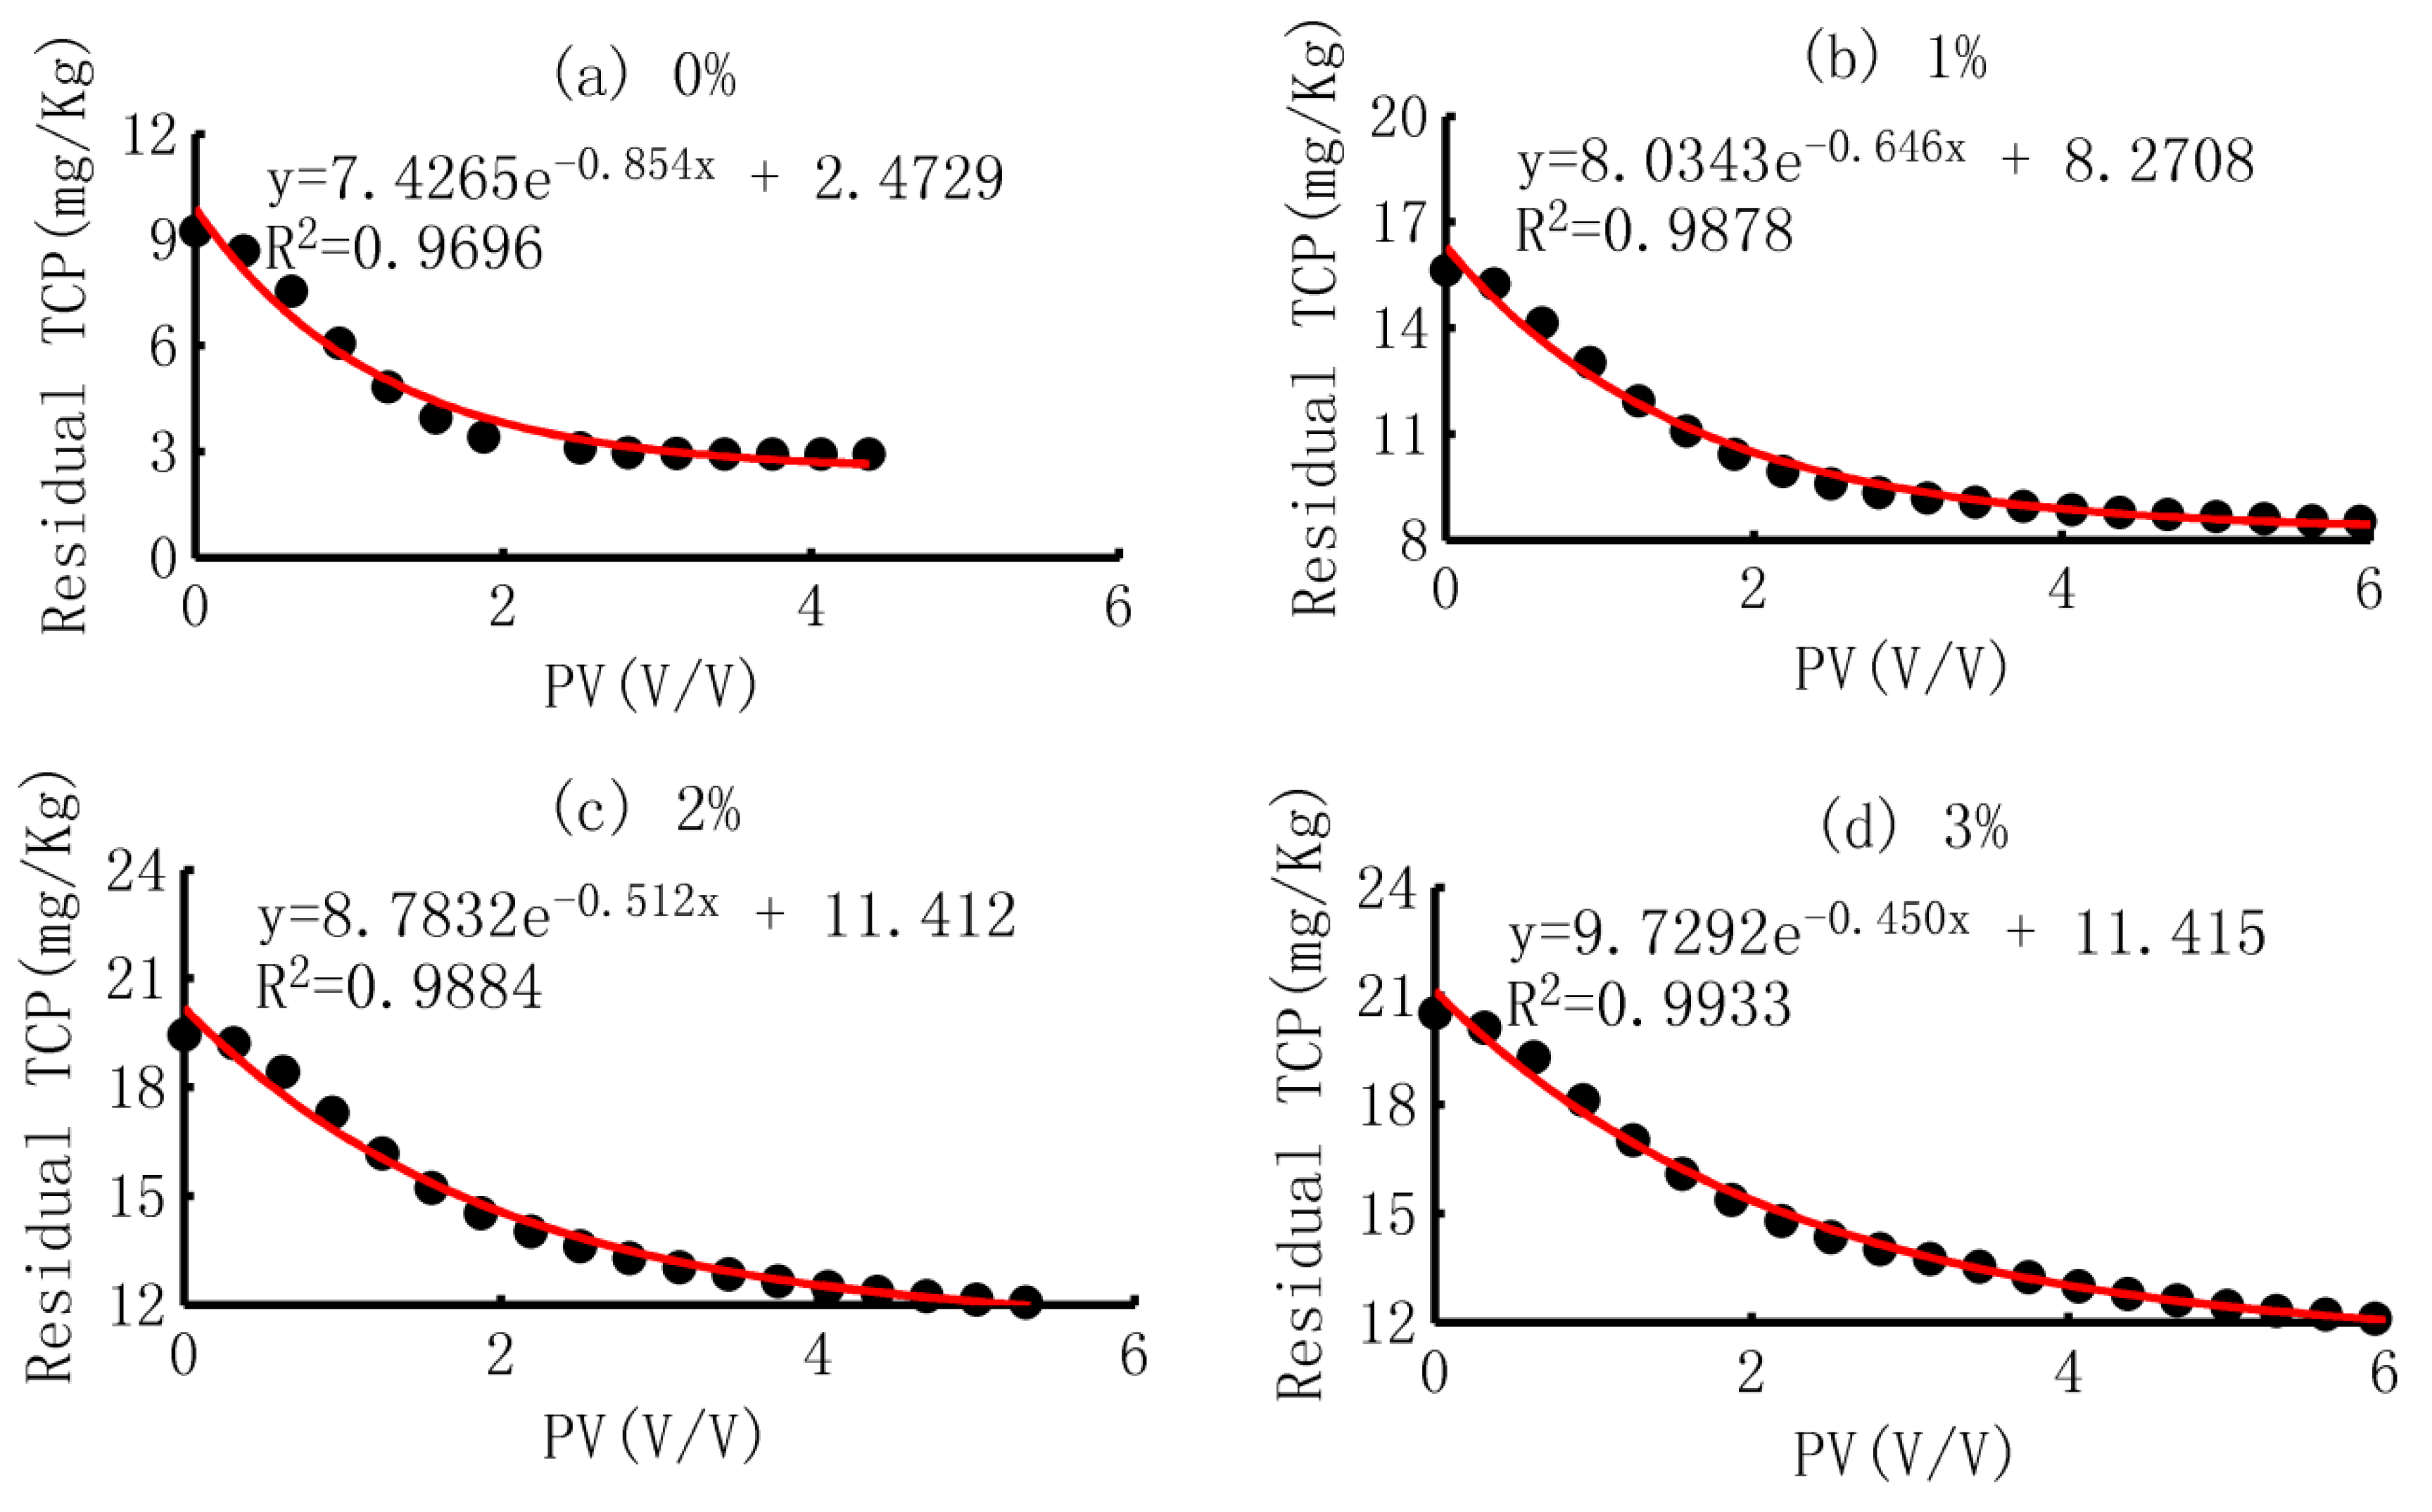
3.3.3. Curve Fitting and the Meaning of Parameters
- (1)
- Curve fitting
- (2)
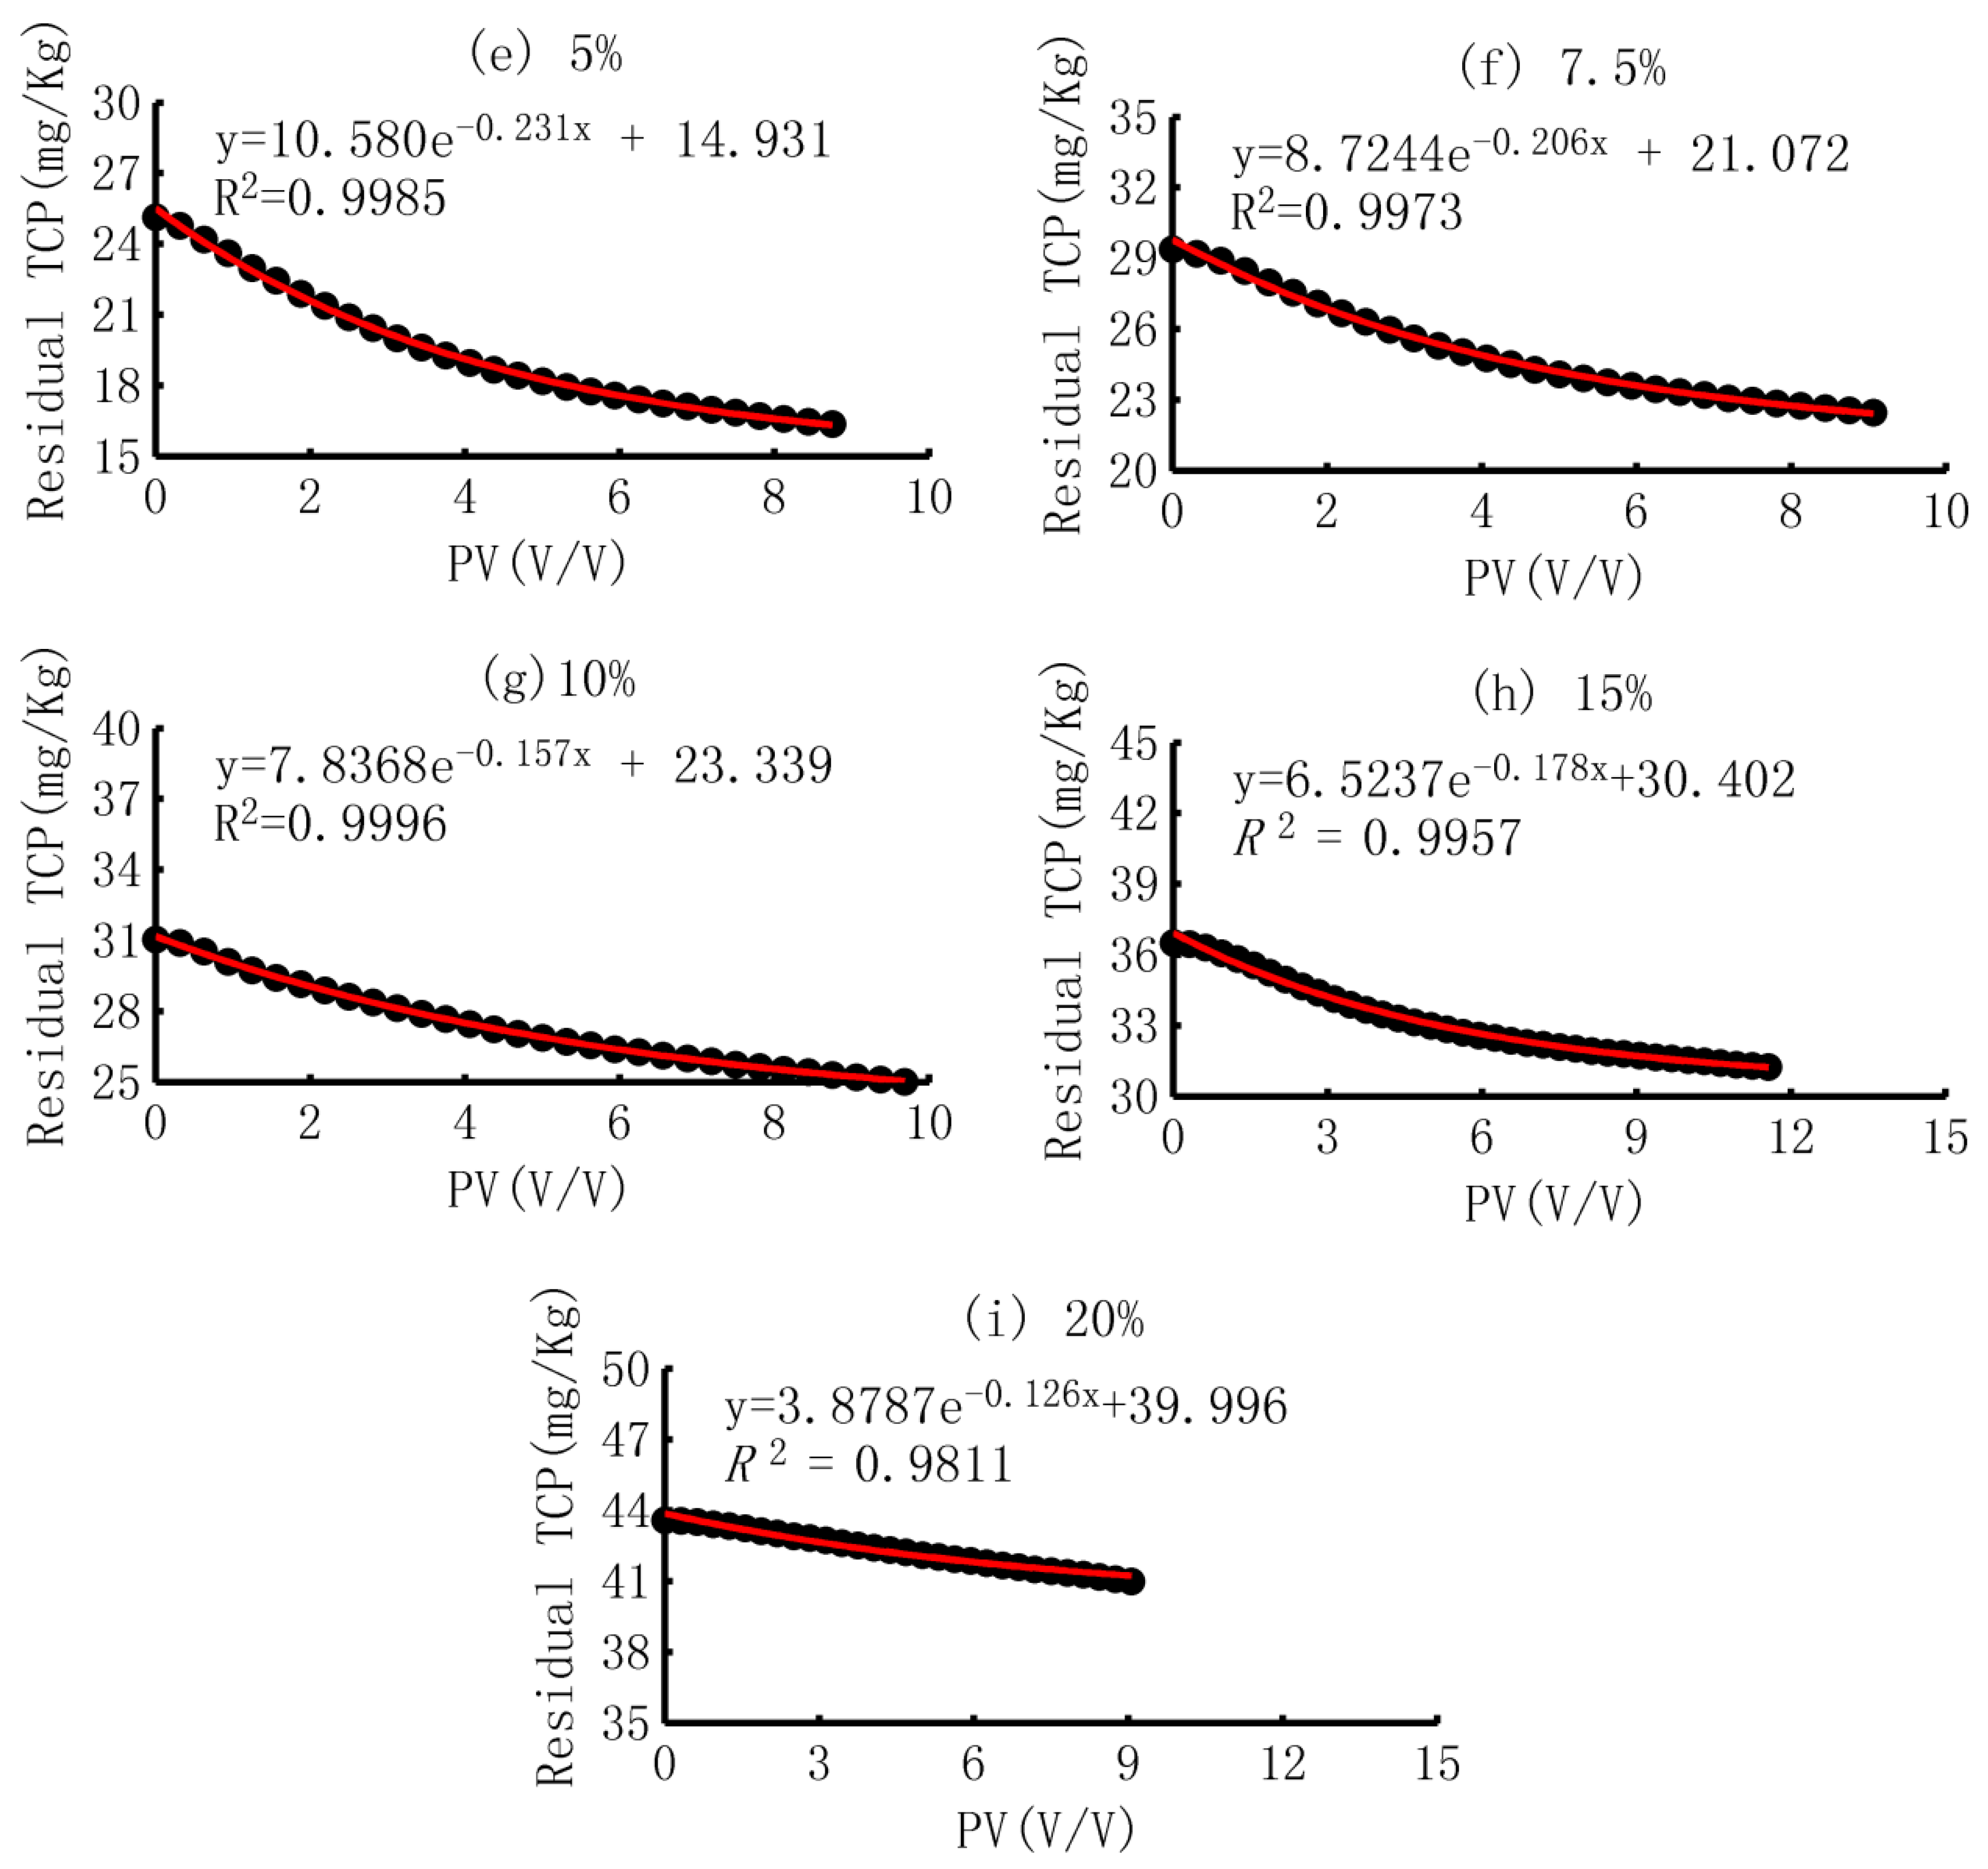
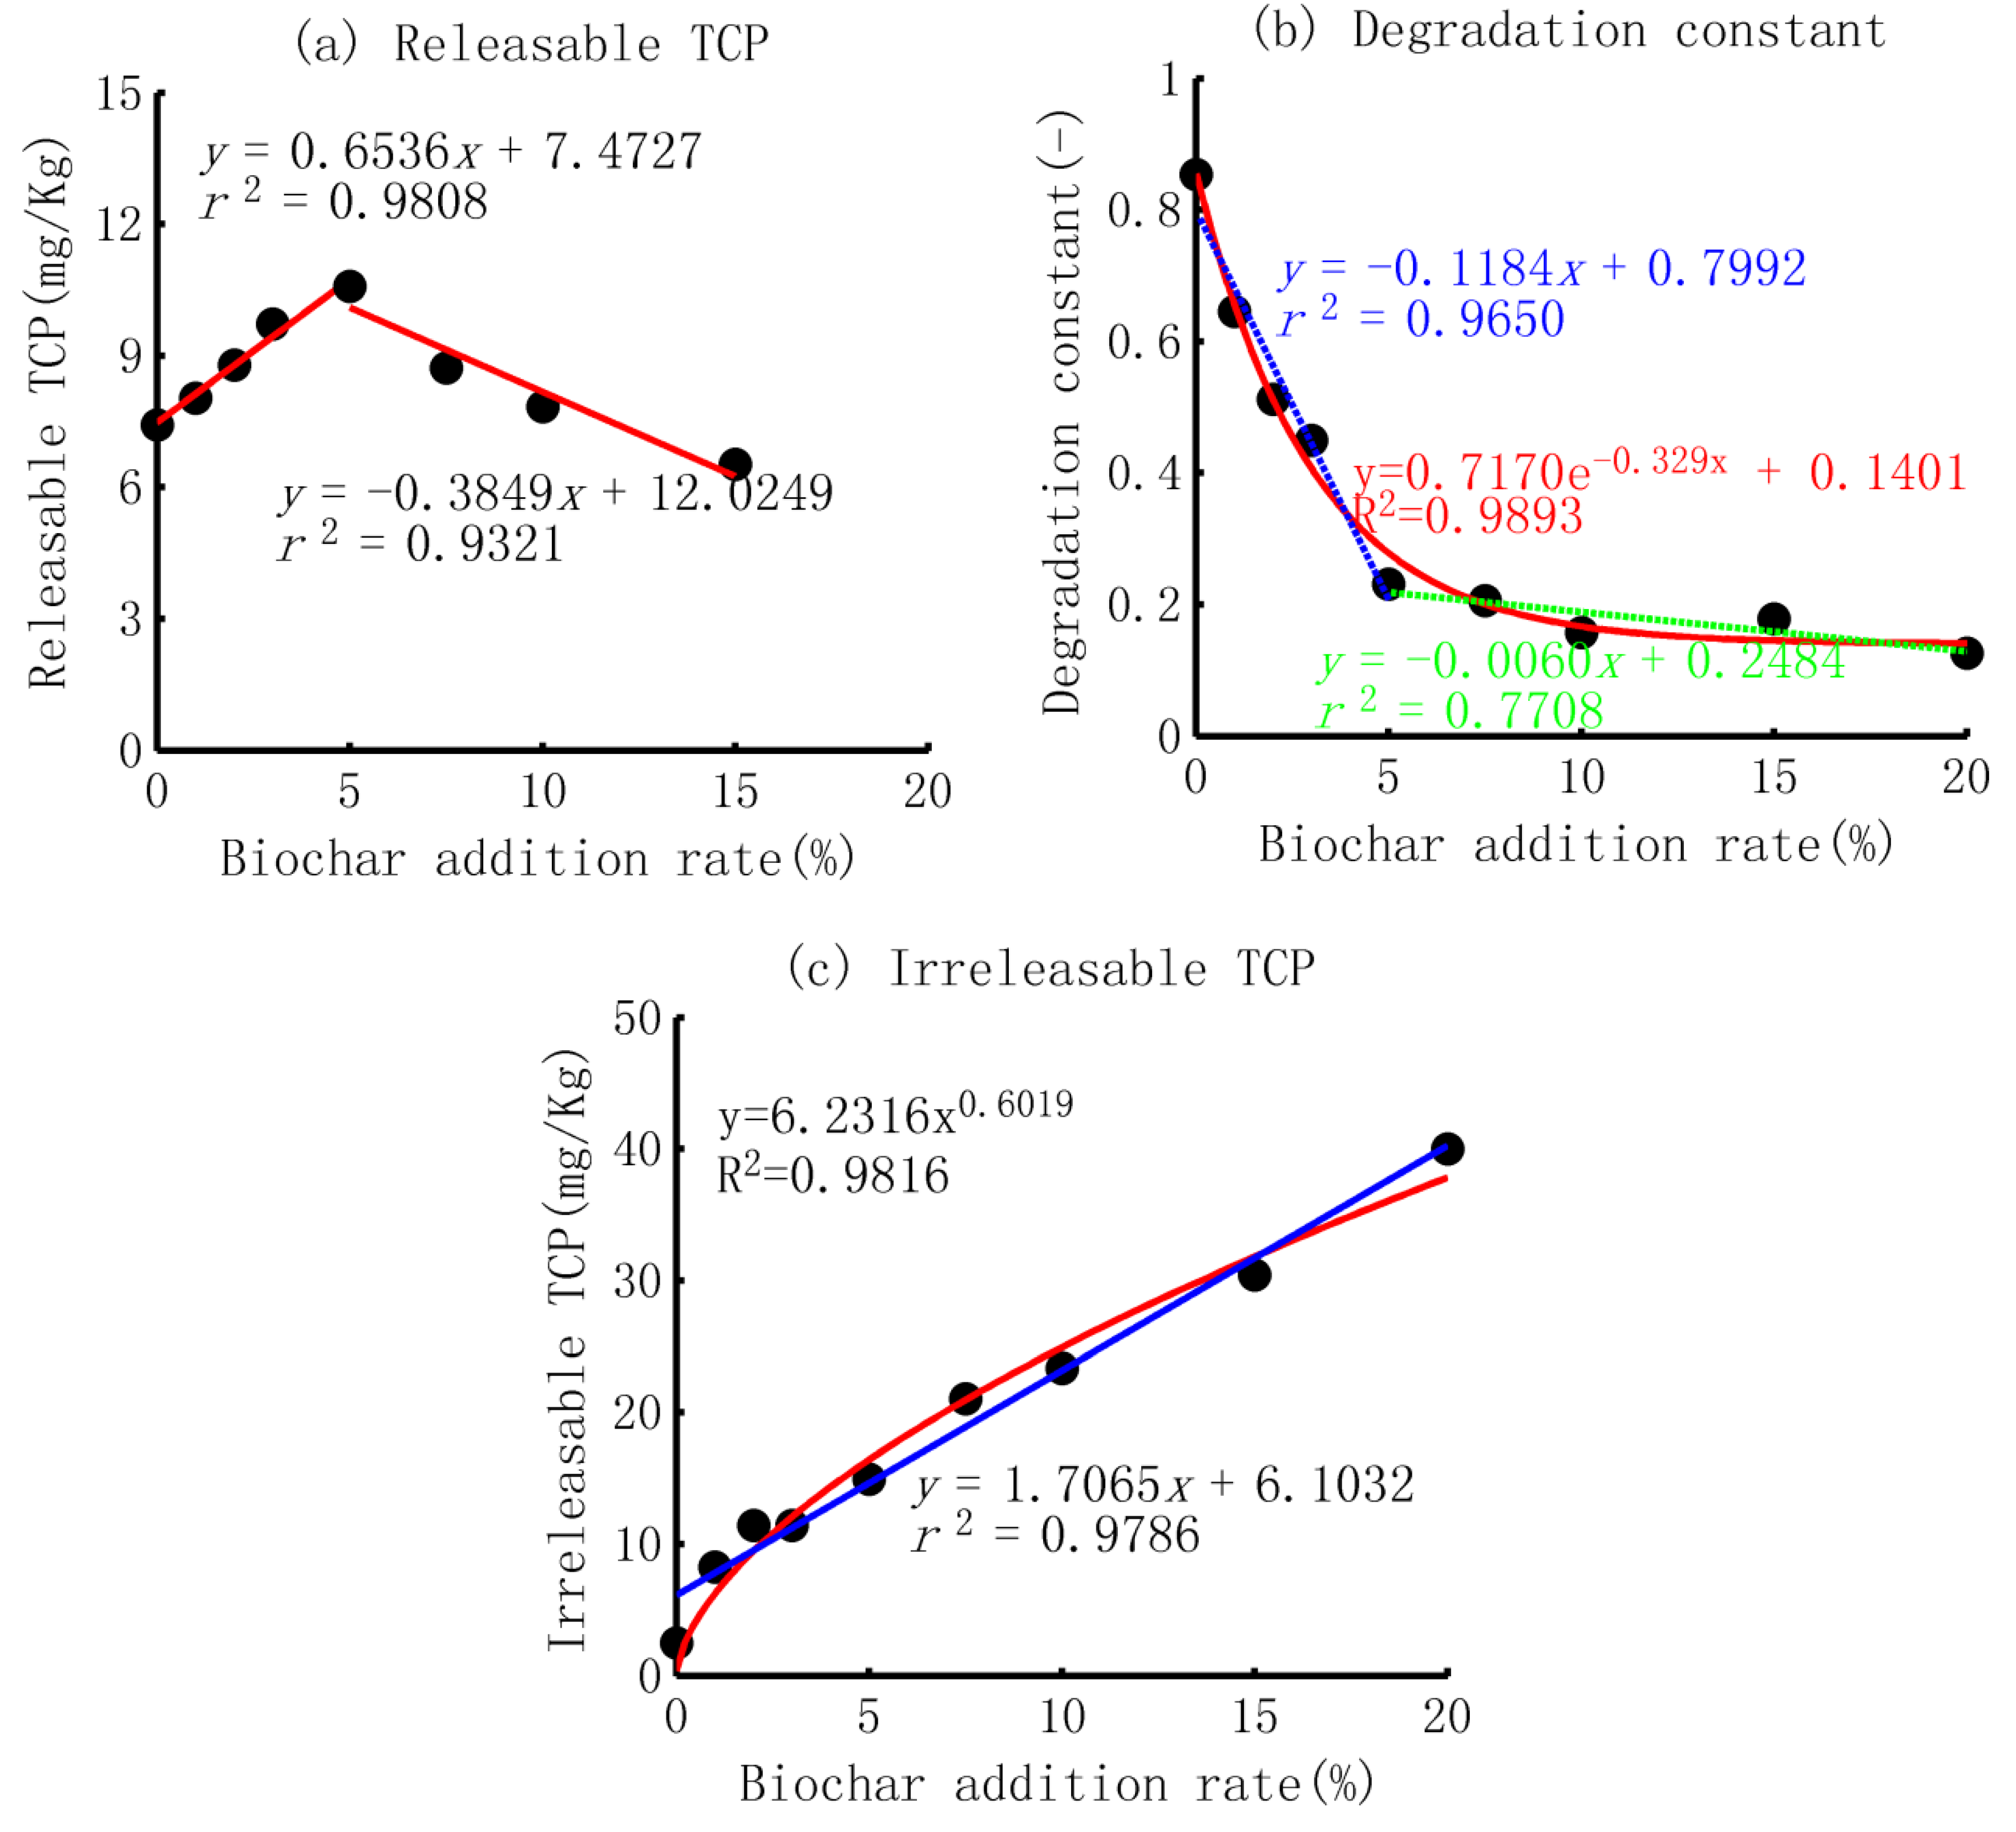
- Trend of the parameters
4. Discussions
4.1. Adsorption Process
- (1)
- The shape factors: smaller Vs larger than 1
- (2)
- The exponential increase of the adsorption ability
4.2. Release of TCP from the Biochar-Mixed Purple Soil
4.2.1. Basic Pattern of the Release Process and its Implications
- (1)
- Basic pattern of the release process
- (2)
- Different releasing patterns and their implications
4.2.2. The First-Order Decay Kinetics Equation and the Physical Meaning of the Parameters
- (1)
- The increase–decrease pattern of the releasable TCP
- (2)
- The exponential decrease in the decay constant and power increase in the residual TCP
5. Conclusions
- (1)
- The breakthrough curves of TCP in the adsorption process could be well described by CDF of the three-parameter gamma distribution, with a minimum R2 of 0.97. The shape factor, scale factor, and location factor of the model showed a logarithmic trend, linear trend, and exponential trend with the increase in the biochar-addition rate, respectively. The experimental data and simulated results revealed that the adsorption ability of the purple soil increased exponentially with the content of biochar application, implying a small improvement with a low content of biochar application but a much larger improvement with a higher ratio of biochar.
- (2)
- The release of TCP could be well simulated by the general form of the first-order decay equation, and the three parameters represented the releasable amount, decay constant, and unreleasable amount. The releasable TCP displayed a linear increase–decrease pattern, and the maximum was at a 5% biochar addition. The reasons were a smaller concentration gradient before this content and an overlapping of the adsorption force for soil mixed with a higher content of biochar. The decay constant decreased exponentially with the ratio of biochar application; the residual TCP increased in a power function with an index smaller than one, implying the occupation of adsorption sites in the soil column.
Author Contributions
Funding
Institutional Review Board Statement
Informed Consent Statement
Data Availability Statement
Conflicts of Interest
References
- Saunders, M.; Magnanti, B.L.; Correia, C.S.; Yang, A.; Alamo-Hernández, U.; Riojas-Rodriguez, H.; Calamandrei, G.; Koppe, J.G.; Martin, K.; Keune, H.; et al. Chlorpyrifos and neurodevelopmental effects: A literature review and expert elicitation on research and policy. Environ. Health 2012, 11, S5. [Google Scholar] [CrossRef] [PubMed] [Green Version]
- Dechene, A.; Rosendahl, I.; Laabs, V.; Amelung, W. Sorption of polar herbicides and herbicide metabolites by biochar-amended soil. Chemosphere 2014, 109, 180–186. [Google Scholar] [CrossRef]
- Das, S.; Hageman, K.J.; Taylor, M.; Michelsen-Heath, S.; Stewart, I. Fate of the organophosphate insecticide, chlorpyrifos, in leaves, soil, and air following application. Chemosphere 2020, 243, 125194. [Google Scholar] [CrossRef] [PubMed]
- Racke, K.D. Environmental fate of chlorpyrifos. In Reviews of Environmental Contamination and Toxicology; Springer: New York, NY, USA, 1993; pp. 1–150. [Google Scholar]
- Ganapathy, C. Environmental Fate of Triclopyr, Environmental Monitoring and Pest Management Branch; Department of Pesticide Regulation Sacramento: Sacramento, CA, USA, 1997; p. 18. [Google Scholar]
- Armbrust, K.L. Chlorothalonil and chlorpyrifos degradation products in golf course leachate. Pest. Manag. Sci. 2001, 57, 797–802. [Google Scholar] [CrossRef] [PubMed]
- Lei, W.J.; Zhou, X.Y. Experiment and simulation on adsorption of 3,5,6-Trichloro-2-Pyridinol in typical farmland of purple soil, Southwestern China. Soil. Sediment. Contam. 2017, 26, 345–363. [Google Scholar] [CrossRef]
- Lei, W.J.; Tang, X.Y.; Zhou, X.Y. Quantifying dynamic desorption of 3,5,6-trichloro-2-pyridinol in loamy farmland soils. Environ. Sci. Pollut. Res. 2019, 26, 30782–30793. [Google Scholar] [CrossRef]
- Lei, W.J.; Tang, X.Y.; Zhou, X.Y. Biochar amendment effectively reduces the transport of 3,5,6-trichloro-2-pyridinol (a main degradation product of chlorpyrifos) in purple soil: Experimental and modeling. Chemosphere 2020, 245, 125651. [Google Scholar] [CrossRef]
- Dai, H.; Asakawa, F.; Suna, S.; Hirao, T.; Karita, T.; Fukunaga, I.; Jitsunari, F. Investigation of indoor air pollution by chlorpyrifos: Determination of chlorpyrifos in indoor air and 3, 5, 6-trichloro-2-pyridinol in residents’ urine as an exposure index. Environ. Health. Prev. 2003, 8, 139–145. [Google Scholar] [CrossRef]
- Meeker, J.D.; Ryan, L.; Barr, D.B.; Hauser, R. Exposure to non-persistent insecticides and male reproductive hormones. Epidemiology 2006, 17, 61–68. [Google Scholar] [CrossRef]
- Li, Z.M.; Zhang, X.W.; He, Y.R.; Tang, S.J. Purple Soil in China (a); Science Press: Beijing, China, 1991. [Google Scholar]
- He, M.R. Purple Soils of China; Science Press: Beijing, China, 2003. [Google Scholar]
- Zhang, W.; Tang, X.Y.; Xian, Q.S.; Weisbrod, N.; Yang, J.E.; Wang, H.L. A field study of colloid transport in surface and subsurface flows. J. Hydrol. 2016, 542, 101–114. [Google Scholar] [CrossRef]
- He, Y.; Liu, C.; Tang, X.Y.; Xian, Q.S.; Zhang, J.Q.; Guan, Z. Biochar impacts on sorption-desorption of oxytetracycline and florfenicol in an alkaline farmland soil as affected by field ageing. Sci. Total. Enviro. 2019, 671, 928–936. [Google Scholar] [CrossRef]
- Manna, S.; Singh, N. Biochars mediated degradation, leaching and bioavailability of pyrazosulfuron-ethyl in a sandy loam soil. Geoderma 2019, 334, 63–71. [Google Scholar] [CrossRef]
- Liu, X.; Zhou, J.; Chi, Z.; Zheng, J.; Li, L.; Zhang, X. Biochar provided limited benefits for rice yield and greenhouse gas mitigation six years following an amendment in a fertile rice paddy. Catena 2019, 179, 20–28. [Google Scholar] [CrossRef]
- Joseph, S.D.; Camps-Arbestain, M.; Lin, Y.; Munroe, P.; Chia, C.H.; Hook, J.; Lehmann, J. An investigation into the reactions of biochar in soil. Soil. Res. 2010, 48, 501–515. [Google Scholar] [CrossRef]
- Trigo, C.; Spokas, K.A.; Cox, L.; Koskinen, W.C. Influence of soil biochar aging on sorption of the herbicides MCPA, nicosulfuron, terbuthylazine, indaziflam, and fluoroethyldiaminotriazine. J. Agric. Food. Chem. 2014, 62, 10855–10860. [Google Scholar] [CrossRef] [Green Version]
- Chen, D.; Liu, X.; Bian, R.; Cheng, K.; Zhang, X.; Zheng, J.; Joseph, S.; Crowley, D.; Pan, G.; Li, L. Effects of biochar on availability and plant uptake of heavy metals—A meta-analysis. J. Environ. Manag. 2018, 222, 76–85. [Google Scholar] [CrossRef]
- Sashidhar, P.; Kochar, M.; Singh, B.; Gupta, M.; Cahill, D.; Adholeya, A.; Dubey, M. Biochar for delivery of agri-inputs: Current status and future perspectives. Sci. Total Environ. 2020, 703, 134892. [Google Scholar] [CrossRef]
- Xu, P.; Sun, C.X.; Ye, X.Z.; Xiao, W.D.; Zhang, Q.; Wang, Q. The effect of biochar and crop straws on heavy metal bioavailability and plant accumulation in a Cd and Pb polluted soil. Ecotox. Environ. Saf. 2016, 132, 94–100. [Google Scholar] [CrossRef]
- Blanco-Canqui, H. Biochar and soil physical properties. Soil. Sci. Soc. Am. J. 2017, 81, 687–711. [Google Scholar] [CrossRef] [Green Version]
- Liu, Y.X.; Lonappan, L.S.; Brar, S.K.; Yang, S.M. Impact of biochar amendment in agricultural soils on the sorption, desorption, and degradation of pesticides: A review. Sci. Total Environ. 2018, 645, 60–70. [Google Scholar] [CrossRef]
- Xu, G.; Lv, Y.; Sun, J.; Shao, H.; Wei, L. Recent advances in biochar applications in agricultural soils: Benefits and environmental implications. Clean. Soil. Air Water 2012, 40, 1093–1098. [Google Scholar] [CrossRef] [Green Version]
- Li, J.; Li, Y.; Wu, M.; Zhang, Z.; Lü, J. Effectiveness of low-temperature biochar in controlling the release and leaching of herbicides in soil. Plant. Soil. 2013, 370, 333–344. [Google Scholar] [CrossRef]
- Mendes, K.; Hall, K.; Spokas, K.; Koskinen, W.; Tornisielo, V. Evaluating agricultural management effects on alachlor availability: Tillage, green manure, and biochar. Agronomy 2017, 7, 64. [Google Scholar] [CrossRef] [Green Version]
- Wu, P.; Ata-Ul-Karim, S.T.; Singh, B.P.; Wang, H.L.; Wu, T.L.; Liu, C.; Fang, G.D.; Zhou, D.M.; Wang, Y.J.; Chen, W.F. A scient metric review of biochar research in the past 20 years (1998–2018). Biochar 2019, 1, 23–43. [Google Scholar] [CrossRef] [Green Version]
- Guo, M.X.; Song, W.P.; Tian, J. Biochar-facilitated soil remediation: Mechanisms and efficacy variations. Front. Environ. Sci. 2020, 8, 521512. [Google Scholar] [CrossRef]
- Hagner, M.; Penttinen, O.P.; Tiilikkala, K.; Setälä, H.M. The effects of biochar, wood vinegar and plants on glyphosate leaching and degradation. Eur. J. Soil. Biol. 2013, 58, 1–7. [Google Scholar] [CrossRef]
- Delwiche, K.B.; Lehmann, J.; Walter, M.T. Atrazine leaching from biochar amended soils. Chemosphere 2014, 95, 346–352. [Google Scholar] [CrossRef] [Green Version]
- Yue, L.; Ge, C.; Feng, D.; Yu, H.; Deng, H.; Fu, B. Adsorption-desorption behavior of atrazine on agricultural soils in China. J. Environ. Sci. 2017, 57, 180–189. [Google Scholar] [CrossRef]
- Khorram, M.S.; Zheng, Y.; Lin, D.; Zhang, Q.; Fang, H.; Yu, Y. Dissipation of fomesafen in biochar-amended soil and its availability to corn (Zea mays L.) and earthworm (Eisenia fetida). J. Soils. Sediments. 2016, 16, 2439–2448. [Google Scholar] [CrossRef]
- OECD. 106: Adsorption–desorption using a batch equilibrium method. In OECD Guideline for the Testing of Chemicals; OCED: Paris, France, 2000. [Google Scholar]
- Jin, J.W.; Li, Y.A.; Zhang, J.Y.; Wu, S.C.; Cao, Y.C.; Liang, P.; Zhang, J.; Wong, M.H.; Wang, M.Y.; Shan, S.D.; et al. Influence of pyrolysis temperature on properties and environmental safety of heavy metals in biochars derived from municipal sewage sludge. J. Hazard. Mater. 2016, 320, 417–426. [Google Scholar] [CrossRef]
- Khorram, M.S.; Lin, D.; Zhang, Q.; Zheng, Y.; Fang, H.; Yu, Y. Effects of aging process on adsorption–desorption and bioavailability of fomesafen in an agricultural soil amended with rice hull biochar. J. Environ. Sci. 2017, 56, 180–191. [Google Scholar] [CrossRef] [PubMed]
- Ding, T.D.; Huang, T.; Wu, Z.; Li, W.; Guo, K.X.; Li, J.Y. Adsorption–desorption behavior of carbendazim by sewage sludge-derived biochar and its possible mechanism. RSC. Adv. 2019, 9, 35209–35216. [Google Scholar] [CrossRef] [PubMed] [Green Version]
- Wang, H.L.; Lin, K.D.; Hou, Z.N.; Richardson, B.; Gan, J. Sorption of the herbicide terbuthylazine in two New Zealand Forest soils amended with biosolids and biochars. J. Soils Sediments 2010, 10, 283–289. [Google Scholar] [CrossRef]
- Martin, S.M.; KooKana, R.S.; Zwieten, L.V.; Krull, E. Marked changes in herbicide sorption-desorption upon ageing of biochars in soil. J. Hazard. Mater. 2012, 231, 70–78. [Google Scholar] [CrossRef]
- Cabrera, A.; Cox, L.; Spokas, K.; Hermosin, M.C.; Cornejo, J.; Koskinen, W.C. Influence of biochar amendments on the sorption–desorption of aminocyclopyrachlor, bentazone and pyraclostrobin pesticides to an agricultural soil. Sci. Total Environ. 2014, 470, 438–443. [Google Scholar] [CrossRef] [Green Version]
- Sopeña, F.; Semple, K.; Sohi, S.; Bending, G. Assessing the chemical and biological accessibility of the herbicide isoproturon in soil amended with biochar. Chemosphere 2012, 88, 77–83. [Google Scholar] [CrossRef]
- Tatarková, V.; Hiller, E.; Vaculík, M. Impact of wheat straw biochar addition to soil on the sorption, leaching, dissipation of the herbicide (4-chloro-2-methylphenoxy) acetic acid and the growth of sunflower (Helianthus annuus L.). Ecotoxicol. Environ. Saf. 2013, 92, 215–221. [Google Scholar] [CrossRef]
- Agrafioti, E.; Kalderis, D.; Diamadopoulos, E. Ca and Fe modified biochars as adsorbents of arsenic and chromium in aqueous solutions. J. Environ. Manag. 2014, 146, 444–450. [Google Scholar] [CrossRef]
- Khorram, M.S.; Wang, Y.; Jin, X.; Fang, H.; Yu, Y. Reduced mobility of fomesafen through enhanced adsorption in biochar-amended soil. Environ. Toxicol. Chem. 2015, 34, 1258–1266. [Google Scholar] [CrossRef]
- Acosta, R.; Fierro, V.; Martínez, D.; Narbalatz, D.; Celzard, A. Tetracycline adsorption onto activated carbons produced by KOH activation of tyre pyrolysis char. Chemosphere 2016, 149, 168–176. [Google Scholar] [CrossRef]
- Yu, X.Y.; Ying, G.G.; Kookana, R.S. Sorption and desorption behaviors of diuron in soils amended with charcoal. J. Agric. Food. Chem. 2006, 54, 8545–8550. [Google Scholar] [CrossRef] [PubMed]
- Yu, H.M. Sorption/Desorption Characteristics and Mechanisms of Biochars with Atrazine in Environment. Ph.D. Thesis, China University of Mining and Technology, Beijing, China, 2014. [Google Scholar]
- Deng, H.; Feng, D.; He, J.X.; Li, F.Z.; Yu, H.M.; Ge, C.J. Influence of biochar amendments to soil on the mobility of atrazine using sorption-desorption and soil thin-layer chromatography. Ecol. Eng. 2017, 99, 381–390. [Google Scholar] [CrossRef]
- Yu, X.Y.; Pan, L.G.; Ying, G.G.; Kookana, R.S. Enhanced and irreversible sorption of pesticide pyrimethanil by soil amended with biochars. J. Environ. Sci. 2010, 22, 615–620. [Google Scholar] [CrossRef]
- Jaynes, E.T. Information theory and statistical mechanics. Phys. Rev. 1957, 106, 620–630. [Google Scholar] [CrossRef]
- Conrad, K. Probability distributions and maximum entropy. Entropy 2004, 6, 10. [Google Scholar]
- Zhou, X.; Lei, W.; Ma, J. Entropy base estimation of moisture content of the Top 10-m unsaturated soil for the Badain Jaran desert in northwestern China. Entropy 2016, 18, 323. [Google Scholar] [CrossRef] [Green Version]
- Montoya, J.C.; Costa, J.L.; Liedl, R.; Bedmar, F.; Daniel, P. Effects of soil type and tillage practice on atrazine transport through intact soil cores. Geoderma 2006, 137, 161–173. [Google Scholar] [CrossRef]
- Fernández-Bayo, J.D.; Nogales, R.; Romero, E. Winery vermicompost to control the leaching of diuron, imidacloprid and their metabolites: Role of dissolved organic carbon content. J. Environ. Sci. Health B 2015, 50, 190–200. [Google Scholar] [CrossRef]
- Zand, A.D.; Grathwohl, P. Enhanced immobilization of polycyclic aromatic hydrocarbons in contaminated soil using forest wood-derived biochar and activated carbon under saturated conditions, and the importance of biochar particle size. Pol. J. Environ. Stud. 2016, 25, 427–441. [Google Scholar] [CrossRef]
- McLaughlin, M.P. A Compendium of Common Probability Distributions, 2nd ed. 2016. Available online: https://www.causascientia.org/math_stat/Dists/Compendium.pdf (accessed on 2 February 2022).
- Yang, Y.N.; Sheng, G.Y.; Huang, M.S. Bioavailability of diuron in soil containing wheat-straw-derived char. Sci. Total Environ. 2006, 354, 170–178. [Google Scholar] [CrossRef]
- Tang, J.; Zhu, W.; Kookana, R.; Katayama, A. Characteristics of biochar and its application in remediation of contaminated soil. J. Biosci. Bioeng. 2013, 116, 653–659. [Google Scholar] [CrossRef] [PubMed]
- Dubinin, M.M. The potential theory of adsorption of gases and vapors for adsorbents with energetically nonuniform surfaces. Chem. Rev. 1960, 60, 235–241. [Google Scholar] [CrossRef]


| Ratio of Biochar Sddition | Parameters of the Model | Square of Correlation Coefficient (R2) | Mean Squared Error (MSE) | ||
|---|---|---|---|---|---|
| α | β | γ | |||
| 0 | 1.82 | 0.57 | 1.24 | 0.9942 | 0.0379 |
| 1% | 0.55 | 3.85 | 1.39 | 0.9774 | 0.0534 |
| 2% | 0.78 | 3.41 | 1.52 | 0.9972 | 0.0175 |
| 3% | 0.92 | 3.06 | 1.55 | 0.9954 | 0.0213 |
| 5% | 0.68 | 7.59 | 1.72 | 0.9989 | 0.0081 |
| 7.5% | 0.86 | 7.87 | 1.67 | 0.9996 | 0.0040 |
| 10% | 0.86 | 10.36 | 1.93 | 0.9991 | 0.0048 |
| 15% | 0.97 | 10.76 | 3.12 | 0.9995 | 0.0029 |
| 20% | 1.00 | 25.14 | 4.22 | 0.9965 | 0.0025 |
| Biochar | Removal Rate | |||||
|---|---|---|---|---|---|---|
| RR = 90% | RR = 75% | RR = 50% | RR = 25% | RR = 10% | RR = 1% | |
| 0% | 1.49 | 1.71 | 2.09 | 2.64 | 3.29 | 3.76 |
| 1% | 1.44 | 1.66 | 2.45 | 4.26 | 7.04 | 9.29 |
| 2% | 1.68 | 2.08 | 3.15 | 5.17 | 8.00 | 10.20 |
| 3% | 1.81 | 2.30 | 3.45 | 5.47 | 8.19 | 10.27 |
| 5% | 1.94 | 2.64 | 4.68 | 8.81 | 14.78 | 19.50 |
| 7.5% | 2.19 | 3.31 | 6.04 | 11.01 | 17.80 | 23.02 |
| 10% | 2.63 | 4.12 | 7.75 | 14.32 | 23.29 | 30.17 |
| 15% | 4.16 | 6.03 | 10.28 | 17.61 | 27.36 | 34.75 |
| 20% | 7.04 | 11.79 | 22.20 | 39.86 | 63.10 | 80.64 |
Publisher’s Note: MDPI stays neutral with regard to jurisdictional claims in published maps and institutional affiliations. |
© 2022 by the authors. Licensee MDPI, Basel, Switzerland. This article is an open access article distributed under the terms and conditions of the Creative Commons Attribution (CC BY) license (https://creativecommons.org/licenses/by/4.0/).
Share and Cite
Sun, S.; Ren, D.; Lei, W.; Zhou, X. Experiment and Model Study on the Destination of 3,5,6-Trichloro-2-pyridinol in the Purple Soil of Southwestern China with a High Ratio of Biochar Applied. Sustainability 2022, 14, 8712. https://0-doi-org.brum.beds.ac.uk/10.3390/su14148712
Sun S, Ren D, Lei W, Zhou X. Experiment and Model Study on the Destination of 3,5,6-Trichloro-2-pyridinol in the Purple Soil of Southwestern China with a High Ratio of Biochar Applied. Sustainability. 2022; 14(14):8712. https://0-doi-org.brum.beds.ac.uk/10.3390/su14148712
Chicago/Turabian StyleSun, Shanggui, Dongxing Ren, Wenjuan Lei, and Xiangyang Zhou. 2022. "Experiment and Model Study on the Destination of 3,5,6-Trichloro-2-pyridinol in the Purple Soil of Southwestern China with a High Ratio of Biochar Applied" Sustainability 14, no. 14: 8712. https://0-doi-org.brum.beds.ac.uk/10.3390/su14148712