
Diversity in the Rice–Wheat System with Genetically Modified Zinc and Iron-Enriched Varieties to Achieve Nutritional Security


Department of Agronomy, Institute of Agricultural Sciences, Banaras Hindu University, Varanasi 221005, India
*
Author to whom correspondence should be addressed.
Sustainability 2022, 14(15), 9334; https://0-doi-org.brum.beds.ac.uk/10.3390/su14159334
Submission received: 30 May 2022
/
Revised: 16 July 2022
/
Accepted: 26 July 2022
/
Published: 29 July 2022
(This article belongs to the Special Issue Crop Diversification for Soil, Nutritional, Economic and Environmental Security)
Abstract
:The rice (Oryza sativa L.)–wheat (Triticum aestivum L.) cropping system (RWCS) feeds more than 6 billion people in South Asia and across the world. In developing countries, almost 2 billion individuals are suffering from Zn and Fe micronutrient deficiency. This study aimed to adopt genetically enriched varieties of rice and wheat to manage the Zn and Fe deficiency with organic and inorganic fertilization in the food system. The experiment was designed for two years (2018–2019) under the split-plot design and was replicated three times. The results of the study indicate that the highest grain yield of wheat and rice was increased by 67.09 and 58.41 and 44.10 and 33.21% more NPKFeZn in the applied treatments compared to the control treatment during both years, respectively. The treatment carpet waste and Trichoderma viride was performed for higher yields (grain, straw, and biological) as compared to the rest of the treatment. In the main-plot, with application of NPKFeZn, higher Fe and Zn ranges of 54.27 and 52.91 and 35.71 and 34.29 parts per million (ppm), respectively, were recorded during both years. Similarly, the residual effects of NPKFeZn treatment in rice Fe and Zn concentration were recorded at 44.17 and 41.22 and 27.55 and 24.19 ppm during both years, respectively. It was found that there was 49.18 and 42.12 and 25.28 and 19.94% more Fe and Zn content, respectively, in grain as compared to the traditional varieties range of 33 and 14 ppm for Fe and Zn, respectively. Ina sub-plot, for the wheat in carpet waste and Trichoderma viride treatment, the Fe and Zn contents were recorded as 55.21 and 54.62 and 37.05 and 35.53 ppm for the two years, respectively. In the traditional varieties of wheat, the range of Fe and Zn contents was 30 and 32 ppm, respectively. In the sub-plot of succeeding rice in carpet waste and Trichoderma viride treatment contents of Fe and Zn of 43.27 and 40.43 and 26.67 and 23.37 ppm were recorded during both years, respectively. On the basis of the interaction effect, the maximum total Fe and Zn uptake by wheat of 0.84 and 0.50 kg ha−1, respectively, were recorded in the N3 × B1C3 treatments. Likewise, the maximum total Fe and Zn uptakes by rice of 0.62 and 0.39 kg ha−1, respectively, were recorded with the interaction effect of N3 × B1C3 treatments. The hypothesis of the experiment was to manage malnutrition in society by diversifying genetically modified rice–wheat varieties in the RWCS. This research might assist in increasing nutritional security.
1. Introduction
Asia is the hub for rice (Oryza sativa L.)–wheat (Triticum aestivum L.) cropping systems (RWCS) and feeds ~80% people across the globe. The RWCS feeds over 6 billion people in Asia and other parts of the world [1,2,3]. The people of South Asia intake 60–75% of their daily energy and half of the protein in their diet by consuming of rice [1,3]. The RWCS is one of the most widely followed sequences in the South Asian region, with more than twenty cropping sequences being practiced [4]. RWCS covers approximately 24 million hectares (mha) of cultivated land in Asia [5,6]. Out of which, 15.8 mha of land occupied in South Asia mostly encompasses the four countries, i.e., India, Bangladesh, Nepal, and Pakistan [1,7,8,9].These four South Asian countries are delineated as the “food bowl” of Asia, covering about 33% of the rice area and 40% of the wheat area, with a production of one-fourth and one-third of the entire rice and wheat grown, respectively [10,11,12].The practices of RWCS address several issues such as declining soil health; degrading ecological sustainability; nutritional insecurity; high demand for energy input; deficiency of micronutrients such as Zn, Fe, Boron (B), and sulphur (S); decreased total factor productivity, etc. [3,9,13,14].The RWCS attends to the targeted demand for food security in the South Asia region, but the nutritional security in this RWCS is under threat, mainly due to deficiency of micronutrients such as Fe and Zn in the diet [15,16,17,18].
The RWCS of South Asia arises from a deficiency of micronutrients, particularly Fe and Zn, and might be due to continuous choice of high yielding fertilizer responsive variety, inappropriate use of fertilizer, reduced application of organic matter, and less or no use of micronutrients, etc. [19,20,21,22]. Around 50% of malnourished people living in South Asia suffer from a deficit of micronutrients in their diet [23,24]. The deficiency of Fe in the diet causes anaemia in pregnant women, leading to low birth weight in new born babies or premature delivery; children below the age of 5 years are also affected, and mortality can occur in cases in children [15,25,26]. In South Asia, one in every two women suffered from anaemia during the year 2016 [27]. After the Green Revolution era, India fulfilled food demand but lagged behind in terms of nutritional security. In India, around 194.6 million people are suffering from malnutrition problems, in which 38% of children under 5 years of age are undersized and 36% are below the average weight. According to recent calculations, genetically enriched rice and wheat varieties with Zn and Fe, such as through breeding approaches, could save the lives of up to 48,000 children in India each year [25].
About 50% of the cultivated land in the RWCS in the South Asian region is Zn deficient [7,28]. India spends more than USD 12 billion of its GDP annually to alleviate the nutritional deficiency problem [29]. The pharmaceutical industry in India spends more than USD 6.57 million on manufacturing Fe and Zn capsules [30].
The Zn and Fe deficiency is present in approximately 40 and 13%, respectively, of Indian soil [31]. Furthermore, almost the entire RWCS of India suffers from Zn and Fe deficiency [32]. The most viable and cost-effective option for addressing the problem is to breed new cereal genotypes with high Zn and Fe concentrations in grain. The diversification of genetically modified wheat and rice varieties in RWCS helps alleviate malnutrition and hidden hunger issues in human nutrition, as well as livestock in a sustainable way. Wheat straw and rice straw are the most commonly used feed materials for livestock in India. This accounts for about 10 to 65% of total feedstock in different states [33]. Livestock health is directly correlated with human health [33].
The process of making compost from industrial waste and applying it to agricultural fields is a cost-effective solution. It is a relatively cheap and environmentally sound solution because it minimizes greenhouse gases (GHGs) emissions while solving the waste management problem and meeting crop nutrient requirements [34,35]. Industrial waste contains a higher concentration of essential nutrient elements, such as NPKFeZn and so on [36]. The primary reason for using industrial waste compost was that it contains more macronutrients (NPK) and micronutrients (FeZn) than farmyard manure (FYM) [37,38]. Furthermore, using industrial compost in agricultural fields improves soil health, improves physio-chemical properties in the soil, boosts microbial activity, and increases the soil carbon pool, all of which promote crop yield [39,40]. The use of biofertilizer in conjunction with compost aids in the decomposition, mineralization, and translocation of nutrients in the soil system [41,42].
Earlier studies placed more emphasis on the use of traditional varieties for rice–wheat cultivation [43] and the application of FYM along with chemical fertilizer in RWCS [44]. In consideration of these, we propose the following research hypotheses of the experiment: (i) diversification in the RWCS with genetically modified Fe- and Zn-enriched varieties and (ii) the application of industrial waste compost in RWCS due to more macro- (NPK) and micro- (FeZn) nutrient content as compared to FYM. Bio-fortified Fe- and Zn-enriched varieties have a greater potential for accumulation and uptake of Fe and Zn in grain than traditional varieties, and microbe inoculation aids in waste decomposition, making wastes more available nutrients to the crops [45].
The application of Fe and Zn containing fertilizers in combination with genetically modified varieties is a quick and effective way to address the malnutrition problem in human and livestock. A successful nutrition programme is believed to be one of the most cost-effective steps [18]. The integrated use of micronutrients from inorganic and organic sources, as well as the inclusion of genetically biofortified Fe- and Zn-enriched varieties, can help to alleviate malnutrition and achieve goal three of the United Nations’ 17 Sustainable Development Goals (SDGs), which is good health and well-being.
2. Materials and Methods
2.1. Experimental Setup
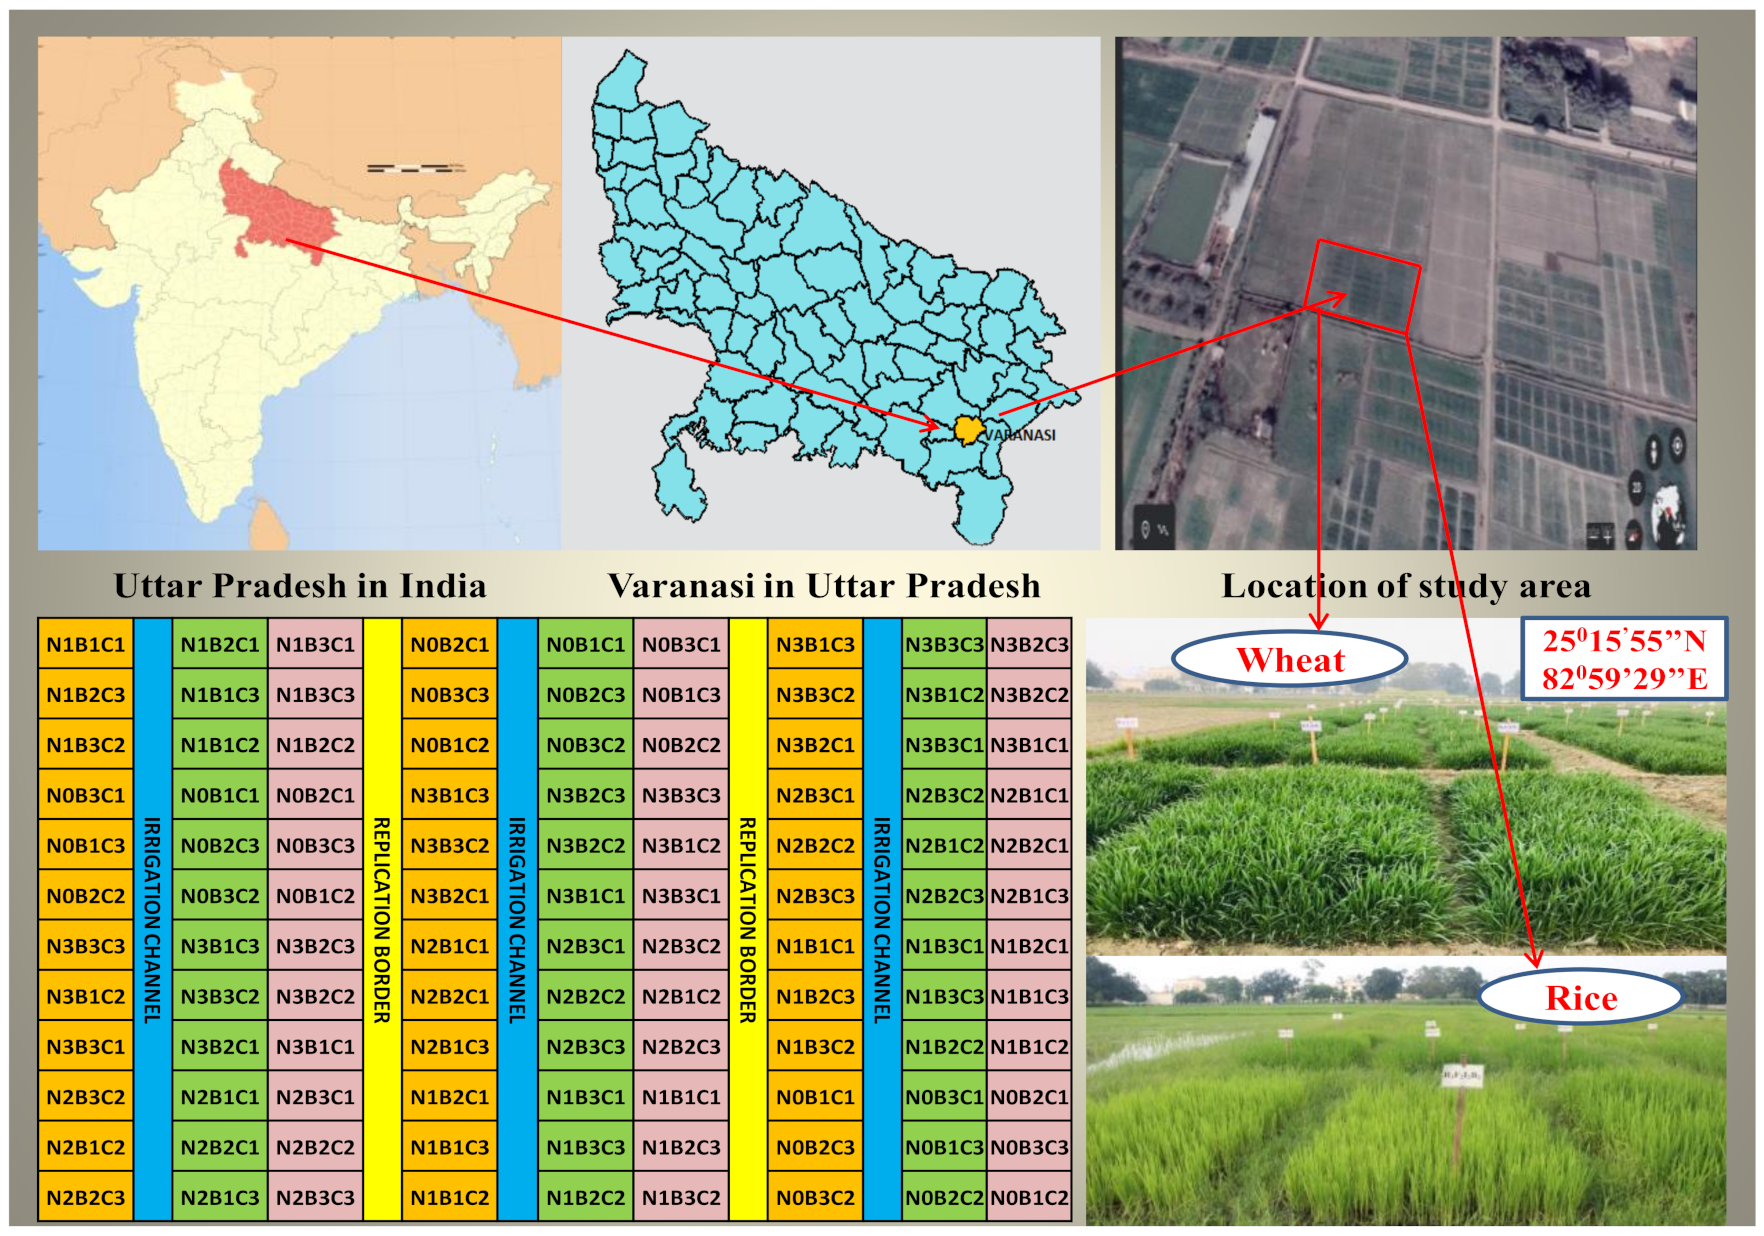
A field experiment was carried out on the wheat–rice production system at the agriculture research farm, Institute of Agricultural Sciences, Banaras Hindu University (BHU), Varanasi, Uttar Pradesh (UP), India (Figure 1), for two consecutive years (2018 and 2019). The geographical location of the experimental field is 25°15′55′′ N, 82°59′29′′ E, and 83 m (m) altitude. The soil textural class of the experimental field was sandy loam in nature and grouped as mixed hyperthermic Typic Haplustepts [46]. The soil samples were collected from a depth of 0 to 15 cm before the start of the experiment. The soil test values were: 4.7 g (g) kg−1 of soil organic carbon (SOC) content according to analyses by the rapid titration method [47]; available N of 154.65 kg per hectare (ha−1) using the alkaline permanganate method [48]; available P of 22.19 kg ha−1using the0.5 molar (M) sodium bicarbonate extractable method [49]; available K of 104.10 kg ha−1usingthe ammonium extractable method [50]; and 15.06 milligram (mg) kg−1of available Fe and 0.57 mg kg−1of available Zn. The pH of the soil was 7.43(1:2, soil: water suspension), the electrical conductivity (EC) was 0.45 desisiemen per meter (d Sm−1) at 25 °C, the bulk density(pb) was 1.46 Megagrams per cubic meter (Mg m−3), and the particle density (pd) was 2.59 Mg m−3 [51]. The atomic absorption spectrophotometer (AAS) of model Agilent 200 series was used to analyse the micronutrients Fe and Zn.
2.2. Experimental Design and Treatment Details
The experiment was designed using the split-plot design (SPD), and it was repeated three times. Four levels of nutrient sources were used in the main plots, viz., (i) N0= control, (ii) N1= 112.5 kg N + 45 kg P + 45 kg K, (iii) N2= 150 kg N + 60 kg P + 60 kg K, and (iv) N3= 150 kg N + 60 kg P + 60 kg K+ 26.31 kg FeO4.7H2O +15.15 kg ZnO4.H2O.In sub-plots, compost combinations were applied at the rate of (@) 4 tonnes (t) ha−1as (i) B1C1 =Carpet waste and Pleurotus sajor-caju, (ii) B1C2 = Carpet waste and Azotobacter chroococcum, (iii) B1C3 = Carpet waste and Trichoderma viride,(iv) B2C1 = Pressmud and Pleurotus sajor-caju, (v) B2C2 = Pressmud and Azotobacter chroococcum, (vi) B2C3 = Pressmud and Trichoderma viride, (vii) B3C1 = Bagasse and Pleurotus sajor-caju, (viii)B3C2 = Bagasse and Azotobacter chroococcum, and(ix) B3C3 = Bagasse and Trichoderma viride. Hereby, product of industry (B)(B1 =Carpet wastes, B2 =Pressmud and B3 =Bagasse) and cellulose decomposer (C) (such as, C1 =Pleurotussajor-caju,C1=Azotobacter chroococcum and C3 =Trichoderma viride). Here, in this study, carpet waste was obtained from a by-product of cotton wool. The nutrient concentration in pressmud and bagasse was analysed for N (2.57 and 1.25%), P (1.78 and 0.25%), K (0.74 and 1.15%), Fe (0.11 and 0.089%), and Zn (0.01 and 0.008%) content, respectively. Similarly, in carpet waste compost, the nutrient concentrations of NPKFeZn were 6.89, 0.68, 0.54, 0.13, and 0.015%, respectively.
2.3. Crop Management
2.3.1. Wheat
The wheat variety “WB 02” was taken for the trial released from the Indian Institute of Wheat and Barley Research (IIWBR). As compared to traditional varieties with 32.0 ppm Zn and 28.0–32.0 ppm Fe [52], this variety has 42.0 ppm Zn and 40.0 ppm Fe. Seed was sown @ 100 kg ha−1 on 20 November at 22.5 cm (row to row) × 10 cm (plant to plant) spacing during both years. The general recommended dose of fertilizer (RDF) was 150-60-60-5-5 NPKFeZn kg ha−1 applied during both years of study. The full dose of P and K and 50% of N were applied as the basal dose before sowing of wheat. The remaining N was applied in two splits, one at 21 days after sowing (DAS) and another at 45 DAS. The by-product of industry compost was applied as 4 t ha−1 before the sowing of the crop and mixed thoroughly into the soil. The Fe and Zn were applied through iron sulphate heptahydrate and zinc sulphate monohydrate, respectively, before the sowing of the crop. The herbicide pendimethalin @ 1kg active ingredient (a.i.) ha−1 was sprayed manually after 24 h of sowing to keep it weed-free. There were four types of irrigation applied throughout the crop growing periods. The first irrigation was applied at the crown root initiation (CRI) stage during two years of study. The subsequent irrigations were applied based on the soil moisture depletion. In both years, wheat was harvested when 90% of the grain ripened in the last week of March to the first week of April. For yield estimation, net plot sizes of 6 × 5 m were harvested manually and dried over the threshing floor for about 5 to 6 days. After that, the dried plants were threshed mechanically to detach grains from straw.
2.3.2. Rice
The rice variety “Dhan-45” was resealed from Directorate Rice Research (DRR) sown in line @ 40 kg ha−1 in between rows of previously grown wheat crop. Seed was sown on 27June during both years. This variety contains a high amount of Zn (22.6 ppm) in the polished grains in comparison to 12–16 ppm [53] in the traditional variety. The crop was sown during the last week of June in both years of experiment. The rice was grown during the rainy season, so irrigation requirements were reduced; however, for germination, one irrigation was applied after 4 DAS. N fertilizer@ 75 kg ha−1was applied to the rice crop in two equal splits: first at 20 DAS and second at 50 DAS. For weed control, herbicide bispyribac sodium (Na) @ 25 g a.i. ha−1 was sprayed at 20 DAS. One manual hand weeding operation was performed at 30 DAS during both years to keep the plot weed free.
2.4. Observations and Sampling of Data
2.4.1. Grain, Straw, and Biological Yields
Before the harvesting of both crops, the productive tillers in each treatment were collected from 1 m2 area and taken for drying to lessen the moisture content. The dried plant samples collected from 1 m2 area were threshed to separate the grains from straw. The threshed grain and straw were weighted using a weighing balance and converted to Mg ha−1 grain and straw yield. The biological yield was calculated by summing the grain and straw yield.
2.4.2. Soil Fe and Zn Analysis
The available Fe and Zn content in soil was determined by the Diethylene triaminepentaacetate (DTPA) extraction method [54]. In a 250 mL conical flask, 10 g of air-dried processed soil sample was placed, and 20 mL of 0.005 M DTPA solution was added. After that, the flask was placed on a horizontal shaker (S M Scientific Instruments PVT. LTD. New Delhi, India), which was shaken for two hours. Then, the suspension was filtered through Whatman No. 42 filter paper and the filtrate was kept in polypropylene bottles. Afterward, the filtrate was taken for analysis of Fe and Zn in soil through AAS [54].
2.4.3. Grain and Straw Fe and Zn Analysis
The healthy, fine, and air-dried samples of grain and straw were taken for grinding. For Zn analysis, the samples were ground the grinding mill (Wiley mill, standard model No.3), while, for Fe analysis, they were crushed with the help of a mortar and pestle. Then, 0.5 g of ground sample was placed in the digestion tube. After that, 10 mL of di-acid mixture (Nitric acid (HNO3): Perchloric acid (HClO4) at 9:4 v/v) was added to it and kept overnight for predigesting. Then, the samples were digested in the well set-up digestion chamber (Kjeldahl dry block digester) at 160 °C until the samples became colourless. Then, the digested samples were diluted with 5–10 mL of double distilled water and filtered through Whatman No. 42 filter paper. Afterward, the digested samples were taken for analysis of Fe and Zn content through AAS [54].
2.5. Total Iron and Znic Uptake by Crop
The total Fe and Zn uptake by wheat and rice are presented in Equations (1) and (2):
Total Fe uptake (kg ha−1) = Fe in grain (ppm) × grain yield (kg ha−1) + Fe in straw (ppm) × straw yield (kg ha−1)
Total Zn uptake (kg ha−1) = Zn in grain (ppm) × grain yield (kg ha−1) + Zn in straw (ppm) × straw yield (kg ha−1)
2.6. Preparation of Used Biofertilizers
The microbial cultures (fungus) were carried out in potato dextrose agar (PDA) medium The composition of the PDA medium was fresh peel and healthy potato 200 g, dextrose 20 g, and agar powder 20 g. The microbial inoculant was transferred into the Petridis containing PDA medium under laminar air flow. The transfer of microbial inoculant was performed with the help of a culture needle [55].
2.7. Correlation and Regression
The degree to which two factors are linearly related is expressed by correlation, a statistical measure. It is a typical way to describe simple relationships without expressing a cause-and-effect relationship. The degree of the association is measured by the simple correlation coefficient, denoted by ‘r’. The value of r between 0.75 to 1 is denoted as a high degree of correlation; 0.25 to 0.75 is a moderate degree of correlation; and 0 to 0.25 is a low degree of correlation. The change in the dependent variable is highly linked with the changes in the independent variables. It is expressed in the form of a regression equation.
2.8. Statistical Analysis
All the data were analysed by using Excel 2007 from Microsoft Office. The data were subjected to analysis of variance (ANOVA) to determine the significance of the difference between treatments using the “F” test. F test was used to determine the significance difference among of the various treatments at a p = 0.05 level of significance [56].
3. Results
3.1. Wheat and Rice Yields
The application of Fe and Zn nutrition increased the yields (grain, straw, and biological) of wheat and rice significantly during both years (Table 1). In the N3 treatment, the highest grain yield of wheat and rice was observed at 5.18, 4.80, and 4.28, 3.89 Mg ha−1both years. It was 2.08 and 1.77 and 1.31 and 0.97 Mg ha−1more over the control plot in both the years, respectively. In the N2 treatment, the second highest grain yield of wheat and rice was found at 4.87 and 4.54, and 3.87 and 3.58 Mg ha−1, followed by the N1 treatment at 4.41 and 4.15, and 3.65 and 3.42 Mg ha−1 in both years, respectively. However, the N0 treatment was noted to have the lowest grain yield of wheat and rice at 3.10 and 3.03 and 2.97 and 2.92 Mg ha−1 in both the years of study, respectively. The highest straw yield of wheat, 6.62 and 5.55 Mg ha−1, was observed in the N3 treatment. The yield was 42.67 and 43.41% higher as compared to the control plot in both the years, respectively. During both years, the control plot had the lowest straw and biological wheat yields. The similar trend was seen in case of straw and biological yield of rice in two years of research work.
The application of compost combinations significantly affected the grain, straw, and biological yields of wheat and rice during the two consecutive years (Table 1). The treatment B1C3 had the maximum grain (5.06 and 4.70 Mg ha−1), straw (6.56 and 5.45 Mg ha−1), and biological (11.62 and 10.14 Mg ha−1) yields of wheat, followed by the treatment B1C2 in both years, respectively. The grain, straw, and biological yields of succeeding crop rice was followed a similar pattern as in the case of wheat. However, in wheat, the treatment B1C1 (4.66 and 4.36 Mg ha−1) was found on par with the treatment B2C3 (4.63 and 4.33 Mg ha−1) in terms of grain yield during both years of research. The same results were observed in straw and the biological yield of wheat. Moreover, the B3C3 treatment gave a higher grain yield of wheat (4.09 and 3.87 Mg ha−1) than the B3C2 (3.88 and 3.69 Mg ha−1) treatment in both years, respectively. The B3C1 treatment was noted to have the lowest grain yield (3.64 and 3.49 Mg ha−1), straw yield (5.13 and 4.31 Mg ha−1), and biological yield (8.78 and 7.80 Mg ha−1) of wheat during both years of study, respectively. In the case of residual crop rice, similar yields (grain, straw, and biological) were observed.
3.2. Interaction Effects of Nutrient Levels and Compost Combination on Grain Yield (Mg ha−1) of Wheat and Rice (Pooled Two Years)
On the basis of pooled data, interaction effects are presented in Table 2 and Table 3. The maximum 5.69 Mg ha−1 grain yield of wheat was recorded with the interaction effect of N3 × B1C3 treatments followed by the interaction effect of N3× B1C2. However, the minimum 2.69 Mg ha−1 grain yield of wheat was observed in the treatment of N0 × B3C1 based on two years of pooled analysis. However, the treatment N3 × B1C3 was found to be on par (p ≤ 0.05) with that of the N3 × B1C2 treatments in terms of the grain yield of wheat. The interaction effect of N3 × B1C3 treatments was found to have the highest grain yield of rice at 4.47 Mg ha−1, followed by N3 × B1C2. However, the treatments N0 × B3C1 was found to have the minimum grain yield of rice of 2.90 Mg ha−1based on two years of pooled analysis. Furthermore, the treatment N3 × B1C3 was found to be on par with that of the N3 × B1C2 treatments in terms of the grain yield of rice. Similarly, the treatment N0 × B3C1 was found to be on par with that of the N0 × B3C2 treatments in terms of the grain yield of rice.
3.3. Available Fe and Zn in Soil
The Fe fertilization of the soil was found to have a significant effect on the soil’s available Fe content. However, the effect of Zn application was observed to be non-significant during both years of study (Table 4). After the harvesting of wheat, treatment N3 recorded the highest available Fe in soil (14.62 and 13.18 ppm), followed by N2 (13.74 and 12.59 ppm) in both years of the soil test, respectively. Likewise, after the harvest of wheat, treatment N1 was shown to have 15.61 and 27.14% more available Fe content in soil over the control plot during both years, respectively. Treatment N3recorded significantly higher available Fe content in soil, at 15.11 and 13.95 ppm after the harvest of rice, while the lowest value was observed in the control plot at 10.62 and 10.22 ppm in both years, respectively. After the harvest of rice, treatment N3 was observed to have the highest available Fe content in the soil at15.11 and 13.95 ppm. There was 42.27 and 36.49% more available Fe content in the soil over the control plot in both years, respectively.
The effects of applying compost combinations were found to produce higher Fe content in the soil after the harvest of wheat and rice in both years, while the Zn content in the soil was found to have a non-significant effect in both years (Table 4). TreatmentB1C3 recorded the maximum available Fe content in the soil of 14.26 and 12.94 ppm after the harvest of wheat, followed by the treatment B1C2with 13.67 and 12.54 ppm, in both years, respectively. Furthermore, treatmentsB1C1 and B2C3were found to be statistically on par with each other during both years. Moreover, in two years of study, treatments B3C2 and B3C1 were observed to be statistically on par with each other in terms of the available Fe content in soil after the harvest of rice. The succeeding effect of treatment B1C3 was found to have the highest Fe (14.49 and 13.32 ppm) content in soil after the harvest of rice, and the treatment B3C1 observed the lowest Fe content at 12.86 and 12.36 ppm in both years.
3.4. Fe and Zn Content of Wheat Grain and Straw
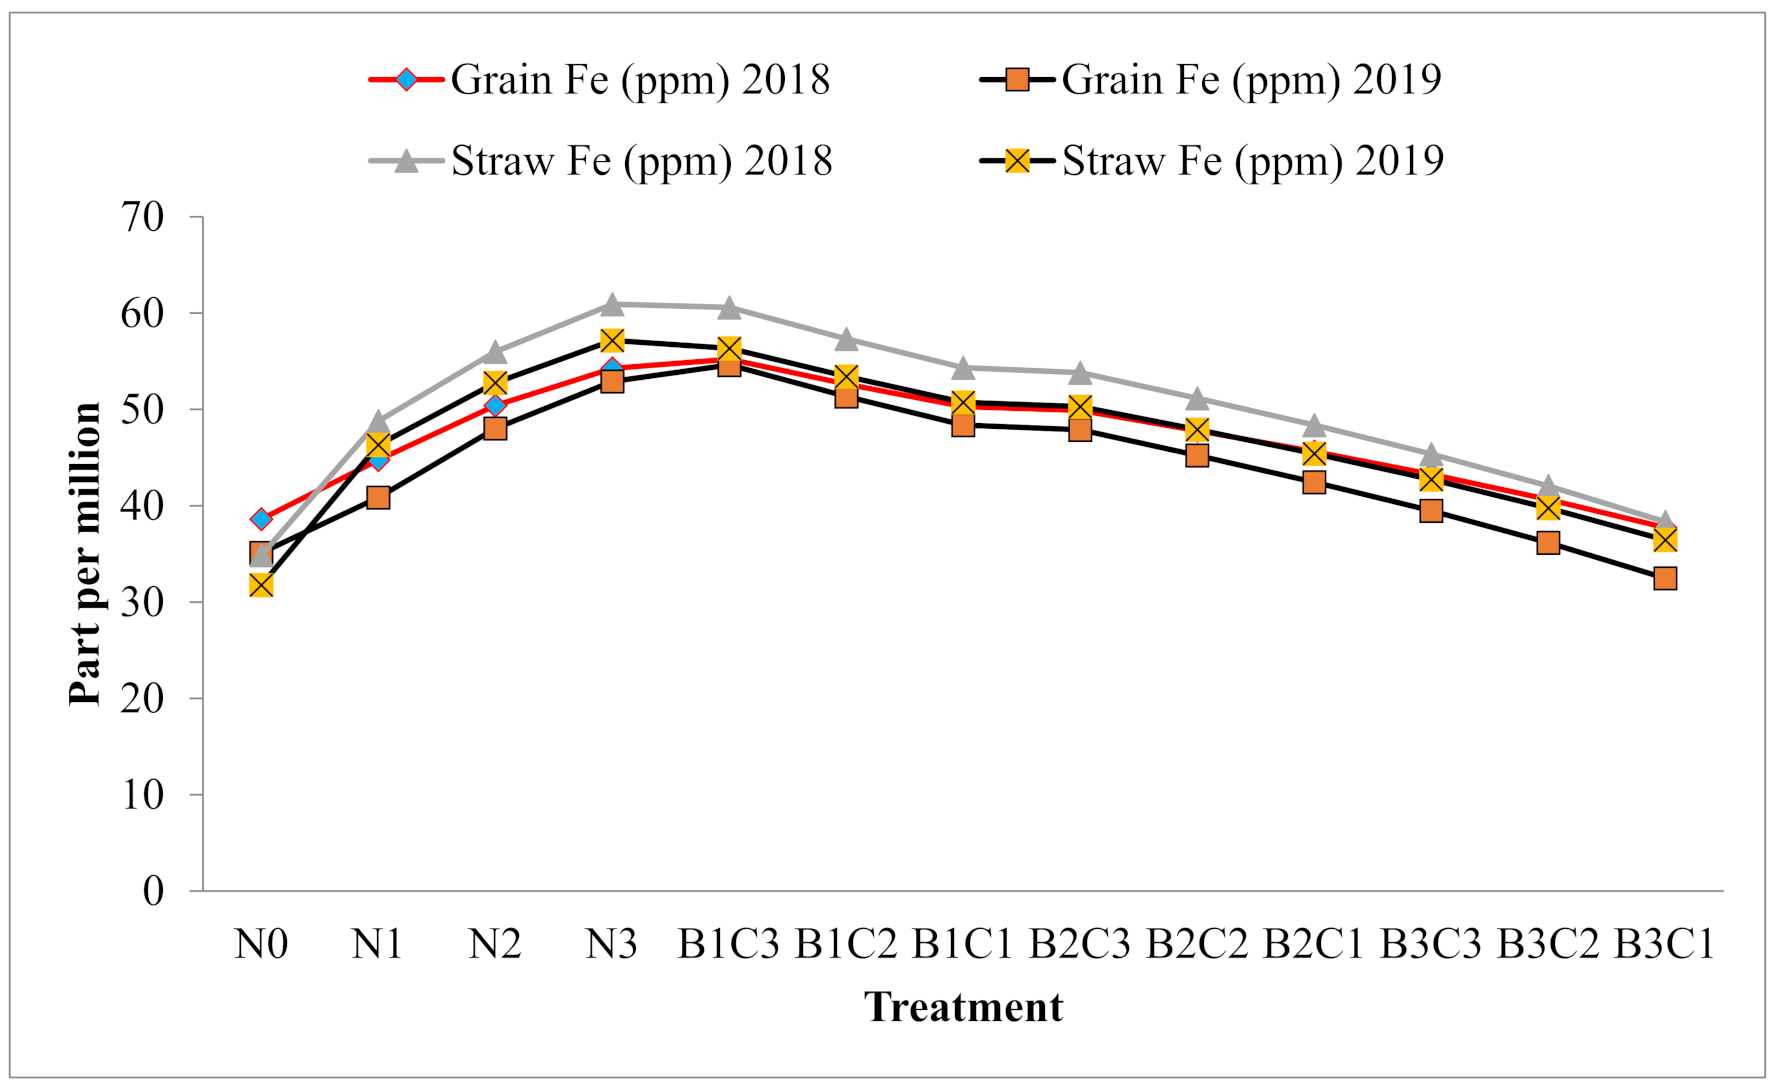
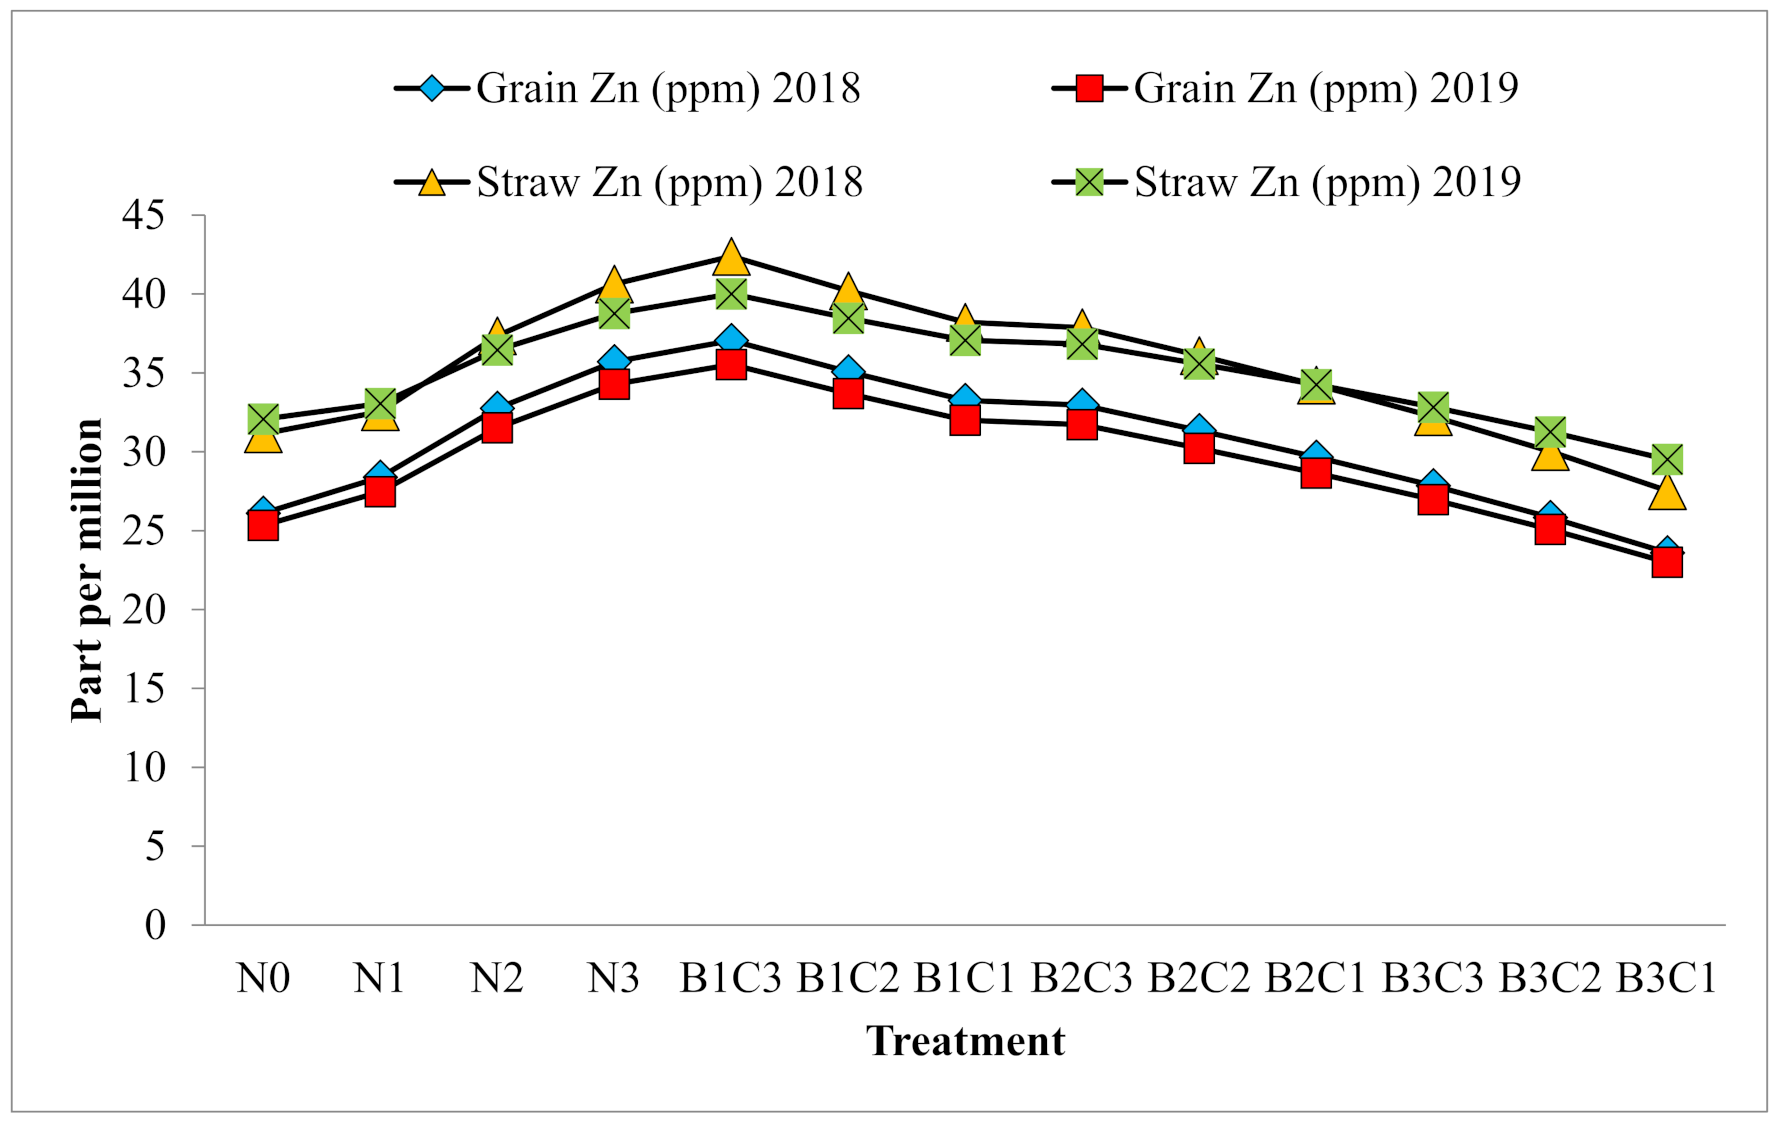
The application of Fe and Zn fertilization in the soil significantly increased the Fe and Zn concentration in the grain and straw of wheat during both years (Figure 2 and Figure 3). During both years, the soil with theN3 treatment applied had the highest Fe and Zn contents in wheat grain, with values of 54.3 and 52.9 and 35.7 and 34.3 ppm, respectively. In the case of wheat, the N0 treatment was found to have the lowest Fe content at 38.6 and 35.1 ppm in the grain during both years of study. Likewise, the N0 treatment was also found to have the lowest Zn content at 26.1 and 25.3 ppm in the grain of wheat during both years of study. Treatment N3observed higher Fe and Zn contents of 60.9 and 57.2, and 40.6 and 38.8 ppm, respectively, in the straw of wheat. During the two years of research, it was 26.1, 25.4, and 9.5 ppm higher than the control plot. In both years the lowest Fe and Zn content in straw was noticed in the N0 plot.
The compost combination application significantly enhanced the Fe and Zn concentrations in the grain and straw of wheat during both years of the research work (Figure 2 and Figure 3). TreatmentB1C3 was found to have the maximum Fe and Zn content in grain of 55.2 and54.6 and 37.1 and 35.5 ppm, followed by the treatment B1C2at 52.6 and 51.4 and 35.1 and 33.7 ppm, during the two consecutive years of study, respectively. However, treatments B1C1 and B2C3were observed to be statistically on par with each other in terms of Fe and Zn content in grain and straw during both years of study. In the case of wheat grain, the B3C1 treatment was found to have the lowest Fe and Zn content of 37.7 and 32.5 and 23.6 and 23.0 ppm during both years of study, respectively. TreatmentB1C3 was found to have the highest Fe and Zn content at 60.6 and 56.3 and 42.4 and 40.1 ppm in wheat straw. These valueswere58.03 and 54.65 and 53.97 and 35.58% more over the B3C1 treatment in both years, respectively. TreatmentB1C1 was found to be statistically on par with the B2C3 in terms of the Fe content in the straw of wheat, and a similar trend was found in the Zn content in the straw of wheat during the two years of the research work. The research shows that treatment B3C1 was observed to have the minimum Fe and Zn content of 38.3 and 36.4 and 27.5 and 29.5 ppm in the straw of wheat in both years of study, respectively.
N0 = control; N1 = 112.5 kg N + 45 kg P + 45 kg K;N2 = 150 kg N + 60 kg P + 60 kg K; and N3 = 150 kg N + 60 kg P + 60 kg K+ 26.31 kg FeO4.7H2O +15.15 kg ZnO4.H2O; B1C1 = Carpet waste and Pleurotussajor-caju; B1C2 = Carpet waste and Azotobacterchroococcum; B1C3 = Carpet waste and Trichoderma viride; B2C1 = Pressmudand Pleurotussajor-caju; B2C2 = Pressmud and Azotobacter chroococcum; B2C3 = Pressmud and Trichoderma viride; B3C1 = Bagasse and Pleurotussajor-caju; B3C2 = Bagasse and Azotobacterchroococcum; B3C3 = Bagasse and Trichoderma viride.
3.5. Fe and Zn Content of Rice Grain and Straw
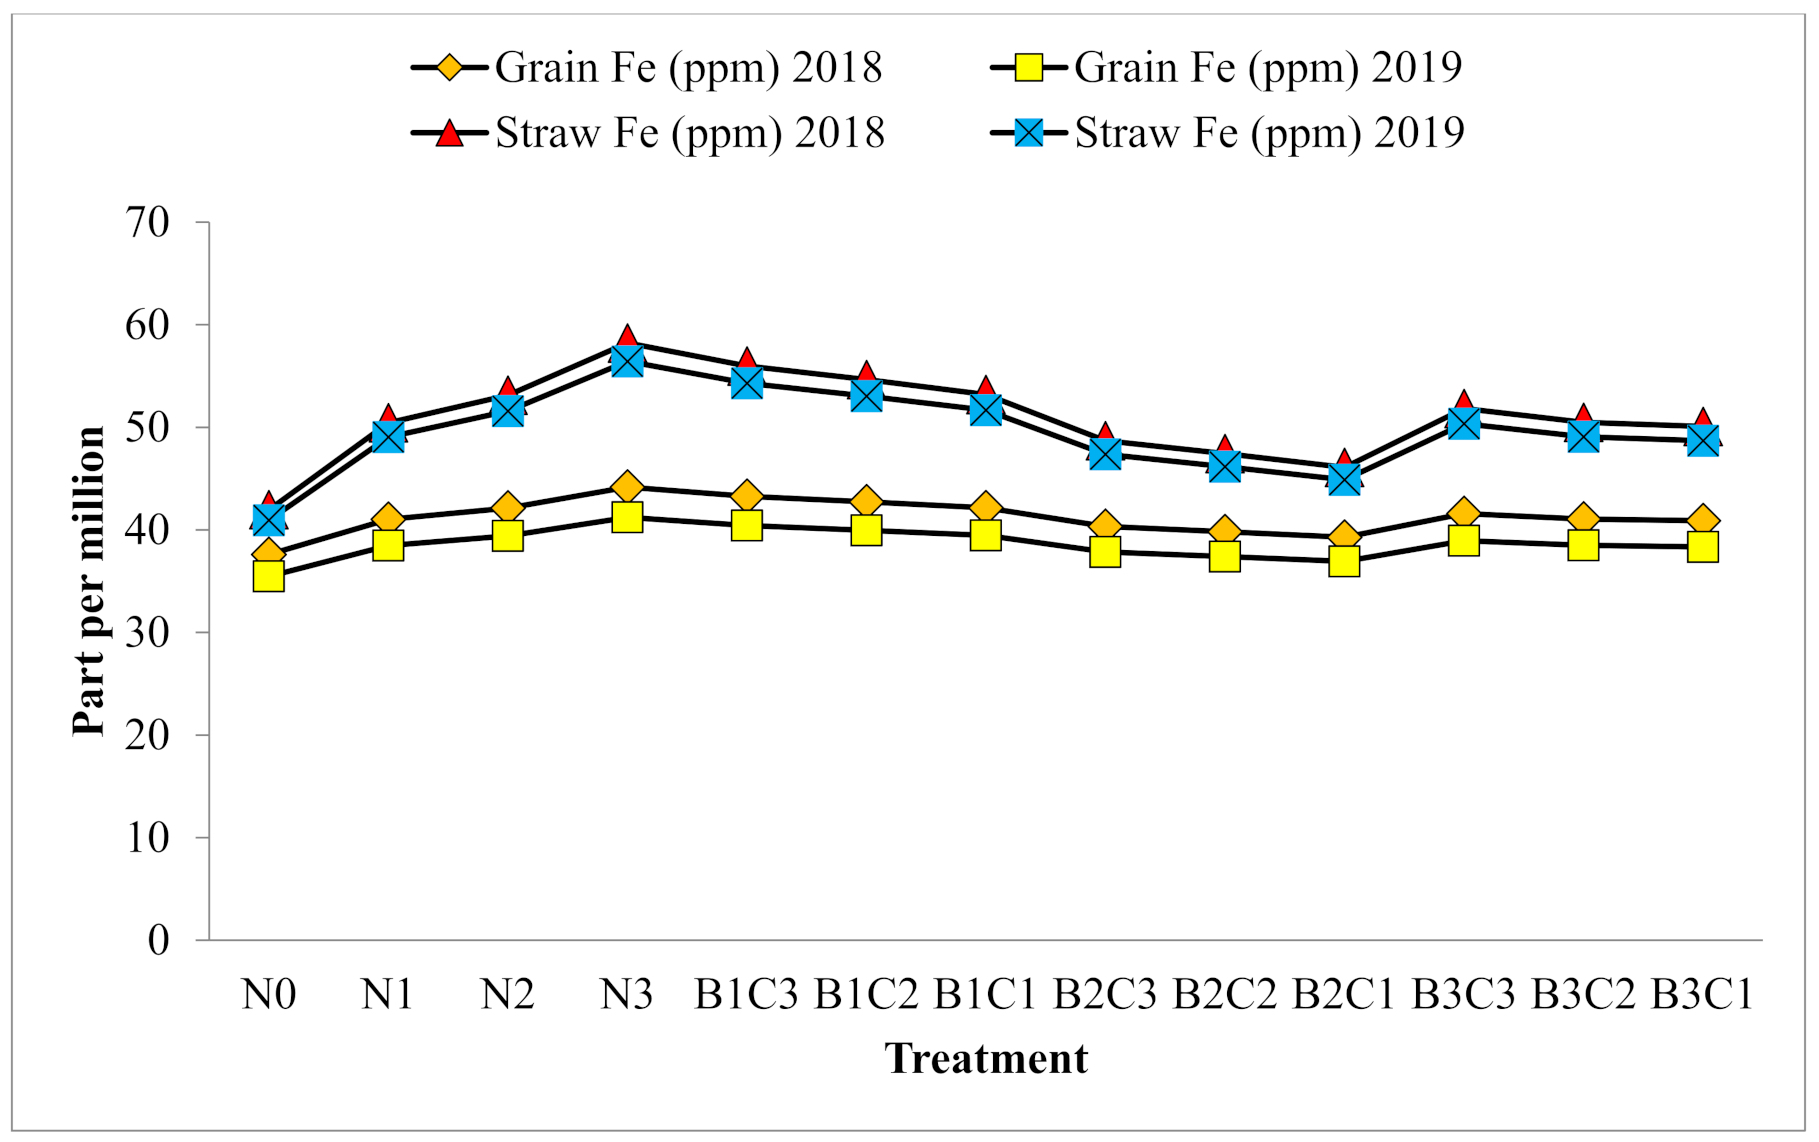
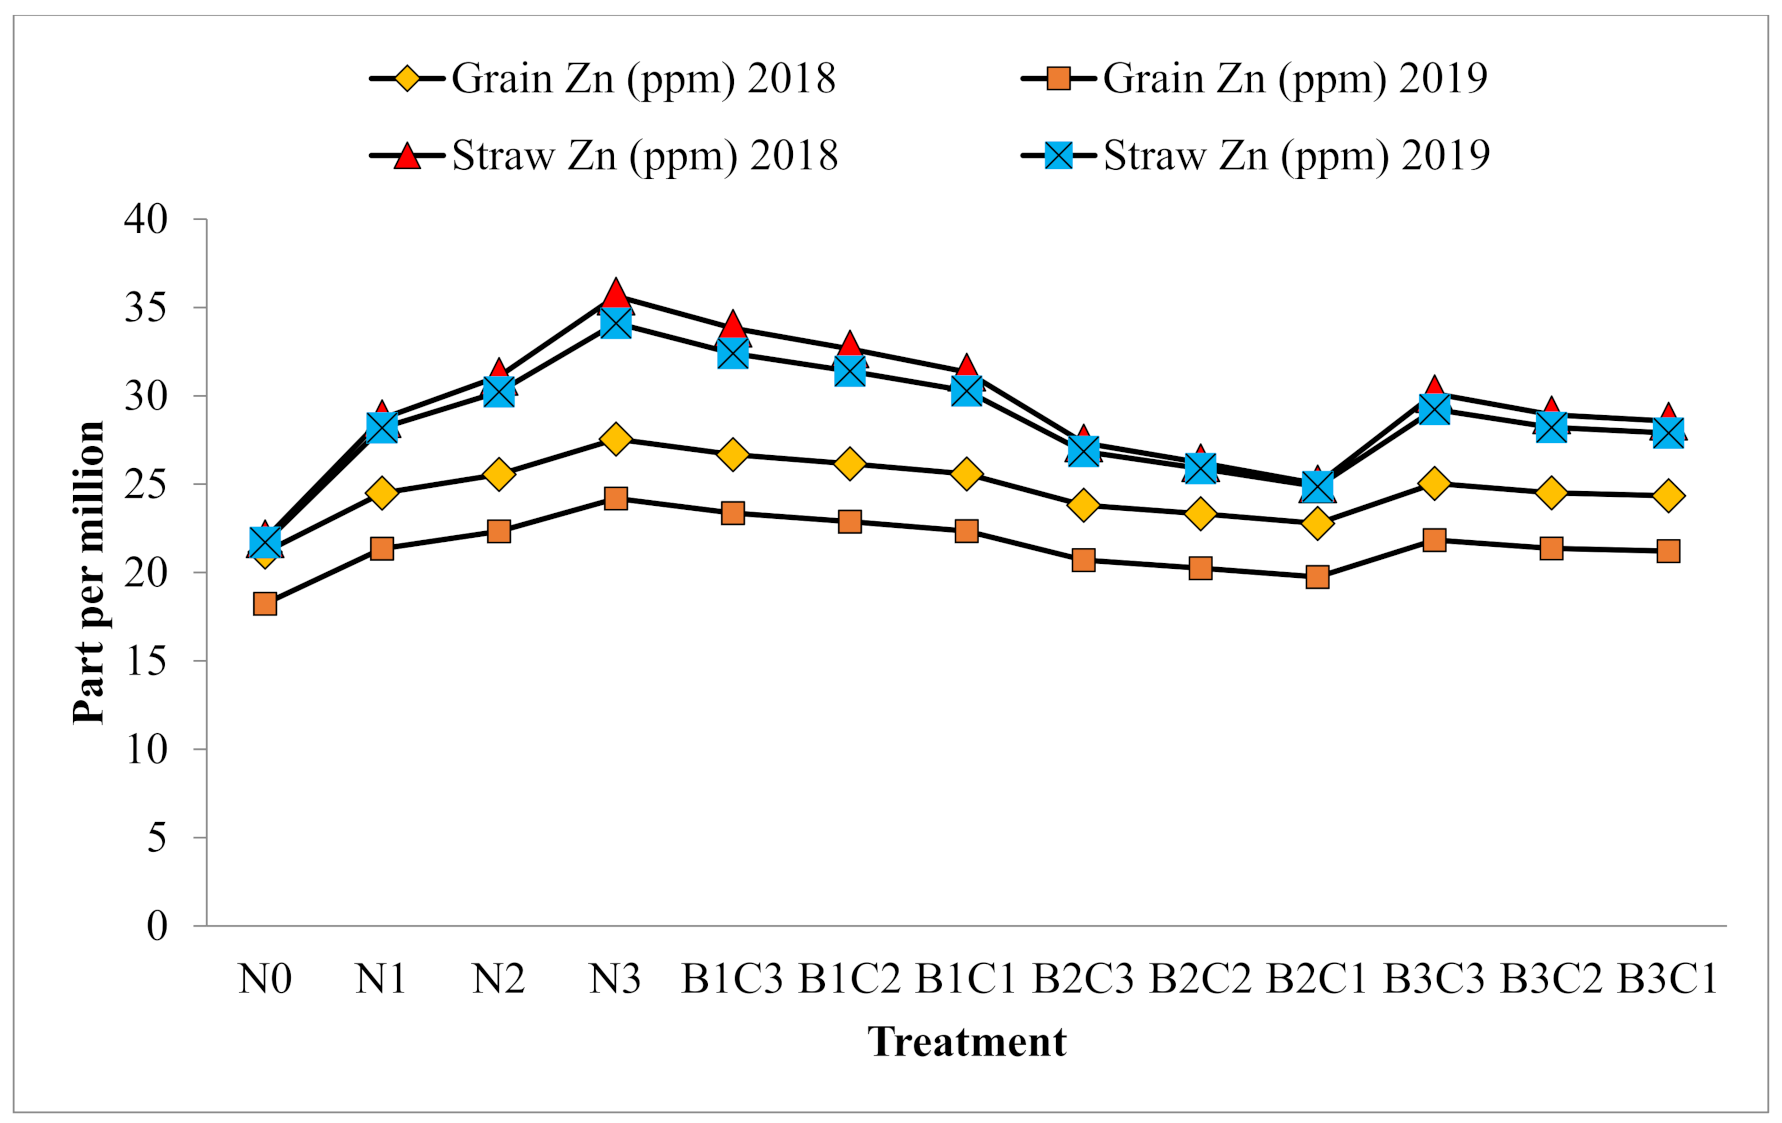
The concentration of Fe and Zn in the grain and straw of succeeding rice was significantly increased with the residual effect of treatment (Figure 4 and Figure 5). The residual treatment N3 was observed to have a maximum Fe and Zn content of 44.2 and 41.2 and 27.5 and 24.2 ppm in the grain of rice, followed by treatment N2 at 42.1 and 39.4 and 25.5 and 22.3 ppm during both years, respectively. The lowest grain Fe and Zn concentrations of 37.6 and 35.5 and 21.2 and 18.2 ppm in rice were noticed in the control plot during the two consecutive years of study, respectively. Treatment N3 was found to have the maximum Fe and Zn content in the straw of rice at 58.2 and 56.4 and 35.6 and 34.1 ppm. It was 16.3 and 15.5 and 13.7 and 12.4 ppm more compared to the control plot during both years, respectively.
The residual effect of compost combinations significantly improved the Fe and Zn concentration in the grain and straw of rice during both years of study (Figure 4 and Figure 5). The residual effect of B1C3 treatment was shown to have the highest Fe and Zn contents of 43.3 and 40.4 and 26.7 and 23.4 ppm in the grain of rice during both years of study, respectively. The residual treatment B1C2 was observed to have 4.49 and 4.22 and 7.39 and 7.87% higher Fe and Zn contents in the grain of rice over the B3C1 treatment during the two years of research, respectively. However, treatments B3C2 and B3C1 resulted in being on par with each other in terms of Fe and Zn contents of rice grain during both years, and a similar trend was observed in the Fe and Zn contents of rice straw in both years. Furthermore, in both years, the residual treatment B1C3 had the highest Fe and Zn contents in rice straw, with values of 56.0 and 54.3 and 33.8 and 32.4 ppm, respectively, followed by the residual treatment B1C2, which had values of 54.6 and 53.1 and 32.6 and 31.4 ppm, respectively. The residual treatment B3C1 was found to have the lowest Fe and Zn contents of 50.1 and 48.7 and 28.6 and 27.9 ppm in the straw of rice during the two successive years of research, respectively.
3.6. Uptake of Fe and Zn by Wheat Crop
The Fe and Zn application to wheat significantly enhanced the uptake of Fe and Zn content (grain, straw, and total) during the two years of research (Table 5 and Figure 6). The application of the N3 treatment was observed to produce the maximum Fe uptake by wheat (grain, straw, and total) of 0.29 and 0.26, 0.41 and 0.32, and 0.69, 0.58 kg ha−1 in both years. It was 141 and 136, 156 and 166, and 146 and 152% higher than the control plot during both years, respectively. The control plot was observed to have the minimum Fe uptake by wheat (grain, straw, and total) of 0.12 and 0.11, 0.16 and 0.12, and 0.28 and 0.23 kg ha−1 during both years of study. The application of the N3 treatment recorded the highest Zn uptake by wheat (grain, straw and total) of 0.19 and 0.17, 0.21 and 0.19, and 0.40 and 0.36 kg ha−1. It was 0.11 and 0.09, 011 and 0.09, and 0.22 and 0.18 kg ha−1 higherthan the control plot during the two successive years of study, respectively.
The application of the compost combination on wheat was found to have a significant influence on its Fe and Zn uptake (grain, straw, and total) during both years (Table 5 and Figure 6). The B1C3 treatment showed the highest Fe uptake by wheat (grain, straw, and total) of 0.29 and 0.26, 0.41 and 0.32, and 0.70 and 0.58 kg ha−1as compared to the other treatments in both years of study, respectively. The lowest Fe uptake by wheat (grain, straw, and total) of 0.14 and 0.12, 0.20 and 0.16, and 0.16 and 0.34 kg ha−1 was notice in the B3C1 treatment in both years, respectively. Treatment B1C1 was found to be statistically on par with treatment B2C3 in terms of Fe uptake (grain, straw, and total) by wheat during the two years of study. The B1C3 treatment recorded the significantly highest Zn uptake by wheat (grain, straw, and total) of 0.19 and 0.17, 0.22 and 0.19, and 0.41 and 0.36 kg ha−1 among all the applied treatments during the two years of research work, respectively. The B3C1 treatment was found to have the lowest Zn uptake by wheat (grain, straw, and total) of 0.09 and 0.08, 0.10 and 0.10, and 0.22 and 0.21 kg ha−1 in both years, respectively.
3.7. Uptake of Fe and Zn by Rice Crop
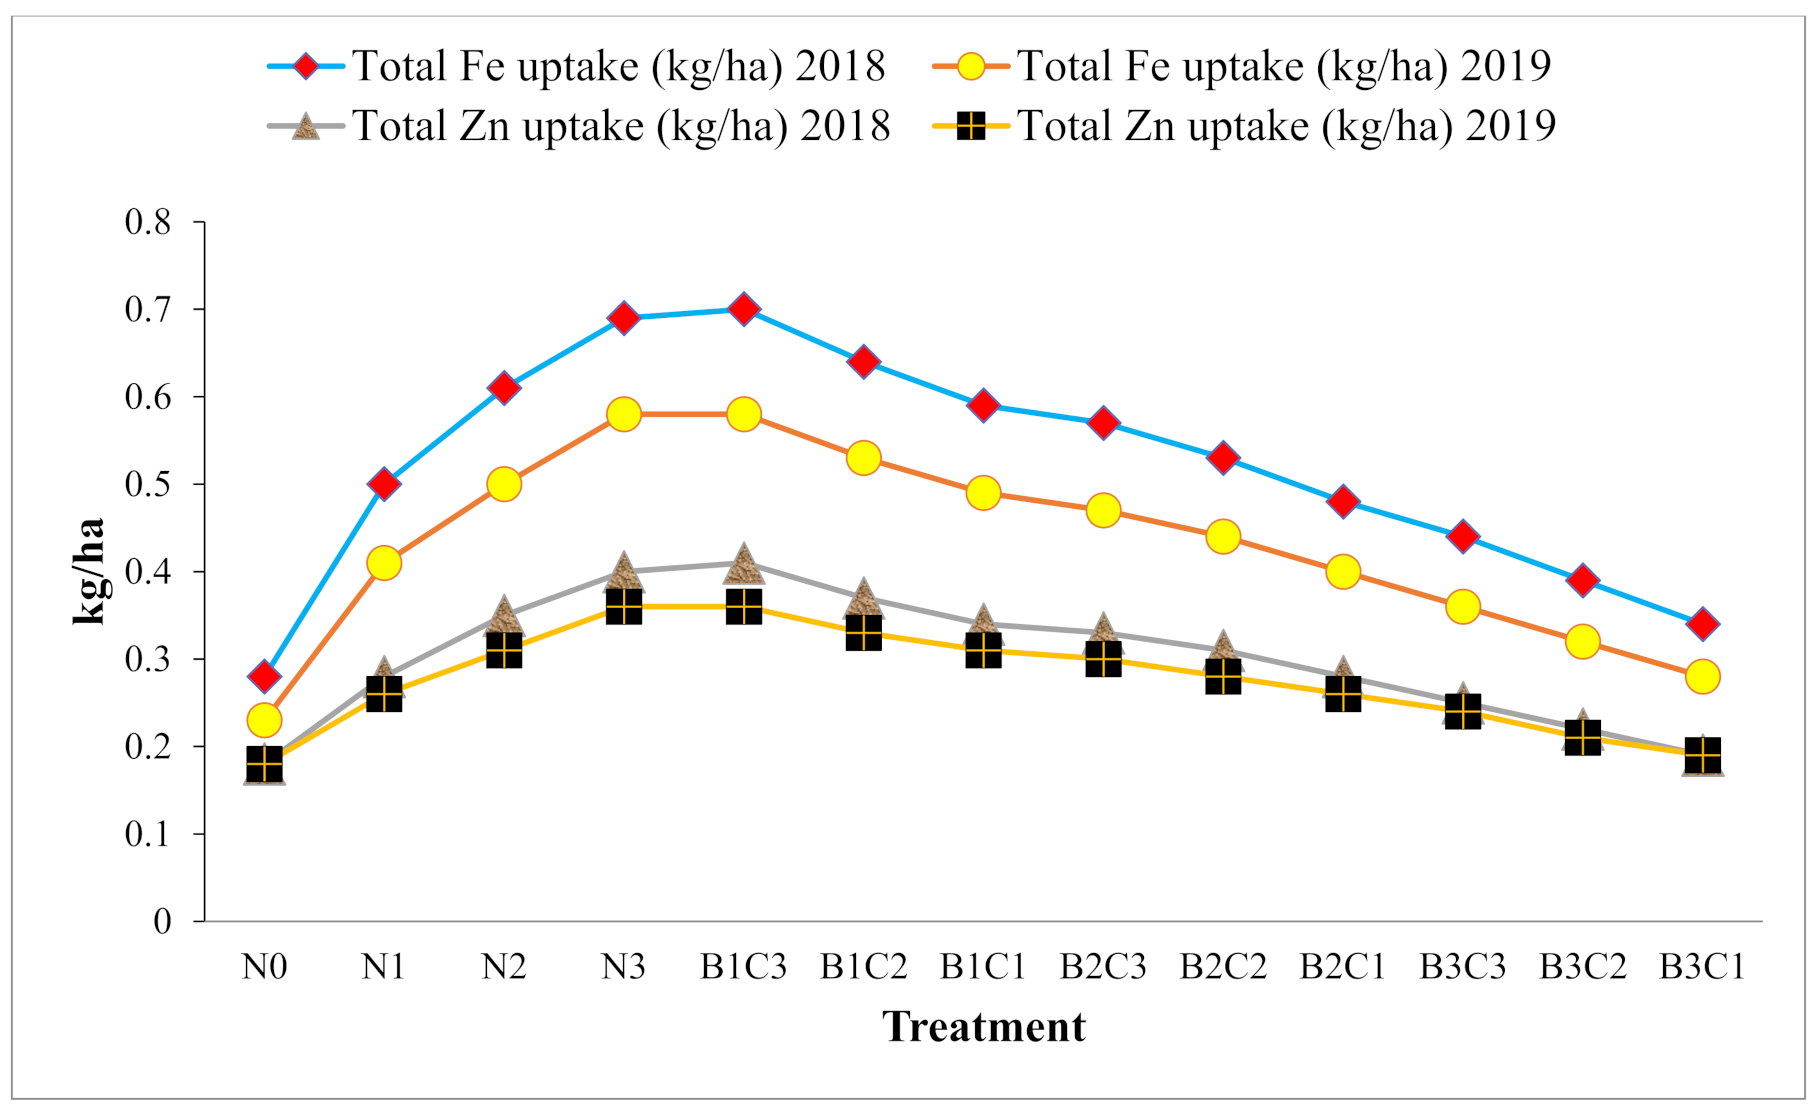
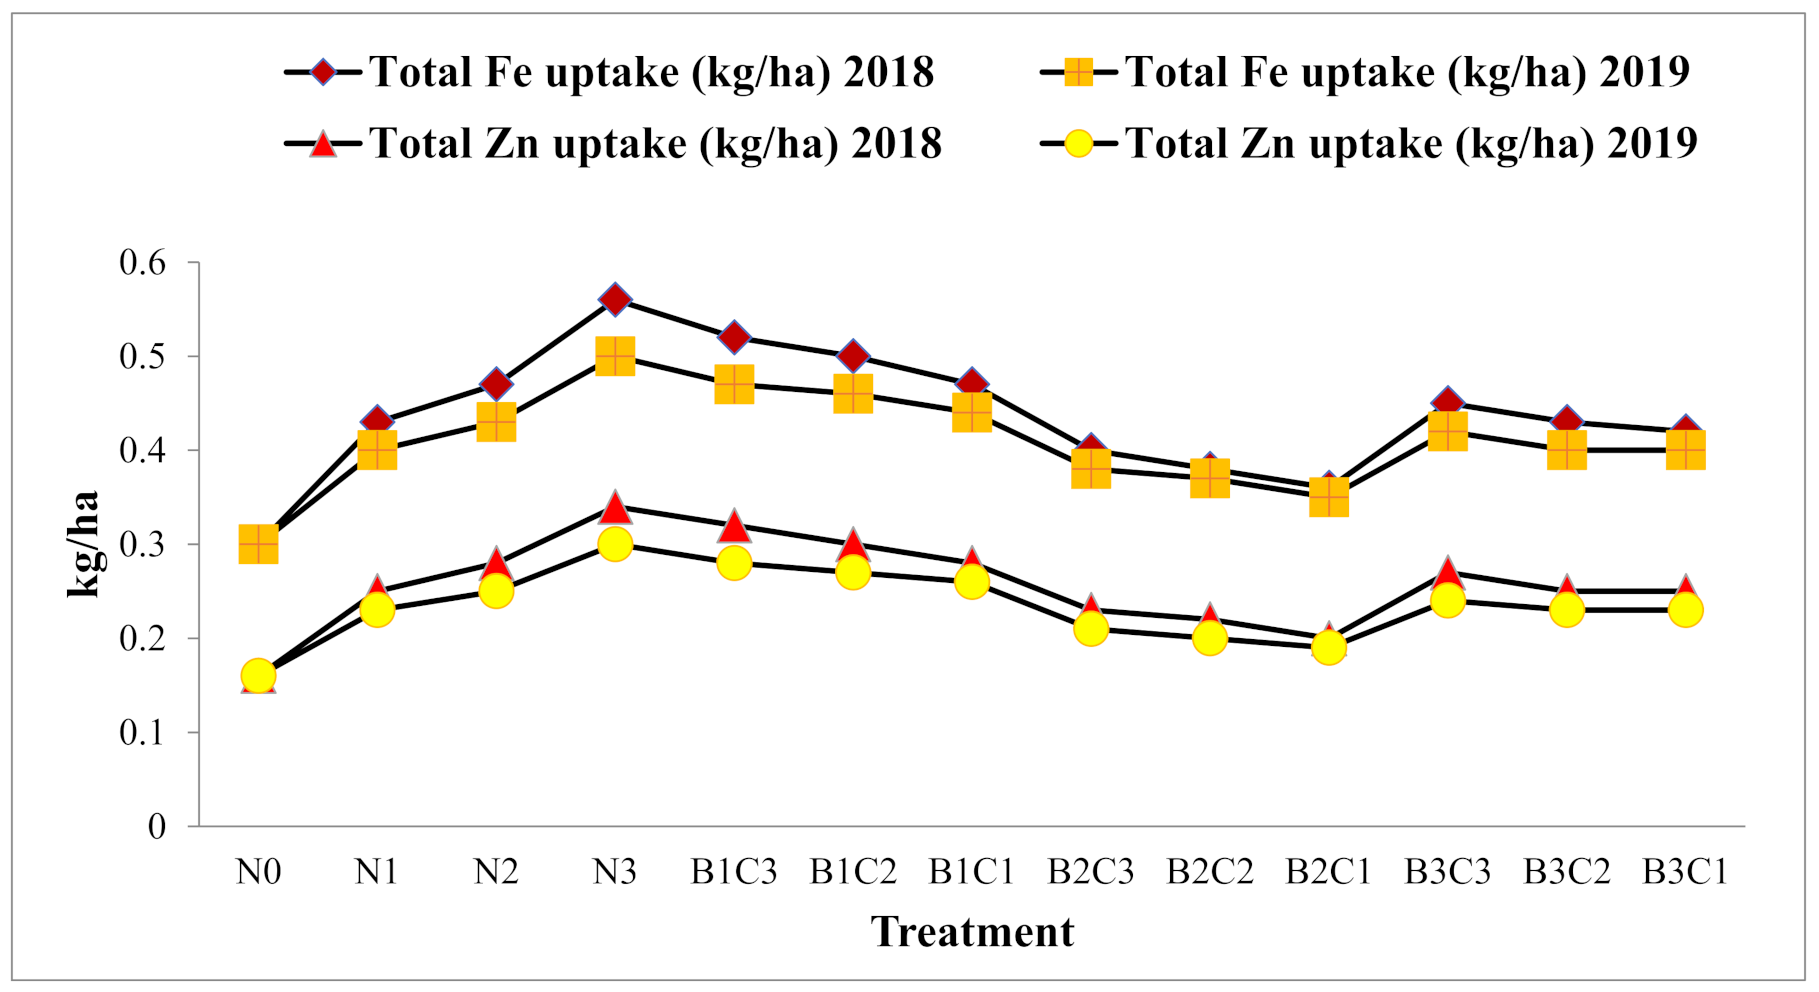
The Fe and Zn uptake (grain, straw, and total) by succeeding rice was observed to be significantly lower in treatments that did not apply Zn as compared to the applied plot in both the years of study (Table 6 and Figure 7). In the case of succeeding rice, the N3 treatment was found to have the highest Fe uptake (grain, straw, and total) of 0.19 and 0.16, 0.37 and 0.34, and 0.56 and 0.50 kg ha−1, followed by treatment N2 at 0.16 and 0.14, 0.30 and 0.29, and 0.47 and 0.43 kg ha−1 during both years, respectively. A similar trend was also found in the Zn uptake (grain, straw, and total) by succeeding rice. However, in the N0 treatment the lowest Fe uptake by succeeding rice (grain, straw, and total) of 0.11 and 0.10, 0.19 and 0.20, and 0.30 and 0.30 kg ha−1 was observed in both the years of study, respectively. In the rice crop, the N0 treatment recorded the lowest Zn uptake (grain, straw, and total) of 0.06 and 0.05, 0.10 and 0.11, and 0.16 and 0.16 kg ha−1 in both years of study, respectively.
The residual effects of compost combinations significantly influenced Fe and Zn uptake (grain, straw, and total) by succeeding rice during the two years of study (Table 6 and Figure 7). The residual treatment B1C3 in rice was observed to have more Fe uptake (grain, straw, and total) of 20 and 15.38, 25.92 and 18. 51, and 23.80 and 17.5% over B3C1 in both years, respectively. The B3C1 treatment was noticed to have the lowest Fe uptake by rice (grain, straw, and total) of 0.15 and 0.13, 0.27 and 0.27, and 0.42 and 0.40 kg ha−1 in both years of study, respectively. The Fe uptake (grain, straw, and total) by rice in treatment B3C2 was statistically on par with treatment B3C1 in both years, and a similar result was also seen in the Zn uptake (grain, straw, and total) by rice. The B1C3 treatment was found to have maximum Zn uptake by rice (grain, straw, and total) of 0.11 and 0.09, 0.21 and 0.19, and 0.32 and 0.28 kg ha−1, while the lowest Zn uptake (grain, straw, and total) was observed in B3C1 at 0.09 and 0.07, 0.16 and 0.15, and 0.25 and 0.23 kg ha−1 in both years, respectively.
3.8. Interaction Effects of Nutrient Levels and Compost Combination on Total Fe and Zn Uptake (kg ha−1) by Wheat and Rice (Pooled Two Years)
The pooled data presented in Table 7 and Table 8 reveal the interaction effects of nutrient levels and compost combination on total Fe and Zn uptake (kg ha−1) of wheat. The maximum 0.84 kg ha−1 total Fe uptake by wheat was recorded with the interaction effect of N3 and B1C3 treatment, followed by the effect of N3 and B1C2. However, the minimum 0.19 kg ha−1 total Fe uptake by wheat was observed in the treatment of N0 and B3C1 based on two years of pooled analysis. However, the interaction of treatment N3 and B1C3 was found at par (p ≤ 0.05) with that of the N3 and B1C2 treatment. Furthermore, the highest 0.50 kg ha−1 total Zn uptake by wheat was recorded in the N3 and B1C3 treatment, followed by the interaction effect of N3 and B1C2. However, the lowest 0.13 kg ha−1 total Zn uptake by wheat was observed in the treatment of N0 and B3C1 based on two years of pooled analysis. However, the interaction of treatment N3 and B1C3 was found to be at par (p ≤ 0.05) with that of the N3 and B1C2 treatments in terms of total Zn uptake by wheat. Similarly, the interaction of treatments N0and B3C1 was found to be on par (p ≤ 0.05) with that of the theN0 and B3C2 treatments in terms of the total Zn uptake by wheat.
The pooled data presented in Table 9 and Table 10 reveal the interaction effects of nutrient levels and compost combination on the total Fe and Zn uptake (kg ha−1) of rice. The maximum interaction effect of the N3 and B1C3 treatment was found to be 0.62 kg ha−1 total Fe uptake by rice, followed by the interaction effect of N3 and B1C2. However, the interaction of treatments N0 and B3C1 was found to be the minimum at 0.29 kg ha−1 total Fe uptake by rice, based on two years of pooled analysis. However, the interaction of treatment N3 and B1C3 was found to be on par (p ≤ 0.05) with that of the N3 and B1C2 treatment in terms of the total Fe uptake by rice. Similarly, the interactions of treatments N0 and B3C1 was found to be on par (p ≤ 0.05) with that oftheN0 and B3C2treatments in terms of the total Fe uptake by rice. The interaction effect of the N3 and B1C3 treatments was found to be the maximum at 0.39 kg ha−1 total Zn uptake by rice, followed by N3 and B1C2. However, the interaction of treatments N0 and B3C1 was found to be the minimum at0.15 kg ha−1 total Zn uptake by rice, based on two years pooled analysis. However, the treatment N3 and B1C3 was found to be on par (p ≤ 0.05) with that of the N3 and B1C2 treatments in terms of total Zn uptake by rice. Similarly, the treatment N0 and B3C1 was found to be on par (p ≤ 0.05) with that of the N0 and B3C2 treatments in terms of the total Zn uptake by rice.
3.9. Nutrient Balanced Sheet of Fe and Zn in Wheat–Rice Sequence
There is a positive nutrient balance of Fe and Zn observed in the wheat–rice production system during both years of the research work (Table 11). The N3 treatment was recorded as the highest balance in soil at 36.40 and 5.31 kg ha−1 Fe and Zn, while the N2 treatment was found to have the lowest balance of 31.72 and 0.52 kg ha−1 after two years of study, respectively. In the control treatment, Fe and Zn balances of 32.61 and 1.04 kg ha−1 were observed in the soil. These were 3.79 and 4.27 kg ha−1 less compared to the N3 treatment after the two years of research, respectively. Among compost combination applications, the B1C1 treatment was noted as the highest Fe balance in soil at 38.18 kg ha−1. Furthermore, a maximum balance in soil of 1.99 kg ha−1 Zn was observed in the B3C1 treatment. However, the lowest Fe and Zn balances in the soil were observed in B3C1 (37.00 kg ha−1) and B1C3 (1.75 kg ha−1), respectively.
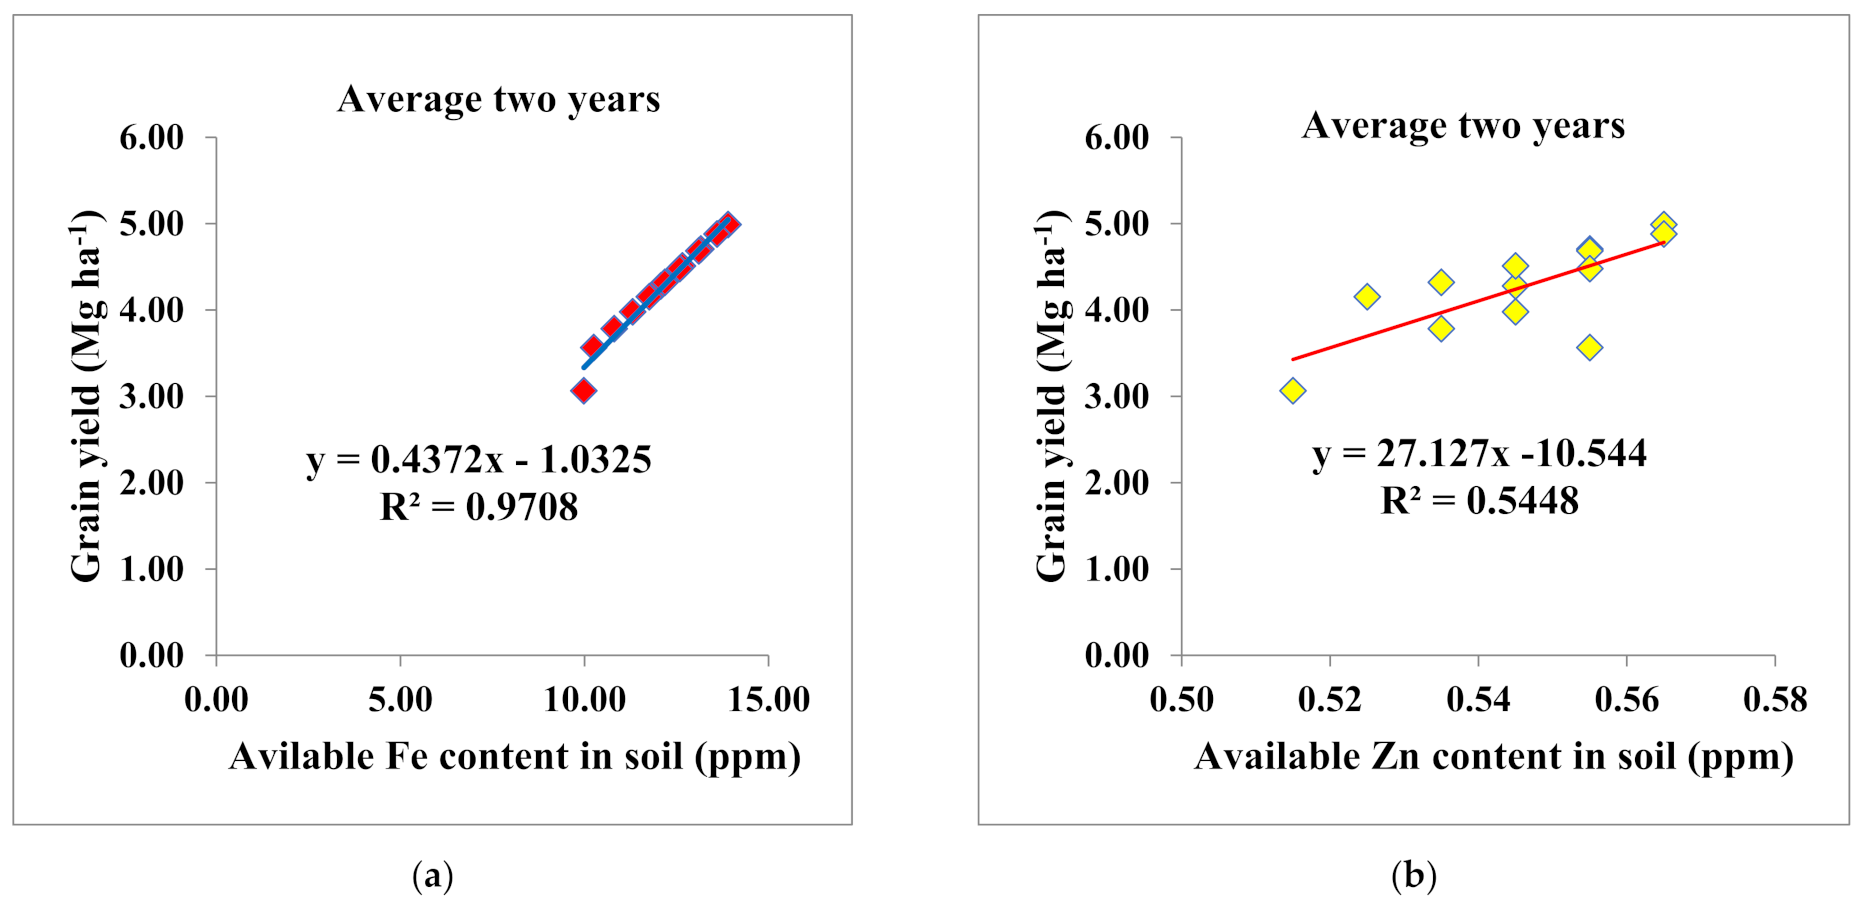
3.10. Simple Correlation and Regression between Grain Yield, Fe, and Zn Content in Soil
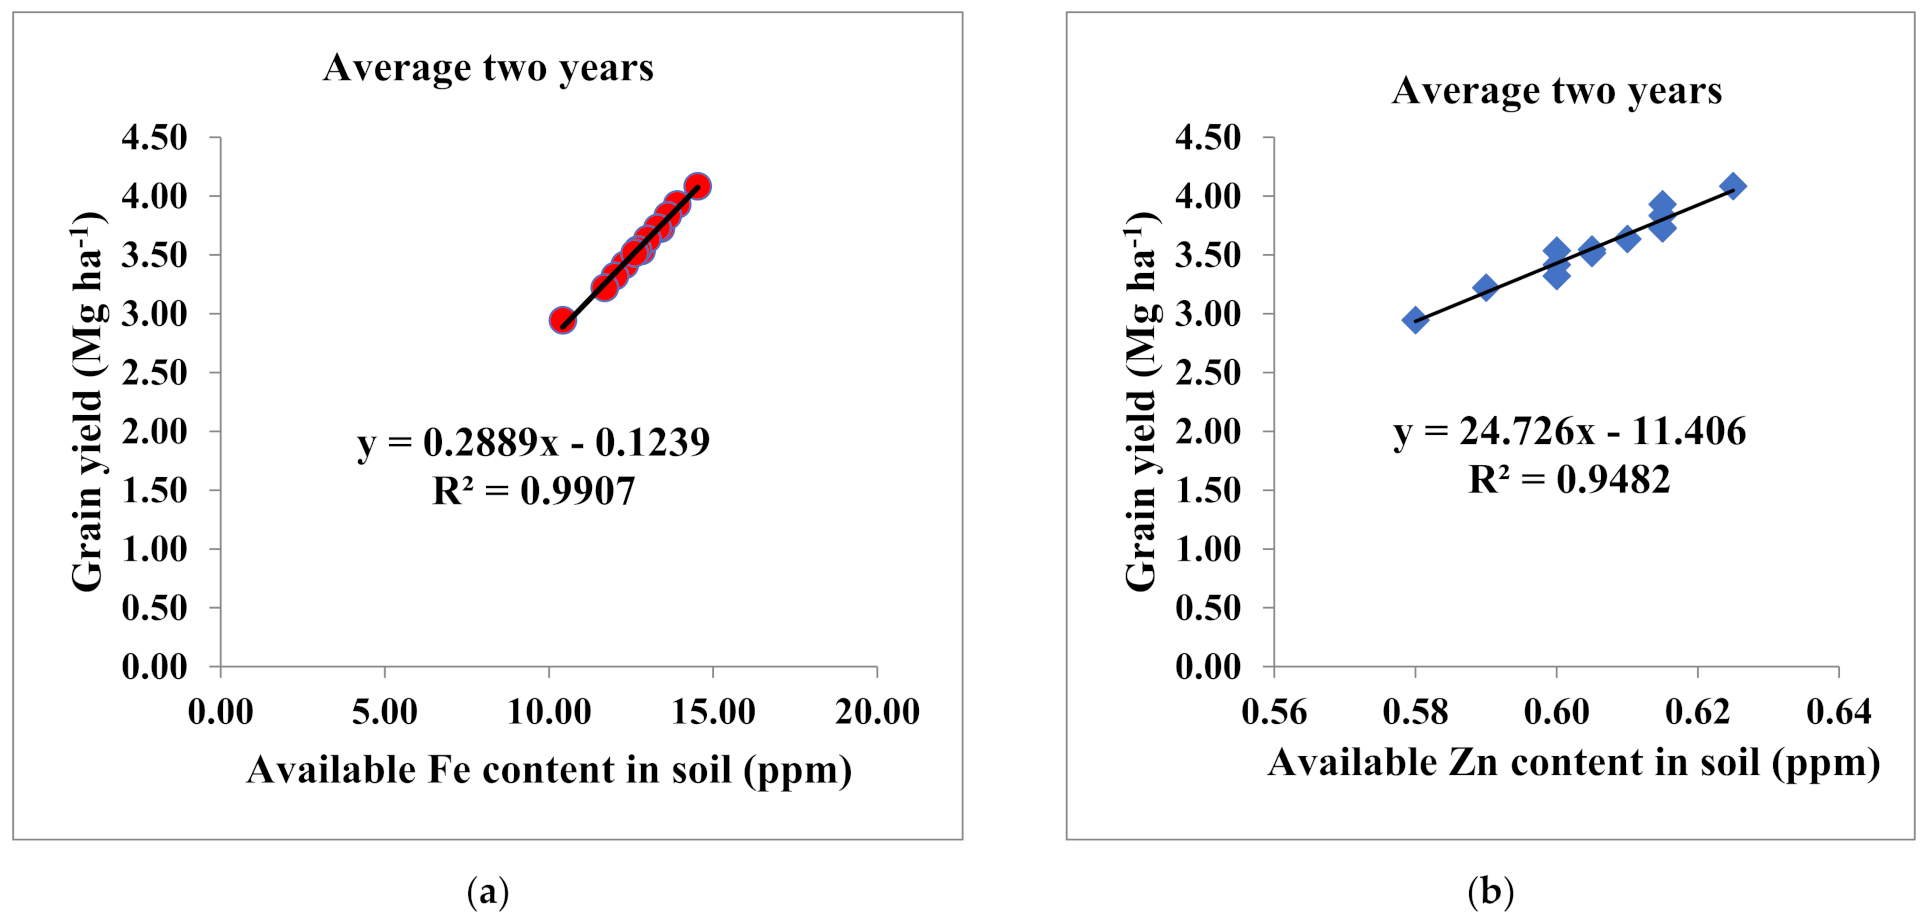
Available Fe and Zn were found to share a significant positive correlation with the grain yield of wheat and rice (Figure 8 and Figure 9). The increase in grain yield with an increase in Fe and Zn availability in soil was found to be linear in fashion. In both years, the available Fe and Zn content in the soil accounted for 97.00 and 54.40% of the variability in the grain yield of wheat, respectively (Figure 8a, b). A high positive correlation (0.75–1) was observed in soil Fe content × grain yield of wheat, whereas a moderate positive correlation (0.25–0.75) was observed in soil Zn content × grain yield of wheat during both years. The available Fe content in the soil contributed towards 99.90% of the grain yield of rice in both years (Figure 9a). The soil Zn content ×grain yield of rice was found to have a high positive correlation in both years of study (Figure 9b).
4. Discussion
4.1. Yield
The results of this experiment illustrated that the application of Fe and Zn nutrition on wheat and its succeeding effects on rice significantly improved the grain, straw, and biological yield over the treatment that did not receive any Fe and Zn nutrition (Table 1). Fe is an important constituent of chlorophyll pigment, a component of different proteins and enzymes which help in chlorophyll synthesis, enhance the photosynthesis process [57,58], and lead to greater biomass production (Table 1). The application of treatment N3 recorded the highest yield (grain, straw, and biological) of wheat and rice. It was due to the genetically modified Fe and Zn varieties that they attained a higher yield when they received full RDF [59]. The increase in the grain yield might be due to increased uploading of photosynthates from source to sink [60,61]. The increase in the application of nutrient concentration from N0 to N4 was found to linearly improve yield and might be due to an increase in growth parameters. The application of compost combination increased the yield (grain, straw, and biological). This is probably due to microbes obtaining carbon from compost, which enhanced the mineralization and translocation of nutrients in soil [62,63]. Furthermore, the industrial waste compost contains a higher amount of nutrients (macro and micro) as compared to FYM, which helps in better crop growth and yield [37]. Siderophores are the secondary metabolites secreted by microorganisms (bacteria, fungi) and have shown beneficial effects on Fe and Zn nutrition as reported by many researchers [64,65]. The treatment that did not receive Zn application observed decreasing in yields; it is expected that growing crops in Zn-deficient soil reduces the germination percentage and results in poor seedling growth and yield reduction at harvest (Table 1). Other researchers have documented similar types of outcomes [66,67,68].
4.2. Interaction Effects on Yield
The interaction effect of nutrient level and compost combination was observed to significantly improve the grain yield of wheat in two years of study. This might be due to the positive interaction of nutrient level and compost combination, which leads to better availability of plant nutrients, enhanced growth parameters, and yield attributes of wheat. The above statement is closely related to the research findings of [69]. The genetically modified varieties increased yield with an increased combined application of nutrient levels and compost combination. It was due to a positive relationship between nutrient levels and compost combination (Table 2 and Table 3). The application of different microbes helps in the mineralization, solubilization, and mobilization of nutrients present in composts, which helps in increased growth parameters, yield attributes, and yields of crops. The current findings can be supported by the similar results in [70].
4.3. Fe and Zn Content in Soil
The Fe nutrition in the soil was observed significant effects on Fe content in the soil. However, the Zn application found non-significant results. This might be due to low DTPA-Zn content in the initial soil (0.57 ppm). Some other researchers documented that the application of Zn in low DTPA-Zn content in soil found insignificant results in terms of available Zn content in soil [71,72]. Treatment N3observed the maximum Zn and Fe contents in the soil. This was due to the addition of 5 kg of Fe and Zn into the soil. The control treatment (N0) found the lowest available Fe and Zn in the soil, which can be proved by the control plot observing lowest uptake of Fe and Zn in grain and straw (Table 5). The plot with the lowest available Fe and Zn that saw the lowest uptake of Fe and Zn was also studied by [64]. The addition of the compost combination improved the available Fe and Zn content in the soil. It might be due to higher Fe and Zn contents. The microbes help in the mineralization of nutrients present in the compost, turning them into an available form.
4.4. Fe and Zn Concentration in Grainand Straw
In treatment N3, 12.25 and 8.05 and 13.77 and 13.06% more Fe and Zn were found in straw over grain in both years of study, respectively (Figure 2 and Figure 3). This is due to Fe and Zn being moderately mobile in plant systems, so that fewer amounts of Fe and Zn are translocated from source to sink [73]. The amount of Zn in the soil (depths 0–15 cm) appears to have an impact on grain nutrition. The amount of iron and zinc in rice and wheat grain is mostly determined by environmental factors, especially soil availability [74]. The Zn content in grain and straw of both rice and wheat crops was lower as compared to the Fe content. This is because the lower amount of Zn content in soil was observed before the start of the experiment. Similar types of result have also been documented by [75]. The increase in Fe and Zn content in the grain and straw of rice with the residual effect of compost combinations was due to improvement in soil physico-chemical properties and better nutrient availability, which leads to higher Fe and Zn content. This statement was also supported by [43,76,77]. The increase in N dose from N1 to N3 improves Fe and Zn concentrations in grain (Figure 2, Figure 3, Figure 4 and Figure 5), which could be attributed to N form chelation with Fe and Zn and encouraging their transport through phloem tissue into the grain [62]. Similar results on how N nutrition helps in the promotion of Fe and Zn content in grain have been reported by other researchers [78,79]. The increase in Zn concentration in wheat and rice is due to the better response of Zn application in Zn-deficient soil. In Zn-deficient soil, the application of Zn fertilizers not only increased the productivity of the crop but also the Zn concentration in the grain and straw [80]. We observed a significant improvement in grain Zn content after applying mineral Zn fertilizer, which is in agreement with earlier findings [81]. The genetically modified varieties have a greater potential for accumulation and uptake of nutrients as compared to traditional varieties under a balanced supply of nutrients [18]. The application of compost combination along with Fe and Zn fertilization has a positive relationship, which leads to higher nutrient uptake (Table 5 and Table 6) and content in grain and straw.
4.5. Fe and Zn Uptake by Grain and Straw
The Fe and Zn uptake (grain, straw, and total) by wheat and rice decreased from treatment N3 to N0 (Table 3 and Table 4), which might be due to the fixation of Fe and Zn by phosphate (PO42−) ions or leaching losses and lower biomass yield (Table 1), which has less root proliferation and leads to a lower uptake of nutrient ions [82]. The application of Zn in the Zn-deficient soil showed a positive increase in the Zn content and uptake in the grain and straw of both wheat and residual rice (Table 5 and Table 6). The above statement was supported by [83], who reported that the Zn content and uptake in grain and straw of wheat were significantly increased with soil application of Zn, particularly in soil with less than 0.60 mg kg−1 available Zn [84]. Genetically modified varieties have more capacity to extract Fe and Zn from the soil compared to traditional varieties [18]. The application of industrial compost combinations that contain higher concentrations of Fe and Zn leads to increased nutrient status of the soil and uptake [37]. After the addition of compost to soil, it was observed that the improvement in Fe and Zn uptake from the native soil Fe and Zn pool was probably due to an improvement in soil conditions, better root growth, etc.
4.6. Interaction Effects on Total Fe and Zn Uptake
The interaction effect of nutrient level and compost combination was observed to significantly improve total Fe and Zn uptake in the two years of study. Traditional varieties have a lower potential to uptake Fe and Zn from soil than genetically Fe- and Zn-enriched varieties [18]. The interaction between Fe and Zn with N observed a positive interaction, which played an important role in total Fe and Zn uptake by wheat and rice. Similar findings have also been observed by [85]. The different composts contain significant quantities of Fe and Zn, which leads to better plant growth and yield (Table 1) and thus a greater uptake of Fe and Zn. The interaction of treatments B1C3 and N3 was observed to be the highest total Fe uptake by wheat and rice. It was due to carpet waste containing the highest amount of Fe and the addition of 26.31 kg of FeO4.7H2O in the soil. The interaction of treatments B3C1 and N0 was observed to have the lowest total Fe and Zn uptake by wheat and rice. This was due to bagasse containing lower amount of Fe and Zn as compared to pressmud and carpet waste compost. The interaction of treatmentsB3C1 and B3C2 with N0 were observed to be on par (p ≤ 0.05) with each other in terms of total Zn uptake by wheat and rice. It was because the uptake of Zn was lower under Zn-deficient soil. A similar finding was documented by [71,72].
4.7. The Nutrient Balance Sheet of Fe and Zn
The highest Fe and Zn balance in soil after two years of crop growth was observed in the N3 treatment. This might be due to the application of Fe and Zn application to the soil (Table 5). There was a positive Fe and Zn balance observed in soil after two years of study. This was due to the addition of Fe and Zn through fertilizer as well as a significant contribution from different compost materials. The lowest Zn balance was observed in the N2 treatment due to the soil being deficient in available Zn content and the crop of wheat and rice depleting the available Zn from the soil, so that the Zn balance moved toward low (Table 11). Similarly, other researchers [86,87] documented that the growing of wheat under Zn-deficient soil decreased the Zn balance in the soil. TreatmentB1C3resulted in the lowest Fe and Zn balance in soil as compared to the B3C1 treatment. This might be due to the greater accumulation (Figure 2, Figure 3, Figure 4 and Figure 5) and uptake (Table 5 and Table 6) of Fe and Zn by both wheat and rice crops during the years 2018 and 2019. Other researchers have reported related findings on wheat and rice [80,88]. The variety itself cannot give a high yield without the applications, to which we strive for primarily due to the high importance and increase in grain quality [88,89].
5. Conclusions
Based on our study, it can be concluded that the application of NPKFeZn, along with compost combination application, improved crop yield and Fe and Zn contents in grain, straw, and soil without jeopardizing agricultural yield or soil fertility. Moreover, sowing the WB 02 wheat variety performed well in the N3 treatment, and Fe and Zn ranges were recorded at 54.3 and 52.9 and 35.7 and 34.3 ppm, respectively, during both years. Likewise, in the DRR Dhan-45 variety of rice, Fe and Zn in N3 were recorded at 44.2 and 41.2 and 27.5 and 24.2 ppm, and 33.84 and 24.90 and 96.78 and 72.78% more Fe and Zn content was found in grain as compared to the traditional varieties. On the basis of the interaction effect of N3 × B1C3 treatments, the highest grain yields of wheat and rice of 5.69 and 4.47 Mg ha−1 were observed, respectively, on the basis of the pooled data. Likewise, the maximum 0.84 and 0.50 kg ha−1 total Fe and Zn uptake by wheat were recorded with the interaction effect of N3 × B1C3 treatments, respectively. Furthermore, the maximum 0.62 and 0.39 kg ha−1 total Fe and Zn uptake by rice were recorded with the interaction effect of the N3 × B1C3 treatments, respectively. The adaptation of this technology, i.e., soil application of Fe and Zn along with genetically modified Fe and Zn enriched varieties, can save millions of rupees compared to the rupees spent on malnutrition alleviation programs and can address the dilemma of malnutrition issues in human beings as well as livestock at a primarily level. The genetically modified Zn- and Fe-enriched varieties might be a unique option for root cause management in the rice–wheat production system. This helps to alleviate the threat of malnutrition for billions of people in dietary supply.
Author Contributions
Conceptualization, R.S.M. and G.P.; methodology and visualization G.P. and R.S.M.; software G.P. and R.S.M.; validation, G.P. and R.S.M.; formal analysis, G.P. and R.S.M.; investigation, G.P. and R.S.M.; resources, G.P. and R.S.M.; data curation, G.P. and R.S.M.; writing—original draft preparation, G.P. and R.S.M.; writing—review and editing, R.S.M. and G.P.; supervision and project administration, R.S.M.; funding acquisition, R.S.M. All authors have read and agreed to the published version of the manuscript.
Funding
This research was funded by [SERB-DST, Govt. of India, New Delhi (Letter No. CRG/2020/001774)].
Institutional Review Board Statement
Not applicable.
Informed Consent Statement
Not applicable.
Data Availability Statement
Most of the data are available in all tables and figures of the manuscripts.
Acknowledgments
Authors are thankful to the SERB (DST, Govt. of India), New Delhi (Letter No. CRG/2020/001774) and the Institute of Agricultural Sciences, B.H.U., Varanasi, for providing the financial support. This work was completed of Eminence (IoE) scheme No. 6031, BHU, Varanasi (UP)–221005, India.
Conflicts of Interest
The authors declare no conflict of interest.
References
- Ladha, J.K.; Kumar, V.; Alam, M.M.; Sharma, S.; Gathala, M.; Chandna, P.; Saharawat, Y.S.; Balasubramanian, V. Integrating crop and resource management technologies for enhanced productivity, profitability, and sustainability of the rice-wheat system in South Asia. In Integrated Crop and Resource Management in the Rice-Wheat system of South Asia; International Rice Research Institute: Makati City, Philippines, 2022; pp. 69–108. Available online: http://books.irri.org/9789712202476_content.pdf (accessed on 28 July 2022).
- Ray, D.K.; Ramankutty, N.; Mueller, N.D.; West, P.C.; Foley, J.A. Recent patterns of crop yield growth and stagnation. Nat. Commun. 2012, 3, 1293. [Google Scholar] [CrossRef] [PubMed] [Green Version]
- Bishwajit, G.; Sarker, S.; Kpoghomou, M.A.; Gao, H.; Jun, L.; Yin, D.; Ghosh, S. Self-sufficiency in rice and food security: A South Asian perspective. Agric. Food Secur. 2013, 2, 10. [Google Scholar] [CrossRef] [Green Version]
- Kataki, P.K.; Hobbs, P.; Adhikary, B. The rice-wheat cropping system of South Asia: Trends, constraints and productivity—A prologue. J. Crop Prod. 2001, 3, 1–26. [Google Scholar] [CrossRef]
- Saharawat, Y.S.; Ladha, J.K.; Pathak, H.; Gathala, M.; Chaudhary, N.; Jat, M.L. Simulation of resource-conserving technologies on productivity, income and greenhouse gas GHG emission in rice-wheat system. J. Soil Sci. Environ. Manag. 2011, 3, 9–22. [Google Scholar] [CrossRef]
- Mahajan, A.; Bhagat, R.; Gupta, R. Integrated nutrient management in sustainable rice-wheat cropping system for food security in India. SAARC J. Agric. 2008, 6, 149–163. [Google Scholar]
- Nadeem, F.; Farooq, M. Application of Micronutrients in Rice-Wheat Cropping System of South Asia. Rice Sci. 2019, 26, 356–371. [Google Scholar] [CrossRef]
- Kumar, A.; Choudhary, A.K.; Pooniya, V.; Suri, V.K.; Singh, U. Soil factors associated with micronutrient acquisition in crops-biofortification perspective. In Biofortification of Food Crops; Springer: New Delhi, India, 2016; ISBN 9788132227168. [Google Scholar]
- Bhatt, R.; Kukal, S.S.; Busari, M.A.; Arora, S.; Yadav, M. Sustainability issues on rice–wheat cropping system. Int. Soil Water Conserv. Res. 2016, 4, 64–74. [Google Scholar] [CrossRef] [Green Version]
- Ladha, J.K.; Fischer, K.S.; Hossain, M.; Hobbs, P.R.; Hardy, B. (Eds.) Improving the Productivity and Sustainability of Rice-Wheat Systems of the Indo-Gangetic Plains: A Synthesis of NARS-IRRI Partnership Research; Discussion Paper; International Rice Research Institute: Los Baños, Philippines, 2000; Volume 33, pp. 1–35. [Google Scholar]
- Timsina, J.; Connor, D.J. Productivity and management of rice-wheat cropping systems: Issues and challenges. Field Crop. Res. 2001, 69, 93–132. [Google Scholar] [CrossRef]
- Gumma, M.K. Mapping rice areas of South Asia using MODIS multitemporal data. J. Appl. Remote Sens. 2011, 5, 053547. [Google Scholar] [CrossRef] [Green Version]
- Kukal, S.S.; Aggarwal, G.C. Puddling depth and intensity effects in rice-wheat system on a sandy loam soil. I. Development of subsurface compaction. Soil Tillage Res. 2003, 72, 1–8. [Google Scholar] [CrossRef]
- Ozkutlu, F.; Torun, B.; Cakmak, I. Effect of zinc humate on growth of soybean and wheat in zinc-deficient calcareous soil. Commun. Soil Sci. Plant Anal. 2006, 37, 2769–2778. [Google Scholar] [CrossRef]
- Ramachandran, N. Women and Food Security in South Asia: Current Issues and Emerging Concerns. In Food Insecurity, Vulnerability and Human Rights Failure; Palgrave Macmillan: London, UK, 2007. [Google Scholar]
- Rose, T.J.; Impa, S.M.; Rose, M.T.; Pariasca-Tanaka, J.; Mori, A.; Heuer, S.; Johnson-Beebout, S.E.; Wissuwa, M. Enhancing phosphorus and zinc acquisition efficiency in rice: A critical review of root traits and their potential utility in rice breeding. Ann. Bot. 2013, 112, 331–345. [Google Scholar] [CrossRef] [Green Version]
- Stein, A.J.; Qaim, M. The human and economic cost of hidden hunger. Food Nutr. Bull. 2007, 28, 125–134. [Google Scholar] [CrossRef]
- Yadava, D.K.; Choudhury, P.R.; Hossain, F.; Kumar, D.; Mohapatra, T. Biofortified Varieties: Sustainable Way to Alleviate Malnutrition, 3rd ed; Indian Council of Agricultural Research: New Delhi, India, 2020; pp. 1–104.
- Nayyar, V.K.; Arora, C.L.; Kataki, P.K. Management of soil micronutrient deficiencies in the rice-wheat cropping system. J. Crop Prod. 2001, 4, 87–131. [Google Scholar] [CrossRef]
- Quijano-Guerta, C.; Kirk, G.J.D.; Portugal, A.M.; Bartolome, V.I.; McLaren, G.C. Tolerance of rice germplasm to zinc deficiency. Field Crop. Res. 2002, 76, 123–130. [Google Scholar] [CrossRef]
- Bhandari, A.L.; Ladha, J.K.; Pathak, H.; Padre, A.T.; Dawe, D.; Gupta, R.K. Yield and Soil Nutrient Changes in a Long-Term Rice-Wheat Rotation in India. Soil Sci. Soc. Am. J. 2002, 66, 162–170. [Google Scholar] [CrossRef]
- Bhutta, Z.A.; Haider, B.A. Maternal micronutrient deficiencies in developing countries. Lancet 2008, 371, 186–187. [Google Scholar] [CrossRef]
- Pandey, V.L.; Mahendra Dev, S.; Jayachandran, U. Impact of agricultural interventions on the nutritional status in South Asia: A review. Food Policy 2016, 62, 28–40. [Google Scholar] [CrossRef] [Green Version]
- World Health Organization. Vitamin and mineral requirements in human nutrition: 10. Selenium. In Vitamin and Mineral Requirements in Human Nutrition; WHO: Geneva, Switzerland, 2004. [Google Scholar]
- World Health Organization. WHOGuideline: Use of Multiple Micronutrient Powders for Home Fortification of Foods Consumed by Infants and Children 6–23 Months of Age; World Health Organization: Geneva, Switzerland, 2011. [Google Scholar]
- Sachdev, H.P.S. Low birth weight in South Asia. Int. J. Diabetes Dev. Ctries. 2001, 21, 13–31. [Google Scholar]
- Swaminathan, S.; Hemalatha, R.; Pandey, A.; Kassebaum, N.J.; Laxmaiah, A.; Longvah, T.; Lodha, R.; Ramji, S.; Kumar, G.A.; Afshin, A.; et al. The burden of child and maternal malnutrition and trends in its indicators in the states of India: The Global Burden of Disease Study 1990–2017. Lancet Child Adolesc. Health 2019, 3, 855–870. [Google Scholar] [CrossRef] [Green Version]
- Alloway, B.J. Soil factors associated with zinc deficiency in crops and humans. Environ. Geochem. Health 2009, 31, 537–548. [Google Scholar] [CrossRef] [PubMed]
- Yadava, D.K.; Choudhury, P.R.; Hossain, F.; Kumar, D. Biofortified Varieties: Sustainable Way to Alleviate Malnutrition, 1st ed.; Indian Council of Agricultural Research: New Delhi, India, 2017; pp. 1–34.
- Mayer, J.E.; Pfeiffer, W.H.; Beyer, P. Biofortified crops to alleviate micronutrient malnutrition. Curr. Opin. Plant Biol. 2008, 11, 166–170. [Google Scholar] [CrossRef] [PubMed] [Green Version]
- Shukla, A.K.; Tiwari, P.K.; Pakhare, A.; Prakash, C. Zinc and iron in soil, plant, animal and human health. Indian J. Fertil 2016, 12, 133–149. [Google Scholar]
- Shahane, A.A.; Shivay, Y.S.; Prasanna, R.; Kumar, D. Nutrient removal by rice–wheat cropping system as influenced by crop establishment techniques and fertilization options in conjunction with microbial inoculation. Sci. Rep. 2020, 10, 21944. [Google Scholar] [CrossRef]
- Duncan, A.J.; Samaddar, A.; Blümmel, M. Rice and wheat straw fodder trading in India: Possible lessons for rice and wheat improvement. Field Crop. Res. 2020, 246, 107680. [Google Scholar] [CrossRef]
- Zaman, M.; Di, H.J.; Sakamoto, K.; Goto, S.; Hayashi, H.; Inubushi, K. Effects of sewage sludge compost and chemical fertilizer application on microbial biomass and N mineralization rates. Soil Sci. Plant Nutr. 2002, 48, 195–201. [Google Scholar] [CrossRef]
- Zaman, M.; Matsushima, M.; Chang, S.X.; Inubushi, K.; Nguyen, L.; Goto, S.; Kaneko, F.; Yoneyama, T. Nitrogen mineralization, N2O production and soil microbiological properties as affected by long-term applications of sewage sludge composts. Biol. Fertil. Soils 2004, 40, 101–109. [Google Scholar]
- Jamil, M.; Qasim, M.; Zia, M.S. Utilization of Pressmud as Organic Amendment to Improve Physico-Chemical. J. Chem. Soc. Pak 2008, 30, 577–583. [Google Scholar]
- Rasool, R.; Kukal, S.S.; Hira, G.S. Soil organic carbon and physical properties as affected by long-term application of FYM and inorganic fertilizers in maize–wheat system. Soil Tillage Res. 2008, 101, 31–36. [Google Scholar] [CrossRef]
- Dotaniya, M.L.; Datta, S.C.; Biswas, D.R.; Dotaniya, C.K.; Meena, B.L.; Rajendiran, S.; Regar, K.L.; Lata, M. Use of sugarcane industrial by-products for improving sugarcane productivity and soil health. Int. J. Recycl. Org. Waste Agric. 2016, 5, 185–194. [Google Scholar] [CrossRef] [Green Version]
- Kumar, S.; Meena, R.S.; Jinger, D.; Jatav, H.S.; Banjara, T. Use of pressmud compost for improving crop productivity and soil health. Int. J. Chem. Stud. 2017, 5, 384–389. [Google Scholar]
- Rangaraj, T.; Somasundaram, E.M.; Amanullah, M.; Thirumurugan, V.; Ramesh, S.; Ravi, S. Effect of Agro-industrial wastes on soil properties and yield of irrigated finger millet (Eleusine coracana L. Gaertn) in coastal soil. Res. J. Agric. Biol. Sci. 2007, 3, 153–156. [Google Scholar]
- Yu, Y.-Y.; Li, S.-M.; Qiu, J.-P.; Li, J.-G.; Luo, Y.-M.; Guo, J.-H. Combination of agricultural waste compost and biofertilizer improves yield and enhances the sustainability of a pepper field. J. Plant Nutr. Soil Sci. 2019, 182, 560–569. [Google Scholar] [CrossRef]
- Nasef, M.A.; Shaban, K.A.; El-Hamid, A.; Amal, F. Effect of Compost, Compost Tea and Bio-Fertilizer Application on Some Chemical Soil Properties and Rice Productivity under Saline Soil Condition. J. Agric. Chem. Biotechnol. 2009, 34, 2609–2623. [Google Scholar] [CrossRef]
- Singh, A.; Shivay, Y.S. Effect of summer green manuring crops and zinc fertilizer sources on productivity, Zn-uptake and economics of basmati rice. J. Plant Nutr. 2016, 39, 204–218. [Google Scholar] [CrossRef]
- Singh, F.; Kumar, R.; Pal, S. Integrated nutrient management in rice-wheat cropping system for sustainable productivity. J. Indian Soc. Soil Sci. 2008, 56, 205–208. [Google Scholar]
- Jilani, G.; Akram, A.; Ali, R.M.; Hafeez, F.Y.; Shamsi, I.H.; Chaudhry, A.N.; Chaudhry, A.G. Enhancing crop growth, nutrients availability, economics and beneficial rhizosphere microflora through organic and biofertilizers. Ann. Microbiol. 2007, 57, 177–184. [Google Scholar] [CrossRef]
- Pradhan, S.N.; Ghosh, A.K.; Nema, A.K.; Ram, S.; Pal, Y. Changes in soil phosphorus forms in a long-term cropping system as influenced by fertilization and tillage. Arch. Agron. Soil Sci. 2020, 67, 822–835. [Google Scholar] [CrossRef]
- Black, I.; Walkley, A. Estimation of soil organic carbon by the chromic acid titration method. Soil Sci. 1934, 37, 29–38. [Google Scholar]
- Subbiah, B.V.; Asija, G.L. A rapid procedure for estimation of available nitrogen in soils. Curr. Sci. 1956, 25, 259–260. [Google Scholar]
- Olsen, S.R.; Cole, C.V.; Watandbe, F.; Dean, L. Estimation of Available Phosphorus in Soil by Extraction with sodium Bicarbonate. J. Chem. Inf. Model. 1954, 939, 3–7. [Google Scholar]
- Jackson, M.L. Soil Chemical Analysis. J. Agric. Food Chem. 1959, 7, 138. [Google Scholar] [CrossRef]
- Blake, G. Bulk density. In Methods of Soil Analysis, Part 1. Physical and Mineralogical Properties, Including Statistics of Measurement and Sampling; Black, C.A., Ed.; American Society of Agronomy: Madison, WI, USA, 1965. [Google Scholar]
- Monasterio, I.; Graham, R.D. Breeding for trace minerals in wheat. Food Nutr. Bull. 2000, 21, 392–396. [Google Scholar] [CrossRef]
- Maganti, S.; Swaminathan, R.; Parida, A. Variation in iron and zinc content in traditional rice genotypes. Agric. Res. 2020, 9, 316–328. [Google Scholar] [CrossRef]
- Lindsay, W.L.; Norvell, W.A. Development of a DTPA soil test for zinc, iron, manganese, and copper. Soil Sci. Soc. Am. J. 1978, 42, 421–428. [Google Scholar] [CrossRef]
- Atlas, R.M. The Handbook of Microbiological Media for the Examination of Food; CRC Press: Boca Raton, FL, USA, 2006; ISBN 0429124155. [Google Scholar]
- Gomez, K.A.; Gomez, A.A.; Gomez, K.A. Two-Factor Experiments. In Statistical Procedures for Agricultural Research; John Wiley & Sons: Hoboken, NJ, USA, 1984; ISBN 9780471870920. [Google Scholar]
- Rout, G.R.; Sahoo, S. Role of Iron in Plant Growth and Metabolism. Rev. Agric. Sci. 2015, 3, 1–24. [Google Scholar] [CrossRef] [Green Version]
- Ali, S.; Shah, A.; Arif, M.; Miraj, G.; Ali, I.; Sajjad, M.; Khan, F.M.Y.; Khan, N.M. Enhancement of wheat grain yield and yield components through foliar application of Zinc and Boron. Sarhad J. Agric. 2009, 25, 15–19. [Google Scholar]
- Lu, B.-R.; Snow, A.A. Gene flow from genetically modified rice and its environmental consequences. Bioscience 2005, 55, 669–678. [Google Scholar] [CrossRef] [Green Version]
- Yadav, D.; Shivay, Y.S.; Singh, Y.V.; Sharma, V.K.; Bhatia, A. Enhancing nutrient translocation, yields and water productivity of wheat under rice–wheat cropping system through zinc nutrition and residual effect of green manuring. J. Plant Nutr. 2020, 43, 2845–2856. [Google Scholar] [CrossRef]
- Calderini, D.F.; Reynolds, M.P.; Slafer, G.A. Source–sink effects on grain weight of bread wheat, durum wheat, and triticale at different locations. Aust. J. Agric. Res. 2006, 57, 227–233. [Google Scholar] [CrossRef]
- Rana, A.; Saharan, B.; Nain, L.; Prasanna, R.; Shivay, Y.S. Enhancing micronutrient uptake and yield of wheat through bacterial PGPR consortia. Soil Sci. Plant Nutr. 2012, 58, 573–582. [Google Scholar] [CrossRef]
- Kumar, S.; Meena, R.S.; Singh, R.K.; Munir, T.M.; Datta, R.; Danish, S.; Yadav, G.S.; Kumar, S. Soil microbial and nutrient dynamics under different sowings environment of Indian mustard (Brassica juncea L.) in rice based cropping system. Sci. Rep. 2021, 11, 5289. [Google Scholar] [CrossRef]
- Shahane, A.A.; Shivay, Y.S.; Prasanna, R. Enhancing phosphorus and iron nutrition of wheat through crop establishment techniques and microbial inoculations in conjunction with fertilization. Soil Sci. Plant Nutr. 2020, 66, 763–771. [Google Scholar] [CrossRef]
- Dimkpa, C. Microbial siderophores: Production, detection and application in agriculture and environment. Endocytobiosis Cell Res. 2016, 27, 7–16. [Google Scholar]
- Rengel, Z.; Graham, R.D. Importance of seed Zn content for wheat growth on Zn-deficient soil. Plant Soil 1995, 173, 259–266. [Google Scholar] [CrossRef]
- Erdal, I.; Yilmaz, A.; Taban, S.; Eker, S.; Torun, B.; Cakmak, I. Phytic acid and phosphorus concentrations in seeds of wheat cultivars grown with and without zinc fertilization. J. Plant Nutr. 2002, 25, 113–127. [Google Scholar] [CrossRef]
- Wei, Y.; Shohag, M.J.I.; Wang, Y.; Lu, L.; Wu, C.; Yang, X. Effect of zinc sulfate fortification in germinated brown rice on seed zinc concentration, bioavailability, and seed germination. J. Agric. Food Chem. 2012, 60, 1871–1879. [Google Scholar] [CrossRef]
- Shuman, L.M.; Dudka, S.; Das, K. Zinc forms and plant availability in a compost amended soil. Water. Air. Soil Pollut. 2001, 128, 1–11. [Google Scholar] [CrossRef]
- Sarwar, G.; Hussain, N.; Mujeeb, F.; Schmeisky, H.; Hassan, G. Biocompost application for the improvement of soil characteristics and dry matter yield of Lolium perenne (Grass). Asian J. Plant Sci. 2003, 2, 237–241. [Google Scholar] [CrossRef]
- Nadim, M.A.; Awan, I.U.; Baloch, M.S.; Khan, E.A.; Naveed, K.; Khan, M.A. Response of wheat (Triticum aestivum L.) to different micronutrients and their application methods. J. Anim. Plant Sci. 2012, 22, 113–119. [Google Scholar]
- Govindaraj, M.; Kannan, P.; Arunachalam, P. Implication of micronutrients in agriculture and health with special reference to iron and zinc. Int. J. Agric. Manag. Dev. 2011, 1, 207–220. [Google Scholar]
- Haslett, B.S.; Reid, R.J.; Rengel, Z. Zinc mobility in wheat: Uptake and distribution of zinc applied to leaves or roots. Ann. Bot. 2001, 87, 379–386. [Google Scholar] [CrossRef] [Green Version]
- Feil, B.; Moser, S.B.; Jampatong, S.; Stamp, P. Mineral composition of the grains of tropical maize varieties as affected by pre-anthesis drought and rate of nitrogen fertilization. Crop Sci. 2005, 45, 516–523. [Google Scholar] [CrossRef]
- Sharma, A.; Shankhdhar, D.; Shankhdhar, S.C. Enhancing grain iron content of rice by the application of plant growth promoting rhizobacteria. Plant Soil Environ. 2013, 59, 89–94. [Google Scholar] [CrossRef] [Green Version]
- Takkar, P.N.; Shukla, A.K. Management of soil fertility: Micronutrients. InState of Indian Agriculture–Soil; Pathak, H., Sanyal, S.K., Takkar, P.N., Eds.; NAAS: New Delhi, India, 2015; pp. 121–152. [Google Scholar]
- Jatav, S.S.; Singh, S.K.; Singh, Y. Effect of Zinc Application Methods on Yield and Zinc Bio-fortification in Hybrid Rice (Oryza sativa L.). J. Indian Soc. Soil Sci. 2019, 67, 468–471. [Google Scholar] [CrossRef]
- Grusak, M.A.; Pearson, J.N.; Marentes, E. The physiology of micronutrient homeostasis in field crops. Field Crop. Res. 1999, 60, 41–56. [Google Scholar] [CrossRef]
- Curie, C.; Cassin, G.; Couch, D.; Divol, F.; Higuchi, K.; Le Jean, M.; Misson, J.; Schikora, A.; Czernic, P.; Mari, S. Metal movement within the plant: Contribution of nicotianamine and yellow stripe 1-like transporters. Ann. Bot. 2009, 103, 1–11. [Google Scholar] [CrossRef] [Green Version]
- Yilmaz, A.; Ekiz, H.; Gültekin, I.; Torun, B.; Barut, H.; Karanlik, S.; Cakmak, I. Effect of seed zinc content on grain yield and zinc concentration of wheat grown in zinc-deficient calcareous soils. J. Plant Nutr. 1998, 21, 2257–2264. [Google Scholar] [CrossRef]
- Kalayci, M.; Torun, B.; Eker, S.; Aydin, M.; Ozturk, L.; Cakmak, I. Grain yield, zinc efficiency and zinc concentration of wheat cultivars grown in a zinc-deficient calcareous soil in field and greenhouse. Field Crop. Res. 1999, 63, 87–98. [Google Scholar] [CrossRef]
- Cakmak, I.; Marschner, H. Mechanism of phosphorus-induced zinc deficiency in cotton. I. Zinc deficiency-enhanced uptake rate of phosphorus. Physiol. Plant. 1986, 68, 483–490. [Google Scholar] [CrossRef]
- Kamrani, R.; Ardalan, M.M. A study on the growth and concentration of Zn, Mn and Na by two Wheat cultivars in response to application of Zn in natural saline soils. Int. Res. J. Appl. Basic Sci. 2013, 7, 1025–1030. [Google Scholar]
- Dagistan, E.; Akcaoz, H.; Demirtas, B.; Yilmaz, Y. Energy usage and benefit-cost analysis of cotton production in Turkey. Afr. J. Agric. Res. 2009, 4, 599–604. [Google Scholar]
- Prasad, R.; Shivay, Y.S.; Kumar, D. Interactions of zinc with other nutrients in soils and plants—A Review. Indian J. Fertil. 2016, 12, 16–26. [Google Scholar]
- Mandal, B.; Mandal, L.N. Effect of phosphorus application on transformation of zinc fraction in soil and on the zinc nutrition of lowland rice. Plant Soil 1990, 121, 115–123. [Google Scholar] [CrossRef]
- Debnath, S.; Pachauri, S.P.; Srivastava, P.C. Improving use efficiency of applied phosphorus fertilizer by zinc fertilization in Basmati rice-wheat cropping system. Indian J. Agric. Res. 2015, 49, 414–420. [Google Scholar] [CrossRef] [Green Version]
- Alloway, B. Zinc in Soils and Crop Nutrition. Areas of the World with Zinc Deficiency Problems; International Zinc Association: Brussels, Belgium, 2004; pp. 1–116. [Google Scholar]
- Ljubičić, N.; Popović, V.; Ćirić, V.; Kostić, M.; Ivošević, B.; Popović, D.; Pandžić, M.; El Musafah, S.; Janković, S. Multivariate interaction analysis of winter wheat grown in environment of limited soil conditions. Plants 2021, 10, 604. [Google Scholar] [CrossRef]
Figure 1.
Location of experimental site.

Figure 2.
Effect of nutrient source and compost combination on two years Fe content in wheat grain and straw.
Figure 2.
Effect of nutrient source and compost combination on two years Fe content in wheat grain and straw.

Figure 3.
Effect of nutrient source and compost combination on two years Zn content in wheat grain and straw.
Figure 3.
Effect of nutrient source and compost combination on two years Zn content in wheat grain and straw.

Figure 4.
Effect of nutrient source and compost combination on two years Fe content in rice grain and straw.
Figure 4.
Effect of nutrient source and compost combination on two years Fe content in rice grain and straw.

Figure 5.
Effect of nutrient source and compost combination on two years Zn content in rice grain and straw.
Figure 5.
Effect of nutrient source and compost combination on two years Zn content in rice grain and straw.

Figure 6.
Effect of nutrient source and compost combination on two years total Fe and Zn uptake by wheat crop.
Figure 6.
Effect of nutrient source and compost combination on two years total Fe and Zn uptake by wheat crop.

Figure 7.
Effect of nutrient source and compost combination on two years’ total Fe and Zn uptake by rice crop.
Figure 7.
Effect of nutrient source and compost combination on two years’ total Fe and Zn uptake by rice crop.

Figure 8.
Correlation and regression between average grain yield of wheat and available Fe and Zn content in soil during both years of study: (a) Correlation and regression between Fe content in soil and grain yield of wheat in 2018 and 2019; (b) Correlation and regression between Zn content in soil and grain yield of wheat in 2018 and 2019.

Figure 9.
Correlation and regression between average grain yield of rice and available Fe and Zn content in soil during both the year of study: (a) Correlation and regression between Fe content in soil and grain yield of rice in 2018 and 2019; (b) Correlation and regression between Zn content in soil and grain yield of rice in 2018 and 2019.


Table 1.
Effect of nutrient source and compost combination on two years grain, straw, and biological yield of wheat and rice production systems.
Table 1.
Effect of nutrient source and compost combination on two years grain, straw, and biological yield of wheat and rice production systems.
| Wheat | Rice | |||||||||||
|---|---|---|---|---|---|---|---|---|---|---|---|---|
| Treatment | Grain Yield (Mg ha−1) | Straw Yield (Mg ha−1) | Biological Yield (Mg ha−1) | Grain Yield (Mg ha−1) | Straw Yield (Mg ha−1) | Biological Yield (Mg ha−1) | ||||||
| 2018 | 2019 | 2018 | 2019 | 2018 | 2019 | 2018 | 2019 | 2018 | 2019 | 2018 | 2019 | |
| Mainplots | ||||||||||||
| Nutrient sources | ||||||||||||
| N0 | 3.10 | 3.03 | 4.64 | 3.87 | 7.75 | 6.91 | 2.97 | 2.92 | 4.47 | 4.86 | 7.45 | 7.78 |
| N1 | 4.41 | 4.15 | 5.93 | 4.93 | 10.34 | 9.07 | 3.65 | 3.42 | 5.42 | 5.46 | 9.07 | 8.88 |
| N2 | 4.87 | 4.54 | 6.36 | 5.31 | 11.23 | 9.85 | 3.87 | 3.58 | 5.71 | 5.64 | 9.58 | 9.22 |
| N3 | 5.18 | 4.80 | 6.62 | 5.55 | 11.80 | 10.35 | 4.28 | 3.89 | 6.28 | 6.01 | 10.55 | 9.90 |
| Sem± | 0.11 | 0.09 | 0.10 | 0.08 | 0.21 | 0.17 | 0.05 | 0.04 | 0.07 | 0.05 | 0.13 | 0.09 |
| CD (p = 0.05) | 0.26 | 0.22 | 0.25 | 0.21 | 0.51 | 0.43 | 0.13 | 0.10 | 0.18 | 0.12 | 0.31 | 0.22 |
| Sub-plots | ||||||||||||
| Compost combinations | ||||||||||||
| B1C3 | 5.06 | 4.70 | 6.56 | 5.45 | 11.62 | 10.14 | 4.10 | 3.76 | 6.03 | 5.85 | 10.13 | 9.61 |
| B1C2 | 4.85 | 4.52 | 6.35 | 5.28 | 11.19 | 9.80 | 3.99 | 3.68 | 5.88 | 5.76 | 9.87 | 9.44 |
| B1C1 | 4.66 | 4.36 | 6.15 | 5.13 | 10.81 | 9.48 | 3.87 | 3.59 | 5.72 | 5.66 | 9.60 | 9.25 |
| B2C3 | 4.63 | 4.33 | 6.13 | 5.10 | 10.76 | 9.43 | 3.51 | 3.32 | 5.22 | 5.34 | 8.73 | 8.66 |
| B2C2 | 4.46 | 4.18 | 5.95 | 4.96 | 10.41 | 9.15 | 3.41 | 3.23 | 5.08 | 5.23 | 8.49 | 8.47 |
| B2C1 | 4.28 | 4.03 | 5.76 | 4.82 | 10.04 | 8.85 | 3.30 | 3.14 | 4.93 | 5.13 | 8.24 | 8.27 |
| B3C3 | 4.09 | 3.87 | 5.58 | 4.70 | 9.67 | 8.57 | 3.76 | 3.51 | 5.57 | 5.55 | 9.33 | 9.07 |
| B3C2 | 3.88 | 3.69 | 5.36 | 4.50 | 9.23 | 8.19 | 3.66 | 3.43 | 5.42 | 5.47 | 9.08 | 8.90 |
| B3C1 | 3.64 | 3.49 | 5.13 | 4.31 | 8.78 | 7.80 | 3.62 | 3.41 | 5.37 | 5.44 | 9.00 | 8.84 |
| Sem± | 0.08 | 0.07 | 0.08 | 0.07 | 0.16 | 0.13 | 0.04 | 0.03 | 0.06 | 0.04 | 0.10 | 0.07 |
| CD (p = 0.05) | 0.16 | 0.14 | 0.16 | 0.13 | 0.32 | 0.27 | 0.08 | 0.06 | 0.12 | 0.07 | 0.20 | 0.14 |
N0 = control; N1 = 112.5 kg N + 45 kg P + 45 kg K; N2 = 150 kg N + 60 kg P + 60 kg K; andN3 = 150 kg N + 60 kg P + 60 kg K+ 26.31 kg FeO4.7 H2 O +15.15 kg ZnO4.H2O. B1C1 = Carpet waste and Pleurotussajor-caju; B1C2 = Carpet waste and Azotobacter chroococcum; B1C3 = Carpet waste and Trichoderma viride; B2C1 = Pressmud and Pleurotussajor-caju; B2C2 = Pressmud and Azotobacter chroococcum; B2C3 = Pressmud and Trichoderma viride; B3C1 = Bagasse and Pleurotussajor-caju; B3C2 = Bagasse and Azotobacterchroococcum; B3C3 = Bagasse and Trichoderma viride.
Table 2.
Interaction effect of nutrient source and compost combination on two years grain yield of wheat.
Table 2.
Interaction effect of nutrient source and compost combination on two years grain yield of wheat.
| Sub-Plot (Compost Combinations) | MainPlot (Nutrient Level) (Mg ha−1) | |||
|---|---|---|---|---|
| N0 | N1 | N2 | N3 | |
| B1C3 | 3.41 | 5.11 | 5.30 | 5.69 |
| B1C2 | 3.25 | 4.84 | 5.10 | 5.55 |
| B1C1 | 3.06 | 4.74 | 4.91 | 5.33 |
| B2C3 | 3.29 | 4.44 | 4.97 | 5.21 |
| B2C2 | 3.10 | 4.36 | 4.83 | 5.00 |
| B2C1 | 3.03 | 4.17 | 4.53 | 4.89 |
| B3C3 | 3.01 | 3.76 | 4.42 | 4.74 |
| B3C2 | 2.78 | 3.63 | 4.23 | 4.49 |
| B3C1 | 2.69 | 3.47 | 4.05 | 4.06 |
| Sem± | 0.08 | |||
| CD (p = 0.05) | 0.21 | 0.29 | ||
Table 3.
Interaction effect of nutrient source and compost combination on two years grain yield of rice.
Table 3.
Interaction effect of nutrient source and compost combination on two years grain yield of rice.
| Sub-Plot (Compost Combinations) | MainPlot (Nutrient Level) (Mg ha−1) | |||
|---|---|---|---|---|
| N0 | N1 | N2 | N3 | |
| B1C3 | 3.15 | 4.00 | 4.09 | 4.47 |
| B1C2 | 3.07 | 3.87 | 4.00 | 4.40 |
| B1C1 | 3.00 | 3.82 | 3.89 | 4.23 |
| B2C3 | 2.91 | 3.21 | 3.56 | 4.01 |
| B2C2 | 2.76 | 3.18 | 3.47 | 3.88 |
| B2C1 | 2.73 | 3.15 | 3.40 | 3.63 |
| B3C3 | 3.04 | 3.61 | 3.80 | 4.10 |
| B3C2 | 2.95 | 3.50 | 3.66 | 4.07 |
| B3C1 | 2.90 | 3.52 | 3.65 | 3.98 |
| Sem± | 0.04 | |||
| CD (p = 0.05) | 0.10 | 0.14 | ||
Table 4.
Effect of nutrient source and compost combination on two years available Fe and Zn content in soil after harvesting wheat and rice.
Table 4.
Effect of nutrient source and compost combination on two years available Fe and Zn content in soil after harvesting wheat and rice.
| After Harvest of Wheat | After Harvest of Rice | |||||||
|---|---|---|---|---|---|---|---|---|
| Treatment | Available Fe (ppm) | Available Zn (ppm) | Available Fe (ppm) | Available Zn (ppm) | ||||
| 2018 | 2019 | 2018 | 2019 | 2018 | 2019 | 2018 | 2019 | |
| Mainplots | ||||||||
| Nutrient sources | ||||||||
| N0 | 10.76 | 9.21 | 0.53 | 0.50 | 10.62 | 10.22 | 0.59 | 0.57 |
| N1 | 12.44 | 11.71 | 0.56 | 0.53 | 12.97 | 12.67 | 0.61 | 0.59 |
| N2 | 13.74 | 12.59 | 0.57 | 0.54 | 13.71 | 13.10 | 0.63 | 0.60 |
| N3 | 14.62 | 13.18 | 0.58 | 0.55 | 15.11 | 13.95 | 0.64 | 0.61 |
| Sem± | 0.30 | 0.20 | 0.02 | 0.02 | 0.18 | 0.11 | 0.01 | 0.01 |
| CD (p = 0.05) | 0.73 | 0.49 | NS | NS | 0.45 | 0.28 | NS | NS |
| Sub-plots | ||||||||
| Compost combinations | ||||||||
| B1C3 | 14.26 | 12.94 | 0.58 | 0.55 | 14.49 | 13.32 | 0.63 | 0.60 |
| B1C2 | 13.67 | 12.54 | 0.57 | 0.54 | 14.13 | 13.11 | 0.63 | 0.60 |
| B1C1 | 13.14 | 12.18 | 0.56 | 0.53 | 13.73 | 12.87 | 0.63 | 0.60 |
| B2C3 | 13.05 | 12.12 | 0.57 | 0.54 | 12.48 | 12.13 | 0.61 | 0.59 |
| B2C2 | 12.57 | 11.80 | 0.55 | 0.52 | 12.13 | 11.88 | 0.61 | 0.59 |
| B2C1 | 12.07 | 11.46 | 0.54 | 0.51 | 11.76 | 11.64 | 0.60 | 0.58 |
| B3C3 | 11.53 | 11.09 | 0.56 | 0.53 | 13.34 | 12.64 | 0.62 | 0.60 |
| B3C2 | 10.93 | 10.69 | 0.55 | 0.52 | 12.98 | 12.42 | 0.62 | 0.59 |
| B3C1 | 10.27 | 10.24 | 0.57 | 0.54 | 12.86 | 12.36 | 0.62 | 0.59 |
| Sem± | 0.23 | 0.16 | 0.01 | 0.01 | 0.15 | 0.09 | 0.01 | 0.01 |
| CD (p = 0.05) | 0.46 | 0.31 | NS | NS | 0.29 | 0.18 | NS | NS |
Table 5.
Effect of nutrient source and compost combination on two years Fe and Zn uptake by wheat crop.
Table 5.
Effect of nutrient source and compost combination on two years Fe and Zn uptake by wheat crop.
| Wheat | ||||||||
|---|---|---|---|---|---|---|---|---|
| Treatment | Fe Uptake in Grain (kg ha−1) | Fe Uptake in Straw (kg ha−1) | Zn Uptake in Grain (kg ha−1) | Zn Uptake in Straw (kg ha−1) | ||||
| 2018 | 2019 | 2018 | 2019 | 2018 | 2019 | 2018 | 2019 | |
| Mainplots | ||||||||
| Nutrient sources | ||||||||
| N0 | 0.12 | 0.11 | 0.16 | 0.12 | 0.08 | 0.08 | 0.10 | 0.10 |
| N1 | 0.20 | 0.17 | 0.30 | 0.23 | 0.13 | 0.12 | 0.15 | 0.14 |
| N2 | 0.25 | 0.22 | 0.36 | 0.28 | 0.16 | 0.14 | 0.18 | 0.17 |
| N3 | 0.29 | 0.26 | 0.41 | 0.32 | 0.19 | 0.17 | 0.21 | 0.19 |
| Sem± | 0.01 | 0.01 | 0.02 | 0.01 | 0.008 | 0.007 | 0.01 | 0.01 |
| CD (p = 0.05) | 0.03 | 0.03 | 0.04 | 0.03 | 0.019 | 0.017 | 0.02 | 0.02 |
| Sub-plots | ||||||||
| Compost combinations | ||||||||
| B1C3 | 0.29 | 0.26 | 0.41 | 0.32 | 0.19 | 0.17 | 0.22 | 0.19 |
| B1C2 | 0.26 | 0.24 | 0.37 | 0.29 | 0.17 | 0.16 | 0.20 | 0.18 |
| B1C1 | 0.24 | 0.22 | 0.35 | 0.27 | 0.16 | 0.14 | 0.18 | 0.16 |
| B2C3 | 0.24 | 0.21 | 0.34 | 0.26 | 0.16 | 0.14 | 0.18 | 0.16 |
| B2C2 | 0.22 | 0.19 | 0.31 | 0.24 | 0.14 | 0.13 | 0.16 | 0.15 |
| B2C1 | 0.20 | 0.18 | 0.29 | 0.22 | 0.13 | 0.12 | 0.15 | 0.14 |
| B3C3 | 0.18 | 0.16 | 0.26 | 0.21 | 0.12 | 0.11 | 0.13 | 0.13 |
| B3C2 | 0.16 | 0.14 | 0.23 | 0.18 | 0.10 | 0.09 | 0.12 | 0.12 |
| B3C1 | 0.14 | 0.12 | 0.20 | 0.16 | 0.09 | 0.08 | 0.10 | 0.10 |
| Sem± | 0.01 | 0.01 | 0.01 | 0.01 | 0.007 | 0.006 | 0.01 | 0.01 |
| CD (p = 0.05) | 0.02 | 0.02 | 0.03 | 0.02 | 0.013 | 0.011 | 0.01 | 0.01 |
Table 6.
Effect of nutrient source and compost combination on two years Fe and Zn uptake by rice crop.
Table 6.
Effect of nutrient source and compost combination on two years Fe and Zn uptake by rice crop.
| Rice | ||||||||
|---|---|---|---|---|---|---|---|---|
| Treatment | Fe Uptake in Grain (kg ha−1) | Fe Uptake in Straw (kg ha−1) | Zn Uptake in Grain (kg ha−1) | Zn Uptake in Straw (kg ha−1) | ||||
| 2018 | 2019 | 2018 | 2019 | 2018 | 2019 | 2018 | 2019 | |
| Mainplots | ||||||||
| Nutrient sources | ||||||||
| N0 | 0.11 | 0.10 | 0.19 | 0.20 | 0.06 | 0.05 | 0.10 | 0.11 |
| N1 | 0.15 | 0.13 | 0.28 | 0.27 | 0.09 | 0.07 | 0.16 | 0.15 |
| N2 | 0.16 | 0.14 | 0.30 | 0.29 | 0.10 | 0.08 | 0.18 | 0.17 |
| N3 | 0.19 | 0.16 | 0.37 | 0.34 | 0.12 | 0.09 | 0.23 | 0.21 |
| Sem± | 0.003 | 0.002 | 0.008 | 0.006 | 0.002 | 0.002 | 0.006 | 0.004 |
| CD (p = 0.05) | 0.008 | 0.006 | 0.019 | 0.015 | 0.006 | 0.004 | 0.014 | 0.010 |
| Sub-plots | ||||||||
| Compost combinations | ||||||||
| B1C3 | 0.18 | 0.15 | 0.34 | 0.32 | 0.11 | 0.09 | 0.21 | 0.19 |
| B1C2 | 0.17 | 0.15 | 0.33 | 0.31 | 0.11 | 0.09 | 0.20 | 0.18 |
| B1C1 | 0.16 | 0.14 | 0.31 | 0.30 | 0.10 | 0.08 | 0.18 | 0.17 |
| B2C3 | 0.14 | 0.13 | 0.26 | 0.26 | 0.08 | 0.07 | 0.15 | 0.15 |
| B2C2 | 0.14 | 0.12 | 0.24 | 0.24 | 0.08 | 0.07 | 0.14 | 0.14 |
| B2C1 | 0.13 | 0.12 | 0.23 | 0.23 | 0.08 | 0.06 | 0.13 | 0.13 |
| B3C3 | 0.16 | 0.14 | 0.29 | 0.28 | 0.10 | 0.08 | 0.17 | 0.16 |
| B3C2 | 0.15 | 0.13 | 0.28 | 0.27 | 0.09 | 0.07 | 0.16 | 0.16 |
| B3C1 | 0.15 | 0.13 | 0.27 | 0.27 | 0.09 | 0.07 | 0.16 | 0.15 |
| Sem± | 0.003 | 0.002 | 0.006 | 0.005 | 0.002 | 0.001 | 0.005 | 0.004 |
| CD (p = 0.05) | 0.005 | 0.004 | 0.013 | 0.010 | 0.004 | 0.003 | 0.010 | 0.007 |
Table 7.
Interaction effects of nutrient levels and compost combination on total Fe uptake (kg ha−1) by wheat (pooled two years).
Table 7.
Interaction effects of nutrient levels and compost combination on total Fe uptake (kg ha−1) by wheat (pooled two years).
| Sub-Plot (Compost Combinations) | MainPlot (Nutrient Level) (kg ha−1) | |||
|---|---|---|---|---|
| N0 | N1 | N2 | N3 | |
| B1C3 | 0.32 | 0.67 | 0.72 | 0.84 |
| B1C2 | 0.29 | 0.59 | 0.66 | 0.79 |
| B1C1 | 0.25 | 0.56 | 0.61 | 0.74 |
| B2C3 | 0.30 | 0.48 | 0.62 | 0.69 |
| B2C2 | 0.26 | 0.46 | 0.58 | 0.63 |
| B2C1 | 0.25 | 0.42 | 0.50 | 0.60 |
| B3C3 | 0.25 | 0.32 | 0.48 | 0.56 |
| B3C2 | 0.21 | 0.30 | 0.43 | 0.49 |
| B3C1 | 0.19 | 0.27 | 0.39 | 0.39 |
| Sem± | 0.02 | |||
| CD (p = 0.05) | 0.06 | 0.08 | ||
Table 8.
Interaction effects of nutrient levels and compost combination on total Zn uptake (kg ha−1) by wheat (pooled two years).
Table 8.
Interaction effects of nutrient levels and compost combination on total Zn uptake (kg ha−1) by wheat (pooled two years).
| Sub-Plot (Compost Combinations) | MainPlot (Nutrient Level) (kg ha−1) | |||
|---|---|---|---|---|
| N0 | N1 | N2 | N3 | |
| B1C3 | 0.22 | 0.39 | 0.43 | 0.50 |
| B1C2 | 0.20 | 0.35 | 0.39 | 0.47 |
| B1C1 | 0.17 | 0.33 | 0.36 | 0.44 |
| B2C3 | 0.20 | 0.28 | 0.37 | 0.41 |
| B2C2 | 0.18 | 0.27 | 0.35 | 0.37 |
| B2C1 | 0.17 | 0.24 | 0.30 | 0.36 |
| B3C3 | 0.17 | 0.19 | 0.28 | 0.33 |
| B3C2 | 0.14 | 0.17 | 0.25 | 0.29 |
| B3C1 | 0.13 | 0.16 | 0.23 | 0.23 |
| Sem± | 0.01 | |||
| CD (p = 0.05) | 0.04 | 0.05 | ||
Table 9.
Interaction effects of nutrient levels and compost combination on total Fe uptake (kg ha−1) by rice (pooled two years).
Table 9.
Interaction effects of nutrient levels and compost combination on total Fe uptake (kg ha−1) by rice (pooled two years).
| Sub-Plot (Compost Combinations) | MainPlot (Nutrient Level) (kg ha−1) | |||
|---|---|---|---|---|
| N0 | N1 | N2 | N3 | |
| B1C3 | 0.34 | 0.51 | 0.53 | 0.62 |
| B1C2 | 0.32 | 0.48 | 0.51 | 0.60 |
| B1C1 | 0.31 | 0.47 | 0.48 | 0.56 |
| B2C3 | 0.29 | 0.35 | 0.41 | 0.51 |
| B2C2 | 0.27 | 0.34 | 0.40 | 0.48 |
| B2C1 | 0.27 | 0.34 | 0.39 | 0.43 |
| B3C3 | 0.32 | 0.42 | 0.46 | 0.53 |
| B3C2 | 0.30 | 0.40 | 0.44 | 0.52 |
| B3C1 | 0.29 | 0.41 | 0.43 | 0.50 |
| Sem± | 0.01 | |||
| CD (p = 0.05) | 0.02 | 0.03 | ||
Table 10.
Interaction effects of nutrient levels and compost combination on total Zn uptake (kg ha−1) by rice (pooled two years).
Table 10.
Interaction effects of nutrient levels and compost combination on total Zn uptake (kg ha−1) by rice (pooled two years).
| Sub-Plot (Compost Combinations) | MainPlot (Nutrient Level) (kg ha−1) | |||
|---|---|---|---|---|
| N0 | N1 | N2 | N3 | |
| B1C3 | 0.19 | 0.31 | 0.32 | 0.39 |
| B1C2 | 0.17 | 0.29 | 0.31 | 0.37 |
| B1C1 | 0.17 | 0.28 | 0.29 | 0.35 |
| B2C3 | 0.16 | 0.19 | 0.24 | 0.31 |
| B2C2 | 0.14 | 0.19 | 0.23 | 0.29 |
| B2C1 | 0.14 | 0.18 | 0.22 | 0.25 |
| B3C3 | 0.17 | 0.25 | 0.27 | 0.32 |
| B3C2 | 0.16 | 0.23 | 0.25 | 0.32 |
| B3C1 | 0.15 | 0.23 | 0.25 | 0.30 |
| Sem± | 0.01 | |||
| CD (p = 0.05) | 0.02 | 0.02 | ||
Table 11.
Nutrient contribution by soil, addition through fertilizers, and nutrient removal by crops and apparent nutrient balance sheet of wheat-rice production system during both years of study.
Table 11.
Nutrient contribution by soil, addition through fertilizers, and nutrient removal by crops and apparent nutrient balance sheet of wheat-rice production system during both years of study.
| Wheat–Rice Sequence | ||||||||
|---|---|---|---|---|---|---|---|---|
| Fe (kg ha−1) | Zn (kg ha−1) | |||||||
| Treatment | Soil Contribution | Addition | Removal | Balance | Soil Contribution | Addition | Removal | Balance |
| Mainplots | ||||||||
| Nutrient sources | ||||||||
| N0 | 33.73 | - | 1.12 | 32.61 | 1.27 | - | 0.67 | 1.04 |
| N1 | 33.73 | - | 1.73 | 32.00 | 1.27 | - | 1.01 | 0.70 |
| N2 | 33.73 | - | 2.01 | 31.72 | 1.27 | - | 1.19 | 0.52 |
| N3 | 33.73 | 5 | 2.33 | 36.40 | 1.27 | 5 | 1.40 | 5.31 |
| Sem± | - | - | 0.07 | 0.07 | - | - | 0.04 | 0.04 |
| CD (p = 0.05) | - | - | 0.16 | 0.16 | - | - | 0.10 | 0.10 |
| Sub-plots | ||||||||
| Compost combination | ||||||||
| B1C3 | 33.73 | 5.20 | 2.27 | 37.91 | 1.27 | 0.60 | 1.37 | 1.75 |
| B1C2 | 33.73 | 5.20 | 2.12 | 38.06 | 1.27 | 0.60 | 1.28 | 1.84 |
| B1C1 | 33.73 | 5.20 | 1.99 | 38.18 | 1.27 | 0.60 | 1.19 | 1.93 |
| B2C3 | 33.73 | 4.40 | 1.83 | 37.55 | 1.27 | 0.40 | 1.08 | 1.84 |
| B2C2 | 33.73 | 4.40 | 1.72 | 37.66 | 1.27 | 0.40 | 1.01 | 1.91 |
| B2C1 | 33.73 | 4.40 | 1.59 | 37.79 | 1.27 | 0.40 | 0.93 | 1.98 |
| B3C3 | 33.73 | 3.56 | 1.67 | 36.87 | 1.27 | 0.32 | 0.99 | 1.85 |
| B3C2 | 33.73 | 3.56 | 1.54 | 37.00 | 1.27 | 0.32 | 0.91 | 1.93 |
| B3C1 | 33.73 | 3.56 | 1.44 | 37.10 | 1.27 | 0.32 | 0.85 | 1.99 |
| Sem± | - | - | 0.05 | 0.05 | - | - | 0.03 | 0.03 |
| CD (p = 0.05) | - | - | 0.11 | 0.11 | - | - | 0.07 | 0.07 |
Publisher’s Note: MDPI stays neutral with regard to jurisdictional claims in published maps and institutional affiliations. |
© 2022 by the authors. Licensee MDPI, Basel, Switzerland. This article is an open access article distributed under the terms and conditions of the Creative Commons Attribution (CC BY) license (https://creativecommons.org/licenses/by/4.0/).
Share and Cite
MDPI and ACS Style
Pradhan, G.; Meena, R.S. Diversity in the Rice–Wheat System with Genetically Modified Zinc and Iron-Enriched Varieties to Achieve Nutritional Security. Sustainability 2022, 14, 9334. https://0-doi-org.brum.beds.ac.uk/10.3390/su14159334
AMA Style
Pradhan G, Meena RS. Diversity in the Rice–Wheat System with Genetically Modified Zinc and Iron-Enriched Varieties to Achieve Nutritional Security. Sustainability. 2022; 14(15):9334. https://0-doi-org.brum.beds.ac.uk/10.3390/su14159334
Chicago/Turabian StylePradhan, Gourisankar, and Ram Swaroop Meena. 2022. "Diversity in the Rice–Wheat System with Genetically Modified Zinc and Iron-Enriched Varieties to Achieve Nutritional Security" Sustainability 14, no. 15: 9334. https://0-doi-org.brum.beds.ac.uk/10.3390/su14159334
Note that from the first issue of 2016, this journal uses article numbers instead of page numbers. See further details here.