2. Small Business Competitiveness in the Context of Sustainable Management—A Literature Review
Competitiveness is a multi-aspect and multi-criterion concept. The literature on the subject considers competitiveness from various perspectives and in the context of various economic theories. Basically, it can be viewed from two perspectives [
9]:
As an attribute and the outcome of undertaken activities,
As a process, i.e., a series of planned and implemented activities (changes), occurring consecutively, mutually related and carried out in a specified period of time.
Competitiveness is regarded as a relative attribute, and its significance is determined by a specific type of relations between a given object and other objects within comparative properties; this comparison can refer to the adopted comparison standards [
10]. The concept of competitiveness is theoretical in character—it has no designates that can describe it directly, and its explanation requires decomposition, i.e., the identification of its measures [
9]. As a result, there are many sensu stricto and sensu largo definitions of competitiveness [
11]. For the purpose of this publication, the authors adopt a broad concept of competitiveness as “a company’s ability to compete with other economic entities in the way which ensures its survival on the markets and achievement of its development goals”. The authors want to stress that this definition of competitiveness gives attention to its time-related quantification—it does not only refer to “here and now”, i.e., a company’s survival on the market as a result of competing with other entities (a short-term approach) but also addresses the issue of a company’s long-term goals.
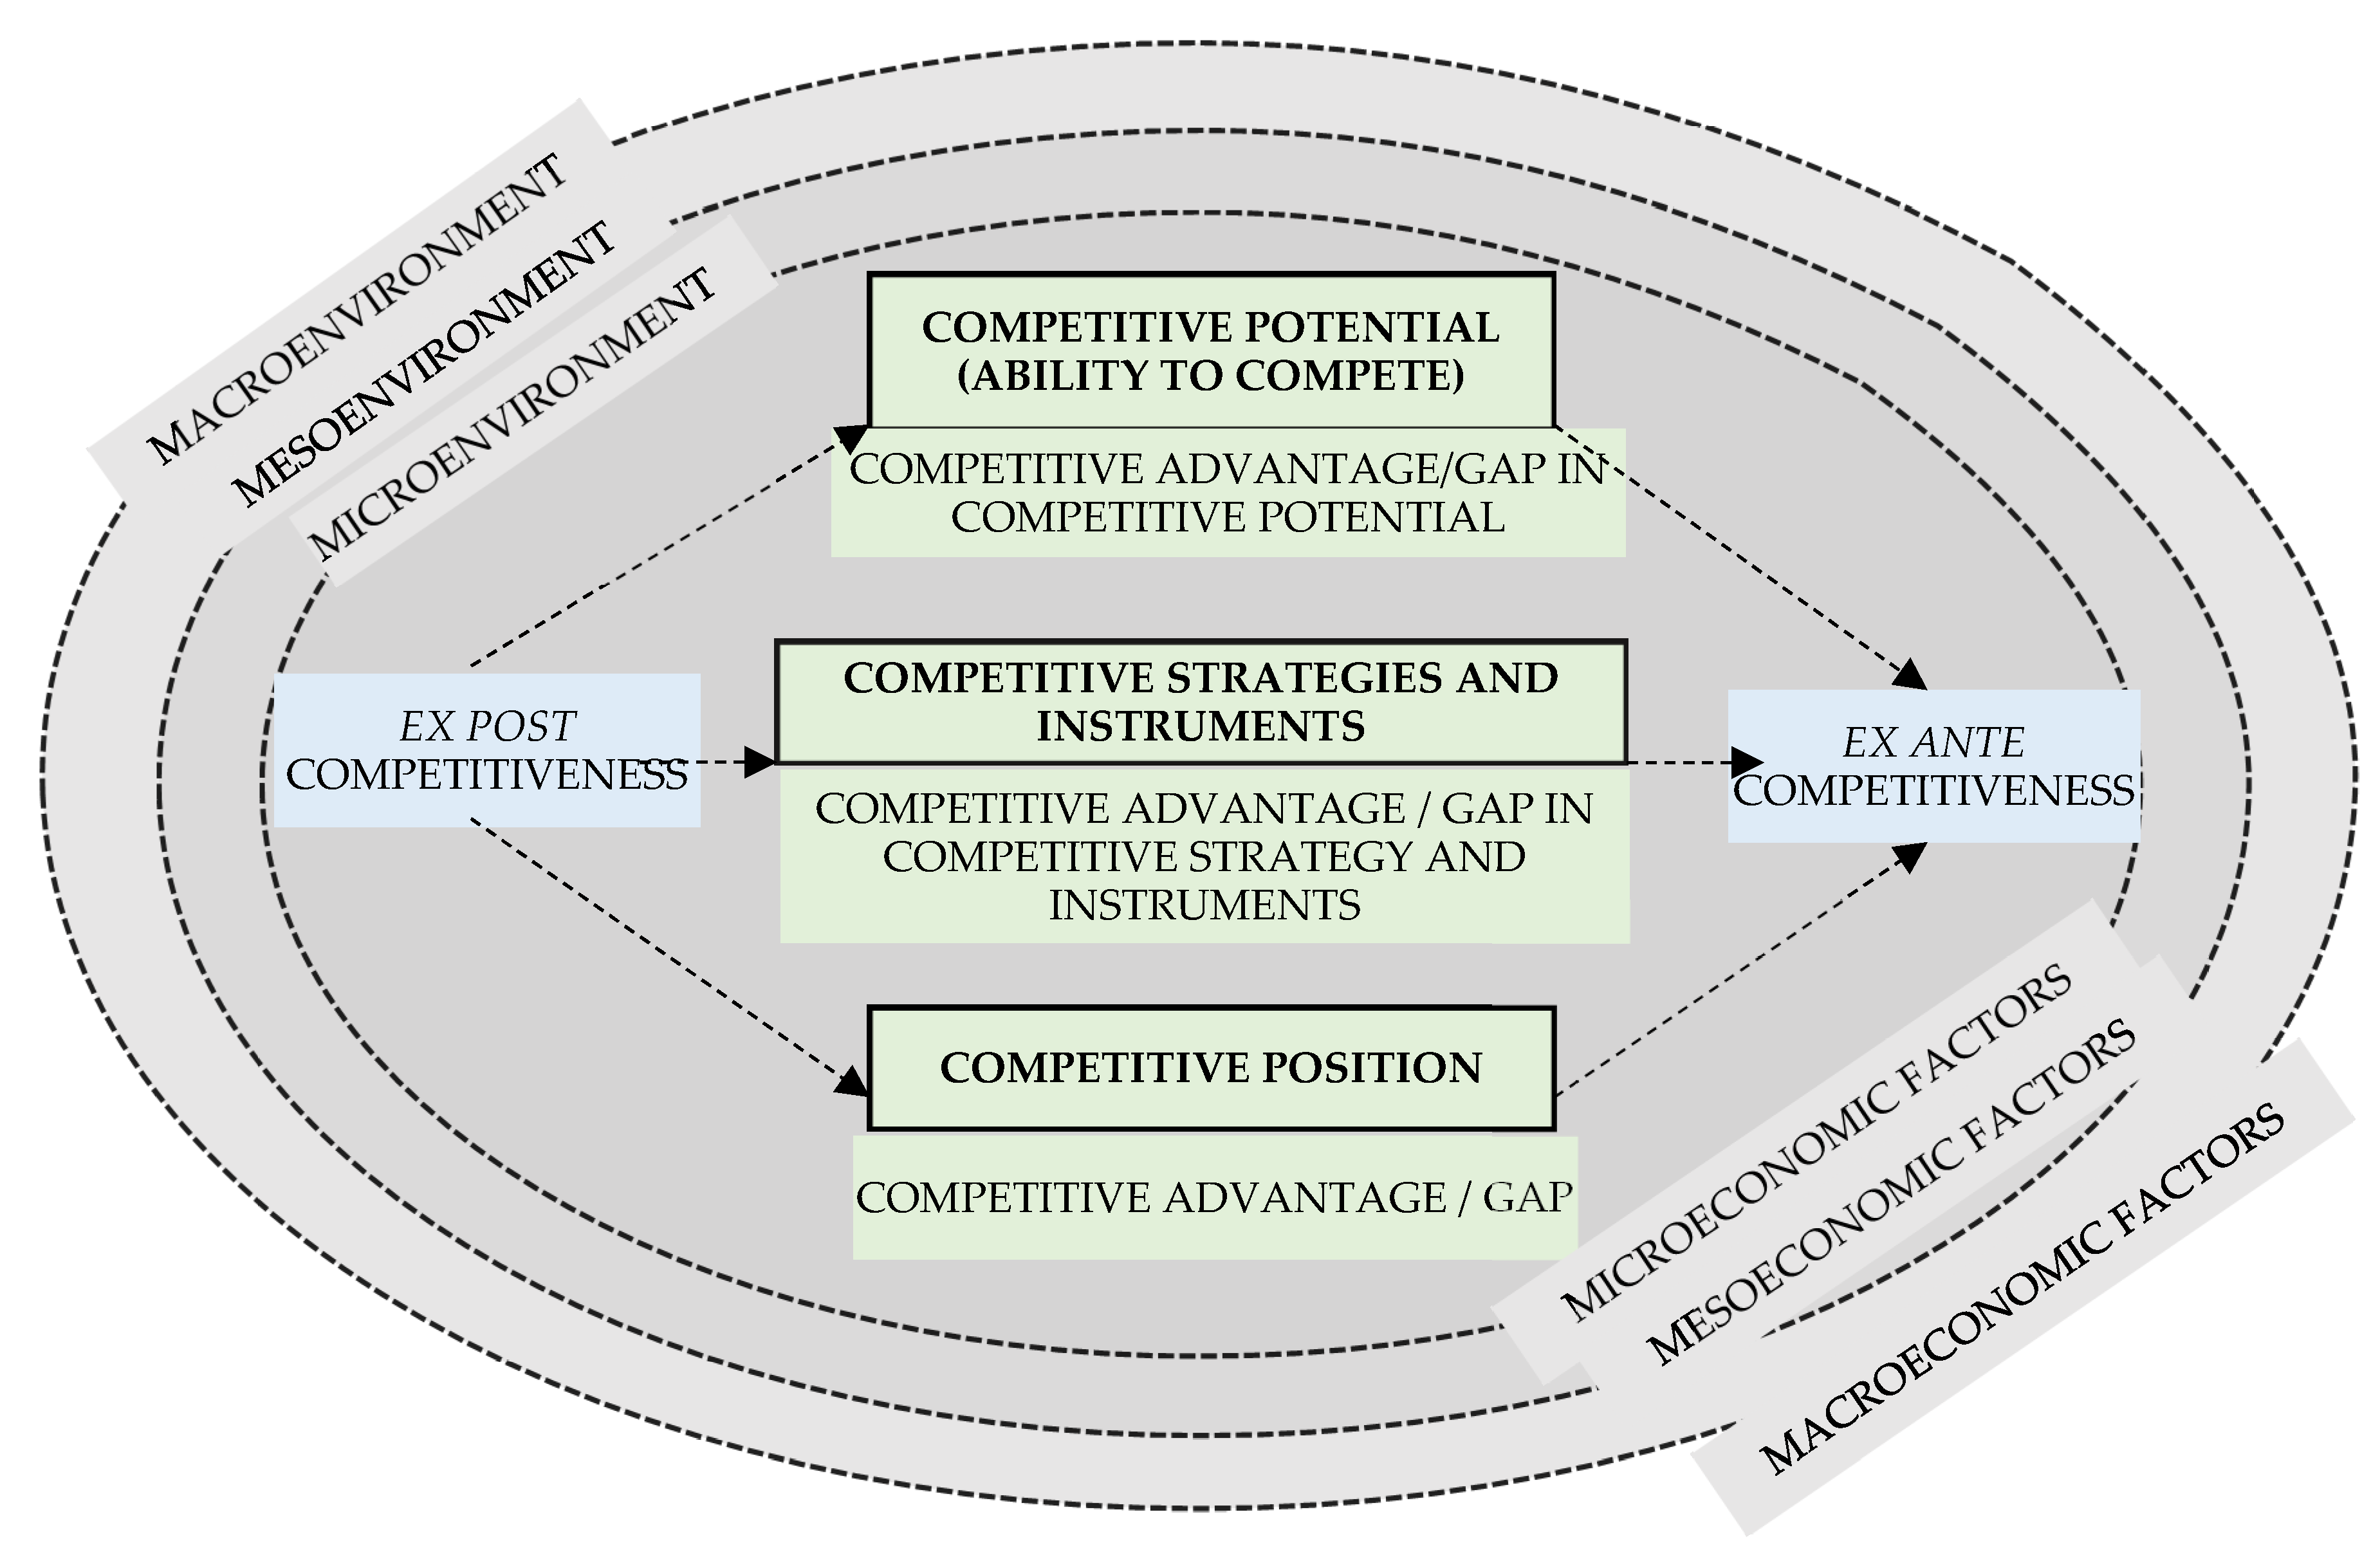
Studies in the literature stress that a company’s overall competitive advantage, which refers to the entity’s potential and strategy, including competing instruments and competitive position (
Figure 1) in a target market (market advantage), can ensure a long-term positive effect only when it results from the existence of resources which translate to an achieved competitive advantage and vice versa.
However, this is not an easy task—the changing environment and the necessity to adapt to the permanent state of economic disequilibrium do not encourage long-term thinking. Nevertheless, business practice and management sciences suggest that the problem of gaining competitive advantage or closing competitive gaps is mainly considered from the perspective of strategic management. Management itself—from a practical point of view—has always existed and related to all domains of human activity: social, economic, military, and political issues. It is understood as a set of actions aimed to achieve a specific goal related to an entity’s management and carried out in the following sequence: planning, organizing, leading and motivating, and controlling.
Competitiveness management is understood by the authors as having a continuous, intentional, well-thought-out, and well-planned impact on its particular subsystems, considering the existence of their mutual feedbacks [
12]. It is a dynamic concept related to technical and organizational development [
13], in which an organization’s subsystems, considered from the perspective of its environment, include the following factors:
Its potential, also referred to as competitive ability,
The strategies along with competition instruments, and
An entity’s competitive position.
M. Gorynia points out that a company’s competitiveness is the effect of its short-, mid-, and long-term operations—the components of its strategy [
14]—and, as A. Kaleta rightly states, the achieved competitive advantage results not from incidental actions but from long-term and consistent efforts focused on strategic goals [
15]. However, we should bear in mind that the achieved advantage can be, and often is, a short-term effect. Therefore, it is necessary to develop principles, methods, tools, and mechanisms that would ensure retaining positive effects over long periods of time [
16]. In the light of the above subsystems of competitiveness, it can be concluded that a significant role in this context is played by strategy along with competitive instruments [
17]—an entity’s potential can be taken for granted, while its competitive position is something to be achieved.
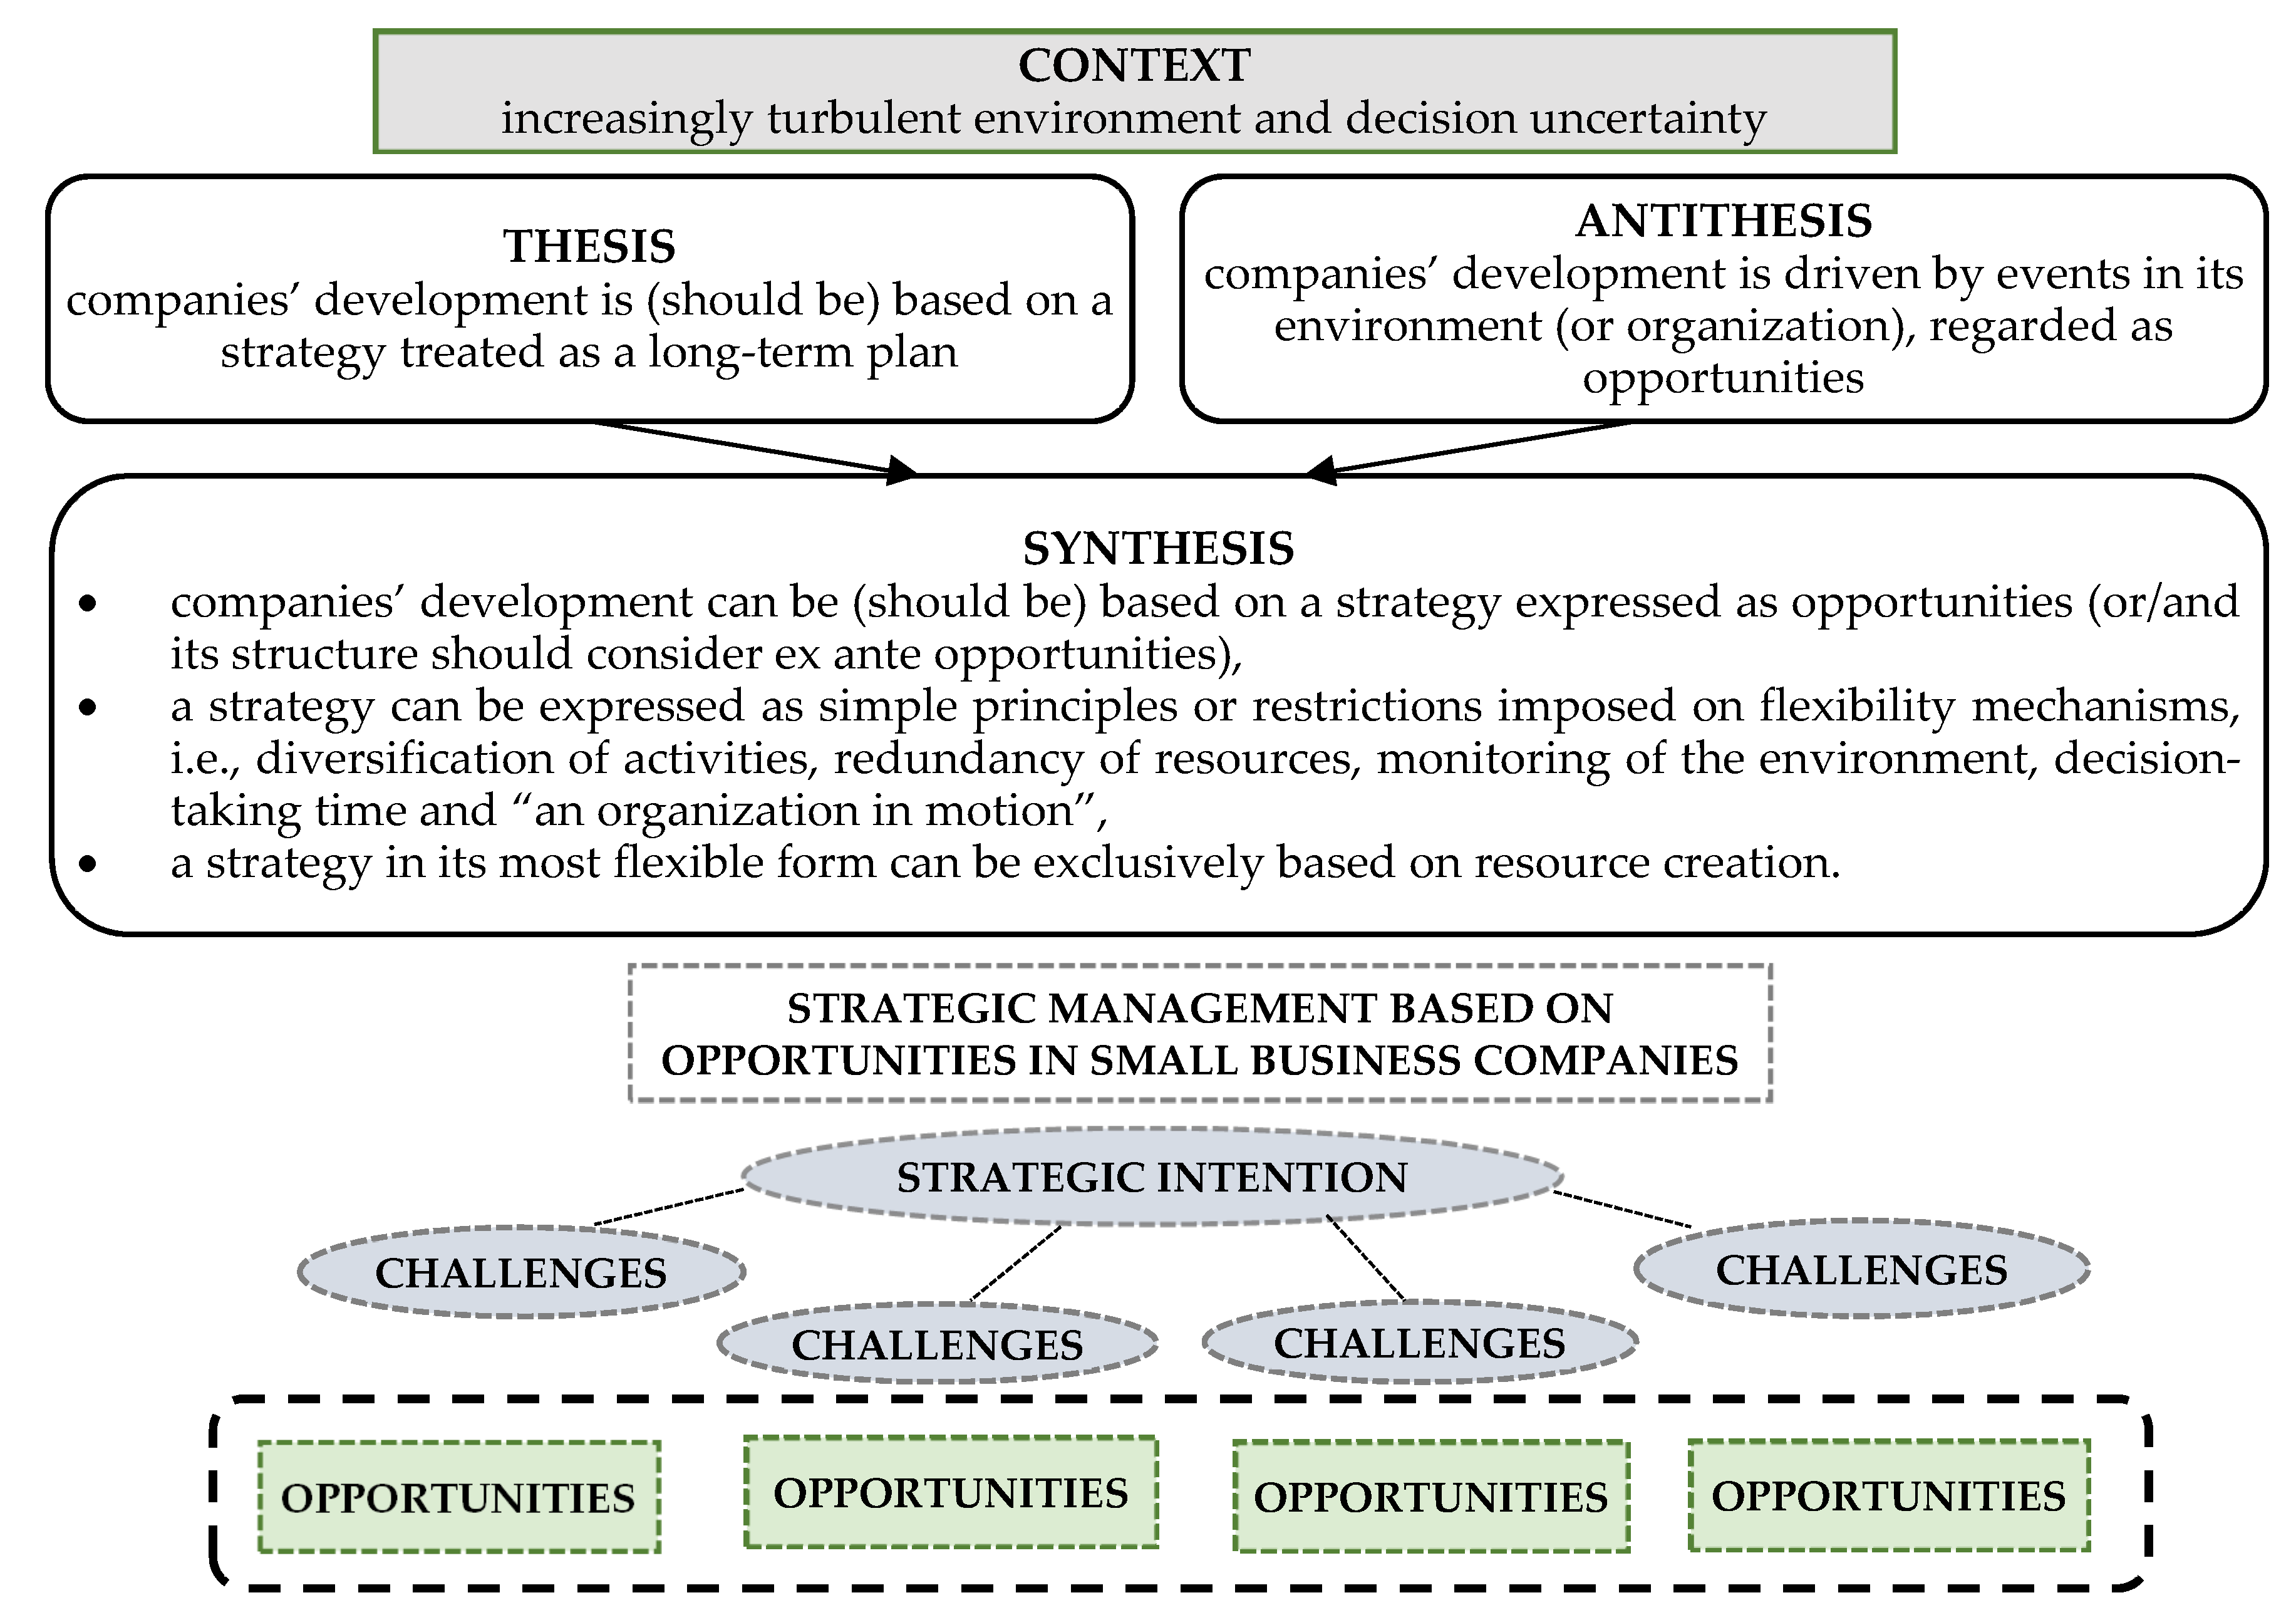
Therefore, an overall competitive advantage is greatly affected by the strategy and the adopted competitive instruments. These instruments, however, often result from the combination of long-term planning and specific events in an organization’s environment (internal and external), interpreted as “occasions” (
Figure 2). In a classical approach, strategic management is associated with a strategic pyramid focused on visions, missions, and long-, mid-, and short-term goals corresponding to the adopted mission, resulting from a vision and the effectiveness criteria which determine the selection of a strategy in accordance with given objectives [
18].
However, business practice indicates that small business activities and management do not reflect the classical patterns of strategic management described in the literature [
19,
20].
A vision is inherent in a company as its owners’ concept of its operations, being the reason for and goal of economic activities [
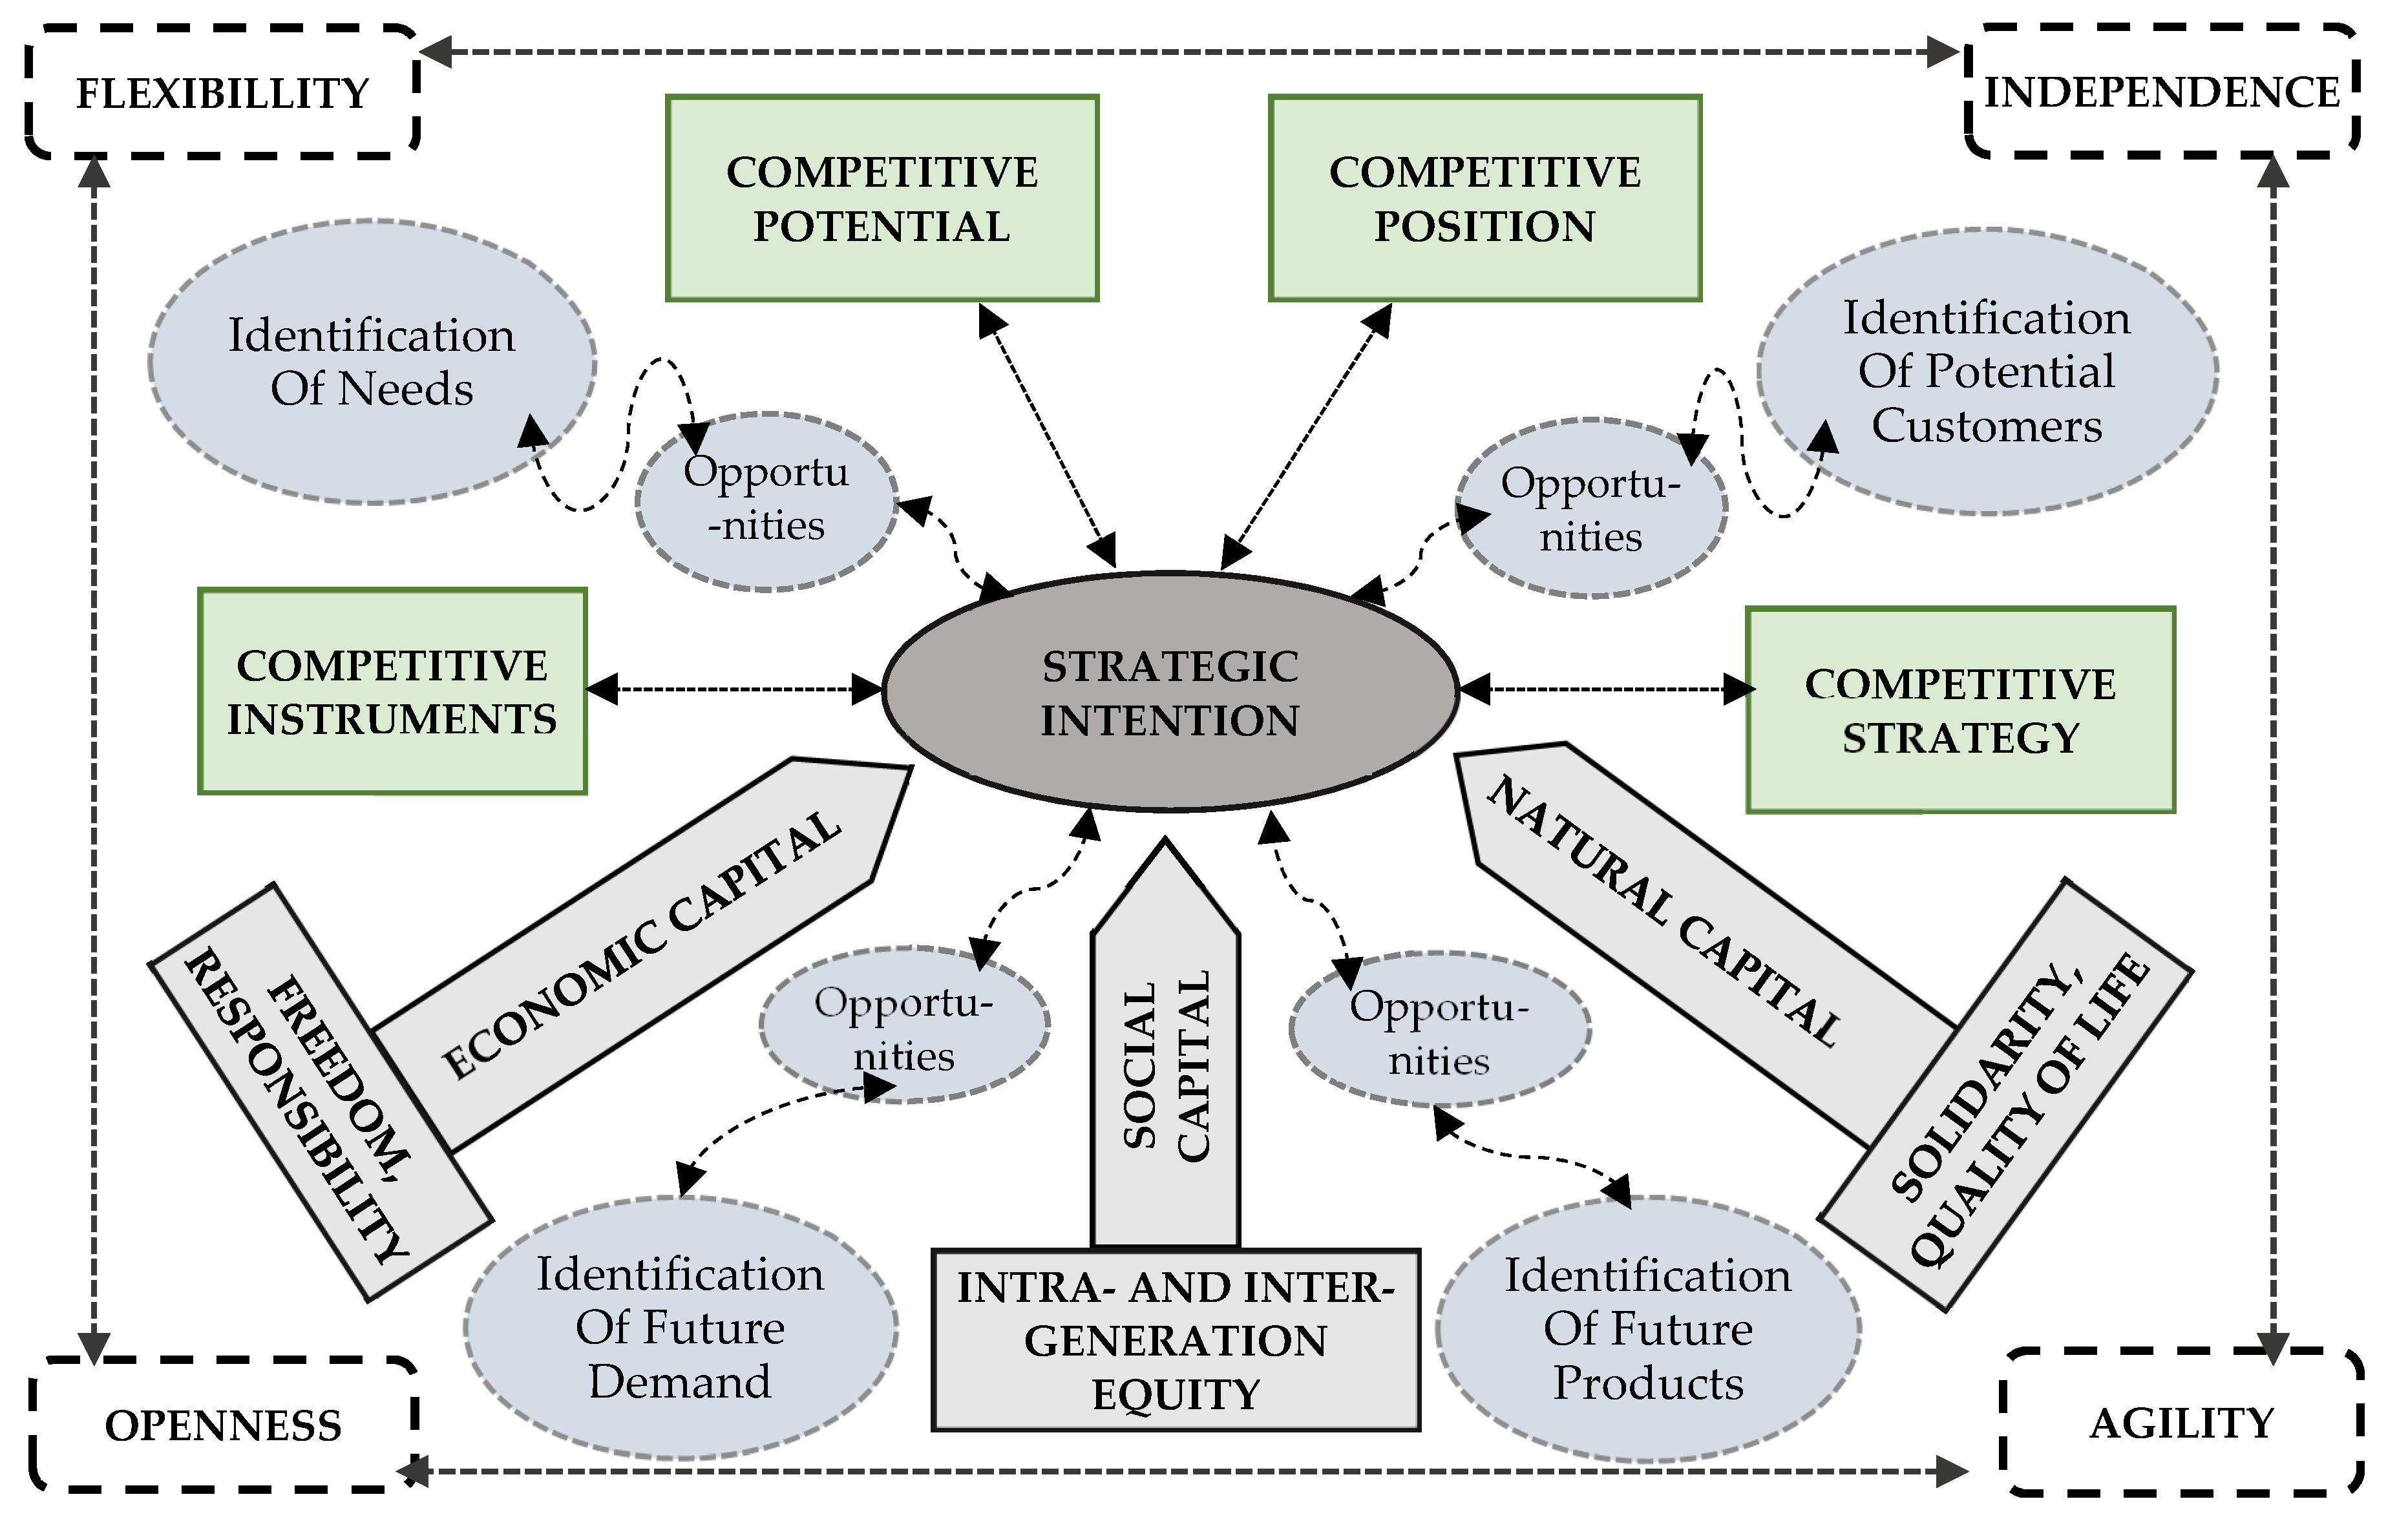
21]. A mission, on the other hand, frequently has a less formal character. Therefore, the indicator of strategic activities in many companies should be regarded as a “leading goal” rather than as a clearly defined mission or a vision. This goal is referred to as a “strategic intention”. Skat-Rørdam [
22] stresses that the essence of a strategic intention is determined by key factors related to the major components of competitiveness ex ante, for example:
The identification of future demand,
The identification of potential customers and their possible needs, and
The identification of future products.
Therefore, a strategic intention in the context of seeking small businesses’ competitive advantage is based on the identification of challenges and taking advantage of existing opportunities. Obviously, it should be borne in mind that the SME sector also includes medium entities in which management systems are more formalised as compared with micro businesses and other small economic entities. Consequently, an overall analysis of this sector should give attention to its diversity.
The analysis of small businesses’ competitiveness management leads to the following question: if a strategic intention is implemented through the identification of challenges and opportunities, can this form of management be referred to as sustainable? Another question arises: what is sustainable competitiveness management? To offer an answer to these questions, we should describe the foundations of the concept of sustainable management.
Figure 2.
The diagram of a dialectic structure of a strategy in the context of the changeability and dynamics of contemporary companies’ environments—the context of small business companies. Source: [
21,
23] using the authors’ representation.
Figure 2.
The diagram of a dialectic structure of a strategy in the context of the changeability and dynamics of contemporary companies’ environments—the context of small business companies. Source: [
21,
23] using the authors’ representation.
The concept of corporate sustainability management, including sustainable competitiveness management, is founded on the theory of systemic thinking, characterised by a company’s analysis focused on its external as well as internal environments. An organization is treated here as a system and, simultaneously, a component of a larger system. L. Bertalanffy stresses that any organized whole, apart from its components, is also composed of interdependencies, relationships, feedbacks, forms, and structures, and, consequently, the analyses of systems should give consideration to their specificity with regard to such attributes as wholeness, cumulativeness, growth, and competition, also in relation to its components, allometry, mechanization, the degree of centralization, purposefulness, and equifinality [
24]. Moreover, as rightly pointed out by K. Ziemniewicz and A. Piekarczyk, the behaviour of systems cannot be explained in a simplified manner, confining analyses to relations between components, causes and effects, dependent and independent variables, or stimulants and responses [
25]. Systemic management is effective when an organization undertakes continuous efforts to improve its processes, resources, methods, and techniques and creates mutually beneficial relations with its broadly understood environment [
26]. Therefore, a significant role is played by a holistic approach to the analysis of complex networks of relations [
25]. In this context, the concept of holistic management arises—a comprehensive approach to management for the purpose of increased effectiveness, ultimately leading to improvements in quality of life. In a cognitive sense, a holistic approach creates an overall and multidimensional picture as opposed to reductionism, which assumes emergentist and synergistic relations. Currently, this concept refers to a philosophical theory of development [
27]. According to the concept of holistic management, greater effectiveness is achieved when an organization is managed as a set of mutually interlinked components, not as separate entities, thus generating synergies and increasing organizational efficiency [
26]. Therefore, holistic management treats all organizations and their economic contexts, as well as societies and environmental resources, as relations among the elements of a whole—not as separate objects.
In this context, sustainability can be defined as a set of efforts aimed to achieve environmental [
28], social, and economic goals [
29,
30], which are not mutually exclusive but allow for retaining (not distorting) the space of all forms of capital—natural, social, and economic resources.
In this aspect, the concept of the circular economy CE should also be mentioned. It is referred to as a closed-loop economy and is an alternative to the open and linear model of material flows [
31,
32]. The CE concept assumes the recovery of waste and the reuse of materials within the streams:
Biological, where non-toxic materials are cascaded and returned to the biosphere for the reconstruction of natural capital, and
Technical, where used materials are returned to the economic system, either through repair and restoration, or ultimately recycling.
The growing popularity of this concept, which is part of the essence of sustainability, is related to the deteriorating condition of the natural environment. In response to this situation, methods of production and consumption are sought to reduce dependence on depleting natural resources [
33,
34,
35]. The resulting studies emphasize top–down approaches (the leading role of political and social initiatives implementing CE) [
36] and bottom–up approaches (with priority placed actions taken at the enterprise level) [
37,
38]. In both cases, circular economy management takes place through the harmonization of three key assumptions [
39]:
The implementation of systems that allow one to obtain values desired by people, e.g., based on principles of ethical management (the economical and categorical imperatives);
Maintaining the biophysical absorption capacity of the planet (the ecological imperative);
Providing adequate quality and standard of living for the present and future generations (the social imperative).
Therefore, sustainability management (
Figure 3) is based on the implementation of systemic thinking principles [
40] in a holistic spirit, which indicates the recognition of and respect for mutual relations between entities and their internal and external environment (all stakeholders) at three main levels—environmental, social, and economic—and a focus on achieving sustainable and sustained growth (a circular economy) characterised by the following factors [
41,
42]:
Balance between different forms of capital,
Quality of life,
A sustainable approach to ensuring the desired quality of life,
Intra- and inter-generational equity, and
Solidarity, freedom, and responsibility.
As part of the sustainable management of competitiveness, small business enterprises use the so-called classic components of the competitiveness of enterprises (their potential, competing strategies, and instruments for its implementation, as well as the obtained advantage, allowing a specific competitive position to be achieved). However, what distinguishes SB enterprises from large enterprises is the strategic intention revealed in the management process, instead of the classic strategy. Admittedly, in some of these enterprises, the strategic intention may turn into its competitive strategy (especially among the higher-sized classes of these entities). Nevertheless, in practice, a significant proportion of small business enterprises base their management solely on a strategic intention. Its foundation is capturing opportunities related to the identification of potential needs, future customers, future demand, or future products. When managing their competitiveness, SB enterprises exhibit qualitative features such as agility, openness, flexibility, and independence, which are a kind of activator for capturing market opportunities in terms of competitiveness.
Managing the competitiveness of small business in the spirit of sustainability therefore seems to be partly inscribed in their DNA. For the most part, these enterprises are the only source of income for their owners. This circumstance significantly influences the determination of their development strategy and the need for a long-term view of the company’s operations. Capturing market opportunities, as an element of a strategic approach, in this respect has a meaning complementary to the vision and mission of the company.
Important in the course of the analyses are such categories as size class, organizational and legal form, or type of enterprise activity. In the literature on the subject, it is estimated that small business is responsible for 60% of industrial pollution in Europe [
43], which should be assessed negatively from the point of view of sustainable enterprise management. On the other hand, small business eco-innovators can pioneer or lead new green industries, especially in the contexts of local and emerging markets that may be unappealing or unfeasible for large corporations. For example, in the United Kingdom and Finland, SMEs represent more than 90% and 70% of clean tech enterprises, respectively [
44]. It is stated in the research that “SMEs operate and create opportunities across a wide array of geographic areas and sectors; they employ different labour force segments, including low-skilled workers, and provide skill development opportunities. As such, job and value creation in the SME arena is a vehicle for inclusive growth. More explicitly, certain SMEs, such as social enterprises, are driven by social impact goals and the triple bottom line, and thus, contribute directly to inclusive growth” [
44]. In this way, SMEs contribute to the achievement of the goals of sustainable development of the world.
It can be indicated that the sustainable management of the competitiveness of SB enterprises is conditioned by their quality features and the adopted management system.
Changes in the way of thinking, also reflected in a new approach to business in the 21st century economy, are indispensable. Undoubtedly, the qualitative attributes of small businesses represent their strengths, allowing for a competitive advantage to be achieved without detriment to natural, social, and economic capital. However, this is conditioned by the implementation of sustainable management.
The presented analysis and identification of changes in a competitive position and the sources of competitive advantage in the analysed small business furniture manufacturers allows for the identification of existing relations and interdependencies in this industry as well as for referring this issue to sustainable management through presenting the results of research in the context of a circular economy.
3. Materials and Methods
The empirical research presented in this work is divided into two parts:
- (1)
Part 1 presents the issue of a circular economy and sustainable management, presented in the context of the furniture industry in Poland, with attention given to the following problems:
An analysis of the results of qualitative research based on interviews with entrepreneurs and experts,
Research conducted by other authors/centres, and the results of research presented in industry reports and the data provided by the Chief Statistical Office in Warsaw;
- (2)
Part 2 presents the authors’ quantitative research of micro, small and medium furniture manufacturers in Poland, aiming to identify their competitive position, their internal changes, and their sources of competitive advantage. The authors believe that identifying significant sources of competitive advantage can have a major impact on the hierarchy of companies’ success factors.
Part 1, which refers to qualitative research, presents 10 micro businesses. The study is based on in-depth interviews related to corporate sustainable management and circular economy.
Part 2 of the empirical study presents SME furniture manufacturers operating in central, eastern, and southern Poland. In total, the study covers 304 enterprises (N = 304) divided into groups by size: 117 micro entities (N = 117), 100 small entities (N = 100), and 87 medium companies (N = 87).
The study focuses on the identification of the levels and sources of achieved competitive advantage in SME furniture manufacturing companies. The identification of declared competitive position and the sources of competitive advantage is based on a survey conducted among companies’ owners and executives.
The analysis covers the 2008–2020 period divided into 3 research sub-periods: 2008– 2013 (the global economic crisis), 2014–2019 (the post-crisis period/economic recovery), and the year 2020 (the first year of COVID-19 pandemic). The identification of the above sub-periods aims to describe differences in the sources of competitive advantage in the SME sector, which affect competitiveness during the global economic crisis, in the post-crisis period, and during the COVID-19 pandemic. Thus, the identification of such periods allows for the levels of competitive advantage achieved in different economic environments to be compared.
The competitive position of the analysed entities is determined as a mean result of their declared perception of competitiveness in a given market. The small number of entities in the particular groups (e.g., micro businesses declaring a low position) results in the dichotomization of the variables and the identification of businesses with a low or average competitive position and a relatively high or very high position. This division allows for creating a clear picture of the obtained results and their interpretation. To sum up, for the needs of statistical analysis and data presentation, the following groups of enterprises are identified from the perspective of their perceived competitive position on the markets:
- (1)
Relatively low and average (A):
0—The lowest level of competitiveness,
1—Considerably worse than average competitive position,
2—Slightly worse than average competitive position,
3–Average competitive position,
- (2)
Relatively high and very high (B):
4—Slightly better than average competitive position,
5—Considerably better than average competitive position,
6—Market leader.
The obtained results of the survey of companies, related to the declared competitive position, are presented by company size (micro, small and medium) and the adopted research periods, i.e., 2008–2013, 2014–2019, and 2020. Additionally, the authors point to changes in the declared position, corresponding to the above groups.
The above comparative analysis is supplemented by an analysis of the taxonomy of structures, conducted on the basis of the measure of structural similarity with regard to the competitive position declared by micro, small, and medium entities. The analysis presents the calculation of structural similarity measures. For this purpose, the following formula is used (1):
where
PS—structural similarity measure,
i—identification number of a structural component,
n—number of structural components,
pi0—share of i-th structural component in the whole analysed population at time t0,
pi1—share of i-th structural component in the whole population at time t1,
min—minimum value of structural component.
The use of these methods allows for the analysis of internal homogeneity and possible differences between entities by size.
Finally, the analysis of the sources of competitive advantage considers 56 factors divided as follows:
Finances (1–5): (1) Equity, (2) EU co-financing, (3) Financing opportunities, (4) Profitability, (5) Tax concessions;
Market (6–16): (6) Product/service prices, (7) Activities in a market niche, (8) Introducing innovative market solutions, (9) Acquisition of new partners/customers, (10) Modern product distribution channels, (11) Market share, (12) Diversification of operations, (13) Information on markets and customer preferences, (14) Focus on a target segment, (15) Business cycle, (16) Export of products;
Product (17–19): (17) Product quality, (18) Product improvements, (19) Post-sale service;
Technology (20–22): (20) Modern technologies, (21) Company’s technical condition, (22) IT systems;
Politics and law (23–25): (23) Acquisition of patents/intellectual property rights, (24) A country’s degree of bureaucracy, (25) Business support policies;
Organization (26–46): (26) A company’s location, (27) Entering into cooperation with other companies, (28) Corporate image, (29) A company’s expertise knowledge, (30) Industry experience, (31) The use of modern management methods and concepts, (32) Marketing policy, (33) Flexible organizational structure, (34) A company’s mission and vision, (35) Setting objectives and identifying achievement methods, (36) Improvements in organizational processes, (37) Focus on a company’s expertise activities, (38) Building lasting customer relationships, (39) Result orientation, (40) Entering into cooperation with foreign investors, (41) Effective flow of information in a company, (42) Focus on learning and continuous development, (43) Customers’ brand awareness, (44) G Growth orientation, (45) Openness to change, (46) A family’s support;
Employees (47–56): (47) High-skilled workers, (48) Effectiveness of a company’s employees, (49) Employee loyalty, (50) Consistency between employees’ and company’s goals, (51) Employee trainings, (52) A company’s atmosphere, (53) Executives’ abilities, (54) Team leadership style, (55) Owners’ risk-taking inclinations, (56) Employee incentive system.
The analysis of the sources of competitiveness revealed the frequency of respondents’ indications, which allowed for identifying the sources regarded by companies as having a major or minor significance in building competitive advantage.
Finally, the analysis of the main areas (groups) of the sources of competitive advantage facilitated the calculation of the mean number of indications for the particular category. The obtained results were analysed from the point of view of mean differences using the Kruskal–Wallis test for independent analyses and Friedman’s one-way analysis of variance for dependent data. Non-parametric tests were used due to the measurement scale and considerable differences in numbers. The analyses assumed the value of Alpha = 0.05. Significance in the range (0.051–0.100) was regarded as the result of statistical tendency. Another source of inference was the difference in the y-square effect and Kendall’s W statistic for the Kruskal–Wallis test and Friedman’s test, respectively.
All the statistical calculations made use of IPM SPSS Statistic and MS Excel.
The limitations of the research are related to the lack of possibility to generalize the results and conclusions for the whole small business sector and also connected with the declarative aspect of respondent’s answers.
4. Results
The structure of the Polish furniture industry indicates the dominating share of small business entities: 95%—micro businesses, 3.8%—small companies, 0.9%—medium enterprises, and 0.3%—large companies [
45]. In terms of the number of furniture exporters, SB plays a significant role, with more than 50% being micro exporters, approx. 30% being small entities, approx. 15% being medium companies, and 5% being large exporters. However, their share in the value of exported products is different: less than 80%—large companies; more than 15%—medium entities; approx. 5%—small companies; and 1%—micro businesses [
46]. It can be concluded that the share of small business in the export of Polish furniture (in terms of its value) is not significant and requires the support of the country’s authorities, given the existing potential, high quality, and relatively low prices as compared with Western markets. Small business furniture exporters face the problem of the lack of manufacturer brand names, as well as the development of sales based on original designs as opposed to the sales of products under distributors or direct sellers’ brands [
47].
The research on global trends and economic forecasts indicate that customers expect personalised, high-quality, and reasonably priced products [
48]. Moreover, increasing consumer awareness results in ethical shopping and the seeking of information on the entire production process, including such aspects as raw materials, the source of components, and production processes, as well as additional information on product certification, product ecology, fair pay for employees, and distribution energy efficiency [
49,
50]. In this context, sustainable management in a furniture company relates to two flagship initiatives [
51]:
The use of an effective environmental management system—ISO 14001, or Eco—Management and Audit Scheme (EMAS)—companies seeking to improve their environmental performance and publish so-called environmental declarations;
implementing environmental programmes (Cleaner Production—CP, Responsible Care—RC). In both cases, companies declare their will to implement the programmes and assume responsibility for their products throughout the entire production cycle.
Apart from the above sustainable management systems, SMEs also make use of a set of OECD Sustainable Development Tools, developed for SB needs, which identify specific categories related to production system entries and exits (products) [
52,
53].
The discussion on ethical shopping in the context of global consumer trends should give attention to the issue of a circular economy. One of the major legal regulations is the EU Waste Framework Directive (2018/851) [
54], which refers to the Polish Act on Waste [
55]. It is estimated that the timber industry is responsible for 60% of timber waste in Poland, with a 15% share of the furniture industry, less than 15% share of the manufacture of wood-based panels, less than 8% share of the pulp and paper industry, and a 2% share in wooden products for construction [
56].
The in-depth interviews indicate that the analysed SME furniture manufacturers do not use the above management methods and tools. They use post-production waste to satisfy their own energy needs, but this does not result from intentional, integrated, and sustainable policies in accordance with the principles of circular economy. Currently, wood waste management in Poland is mainly based on co-incineration. SME entrepreneurs understand the need for ecological initiatives, but they cannot afford to implement such projects. They believe that waste management in their industry could be centrally planned, implemented, and controlled in the case of local entities, especially those belonging to production groups or clusters, which would allow them to cut the costs of such activities and also confirm their certified membership in industrial associations, furniture recycling systems, etc.
Apart from the indicated deficiencies in sustainable management methods applied by Polish SME furniture companies, some good business practices are reported in the industry, which can be treated as examples to follow. A number of measures have been undertaken in Poland to make an effective use of wood waste and used wood products in the manufacture of wood-like goods [
57,
58]. Additionally, the furniture industry is implementing business models based on integrated cluster networks and supply chains, e.g., Wielkopolski Furniture Cluster, and platform T-Scale, for the shared purchase of transport services [
59]. Another good example is the use of post-production waste in the manufacturing of energy efficient briquettes in furniture companies in Kalwaria Zebrzydowska. These are high-quality products with a dryness rate below 20%, and they meet EP 70 heating requirements. Another example of material recovery (glued wood) is a micro business in Dobczyce, which uses this material for the manufacture of windows, worktops, etc.
The obtained results of the survey of the declared competitive position in the analysed periods are presented in
Figure 4,
Figure 5 and
Figure 6, and
Table 1 shows changes in the competitive position declared by groups of businesses according to their size (micro, small, and medium) in 2008–2013, 2014–2019, and 2020.
In 2008–2013, out of 117 analysed micro businesses, 78 entities (nearly 67%) declared their competitive position as relatively low or average (A), with 5 of them declaring position 0 (difficult to define/lack of competitiveness); 33 entities—position 1 (considerably worse than average); 26—position 2 (slightly worse than average); and 14–position 3 (average). Membership in group B, i.e., a relatively high and very high position, was declared by 39 micro businesses (33%), with 18 entities indicating position 4 (slightly better than average), 18 declaring position 5 (considerably better than average), and 3 declaring position 6 (market leaders).
In 2014–2019, 66% of micro businesses still declared their competitive position as relatively low or average (A), with some positive changes in their assessments—the number of 0 and 1 declarations decreased, while declarations of 2 and 3 increased. The number of micro businesses belonging to group B (relatively high and very high) did not change considerably as compared with the previous period (except an increase in the number of the best entities to 8).
Unfortunately, in 2020, the number of group B members (relatively high and very high) decreased to 28%, while their share in group A increased to 72%. The worsening of micro businesses’ competitive position in the last analysed period can be attributed to the negative impact of the pandemic on markets and enterprises.
To sum up, in the entire analysed period, i.e., in 2008–2020, most entities (70%) declared their position as relatively low and average (A), while approx. 30% of them declared it as high or very high (B) (see
Table 1).
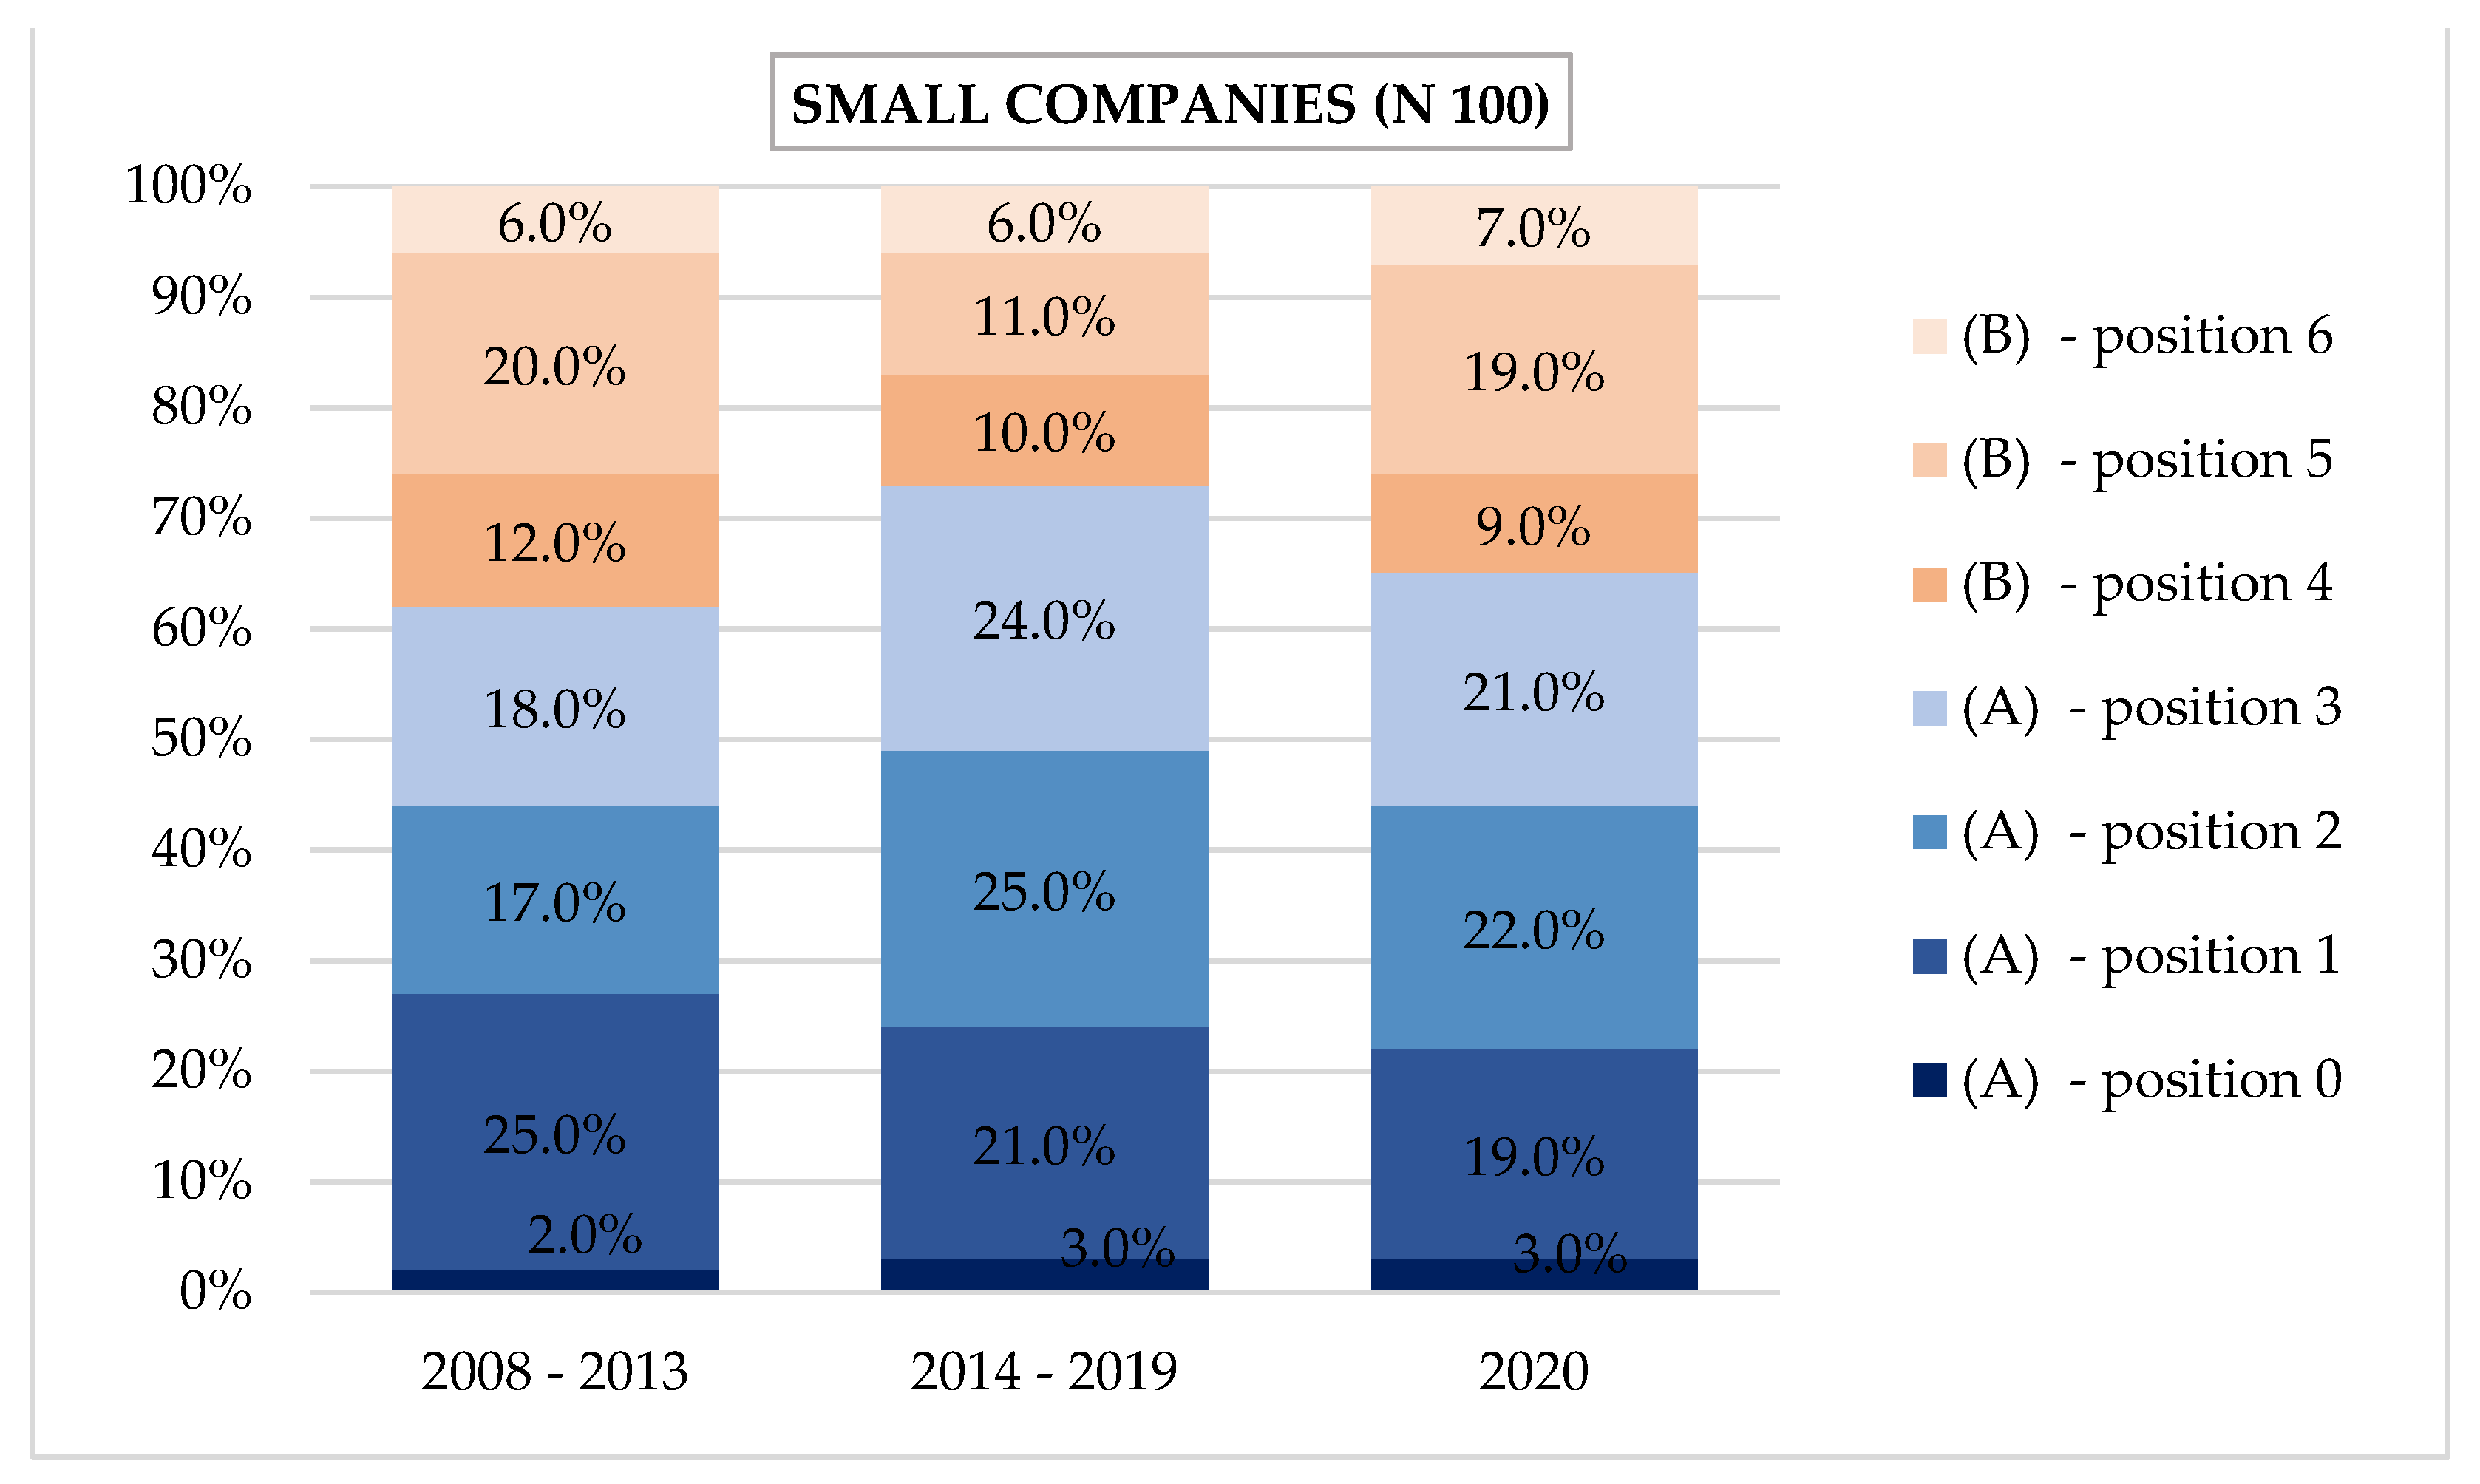
In 2008–2013, nearly 62% of entities with 10–49 employees declared a relatively low or average competitive position (A), and their structure based on declarations 0–3 was similar to micro businesses. Membership in group B, i.e., a high and very high position, was declared by 38% of small companies, with 12 entities declaring position 4 (slightly better than average), 20 declaring position 5 (considerably better than average), and 6 declaring positions as market leaders.
Unlike in the case of micro and medium businesses, the situation of small companies in the subsequent analysed periods deteriorated: in 2014–2019, the number of group B members decreased (relatively high and very high) to 27%, while the number of group A members increased (relatively low and average) to 73%. Group B had the same number of market leaders (6), with a decreasing number of small entities declaring positions 5 and 4 in favour of group A (position 3—average) and position 2 (slightly worse than average).
In 2020, the competitive position of small entities improved slightly and was similar to the 2008–2013 period (the position of micro and medium businesses deteriorated).
Nearly 67% of 100 analysed small entities declared that in the entire period 2008–2020, their competitive position had been low or average (A), while 33% of entities declared this position as high and very high (B). This indicates that micro businesses were in a slightly better situation (see
Table 1,
Table 2 and
Table 3).
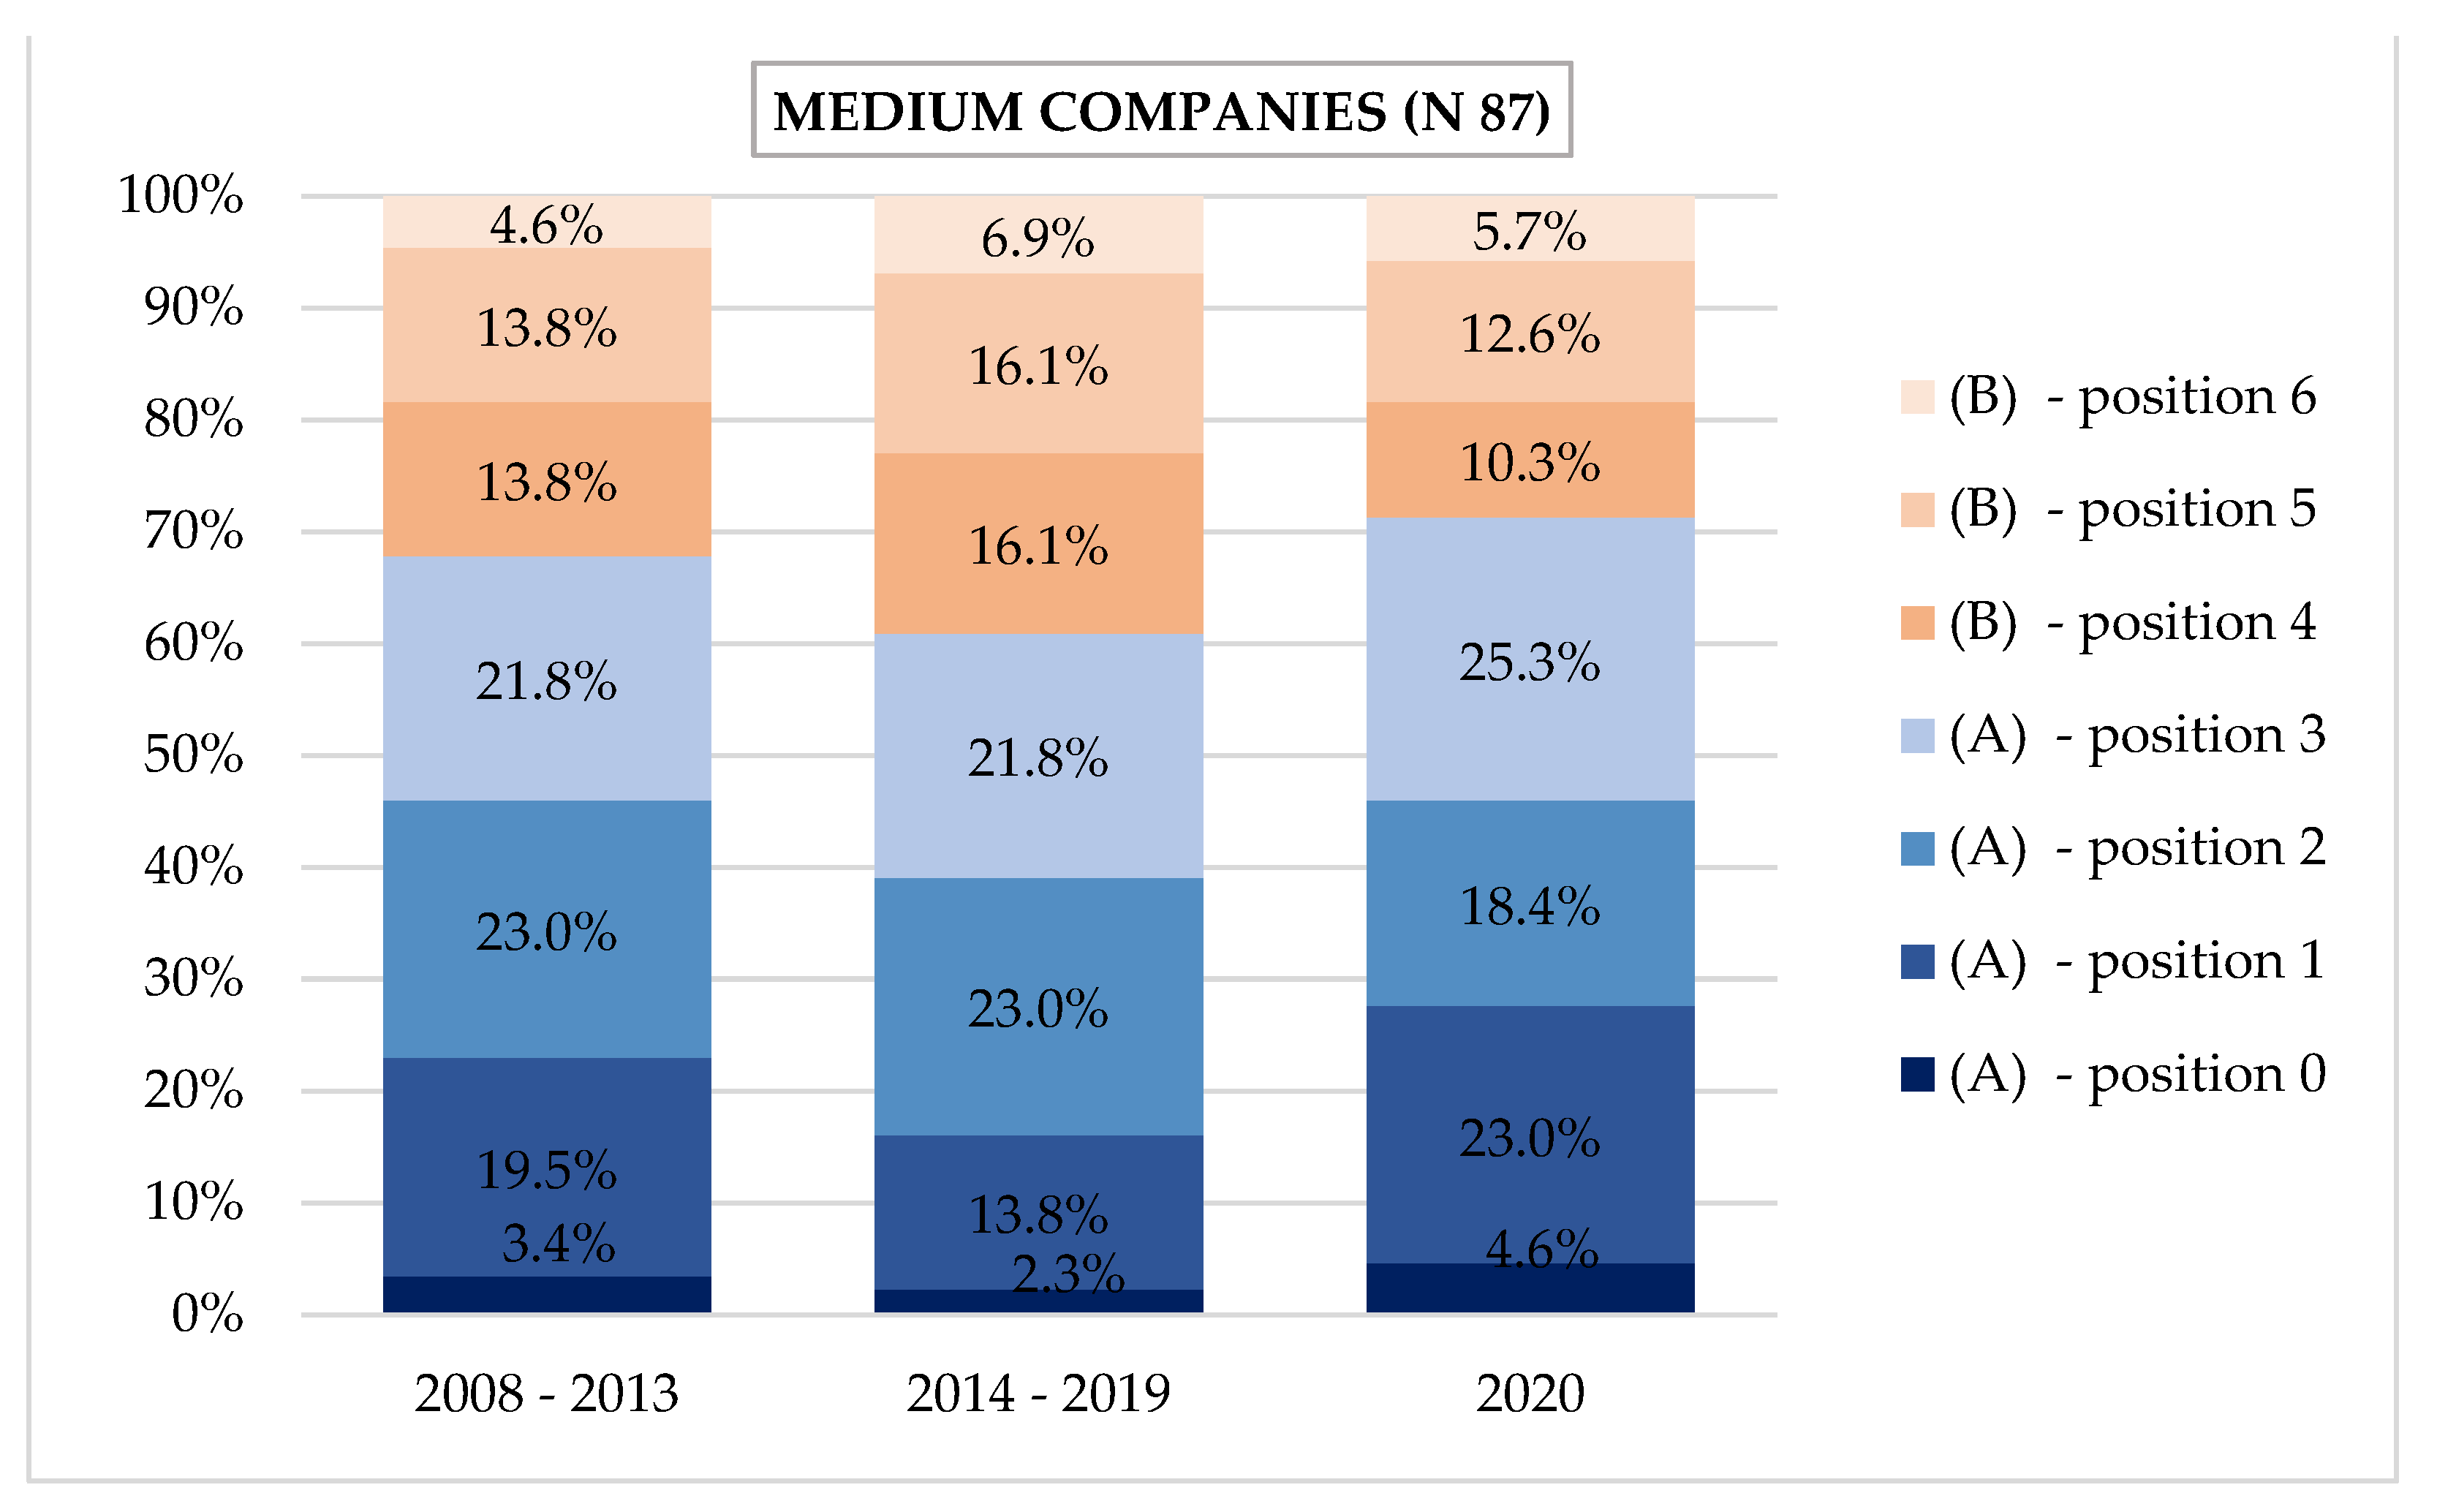
For the period of 2008–2013, we analysed 87 medium-sized entities (50–249 employees). A relatively low or average competitive position was reported by 68% of entities (A): 3 entities declared position 0, 17 entities declared position 1, 20 entities declared position 2, and 19 entities declared position 3. Group B, i.e., a relatively high and very high competitive position, was represented by 32% of medium companies, with 12 of them indicating position 4 (slightly better than average), 12 indicating position 5 (considerably better than average), and 4 indicating position 6 (market leaders).
In 2014–2019, small entities recorded a worsening of their competitive position, while competitiveness in companies increased slightly. In group A, the number of entities with a low or average position dropped to 61%, which was reflected in their declared position of 1 (a decrease to 12 entities), in favour of the number of businesses in group B (relatively high and very high positions), whose share increased to 39% in all the positions of group B, i.e., positions 4, 5 and 6.
In 2020, as compared with the previous analysed period, medium companies’ competitive position deteriorated—the percentage of medium businesses in group B (relatively high and very high positions) decreased to 29%, and it increased considerably in group A (relatively low and average positions), representing 71% of all entities. The number of medium entities declaring positions 6, 5, and 4 decreased in favour of worse places in group A with respect to all competitive positions—positions 3 (average), 2 (slightly worse than average), 1 (considerably worse than average), and 0.
Most of the 87 surveyed medium companies (67%)—similarly to small entities—declared that during the entire analysed period (2008–2020), their position had been low or average (A), and 33% of them declared their position as high and very high (B). This indicates that their position was slightly better as compared with micro businesses, being similar to the competitive position of small entities—
Figure 6 and
Table 1.
To sum up, the structure of micro businesses in 2014–2019, as compared with 2008–2013, i.e., in the post-crisis period, recorded slight positive changes: the number of entities declaring the lowest positions (0 and 1) decreased, while the number of competitive positions 2 and 3 increased. The number and structure micro businesses assigned to group B (relatively high and very high) did not change considerably as compared with the previous period. However, the deterioration in the competitive position of micro businesses was recorded in the last analysed period, i.e., in the year 2020 (a decrease in the number and share of micro businesses in group B—relatively high and very high, and their increased share in group A—relatively low and average). The declared competitive position of micro businesses and its change in 2020 should be attributed to the negative impact of the pandemic.
In 2014–2019, unlike in the case of small companies, medium entities recorded a slight improvement in their competitive position. The number and share of medium enterprises in group A decreased (low and average), while the opposite phenomenon was observed in group B (high and very high) for all its positions. In 2020, as compared with the previous period, the competitive position of medium enterprises deteriorated—the number and share of group B members (relatively high and very high) decreased, while it increased considerably in all the positions of group A (relatively low and average).
Small companies’ competitive position in the analysed periods was different than in micro and medium entities. In 2014–2019, it deteriorated—its number in group B decreased (relatively high and very high), while the share in group A increased (relatively low and average), and in 2020, as opposed to micro and medium entities, it improved considerably, reaching a similar level to that in 2008–2013 (simultaneously, the competitive position of micro and medium entities deteriorated in 2020 due to the pandemic).
The obtained results and their analysis in the research periods indicate that micro and medium entities as compared with small entities are characterised by a different level of adaptability (flexibility) to market conditions.
In the periods of prosperity, micro and medium entities take over some market share from small companies, and vice versa. This implies the necessity to carry out further analyses of micro businesses and SMEs as a group of companies which shape markets.
The above comparative analysis of micro businesses and SMEs is supplemented by an analysis of structural similarity measures. The presented analysis of the taxonomy of structures is based on the structural similarity measure related to the competitive position declared by micro, small, and medium entities (
Figure 4,
Figure 5 and
Figure 6). The results show slight differences between input data (2008–2013) and output data (2020) with regard to the degree of similarities between companies of different size, and the greatest similarities are recorded for small and medium entities (PS = 0.054 in 2008–2013, and PS = 0.076 in 2020). This indicates that at the initial and final stage of the analysis, the declared positions of Polish furniture manufacturers are characterised by a low degree of similarity, with the highest similarity recorded for small and medium entities, which increases in the compared periods. The structure of the declared positions (in a 0–6 scale) also shows that the comparison of the two above periods points to an increase in the percentage of relatively low and average positions—group A (positions 0–3) among micro businesses (from 67% to 72%) and a decrease in the percentage of companies with a relatively high and very high position—group B (positions 4–6, from 33% to 28%). Among small and medium entities, changes in these two groups of competitive positions (A and B) do not exceed 3 percentage points. A positive indication is a decrease in the number of micro businesses declaring the lack of competitiveness (by nearly 2 percentage points), as well as an increase in the number of the most competitive entities among small companies (by 1 percentage point) and medium entities (more than 1 percentage point).
The next stage of the research on companies (N 304) by size (micro, small, and medium) with regard to their competitive position was an analysis of the frequency of the declared sources of competitive advantage (56 factors).
Figure 7,
Figure 8 and
Figure 9 show the frequency and groups of the sources of the declared competitive advantage in micro, small, and medium entities that declare relatively low and average competitive position (A) or relatively high and very high position (B) in the analysed periods.
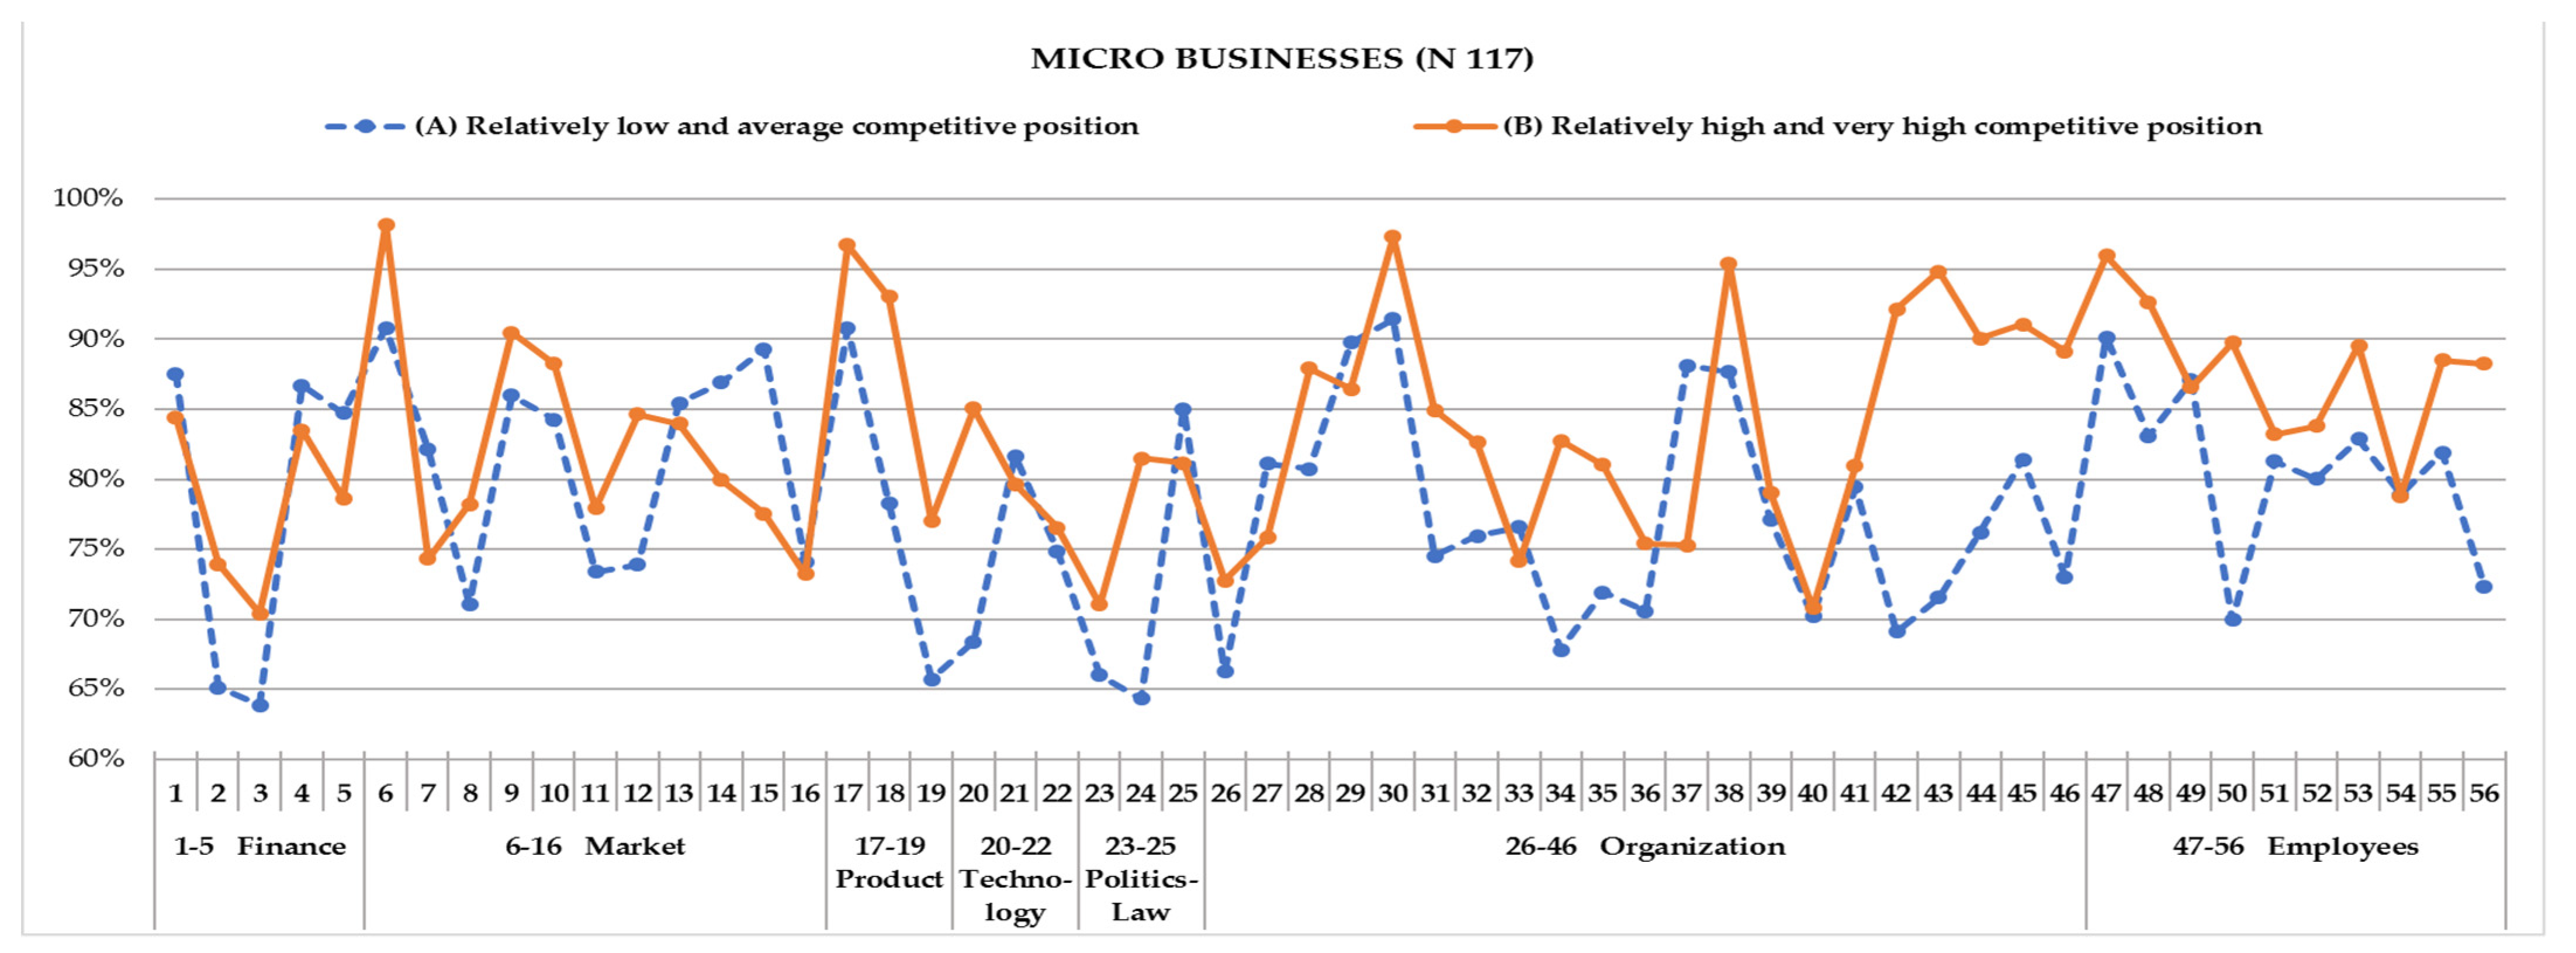
In 2008–2020, as indicated by micro businesses declaring a relatively high and very highly competitive position (B), the major sources of competitive advantage (the greatest frequency of indications) are as follows:
(6) Price of products/services (98% of indications),
(30) Experience in the industry (97%),
(17) Product quality (97%),
(47) Skilled workforce (96%),
(38) Building lasting customer relationships (95%),
(43) Customers’ brand awareness (95%),
(18) Product improvement (93%),
(48) Employees’ effectiveness (93%),
(42) Focus on learning and continuous development (92%),
(45) Openness to change (91%),
(9) Acquisition of new partners/buyers (90%),
(44) Focus on development (90%).
The largest group of the most frequently indications in micro businesses with a relatively high and very highly competitive position (B) were organization (30, 38, 43, 42, 45, 44), market (6, 9), product (17, 18), and employees (47, 48).
The least frequent indications were as follows:
Financial: (3) financing opportunities—70%, (2) EU co-financing—74%;
Market: (16) export of products—73%;
Organizational: (26) a company’s location—73%, (40) Cooperation with a foreign investor—71%.
In 2008–2020, according to the assessment of micro businesses with a relatively low and average competitive position (A), the major sources of competitive advantage included some other factors than those indicated by group (B):
(30) Experience in the industry (92%),
(6) Price of products/services (91%),
(17) Product quality (91%),
(47) Employees’ qualifications (90%),
(38) Building lasting customer relationships (88%),
However, there was also a group of factors not indicated as the most frequent in group (B):
Market: (15) Economic prosperity—89%, (14) Focus on a given segment—87%;
Organizational: (29) A company’s expertise—90%, (37) Focus on a company’s specialised area—88%;
Financial: (1) Equity—88%, (4) Profitability—87%;
and related to employees: (49) Employee loyalty—87%.
It should be noted that micro businesses in group (A) regard financial factors as significant in gaining competitive advantage (sufficient equity and return on equity), and they attribute the least significance (similarly to group B micro businesses) to the following factors:
Financial: (3) financing opportunities (foreign capita)—64%, and (2) EU co-financing—65%);
Political and legal: (24) a country’s bureaucracy indicators—64%);
Organizational: (26) a company’s location—66%, (34) a company’s mission and vision—68%).
Therefore, the lower a micro entity’s competitive position, the greater the significance of such external factors as current economic prosperity and a focus on a selected business activity, and internal factors such as a company’s specialised knowledge, self-financing potential, profitability, and employees’ loyalty (including employee retention) (
Figure 7).
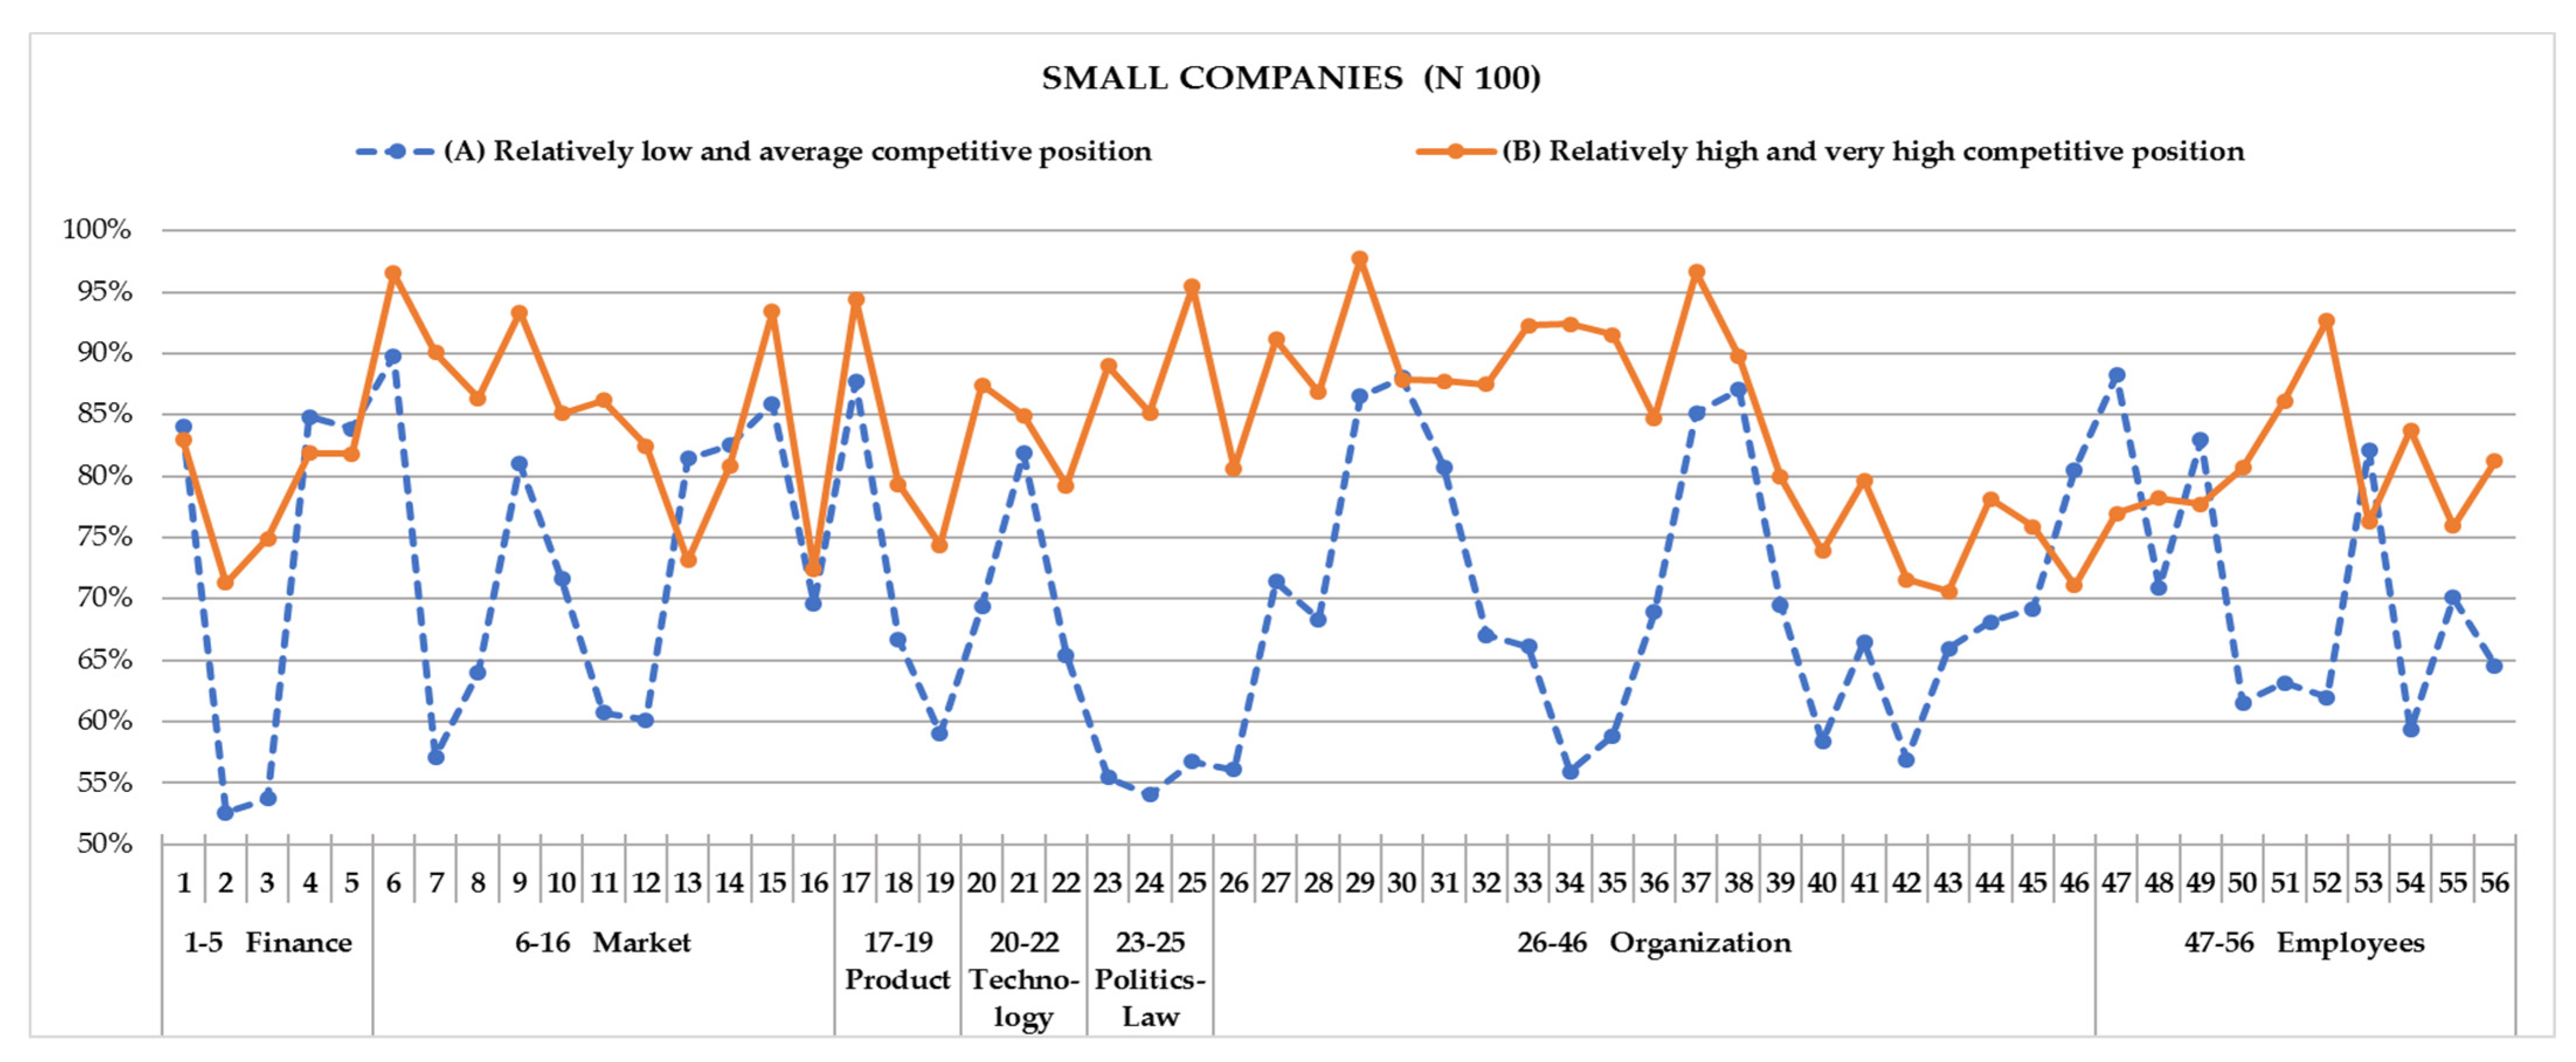
According to companies declaring a high and very high competitive position (B) in the entire analysed period (2008–2020), the major sources of competitive advantage are as follows (
Figure 8):
(29) A company’s specialised knowledge (98%),
(37) Focus on a company’s specialised activity (97%),
(6) Price of products/services (97%),
(25) A policy supporting companies (96%),
(17) Product quality (95%),
(15) Economic prosperity (94%),
(9) Acquisition of new partners/buyers (94%),
(52) Atmosphere in a company (93%),
(34) A company’s mission and vision (92%),
(33) Flexible organizational structure (92%),
(35) Identification of goals and methods for achieving them (92%),
(27) Cooperation with other enterprises (91%).
It should be noted that as compared with the micro businesses of group B, the major sources of competitive advantage declared by small companies in this group are different (except market factors—price of products/services and acquisition of new partners/buyers—and product-related factors—product quality). Additionally, the most frequently indicated sources of competitive advantage in small entities with a relatively high and very high competitive position (B) are organizational factors (similarly to micro businesses belonging to B), while small companies indicate different organizational factors (27, 29, 33, 34, 35, 37).
Simultaneously, the least frequently indicated factors are as follows:
Organizational: (46) Support from families—71%, (42) Focus on learning and continuous development—72%;
Financial: (2) EU co-financing—71%;
Market: (16) Export of products–72%.
Again, factors indicated by small companies belonging to group A are different from those declared by micro businesses in group B.
In 2008–2020, small companies declaring a relatively low or average competitive position (A) indicate the following major sources of competitive advantage:
Market: (6) Price of products/services—90%, and Economic prosperity—86%,
Employees: (47) Skilled workers—88%;
Organizational: (30) Experience in the industry—88%, (38) Building lasting customer relationships—87%, (29) A company’s specialised knowledge—87%, (37) Focus on a company’s specialised activity—85%;
Financial: (4) Profitability—85%, (1) Shareholders’ equity—84%, (5) Tax concessions—84%.
Small companies in group (A) regard self-financing (equity) and return on capital as very significant sources of competitive advantage, while the least importance (as in the case of micro businesses from group A) is attributed to the following:
Financial: (2) EU co-financing—53%, and (3) Financing opportunities (foreign capital)—54%;
Political and legal: (24) Bureaucracy indicators—54%, (25) Business supporting policies—57%;
Organizational: (26) A company’s location—56%, and (34) A company’s mission and vision—56%.
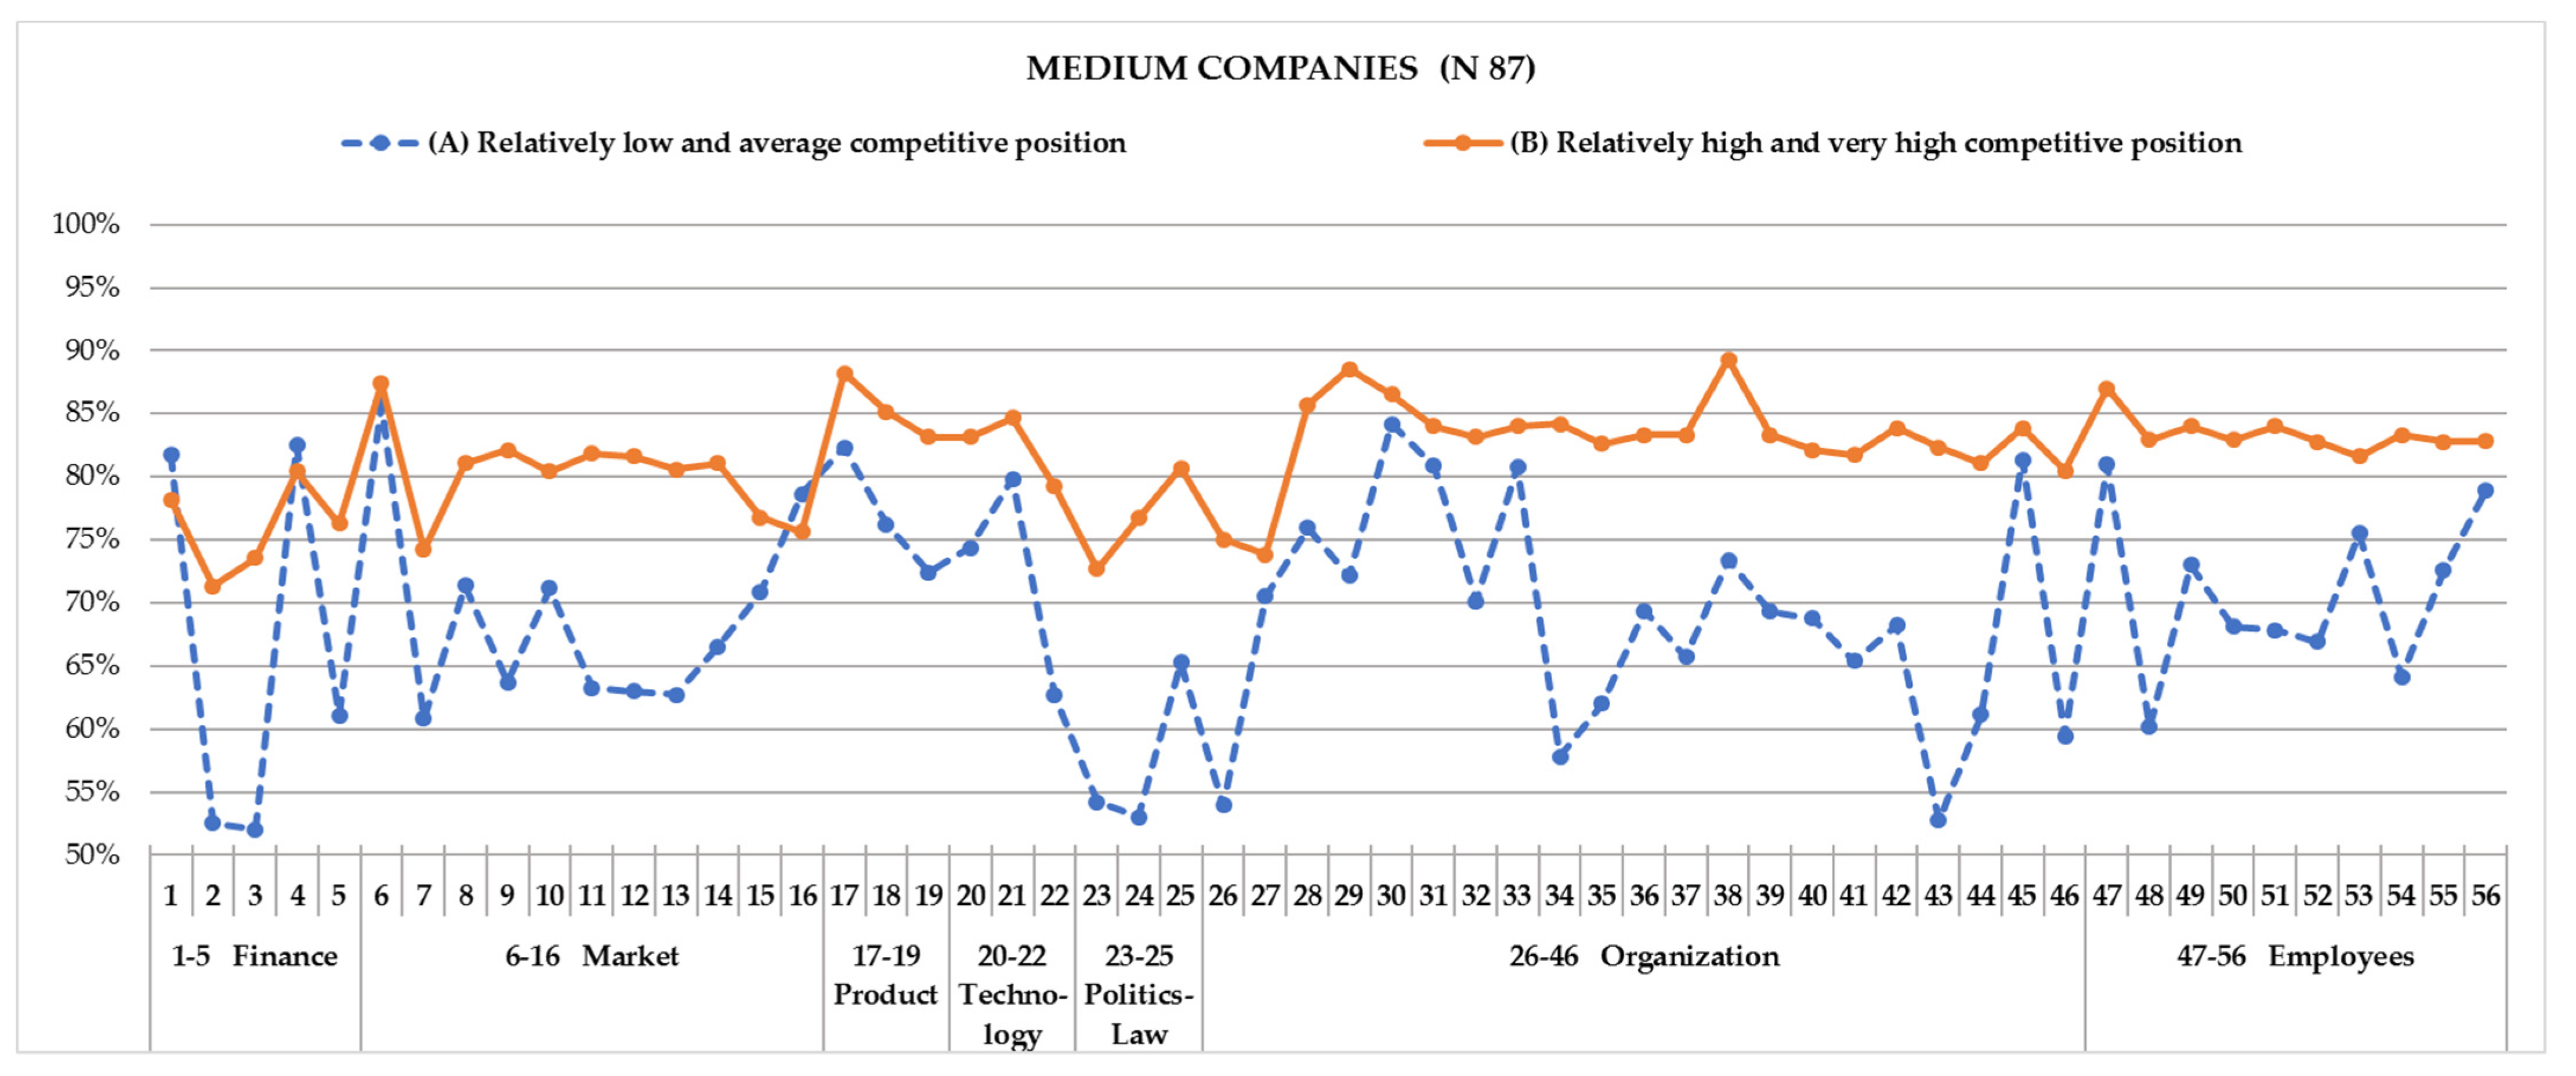
Medium companies declaring a relatively high and very high competitive position (B) indicate that, in the entire period 2008–2020, they regard the following factors as the major sources of competitive advantage:
(38) Building lasting customer relationships (89%),
(29) A company’s specialised knowledge (88%),
(17) Product quality (88%),
(6) Price of products/services (87%),
(47) Qualified workers (87%),
(30) Experience in the industry (86%),
(21) A company’s technological conditions (85%),
(49) Employee loyalty (84%).
The least frequently indicated factors for group B medium entities are as follows:
Financial: (2) EU co-financing—71%, (3) Financing opportunities—73%;
Organizational: (27) Cooperation with other enterprises—74%, and (26) A company’s location—75%;
Market: (7) Operations in a market niche—74%, (16) Export of products—76%.
In 2008–2020, medium companies declaring a relatively low and average competitive position (A) regard the following to be the major sources of competitive advantage:
Market: (6) Price of products/services—86%;
Organizational: (30) Experience in the industry—84%, (45) Openness to change—81%, (31) The use of modern management methods and concepts—81%, (33) Flexible organizational structure—81%;
Financial: (4) Profitability—83%, (1) Shareholders’ equity—82%;
Employees: (47) Skilled workers—81%, (56) System of motivating employees—79%.
Similarly to micro and small entities with a relatively low or average competitive position (A), the least significance in gaining competitive advantage is attributed to the following factors:
Financial: (3) Financing opportunities (foreign capital)—52%, and (2) EU co-financing—53%;
Political and legal: (24) Bureaucracy indicators—53%;
Organizational: (43) Customers’ brand awareness—53%, (26) A company’s location—54%.
The above results prove the following rule: the lower a company’s competitive position, the greater the significance of the internal factors of building competitive advantage: experience in the industry, specialised knowledge, openness to change, the acquaintance with and use of modern management methods and concepts, adaptability, self-financing ability, profitability, and employee loyalty, including employee retention through an appropriate system of incentives (apart from the price of products/services—the most frequently indicated factor) (
Figure 9).
The analysis of micro, small and medium entities from the perspective of the major sources of competitive advantage, covering two distinct groups (a relatively low and average competitive position (A), and a relatively high and very high position), is also based on the Kruskal–Wallis test—
Table 2.
The results indicate that among companies declaring a relatively low and average competitive position (A), only market- and product-related sources of competitive advantage represent considerable differences between micro, small, and medium entities. Medium companies attribute considerably greater significance to market- and product-related sources of competitive advantage than micro businesses. The impact of these factors is slight. The analysis of companies with a high and very high competitive position (B) (apart from financial factors) indicates that medium entities achieve better results in gaining competitive advantage resulting from such factors as market, product, technology, politics and law, organization, and employees than micro businesses. The impact of particular factors is greater for enterprises declaring a high competitive position.
The analyses also present an assessment of the major groups of the sources of competitive advantage in micro, small, and medium entities declaring a low and high competitive position. For this purpose, we use the Friedman one-way test (
Table 3).
The Friedman variance analysis indicates that micro, small, and medium entities declaring a high and very high competitive position (B) differ considerably in terms of the sources of competitive advantage. The impact of these factors is slight, and only small entities at the level of central tendency attribute greater importance to technological factors as the sources of competitive advantage than financial factors. The other comparisons do not show significant differences. In the case of micro and medium entities declaring a relatively low and average competitive position (A), differences between the main areas of comparison are considerable. Differences in the group of medium companies are insignificant. The post hoc analysis indicates that micro businesses attribute greater importance to product- and technology-related sources of competitive advantage than to financial and political and legal factors. The impact of factors for entities declaring a low competitive position is greater than for those with a high competitive position, but it is still slight.
The analysis of the results indicates that micro, small, and medium companies do not show considerable differences in terms of their declared competitiveness in 2008–2013, 2014–2019, and 2020. The impact of effects for the indicated comparisons is moderate and high. On the domestic market, medium companies differ in terms of their declared competitiveness. The impact of this effect is moderate, but the post hoc analysis does not point to any significant pair-comparison differences. A moderate impact is also recorded for micro businesses. Additionally, the conducted research shows that domestic micro businesses differ in terms of their declared competitiveness in the analysed periods. The results of the post hoc analysis indicate that micro businesses declare a higher level of competitiveness in 2014–2019 and 2020 than in 2008–2013.
5. Conclusions
The presented literature review shows that corporate competitiveness should be considered as a result-related category, determined by companies’ short-, mid-, and long-term operations. A company’s overall competitive advantage is determined by its business strategy and adopted competition instruments, but in many cases, competitive advantage is affected by a long-term plan modified in response to changes in its internal and external environment, interpreted as opportunities. The literature review confirms the first research hypothesis: the competitiveness of small business companies is determined by their qualitative features as well as by the adopted management system, which was verified on the basis of social science research methods in the field of analysis and the critique of literature of such as authors as Skat-Rørdam [
22], Łobos and Sus-Januchowska [
21], and Krupski [
23], as well as analysis and logical construction. In the practice of small business operations management, systems do not correspond to classical descriptions of strategic management offered by the literature, in which management is based on a strategic pyramid focused on a company’s vision, mission, and long- and short-term goals. Strategic activities in such entities are driven not by a clearly defined vision and mission but rather a “leading goal”, or “a strategic intention”, corresponding to the major creators of competitiveness. The fact that these companies do not fit the rigid patterns of classical strategic management also results from such qualitative characteristics as openness, flexibility, and agility.
The results of the qualitative research study lead to the conclusion that the analysed SME furniture manufacturers in Poland do not, generally, apply sustainability management tools in the form of formalised and developed environmental management tools or OECD Sustainable Development Tools, directly designed for small business companies. Most initiatives undertaken by SMEs are one-time pro-ecological solutions aimed to satisfy companies’ needs (e.g., related to energy) or to cut costs. Therefore, they cannot be regarded as resulting from intentional and integrated environmental management systems within the framework of the concept of a circular economy. SME entrepreneurs are aware of the necessity of pro-ecological initiatives, which, however, are hindered by inadequate financial resources accompanied by a lack of systemic solutions and support at the industry and local government levels. This research study indicates that despite the identified gaps in sustainability management, there are examples of good business practices in the rational use of wood waste and wood used products in the manufacture of wood-like products, windows, worktops, etc., or the use of industrial waste in the production of energy -efficient briquettes, and implementing new business models and processes based on integrated cluster networks or team undertakings.
The results of the quantitative analysis of SME furniture manufacturers’ competitive position in Poland lead to the following conclusions:
In the entire analysed period, i.e., in 2008–2020, the overwhelming majority of micro, small, and medium companies declare a low or average competitive position—70% of micro entities, 67% of small companies, and 68% of medium enterprises,
The competitive position of small companies in the analysed periods changes in a different way than in micro and medium entities: in 2014–2019, it deteriorates as compared with the crisis of 2008–2013—fewer companies declare a high and very high position. In 2020, unlike micro and medium companies, small companies declare a slightly better position which is similar to that recorded in 2008–2013.
The results of taxonomic analyses indicate that in 2008–2013, and in 2020, the degree of similarity of the structures of the analysed entities by size is moderate, with the greatest similarities recorded for small and medium companies (similarities become greater in the compared periods). A positive trend is observed in micro entities—their share in the group of companies declaring the lack of competitiveness decreases by nearly 2 percentage points, while the share of entities with the highest competitive position increases among small companies (by 1 percentage point) and medium entities (more than 1 percentage point).
The analysis of the particular sub-periods may suggest that micro and medium companies, as compared with small entities, are characterised by a different degree of adaptability to market changes. In the periods of economic prosperity, micro and medium companies take over some parts of the market share belonging to small entities, and vice versa. This points to the necessity of conducting further studies of micro and SME companies—the entities that shape their markets.
The analysis indicates that in 2008–2020, micro, small, and medium companies identify the following sources of competitive advantage: experience in the industry, the price of products/services, product quality, employees’ qualifications, a company’s specialised knowledge, and building lasting customer relationships. Differences are recorded in the frequency of the indicated sources of competitive advantage in two groups of entities identified on the basis of their declared competitive advantage and company size:
Companies declaring a low or average competitive position (A), regardless of their size, most frequently indicate the following sources of competitive advantage: experience in the industry, the price of products/services, product quality, employees’ qualifications, and equity. The remaining factors point to similar indications in the group of micro and small companies (a company’s specialised knowledge, building lasting customer relationships, economic prosperity, and focus on specialised activities). Employee loyalty is indicated as the most frequent source of competitive advantage only by micro businesses, while such factors as openness to change, new management concepts, flexible structures, and a company’s technical conditions are only indicated by medium entities;
Companies with a high or very high competitive position (B), similarly to entities with a lower position and regardless of size, indicate the following major sources of competitive advantage: the price of products/services and the quality of products/services. The remaining factors are frequently identical with those indicated by micro and medium entities: experience in the industry, employees’ qualifications, building lasting customer relationships, and product improvements. Specialised knowledge as a source of competitive advantage is frequently indicated only by small and medium companies. The remaining most frequently indicated factors vary depending on company size in this group of entities.
The obtained results also indicate that the most frequently indicated sources of competitive advantage, independently of company size and the declared competitive position, relate to companies’ organizational structure. The least frequently indicated sources of competitive advantage, regardless of company size and the declared competitive position, are as follows: foreign capital financing opportunities and EU co-financing (financial factors).
The results of the Kruskal–Wallis verification test show that in the group of companies declaring a low and average competitive position (A), micro, small, and medium companies record considerable differences only with regard to market- and product-related sources of competitive advantage. The analysis of entities with a high and very high competitive position (B)—apart from financial sources of competitive advantage—indicate that medium companies attribute greater importance to such factors as market, product, technology, politics and law, organization, and employees than micro businesses. The impact of effects is greater for entities declaring a high competitive position. Simultaneously, the Friedman variance analysis shows that micro, small, and medium companies with a high and very high competitive position (B) differ considerably in terms of the declared competitive position. The impact of effects is moderate, and only at the level of central tendency do small companies attribute greater importance to technological factors than financial ones as a source of competitive advantage. The remaining comparisons are insignificant. Micro and small companies declaring a relatively low and average competitive position (A) differ considerably in the main areas of comparison. In the case of medium entities, differences are insignificant. The post hoc analysis of micro businesses shows that products and technologies as the sources of competitive advantage are more significant than financial and political and legal factors. The impact of the effect for companies with a low competitive position is greater than for entities declaring a high position, but it remains moderate.
The presented results indicate a partially positive verification of the second research hypothesis: the sources of competitive advantage in the particular groups of SMEs by size are not highly diversified, with a larger number of medium entities attributing their competitive advantage to qualitative rather than quantitative measures. The first part of the hypothesis is positively verified–the sources of competitive advantage in the particular groups of entities by size are not highly diversified. The second part of the hypothesis is positively verified only for medium companies with a relatively high and very high competitive position (medium companies with a relatively low and average competitive position—group A—indicate both qualitative and quantitative sources of their competitive advantage). It is confirmed by the three most significant indications of group B entrepreneurs in the entire period of 2008–2020, related to such sources of competitive advantage as building lasting customer relationships, a company’s specialized knowledge, and product quality.
Concluding the above considerations concerning competitiveness and sustainability management in small business companies, it should be noted that in the face of continuous changes in the business environment, related to business cycles and economic crises, gaining overall competitive advantage in such areas as potential, strategy, and competition instruments as well as a competitive position is a challenging task. It requires a systemic and holistic approach, in which a strategic intention is implemented through taking advantage of current and future opportunities (potential customers and their needs, future demand, and products/future supply). However, the sustainable character of any undertakings is based on specific foundations:
Natural capital as an intrinsic value;
Social capital, expressed by identity and unchanging values in a changing reality;
Economic capital, expressed, among other things, by the economics of values.
The obtained results, based on a literature review in the field of competitiveness, sustainable management in small business enterprises, combined with the authors’ qualitative and quantitative research of furniture manufacturers, may stimulate further research studies and analyses in the area of corporate sustainability and innovation in SMEs.
It should also be indicated that the research carried out is particularly important due to the neglect of the topic of the competitiveness of small enterprises in the current research on sustainable development. The role of authors’ research in the competitiveness of small enterprises, taking into account the specificity of their operation and management, is helpful in understanding contemporary socio-economic challenges. Thus, this article fills the cognitive gap that exists in the given topic. The multi-stage study was conducted on relatively large (mainly quantitative) purposive research samples. This enabled the comparison of the levels of the competitive advantage achieved in various large groups of enterprises.
In addition to a comparative analysis of several categories of furniture companies in terms of 56 general factors of competitiveness, the authors’ study was conducted with the help of a taxonomy of structure analysis. It was carried out on the basis of the measure of structural similarity in terms of the competitive position declared by economic entities of various sizes. In other words, the study presents a method of calculating measures of structural similarity. The use of the above methods allowed for the analysis of internal homogeneity and differences between enterprises of various sizes. Additionally, the Kruskal–Wallis test for independent analyses and a one-way Friedman analysis of variance for dependent data were performed.
In the authors’ opinion, the importance of this research for management sciences also lies in the systematization of the existing research in the field of competitiveness of small, medium, and large enterprises in the context of sustainable management. A clear presentation of the results is illustrated by three schemes that take into account the complexity of the studied issue:
A diagram showing the measures and time framework of companies’ competitiveness management in the context of their environment (
Figure 1);
A diagram of a dialectic structure of a strategy in the context of the changeability and dynamics of contemporary companies’ environments (
Figure 2);
A diagram of sustainable competitiveness management in small business companies, a model approach based on mind mapping (
Figure 3).
Future research ought to deepen the interpretation of the results obtained through empirical research. The limitations of the article did not allow for a more detailed explanation of the reasons for the interdependencies and regularities identified in the study. For example, questions remain open as to whether large enterprises are more resistant in comparison with small business to events such as a pandemic (the study shows that they have improved their market position in relation to small business furniture manufacturers) and forecasting recession in the European economy. In the future, it is also worth explaining why SMEs, depending on the market situation, have slightly different adaptation abilities (they show different levels of flexibility to the market conditions).


 ,
, 


