
Research on the Spatial Agglomeration of Commodity Trading Markets and Its Influencing Factors in China


1
School of Economics and Management, Zhejiang Normal University, Jinhua 321004, China
2
Institute of Urban Development Research, Zhejiang Normal University, Jinhua 321004, China
*
Author to whom correspondence should be addressed.
Sustainability 2022, 14(15), 9534; https://0-doi-org.brum.beds.ac.uk/10.3390/su14159534
Submission received: 6 June 2022
/
Revised: 18 July 2022
/
Accepted: 27 July 2022
/
Published: 3 August 2022
(This article belongs to the Special Issue Contemporary Issues in Applied Economics and Sustainability)
Abstract
:Spatial agglomeration, as a phenomenon of commodity trading markets, reflects regional economic development in China. This study explores the spatial agglomeration of commodity trading markets and analyzes its influencing factors. Based on the panel data of 30 provinces in China from 2010 to 2019, this article first calculated the location quotient of the transaction volume of commodity trading markets and analyzed their temporal and spatial trends. Finally, a spatial econometric model was used to conduct an empirical examination of the influencing factors determining the spatial agglomeration of commodity trading markets. The results show that the agglomeration pattern of China’s commodity trading markets has changed significantly from 2010 to 2019. In terms of geographic variations, we discovered that the eastern region has a higher degree of commodity trading market concentration than the central and western regions. In terms of influencing factors, this study found that the level of economic development, the degree of openness, and the development of private industrial enterprises still positively affect the spatial agglomeration of commodity trading markets. However, the level of social consumption has no significant impact. Based on these findings, this article puts forward relevant policy recommendations to promote the further development of China’s commodity exchange market.
1. Introduction
Commodity trading markets are fixed trading places that aim to reduce the transaction costs and facilitate the gathering and dispersion of commodities. After the economic reform and opening-up, China’s commodity trading markets developed rapidly and have become an essential organizational format of commodity circulation. These markets play a significant role in the circulation of daily necessities and the materials required for production and construction. Moreover, they play a vital role in activating the practices of commodity circulation, facilitating residents’ life, expanding urban and rural employment, and promoting local economic development. In some regions, redoubling commodity trading markets have become an essential pillar for the economic development and prosperity of local markets. Meanwhile, commodity trading markets are also an important source of local government finance and taxation.
There is little research on the commodity trading markets in developed countries, because such markets have been replaced by other commercial formats and have declined. The relevant research includes a development model and the dynamic evolution of commodity markets [1], the structure of commodity markets [2], the development cycle of commodity markets [3], the challenges faced by retail multinational corporations in e-commerce [4], adjustment of the retail structure and consumer choice behavior [5], and specialized markets and corporate behavior [6]. International academicians have become more interested in commodity markets (oil, etc.) in recent years. More emphasis was placed on risk contagion effects and the dynamic dependence of commodity prices (oil) on financial markets by Wen et al. [7]. The correlation between commodity prices (oil) and geopolitical and trade policy was researched by Yang et al. [8]. Contrarily, commodity markets such as those for agriculture and precious metals are more developed in India. Pradhan et al.’s [9] investigation of the connection between India’s commodity markets, finances, and futures markets was based on this. Forecasting the price of agricultural commodities based on volume and diesel price helps agriculturists, as well as agricultural mandis, in India [10]. According to the aforementioned findings, it is less understood how commodity trade markets, particularly the departmental stores, are distributed overseas.
The commodity markets in the ethnic and mountainous areas (EMMAs) in Vietnam were examined by Trinh et al. [11] utilizing secondary data collection techniques. Of course, other researchers have also looked into this pattern of commodity markets. However, the aforesaid studies were regionally restricted and did not examine the dispersion of commodity markets on a national scale.
As a major institutional innovation in China, commodity trading markets have attracted significant attention from domestic academic circles. The relevant research results focus on the formation mechanism, development characteristics, development stage, and development trend of commodity trading markets, the interactive relationship between commodity trading markets and industrial clusters, and the promoting effect of specialized markets on regional development [12,13,14,15,16,17,18,19,20,21,22,23,24]. In studying the spatial distribution of commodity trading markets, Shi and Zhang [25,26] measured the spatial agglomeration and specialization of China’s large-scale commodity trading markets. The subjected study found that large-scale commodity trading markets tend to concentrate on the eastern regions and big cities. This shows that the level of urbanization plays a significant role in developing commodity trading markets, while the degree of industrial agglomeration and the development level of the individual and private economy is not significant. Furthermore, it confirms a significant correlation between market density, market size, and the level of national economic development. Zhang and Ning [27] also measured the spatial disparities in the development of China’s commodity trading markets and proposed that the relative disparities in China’s commodity trading markets have increased and the spatial distribution shows a centralized pattern. They also analyzed the causes of such disparities in the vistas of economy, policy, location, and foreign trade. For the first time, Xiang and Ni [28] analyzed the spatial agglomeration phenomenon of small commodity markets from the perspective of new industrial distinction. Then, Xiang argued that the spatial agglomeration phenomenon of small commodity markets also has the characteristics of industrial agglomeration in a new industrial zone. In Zhejiang Province [29], the most developed commodity trading market, the commodity trading market space also shows unevenness and evident agglomeration. Based on data from provincial units, Jiang et al. [30] found that path dependence, geographical environment, technological shocks, and opening history are the main mechanisms of spatial and temporal differences in market strength regarding factors influencing the spatial distribution of commodity trading markets. Guo [31] tried to study the overall differences in China’s commodity trading markets and the trends of changes from regional differences. He found that the influence of the urbanization rate in the eastern region, total export–import volume, and turnover volume of freight traffic are relatively significant. The total export–import volume in the central provinces has the most significant impact on commodity trading markets. In the western region, government expenditure, urbanization rate, and turnover volume of freight traffic have the greatest influence on commodity trading markets.
On the whole, China lacks recent research on the spatial agglomeration of commodity trading markets and the consideration of regional heterogeneity, and analysis of its formation causes is still incongruous, despite the booming development of its commodity trading markets over the past ten years. On a national level, studies have generally employed time series data for analysis and most of them have retained a theoretical perspective. Prior studies have concentrated on developed regions such as the Yangtze River Delta. The current state of China’s commodity trading markets was examined in this study, along with regional differences and the most recent distribution of these markets. This research offers a thorough investigation of the causes for the clustering of commodity trading markets from a fresh perspective. Previous studies have not examined influencing elements from a unified standard. In terms of empirical analysis, this research utilized a geographical measure that considers the heterogeneity among regions, in contrast to earlier studies. In summary, this study used location quotient, spatial autocorrelation, and the spatial Dubin model to analyze the temporal and spatial trends of China’s commodity trading markets and to also explore its influencing factors.
2. Materials and Methods
2.1. Data and Variables
The focus of the current study was China’s commodities exchange markets, which represent a significant institutional innovation that has occurred since China’s reforms and opening up. Although the study of commodity trading markets would be more prominent at the county and city levels, this study instead looked at the spatial distribution of commodity trading markets at the provincial level due to the dearth of statistical information on county and city commodity trading markets. The paucity of data in Tibet and other locations prevents them from being counted, according to data that are currently available. Finally, 30 provinces were used as the research subject in this investigation. In this study, the researchers selected the location quotient of the transaction volume to measure the spatial agglomeration of China’s commodity trading markets. To some extent, this measure reflects the degree of agglomeration in space. Regarding the subject matter under study, a series of socioeconomic indicators were selected for correlation analysis when studying the influencing factors of spatial aggregation. These indicators include GDP, export volume, expressway network mileage, the total profit of industrial enterprises above the scale of private enterprises, and retail sales of social consumer goods (Table 1). GDP represents the level of economic development of a province. Economic growth facilitates commodity trading and, thus, drives the development of commodity trading markets, thus resulting in GDP being one of the factors affecting the development of commodity trading markets. The higher the level of openness, the more rapid the flow of commodities in the international arena, and the flow of factors also drives the scale of trade. The comparative advantage of commodities in the region causes commodity trading markets to develop very rapidly. Moreover, a representative indicator of the openness is the total amount of imports and exports. Similarly, transportation accelerates the flow of commodities between regions, and convenient transportation conditions promote the diffusion of factors, reduce time and production costs, and facilitate the development of commodity trading markets. An indicator reflecting the convenience of transportation is expressway network mileage. The majority of goods produced in China’s commodity markets are daily necessities, so private enterprises promote the development of commodity markets to a certain extent, and they also promote the flow of goods between regions. Therefore, we chose the total profit of industrial enterprises above the scale of private enterprises to measure it. Furthermore, people’s demand for commodities is reflected in the degree of social consumption. The demand for commodities will increase as people’s ability to consume increases, which will encourage commodity trade. Consequently, we chose to consider the retail sales of social consumer goods.
A model was established with these five indicators as the explanatory variables and the commodity trading market turnover as the explained variables. The research data for spatial agglomeration analysis come from the Statistical Yearbook of China’s Commodity Trading Markets and the China Statistical Yearbook from 2010 to 2019. The administrative zoning vector data were obtained from the National Basic Geographic Information Center (http://www.resdc.cn, accessed on 1 April 2022). Research data on the influencing factors of commodity trading markets were obtained from the Economic Prediction System (EPS) Data Center (https://www.epsnet.com.cn, accessed on 20 March 2022). This article took 30 provinces in China as the research object. Due to a lack of data, Tibet was not included.
2.2. Research Framework and Methodology
2.2.1. Location Quotient
There are many methods with which to measure industrial spatial agglomeration, such as the location quotient, Isard index, Herfindahl index, and Locational GiniCoefficient. This article used the location quotient to measure the level of spatial agglomeration in China’s commodity trading markets, according to the following equation:
where Xi (i = 1, 2, 3, …, 30) refers to the total amount of commodity market transactions in province i (region); GDPi represents the regional GDP of province i (region); n is the number of China’s provinces (regions) studied in this article; Qi is the location quotient of province i (region). The larger the Qi, the more developed the commodity trading markets in the province (region). Meanwhile, the smaller the Qi, the more underdeveloped the commodity trading markets in the province (region).
2.2.2. Global Spatial Autocorrelation
The global spatial autocorrelation index (Global Moran’s I) is mainly used to explore the spatial characteristics of attribute values exhibited in the overall research area. Many indicators and methods can be used to measure global spatial autocorrelation, including Moran’s I index, Geary’C index, and Getis’G index. The measurement index selected in this article was Moran’s I index, with a range of value of [−1, 1]. An index value greater than 0 means that the positive spatial correlation and the observed attributes are clustered in space. Meanwhile, the closer the value is to 1, the stronger the positive correlation. An index value less than 0 indicates a negative spatial correlation. The observed attributes are in a discrete state in space. The closer the value is to −1, the stronger the negative correlation. The specific equation is as follows:
where n represents the number of research objects; Xi and Xj represent the observations of samples i and j; is the mean of the sample; Wij represents the spatial weight matrix. The value of Wij is 1 when regions i and j are adjacent, or 0 when regions i and j are not adjacent. The value of the index is generally between (−1, 1); if it is greater than 0, it indicates a positive correlation, i.e., high values are adjacent to high values and low values are adjacent to low values. Meanwhile, if it is less than 0, it indicates a negative correlation, i.e., low values are adjacent to high values. Lastly, if the Moran index is close to 0, it means that the spatial distribution is random and there is no spatial autocorrelation.
2.2.3. Local Spatial Autocorrelation
The local spatial autocorrelation index measures the local spatial correlation and the spatial difference between each region and the surrounding regions. The spatial distribution law can be studied using Moran’s scatterplot. Local Moran’s I (LISA) statistics are generally used to measure local spatial autocorrelation. The equation is as follows:
In the equation, represents the variance. The Observations of the observed unit i and adjacent units are relatively high and belong to a high agglomeration. If Ii is significantly positive and Zi is greater than 0, and if Ii is significantly positive and Zi is less than 0, it indicates that the observations of the observed unit i and adjacent units are relatively low, belonging to low agglomeration. When Ii is significantly negative and Zi is greater than 0, the surrounding units’ observations are much lower than those of the observed unit i, belonging to a high–low agglomeration. If Ii is significantly negative and Zi is less than 0, the observed value of the surrounding adjacent units is much higher than that of the observed unit I, belonging to low and high agglomeration.
2.2.4. Spatial Econometric Model
This article used a spatial econometric model that focuses on the basic panel data, which is mainly divided into the spatial lag model (SLM) and the spatial error model (SEM). The spatial Dubin model (SDM) is based on the two models, with the addition of the spatial lag term of the explanatory variables, which optimizes the above two models to a certain extent.
(1) Spatial lag model (SLM). This model mainly discusses whether the explained variable Y is influenced by its neighborhood in one region (spatial spillover effect):
where W represents the spatial weight matrix of the region; α is the constant term; β is the regression coefficient; ρ is the spatial lag autoregressive coefficient, which measures the spatial spillover effect of the explained variable in the geographically adjacent area; X is the explanatory variable; ε is the random disturbance term, subject to independent and identical distribution.
(2) Spatial Error Model (SEM). Suppose the explained variable in a certain region is also affected by a set of local characteristics and some important variables that are neglected in geographic space (called its error term). In this case, SEM indicates that the explained variable is affected by the interdependence of random error shocks of other regions. The equation is as follows:
In the equation, Φ represents the spatial autocorrelation error term, and λ represents the spatial error term autoregression coefficient and measures the degree of influence of the error term of the sample observations on the explained variable.
(3) Spatial Dubin model (SDM). If a region’s explanatory variable is influenced not only by its surrounding region, but also by its surrounding region’s explanatory variables, the lag term of the explanatory variables is added based on SLM and SEM. Then, it is called the spatial Dubin model (SDM), and the equation is as follows:
In the equation, WX represents the spatial lag variable of the explanatory variable in the adjacent area, and θ represents the spatial lag term coefficient of the explanatory variable.
3. Research Results
3.1. Spatial Agglomeration Analysis of the Commodity Trading Markets in China
From the location quotient of the transaction volume calculated by the commodity trading markets in 30 provinces (regions) from 2010 to 2019, it can be seen that the overall increase in location quotient accounted for 40% of the total. Provinces and cities that remain unchanged accounted for 30% of the total. Provinces and cities with an overall downward trend accounted for 30% of the total. These results imply apparent differences in the development of commodity markets in 30 provinces and regions in the past ten years (Table 2).
A map illustrating the shift in the location quotient of eight provinces is shown in Figure 1. We can see that Tianjin is the province that has undergone the most change; however, due to the slowing down of the city’s economic growth over the past ten years, which has had an effect on commodity trade, and because Tianjin is close to developed commodity trading regions such as Beijing, Hebei, Shandong, and Liaoning, the market there is clearly declining. The distinction lies in Xinjiang. Xinjiang has actively promoted economic development as a result of the Chinese government’s fiercely supported plan of developing the western area, and the GDP growth rate has been evident, which has sped up the circulation of commodities. Similar to other provinces in the nation, Xinjiang boasts favorable climate conditions and a wealth of resources, including dried fruits, minerals, oil, and natural gas. This region also has the quickest growth rate among all of the nation’s provinces. The development in Sichuan is similar to that in Xinjiang. Due to the wise use of their unique advantages, Guizhou, Yunnan, Qinghai, and other places have also experienced rapid development.
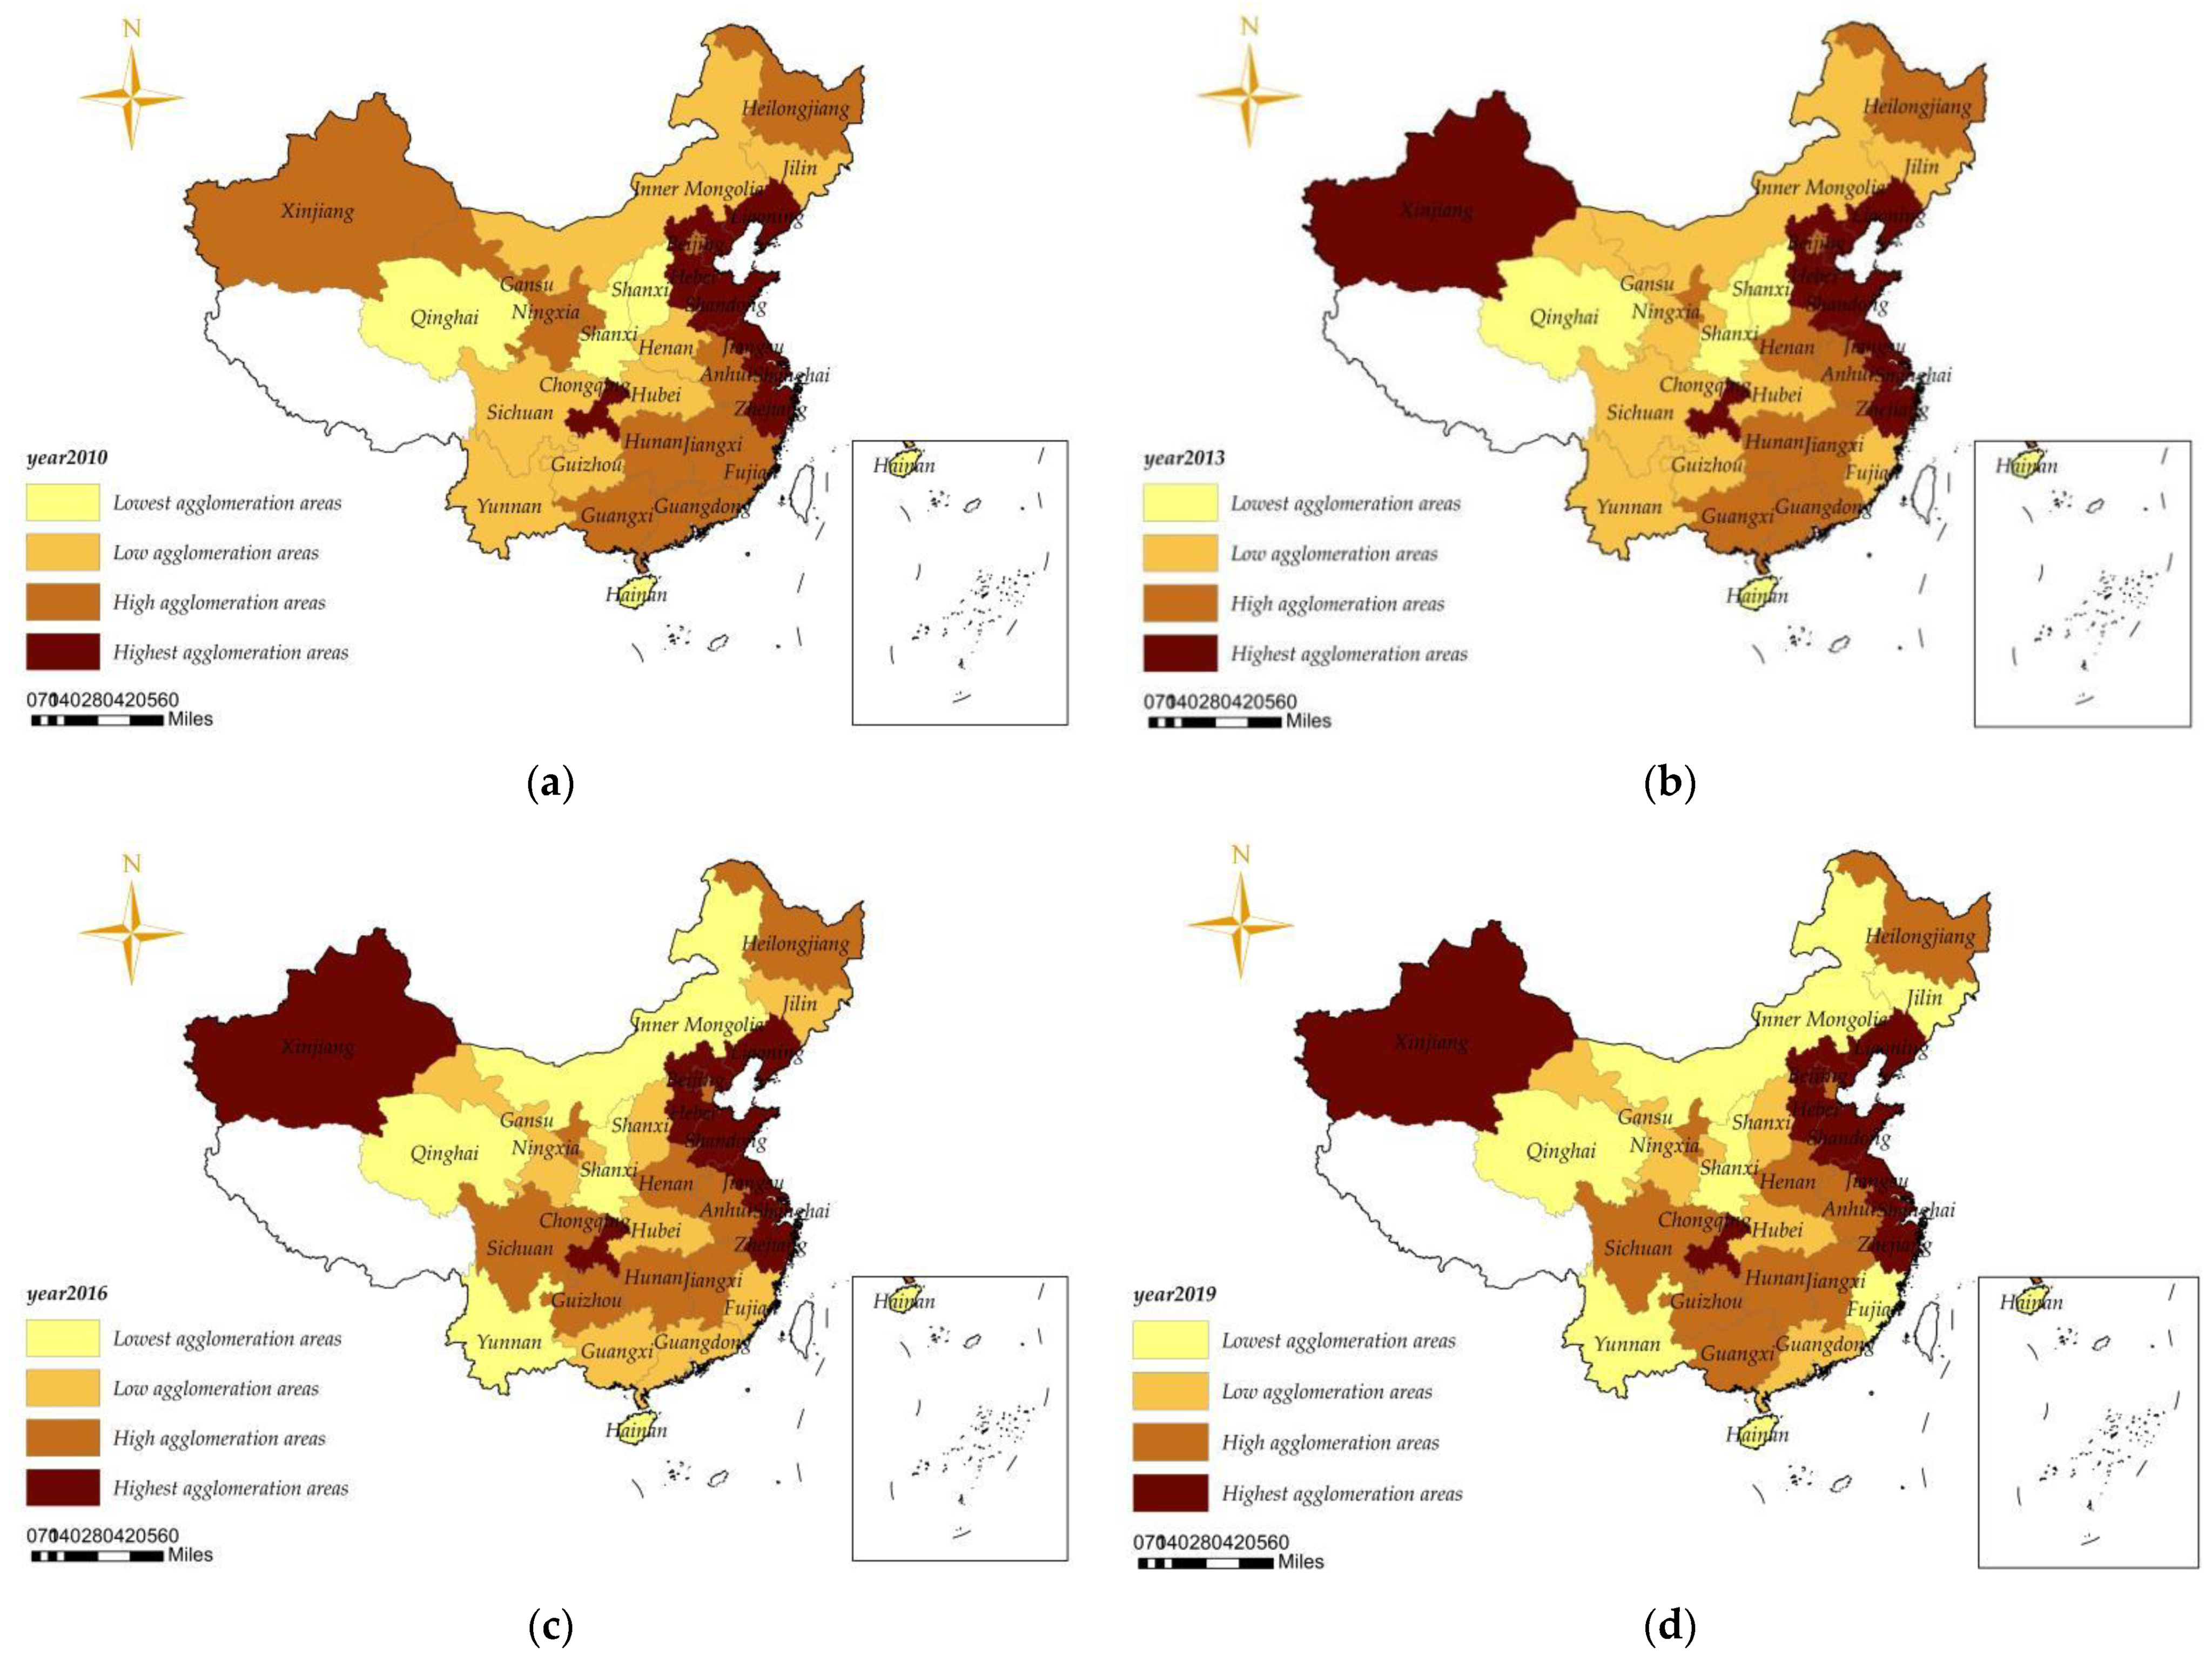
According to the size of the location quotient of the transaction volume in the commodity trading markets, the 30 provinces (regions) in 2010 and 2019 can be divided into the following four types: highest agglomeration area (Q ≥ 1), high agglomeration area (0.5 ≤ Q < 1), low agglomeration area (0.35 ≤ Q ≥ 0.5), and lowest agglomeration area (Q < 0.35) (Table 3). Among them, significant changes occurred in Tianjin and Shandong, which decreased from highest agglomeration areas to high agglomeration areas from 2010 to 2019, while Beijing and Xinjiang increased from high agglomeration areas to highest agglomeration areas. Henan was located in low agglomeration areas in 2010 and entered high agglomeration areas in 2019. On the contrary, Shanxi and Gansu entered low agglomeration areas from high agglomeration areas in 2010. Inner Mongolia, Jilin, and Yunnan were located in low agglomeration areas in 2010 and decreased to lowest agglomeration areas in 2019. Shanxi entered the low agglomeration area in 2019 from the lowest agglomeration area in 2010. For a more intuitive understanding of ten-year changes, we used ArcGIS 10.8 to visualize the degree of agglomeration (Figure 2).
The development of commodity trading markets in various provinces (regions) in China is different, and the degree of agglomeration is also different. However, the location quotient only reflects the geographical agglomeration of the regional commodity trading markets. It cannot explain how the commodity trading markets with similar agglomeration interact. Therefore, to reveal the spatial correlation model of China’s commodity trading markets, this article further analyzed the spatial correlation of commodity trading markets using the spatial autocorrelation theory.
3.2. Spatial Autocorrelation Analysis of Commodity Trading Markets in China
3.2.1. Global Spatial Autocorrelation Analysis
This article calculated the global Moran’s I index of the location quotient in China [32,33] from 2010 to 2019 with the help of GeoDa (Figure 3). It can be seen from the figure that the global Moran’s I index of the location quotient in each year is between 0.361 and 0.446, which is greater than 0. All passed the test of significance at the level of 5%, indicating positive spatial interaction in China’s commodity trading markets at the provincial level. The overall global Moran’s I index each year increased from 0.361 in 2010 to 0.383 in 2019. It did not increase year by year, but rather fluctuated. The index reached a maximum value of 0.446 in 2012 with the largest spatial agglomeration effect, and the minimum value appeared in 2010, being 0.361. From 2012 to 2018, the global Moran’s I index decreased from 0.446 in 2012 and 0.424 in 2013 to 0.365 in 2016 and 0.293 in 2017, indicating that the spatial agglomeration effect of commodity trading markets decreased during this period. Since 2018, the global Moran’s I index has gradually increased. Overall, the spatial agglomeration effect of commodity trading markets in China increased from 2010 to 2019.
3.2.2. Local Spatial Autocorrelation Analysis
Assuming that the space is homogeneous, global autocorrelation reflects the degree of agglomeration of the whole space. The heterogeneity of each sub-region is generally ubiquitous. Local spatial autocorrelation analysis that uses Moran’s scatterplots needs to be carried out to reveal the local spatial relationship of commodity trading markets in 30 provinces (regions). Moran’s scatterplots include four quadrants. Each quadrant represents different spatial contact modes between corresponding regions and adjacent regions. The first quadrant represents high observation areas adjacent to high observation areas (HH). The beta quadrant indicates that the low observation area is surrounded by the high observation area (LH). The third quadrant indicates that the low observation value area is adjacent to the low observation area (LL). Lastly, the delta quadrant indicates that the high observation area is surrounded by the low observation value area (HL). The observation areas in the first and third quadrants have a strong spatial positive correlation, while the observation areas in the beta and delta quadrants have a strong spatial negative correlation.
According to the Moran’s scatterplot (Figure 4) of each province (region) in 2010 and 2019, there were 21 provinces (regions) in the first and third quadrants in 2019, accounting for 70% of all provinces (regions). In 2010, 24 provinces (regions) in the first and third quadrants accounted for 80% of all provinces (regions), which indicates that the spatial distribution of provincial commodity trading markets in China has a strong positive correlation. Most of the provinces in the first quadrant are located in the eastern coastal areas with developed commodity economies, such as Shanghai, Jiangsu, Zhejiang, and Shandong, while the provinces in the third quadrant are primarily located in the areas with underdeveloped commodity economies, such as Qinghai, Ningxia, and Guizhou. This indicates that the spatial agglomeration effect of China’s commodity trading markets is significant, as shown by the clustering of provinces with developed commodity trading markets (HH) and the clustering of provinces with less developed commodity trading markets (LL). Above all, the Matthew effect is significant. The specific distribution of each province (region) in the four quadrants is shown in the table below (Table 4).
3.3. Analysis of the Factors Influencing the Spatial Agglomeration of Commodity Trading Markets in China
3.3.1. Model Selection
From the previous analysis, it can be seen that there is a significant spatial agglomeration of provincial commodity trading markets in China. It is necessary to use a spatial econometric model to explore the relationship between them in order to explore the influencing factors of spatial aggregation. However, the expression form of spatial effect cannot be determined in advance. Therefore, it is essential to determine the specific model selection before performing spatial econometric regression. The estimation strategy used in this article was employed to judge whether to use the OLS hybrid model or spatial econometric model by the LM test. Then, we chose whether to use the fixed effect model or the random effect model through the Hausman specification test and judged whether to use the spatial autoregressive model (SAR), spatial error model (SEM), or spatial Dubin model (SDM) through the LR test. At last, individual fixation, time fixation, or bidirectional fixation were adopted through three effect tests based on the SDM model. The software used in this article was Stata 16.0 and the results are shown in Table 5.
According to the LM test results, the statistic of Moran’s I was 17.958 and the p-value was 0.000, rejecting the original hypothesis at the significance level of 1%, implying a spatial correlation effect. This is consistent with the previous spatial autocorrelation test. The assumption of using OLS mixed models was rejected and spatial econometric models were used. The results of the Hausman specification test showed that the p-value was 0.015. The original hypothesis of the “random effect model should be adopted” was rejected at the 5% significance level, so the fixed effect model was adopted. We conducted an LR test in order to verify whether the SAR, SEM, or SDM model was to be adopted, and the test results are shown in Table 6.
According to the LR test results, the p-value was 0.0035 and 0.0010 and therefore passed the 1% significance level test. The comparison between the SDM and SAR models and the comparison between the SDM and SEM models rejected the original hypothesis. This indicates that the SDM model cannot degenerate into the SEM and SAR models, and the SDM model was firmly selected. The purpose of regressing the three models was to compare the individual fixed-, time fixed-, or two-way fixed-effect model. The regression results are shown in Table 7. According to the results, we can see that 0.5872 > 0.5352 > 0.5297, indicating that the fitting degree of the time fixed-effect model was high, so the SDM model with time fixed effects was selected.
3.3.2. Result Analysis
In order to explore the effect of different variables on commodity trading markets, this article used the partial differential method to decompose the spatial effect of the SDM model [34,35] under time fixed effects. The results are shown in Table 8.
The results show that:
(1) GDP, which reflects the level of economic development of a province, is closely related to the development of commodity trading markets. The results of the decomposition effect showed that economic growth has a significant positive impact on the development of commodity trading markets. The direct effect of economic growth on the development of commodity trading markets was 0.523. The 1% confidence level test showed that every 1% increase in the economy directly caused the commodity trading market to grow by 0.523%. The indirect effect of commodity trading markets did not pass the 1% confidence level test, indicating that the spillover effect of commodity trading markets is trivial. That is, the role of economic growth in promoting the development of commodity trading markets has been confirmed.
(2) The development of foreign trade also plays a significant role in driving the development of local commodity trading markets. The results of the regression showed that every 0.383% increase in export volume increased the transaction volume of the commodity markets by 0.383% at the 1% significance level. Openness promotes the flow of factors, expands the trade scale, and drives regional economic growth, facilitating foreign trade development, which increases the volume of goods traded.
(3) In the final regression equation, the direct effect of highway mileage was negative. Referring to the research results of related scholars [36], this may be because the spatial block development of transportation infrastructure causes a spatial agglomeration pattern of the regional economy. The blockage is not conducive to the growth of the local economy and inhibits the development of commodity trading markets. The negative indirect effect could be explained by the theory of the negative spillover effect of transportation [37,38]. Good transportation conditions do not guarantee that the region will be able to absorb the diffusion of other regions. Cultural level, supporting services, and facilities are also essential factors that the region lack. When factors of production from other regions flow into the region, improvements in the traffic level of the dominant region will facilitate the economic growth of the dominant region, so a regional diffusion effect is difficult to achieve, or the diffusion effect is much smaller than the agglomeration or return effect in a considerable period of time. If the inter-regional economic activities are mainly manifested as agglomeration activities, transportation will have a negative spillover effect on the economic growth of other backward regions.
(4) In China’s commodity trading markets, most of the commodities traded are daily industrial consumer goods produced by private enterprises. The development level of the commodity trading markets largely depends on the development of private enterprises. From the equation, it can be seen that the direct effect of the total profits of industrial enterprises above the scale of private enterprises was 0.313, the indirect effect was 0.369, and the direct effect was 0.369–0.682, and all passed the test at the confidence level of 1%. That is, every unit increase in the total profit of industrial enterprises above the scale of private enterprises of 0.313 increased the turnover of the commodity trading markets by 0.313. The turnover of commodity trading markets in neighboring regions increased by 0.369. The reason is that the rapid development of private enterprises has resulted in commodity transactions circulating more closely in the region, and the spillover effect is obvious.
(5) The direct, indirect, and total effects of social consumption on the development of commodity trading markets were all 0, indicating no obvious correlation between social consumption level and the development of commodity trading markets. The reason is that commodity trading markets are mainly wholesale and the retail business has a limited impact on the development of commodity trading markets.
4. Conclusions and Recommendations
Based on the location quotient of the transaction volume in the commodity trading markets within and across borders from 2010 to 2019, this study analyzed the evolution trend of China’s commodity trading markets in time and space. It revealed the spatial interaction of commodity trading markets using the global spatial autocorrelation and local spatial autocorrelation methods. Finally, multiple regression equations analyzed the factors affecting the spatial agglomeration of China’s commodity trading markets. The main conclusions are as follows:
(1) From the perspective of the time dimension, the location quotient of commodity trading markets in some provinces (regions) demonstrated a shifting trend from 2010 to 2019, indicating that the agglomeration pattern of commodity trading markets in China has changed significantly. The agglomeration degree of some provinces (regions) weakened and that of others strengthened.
(2) In terms of space, the global Moran’s I index of the turnover of commodity trading markets in China from 2010 to 2019 was greater than 0, showing a wave growth trend, indicating that the spatial agglomeration effect of China’s commodity trading markets tended to strengthen, and the agglomeration degree of the commodity trading markets in the eastern region was greater than that in the central and western regions. According to Moran’s scatterplots in 2010 and 2019, the number of provinces in the first and third quadrants was significantly higher than that in the second and fourth quadrants, and the “HH” and “LL” clusters were obvious, showing a strong spatial positive correlation.
(3) The level of economic development, the degree of openness, and the development level of private industrial enterprises all positively impacted the development of commodity trading markets. These results indicate that the development of commodity trading markets is closely related to regional socioeconomic conditions, and the rise in commodity trading markets is inseparable from the soil supporting its development.
Based on the above empirical results, we should vigorously promote the development of commodity trading markets.
The construction of commodity markets in all provinces should accelerate their development according to the requirements of an expanding economy of scale, highlighting unique regional characteristics, improving business functions, enhancing positive spillover, and standardizing management to accelerate economic development. This will help to promote the sustained, rapid, and healthy development of the commodity economy in all provinces, and to further develop the pulling effect of commodity markets on the economy of all provinces. It is important to engage in overall planning, mobilize the participation of all parties, suit measures to local conditions, highlight key points and pay attention to practical results, focus on establishing and improving market regulations and various factor markets, further develop and improve market forces, vigorously develop the means of production markets, focus on cultivating a number of regional specialized wholesale markets with local characteristics, and establish an open, smooth, flexible, multiform, and multi-component market system under macro-control [39]. We suggest the following basic principles of cultivating and developing the market system:
First, the establishment of various markets should adapt to the local natural resources, economic development, traditional trade, and transportation conditions and comply with the principles of smooth business flow, logistics, and information.
Second, foreign trade should be constantly strengthened, and the development of the commodity economy should be promoted through trade.
Third, market laws and regulations and management methods should be gradually established and improved. Market construction is based on the principles of building, improving, developing, and standardizing.
Fourth, governments at all levels and relevant departments should participate in coordinating services for market construction. We need to change our mindset and perspective of solely relying on the economic scale to drive the development of specialized markets [40]. We need to have a new understanding of specialized markets and pay more attention to the development of economic quality. In the case of the bottleneck of industrial structure adjustment, relying on the information opportunity, the development mode should be changed and innovation, optimization, and upgrading of the specialized markets should be promoted.
The regional administration should vigorously enhance the actual openness of the region to promote the provincial specialized markets to the whole country and the national specialized markets to the whole world. At the same time, the provincial government should strengthen exchanges and cooperation between regional specialized markets, especially between the eastern and central and western regions, and drive the development of underdeveloped regions based on the mutual promotion of specialized markets in developed regions [41]. The stakeholders should also strive to improve the high-quality and steady development of urbanization. At the same time, the construction of infrastructure should be continuously strengthened, especially the construction of transportation, and should pay attention to the coordination between specialized markets development and urban construction, so as to make it become the two core forces to improve the transformation efficiency of specialized markets in the new era. Therefore, we must support the development of small and medium-sized private enterprises, increase the income of urban and rural residents, improve the level of social consumption, and expand the opening to the outside world, which are conducive to promoting the healthy and sustainable development of commodity trading markets.
5. Future Directions and Research Limitations
In recent years, the study of commodity trading markets has been bottlenecked. In particular, the changing situation of commodity trading markets under the new crown pandemic and the reasons for their formation need to be urgently addressed. In future research, we hope to strengthen the theoretical mechanism of the spatial distribution of commodity trading markets and to conduct a more in-depth study of commodity trading markets under the impact of the pandemic. Meanwhile, due to data limitations, we were unable to study the spatial distribution of commodity trading markets at the county and municipal levels, and, in the future, we hope to overcome this problem.
Author Contributions
Conceptualization, S.X. and H.L.; methodology, S.X.; software, H.L.; validation, H.L.; data curation, H.L.; writing—original draft preparation, S.X. and H.L.; writing—review and editing, S.X. and H.L.; visualization, H.L.; supervision, S.X.; funding acquisition, S.X. All authors have read and agreed to the published version of the manuscript.
Funding
This research was funded by the National Social Science Foundation of China, grant number 20BJY065.
Institutional Review Board Statement
Not applicable.
Informed Consent Statement
Not applicable.
Data Availability Statement
The data presented in this study are available within the article.
Conflicts of Interest
The authors declare no conflict of interest.
References
- Yeager, J. Depreciation, multipliers, and commodity market equilibrium: A pedagogical approach. Atl. Econ. J. 1997, 5, 90–91. [Google Scholar] [CrossRef]
- Berndt, C.; Boeckler, M. Geographies of circulation and exchange: Constructions of markets. Prog. Hum. Geogr. 2009, 33, 535–551. [Google Scholar] [CrossRef] [Green Version]
- Maksim, T.; Kathleen, M.C. Emergent Specializations in a Commodity Market a Multi-Agent Model. Comput. Math. Organ. Theory 2002, 8, 221–234. [Google Scholar]
- Wrigley, N.; Currah, A. Globalizing retail and the ‘new economy’: The organizational challenge of e-commerce for the retail TNCs. Geoforum 2006, 37, 340–351. [Google Scholar] [CrossRef]
- Clarke, I.; Hallsworth, A.; Jackson, P.; De Kervenoael, R.; Del Aguila, R.P.; Kirkup, M. Retail Restructuring and Consumer Choice 1. Long-Term Local Changes in Consumer Behaviour: Portsmouth, 1980–2002. Environ. Plan. 2016, 38, 25–46. [Google Scholar] [CrossRef]
- Athreye, S.S.; Keeble, D. Specialized Markets and the Behavior of Firms: Evidence from the United Kingdom’s Regional Economies. Int. Reg. Sci. Rev. 2002, 25, 38–62. [Google Scholar] [CrossRef]
- Wen, F.; Liu, Z.; Dai, Z.; He, S.; Liu, W. Multi-scale risk contagion among international oil market, Chinese commodity market and Chinese stock market: A MODWT-Vine quantile regression approach. Energy Econ. 2022, 105957. [Google Scholar] [CrossRef]
- Yang, C.; Niu, Z.; Gao, W. The time-varying effects of trade policy uncertainty and geopolitical risks shocks on the commodity market prices: Evidence from the TVP-VAR-SV approach. Resour. Policy 2022, 76, 10261. [Google Scholar] [CrossRef]
- Radhan, R.P.; Hall, J.H.; Du Toit, E. The lead–lag relationship between spot and futures prices: Empirical evidence from the Indian commodity market. Resour. Policy 2020, 70, 101934. [Google Scholar] [CrossRef]
- Suresha, H.P.; Mutturaj, U.; Krishna, K.T. Indian Commodity Market Price Comparative Study of Forecasting Methods—A Case Study on Onion, Potato and Tomato. Asian J. Res. Comput. Sci. 2021, 12, 147–159. [Google Scholar] [CrossRef]
- Trinh, T.T.T.; Nguyen, T.B.; Trinh, T.T.H.; Nguyen, T.T.; Dang, T.P.; Tran, T.B.K.; Nguyen, T.Y. An Empirical Study of Commodity Market Patterns in Ethnic Minorities and Mountainous Areas: Evidence from Vietnam. J. Asian Financ. Econ. Bus. JAFEB 2021, 8, 107–120. [Google Scholar]
- Lu, L.J.; Zheng, X.B. Study on Mechanism of the Interaction between Specialized Market and Industrial Clusters Based on Coevolution: Theory and Evidence. China Soft Sci. 2011, 246, 117–129. [Google Scholar]
- Wu, X. The Form Evolvement and Mechanism Analysis of Mixed-Use Settlements Based on the Specialized Market: Empirical Study on Commercial-Residential Community Under the ‘Yiwu Pattern’ of Zhejiang Province. Econ. Geogr. 2015, 35, 111–117. [Google Scholar]
- Yu, B.; Lu, L. Micro-mechanism and Empirical Analysis on Double Channel Integration Between Specialized Market and E-commerce. RD Manag. 2017, 29, 141–150. [Google Scholar]
- Jin, X.; Ke, R. An economic explanation of transaction costs for specialized markets. Econ. Res. J. 1997, 4, 74–79. [Google Scholar]
- Xie, S.; Wang, P.; Chang, M. Research on the Interactive Relationship between the Specialized Market and the Development of Urbanization in Yiwu City. Econ. Res. J. 2017, 37, 142–147. [Google Scholar]
- Peng, J. Research on the Path of Transformation and Upgrading of Professional Market from the Perspective of Customer Orientation. J. Central Univ. Financ. Econ. 2016, 36, 123–128. [Google Scholar]
- Chi, R. An Analysis of Trend of Specialty Market Based on Changed Survival Foundation. Commer. Res. 2003, 9, 167–169. [Google Scholar]
- Lu, L.; Yang, H. Market Expanding, Financial Externalities, and Regional Division. Econ. Res. J. 2007, 4, 67–78. [Google Scholar]
- Cao, R. On the Internationalization Model of specialized Market and its Innovation-Taking China Yiwu International Trade City as an Example. Econ. Theory Bus. Manag. 2008, 2, 11–15. [Google Scholar]
- Wu, Y.; Zhu, X. Accessibility, Market Segmentation and the Development of Commodity Exchange Centers. China Econmic. Q. 2011, 1, 63–82. [Google Scholar]
- Lu, L.; Yu, H.; Lu, Y. Specialized Market and Industrial Cluster: Linkage and Influential Factors. China Ind. Econ. 2011, 1, 151–160. [Google Scholar]
- Liu, N.; Ren, G. A Study on specialized Market-oriented Industry Cluster and Regional Division of Labor. Econ. Manag. 2011, 33, 24–31. [Google Scholar]
- Ma, H.; Luo, J.; Luo, R. The impact of specialized markets on regional economic development. Commer. Res. 2012, 8, 20–24. [Google Scholar]
- Shi, Y.; Zhang, X. Spatial Situation of Concentration and Specialization of Large-scale Commodity Exchange Marketscommodity trading markets in China. Acta Geogr. Sin. 2008, 4, 386–394. [Google Scholar]
- Shi, Y. Spatial Distribution and Countermeasures of Development of Commodity Exchange Marketscommodity trading markets in China. World Reg. Stud. 2005, 1, 34–40. [Google Scholar]
- Zhang, X.; Ning, Y. The Spatial and Temporal Difference and Formation Mechanism of the Chinese Commodity Trading Markets Development. Sci. Geogr. Sin. 2010, 30, 481–488. [Google Scholar]
- Xiang, Q.; Wai, N. Study on Characteristics of Spatial Concentration of Commodity Market Based on New Industrial District Theory. Commer. Res. 2010, 4, 144–148. [Google Scholar]
- Jiang, T.; Ma, L. The Spatial Distribution Characteristics of Bulk Commodities Markets in Zhejiang Province and Their Location Choice. Econ. Geogr. 2016, 7, 107–113. [Google Scholar]
- Jiang, Z.; Wang, W.; Zhu, H.; Wu, W. Comprehensive Strength and Temporal-spatial Discrepancies of Chinese Commodity Exchange Market Based on The Empirical Analysis of The Provinces. China Ind. Econ. 2016, 3, 380–386. [Google Scholar]
- Yin, G. Analysis of Regional Differences and Influencing Factors of China’s Commodity Trading Market. Master’s Thesis, Chongqing Technology and Business University, Chongqing, China, 2014. [Google Scholar]
- Liu, D.J.; Hu, J.; Chen, J.Z. The Spatial Structure and Disparities of Leisure Tourism Destination in Wuhan. Econ. Geogr. 2014, 3, 176–181. [Google Scholar]
- Deng, Y.; Li, Y.; Duan, Y.; Yu, L.; Xu, Y. Spatial Distribution Pattern and Influencing Factors of Yunnan Temple Gardens Based on GIS. J. China For. Sci. 2021, 5, 142–148. [Google Scholar]
- Ye, X.; Teng, Y.; Liu, R. Impacts of Bonded Zones and Export Processing Zones on Regional Industrial Hollowing: An Empirical Study Based on Spatial Dubin Model and Intermediation Effect Model. J. Cent. Univ. Financ. Econ. 2022, 3, 117–128. [Google Scholar]
- Yu, B.; Su, Y. How does land finance affect land-use efficiency? Dynamic space Dubin model test based on the perspective of scale and technology. Geogr. Res. 2022, 41, 527–545. [Google Scholar]
- Wang, R. Research on Effects of Transportation on Regional Economic Development in the View of Provincial Perspective in China. Ph.D. Thesis, Beijing Jiaotong University, Beijing, China, 2013. [Google Scholar]
- Pan, L.; Lin, Z. Study on Spatial Spillover Effects of Transportation Infrastructure on Regional Economic Development-Empirical Analysis Based on Spatial-temporal Data of Chengdu-Chongqing Economic Circle. Resour. Dev. Mark. 2022, 1, 53–60. [Google Scholar]
- Boarnet, M.G. Spillovers and the Locational Effects of Public Infrastructure. J. Od Reginal Sci. 1998, 3, 381–400. [Google Scholar] [CrossRef]
- Li, D.; Zhang, H.; Gao, A. Spatial Layout of Port Bulk Commodity Markets in China. Sci. Geogr. Sin. 2019, 39, 541–549. [Google Scholar]
- Wang, X.; Pan, K. Current Situation, Problems and Countermeasures of China’s Commodity Trading Market. China Bus. Mark. 2015, 29, 30–36. [Google Scholar]
- Wang, X.; Xiang, J.; Jing, L. Research on the Problems of China’s Commodity Exchange Market under the New Normality. Acad. J. Zhongzhou 2016, 229, 19–25. [Google Scholar]
Figure 1.
Changes of location quotients in several provinces from 2010 to 2019.

Figure 2.
Visualization of the agglomeration types of commodity trading markets in China. (a) 2010. (b) 2013. (c) 2016. (d) 2019.
Figure 2.
Visualization of the agglomeration types of commodity trading markets in China. (a) 2010. (b) 2013. (c) 2016. (d) 2019.

Figure 3.
Global Moran’s I index of the location quotient of provincial commodity trading markets in China.
Figure 3.
Global Moran’s I index of the location quotient of provincial commodity trading markets in China.

Figure 4.
Moran’s scatterplot of provincial commodity trading markets in China in 2010 (a) and 2019 (b).
Figure 4.
Moran’s scatterplot of provincial commodity trading markets in China in 2010 (a) and 2019 (b).


Table 1.
Indicator system of commodity trading markets.
| Indicator System | Indicators | Abbreviation | Indicator Interpretation |
|---|---|---|---|
| Location quotient | Xi | Xi | The total amount of commodity markets transactions in i province |
| GDPi | GDPi | Regional GDP of i province | |
| Factors Influencing Spatial Agglomeration of China’s Commodity Trading Market | GDP | GDP | Economic development |
| Export | Export | Degree of openness | |
| Expressway network mileage | Tran | Degree of transportation convenience | |
| Total profit of industrial enterprises above designated size | Enter | The development level of small and medium-sized private enterprises | |
| Retail sales of social consumer goods | Social | Level of social consumption |
Table 2.
The location quotient of the transaction volume of provincial commodity trading markets.
| Province | 2010 | 2011 | 2012 | 2013 | 2014 | 2015 | 2016 | 2017 | 2018 | 2019 |
|---|---|---|---|---|---|---|---|---|---|---|
| Beijing | 0.948 | 0.887 | 0.933 | 0.963 | 0.954 | 0.972 | 1.086 | 1.007 | 0.992 | 1.015 |
| Tianjin | 2.228 | 1.893 | 1.468 | 1.678 | 1.086 | 1.016 | 0.915 | 0.811 | 0.736 | 0.668 |
| Hebei | 1.305 | 1.24 | 1.206 | 1.22 | 1.329 | 1.406 | 1.429 | 1.483 | 1.502 | 1.498 |
| Shanxi | 0.312 | 0.274 | 0.258 | 0.299 | 0.349 | 0.368 | 0.39 | 0.339 | 0.324 | 0.356 |
| Inner Mongolia | 0.44 | 0.453 | 0.389 | 0.369 | 0.308 | 0.324 | 0.304 | 0.357 | 0.354 | 0.334 |
| Liaoning | 1.421 | 1.389 | 1.414 | 1.404 | 1.272 | 1.287 | 1.309 | 2.084 | 1.404 | 1.409 |
| Jilin | 0.475 | 0.498 | 0.475 | 0.425 | 0.459 | 0.462 | 0.462 | 0.387 | 0.296 | 0.327 |
| Heilongjian | 0.585 | 0.565 | 0.57 | 0.567 | 0.585 | 0.63 | 0.67 | 0.662 | 0.649 | 0.518 |
| Shanghai | 2.06 | 2.031 | 2.95 | 2.478 | 2.277 | 2.345 | 2.112 | 2.086 | 2.198 | 2.332 |
| Jiangsu | 1.618 | 1.716 | 1.7 | 1.698 | 1.701 | 1.55 | 1.604 | 1.77 | 1.856 | 1.887 |
| Zhejiang | 2.41 | 2.461 | 2.335 | 2.413 | 2.503 | 2.565 | 2.57 | 2.531 | 2.579 | 2.564 |
| Anhui | 0.747 | 0.805 | 0.787 | 0.856 | 0.773 | 0.745 | 0.756 | 0.786 | 0.742 | 0.695 |
| Fujian | 0.507 | 0.514 | 0.458 | 0.462 | 0.449 | 0.408 | 0.4 | 0.34 | 0.337 | 0.308 |
| Jiangxi | 0.752 | 0.68 | 0.656 | 0.715 | 0.456 | 0.746 | 0.825 | 0.752 | 0.765 | 0.785 |
| Shandong | 1.121 | 1.137 | 1.089 | 1.159 | 1.228 | 1.234 | 1.218 | 1.141 | 1.069 | 1.061 |
| Henan | 0.387 | 0.462 | 0.498 | 0.523 | 0.586 | 0.625 | 0.652 | 0.621 | 0.548 | 0.527 |
| Hubei | 0.445 | 0.438 | 0.479 | 0.445 | 0.479 | 0.463 | 0.487 | 0.464 | 0.413 | 0.445 |
| Hunan | 0.759 | 0.787 | 0.816 | 0.817 | 0.795 | 0.789 | 0.796 | 0.894 | 0.926 | 0.952 |
| Guangdong | 0.599 | 0.576 | 0.563 | 0.526 | 0.536 | 0.516 | 0.493 | 0.458 | 0.443 | 0.446 |
| Guangxi | 0.64 | 0.622 | 0.576 | 0.585 | 0.546 | 0.427 | 0.435 | 0.454 | 0.509 | 0.526 |
| Hainan | 0.046 | 0.044 | 0.039 | 0.038 | 0.095 | 0.097 | 0.077 | 0.072 | 0.063 | 0.25 |
| Chongqin | 1.736 | 1.759 | 1.574 | 1.541 | 1.503 | 1.472 | 1.461 | 1.351 | 1.39 | 1.403 |
| Sichuan | 0.381 | 0.431 | 0.418 | 0.492 | 0.604 | 0.627 | 0.538 | 0.572 | 0.58 | 0.578 |
| Guizhou | 0.365 | 0.395 | 0.361 | 0.357 | 0.487 | 0.45 | 0.639 | 0.619 | 0.74 | 0.811 |
| Yunnan | 0.444 | 0.461 | 0.363 | 0.355 | 0.334 | 0.284 | 0.259 | 0.239 | 0.169 | 0.176 |
| Shanxi | 0.115 | 0.133 | 0.148 | 0.147 | 0.166 | 0.267 | 0.251 | 0.314 | 0.41 | 0.303 |
| Gansu | 0.542 | 0.521 | 0.499 | 0.497 | 0.458 | 0.433 | 0.386 | 0.291 | 0.342 | 0.357 |
| Qinghai | 0.154 | 0.167 | 0.225 | 0.087 | 0.095 | 0.218 | 0.214 | 0.198 | 0.178 | 0.323 |
| Ningxia | 0.738 | 0.701 | 0.633 | 0.74 | 0.82 | 0.843 | 0.827 | 0.833 | 0.805 | 0.64 |
| Xinjiang | 0.673 | 0.713 | 0.716 | 1.007 | 1.073 | 1.333 | 1.326 | 1.517 | 1.398 | 1.358 |
Table 3.
Agglomeration types of provincial commodity trading markets in China.
| Type | 2010 | 2019 |
|---|---|---|
| Highest agglomeration areas | Shanghai, Liaoning, Hebei, Tianjin, Chongqing, Zhejiang, Jiangsu, Shandong | Beijing, Hebei, Shandong, Liaoning, Jiangsu, Zhejiang, Shanghai, Chongqing, Xinjiang |
| High agglomeration areas | Beijing, Heilongjiang, Anhui, Jiangxi, Hunan, Guangdong, Ningxia, Xinjiang, Fujian, Guangxi, Gansu | Heilongjiang, Guizhou, Henan, Ningxia, Anhui, Jiangxi, Hunan, Tianjin, Guangxi, Sichuan |
| Low agglomeration areas | Henan, InnerMongolia, Jilin, Guizhou, Hubei, Yunnan, Sichuan | Hubei, Gansu, Shanxi, Guangdong |
| Lowest agglomeration areas | Qinghai, Shanxi, Shaanxi, and Hainan | InnerMongolia, Fujian, Yunnan, Shaanxi, Qinghai, Hainan, Jilin |
Table 4.
Spatial correlation model of provincial commodity trading market agglomeration in China.
| Quadrant | Spatial Correlation Model | 2010 | 2019 |
|---|---|---|---|
| First quadrant | H-H | Shanghai, Zhejiang, Jiangsu, Tianjin, Beijing, Shandong, Hebei | Shanghai, Jiangsu, Zhejiang, Beijing, Shandong |
| Beta quadrant | L-H | Anhui, Fujian, Jiangxi, Jilin | Fujian, Jiangxi, Anhui, Tianjin |
| Third quadrant | L-L | Qinghai, Shanxi, Shaanxi, InnerMongolia, Hainan, Yunnan, Gansu, Guangxi, Guangdong, Henan, Hubei, Hunan, Heilongjiang, Sichuan, Xinjiang, Guizhou, Ningxia | Qinghai, Shaanxi, InnerMongolia, Shanxi, Jilin, Hainan, Yunnan, Gansu, Guangxi, Guangdong, Henan, Hubei, Guizhou, Ningxia, Heilongjiang, and Sichuan |
| Delta Quadrant | H-L | Chongqing, Liaoning | Hunan, Liaoning, Xinjiang, Chongqing, Hebei |
Table 5.
LM model test results.
| Test | Statistic | df | p-Value |
|---|---|---|---|
| Spatial error: | |||
| Moran’s I | 17.958 | 1 | 0.000 |
| Lagrange multiplier | 301.824 | 1 | 0.000 |
| Robust Lagrange multiplier | 65.188 | 1 | 0.000 |
| Spatial lag: | |||
| Lagrange multiplier | 245.386 | 1 | 0.000 |
| Robust Lagrange multiplier | 8.751 | 1 | 0.003 |
| Hausman specification test Prob > chi2 = 0.015 | |||
Table 6.
LR model test results.
| LR Test | Model Comparison | p-Value |
|---|---|---|
| Comparison of SDM and SAR models | Likelihood-ratio test | LR chi2(5) = 17.61 |
| (Assumption:sar_a nested in sdm_a) | Prob > chi2 = 0.0035 | |
| Comparison of SDM and SEM models | Likelihood-ratio test | LR chi2(5) = 20.49 |
| (Assumption:sem_a nested in sdm_a) | Prob > chi2 = 0.0010 |
Table 7.
Fitting results of three fixed effects.
| Type | Individual Fixed Effect | Time Fixed Effect | Two-Way Fixed-Effect |
|---|---|---|---|
| R2 | 0.5352 | 0.5872 | 0.5297 |
| Model selection | × | √ | × |
Table 8.
Spatial effect decomposition of SDM model.
| VARIABLES | Main | Wx | Spatial | Variance | LR_Direct | LR_Indirect | LR_Total |
|---|---|---|---|---|---|---|---|
| lngdp | 0.522 *** | −0.158 | 0.523 *** | −0.055 | 0.468 | ||
| (0.00) | (0.57) | (0.00) | (0.87) | (0.27) | |||
| lnexport | 0.395 *** | −0.276 *** | 0.383 *** | −0.245 ** | 0.138 | ||
| (0.00) | (0.00) | (0.00) | (0.03) | (0.28) | |||
| lntran | −0.335 *** | −0.419 *** | −0.353 *** | −0.585 *** | −0.937 *** | ||
| (0.00) | (0.00) | (0.00) | (0.00) | (0.00) | |||
| lnenter | 0.299 *** | 0.254 *** | 0.313 *** | 0.369 *** | 0.682 *** | ||
| (0.00) | (0.00) | (0.00) | (0.00) | (0.00) | |||
| social | −0.000 *** | −0.000 | −0.000 *** | −0.000 * | −0.000 *** | ||
| (0.01) | (0.13) | (0.00) | (0.07) | (0.01) | |||
| rho | 0.191 ** | ||||||
| (0.02) | |||||||
| sigma2_e | 0.217 *** | ||||||
| (0.00) | |||||||
| Observations | 300 | 300 | 300 | 300 | 300 | 300 | 300 |
| R-squared | 0.833 | 0.833 | 0.833 | 0.833 | 0.833 | 0.833 | 0.833 |
| Number of area | 30 | 30 | 30 | 30 | 30 | 30 | 30 |
Note: *** denote significance at the 1% level, ** denote significance at the 5% level, * denote significance at the 10% level.
Publisher’s Note: MDPI stays neutral with regard to jurisdictional claims in published maps and institutional affiliations. |
© 2022 by the authors. Licensee MDPI, Basel, Switzerland. This article is an open access article distributed under the terms and conditions of the Creative Commons Attribution (CC BY) license (https://creativecommons.org/licenses/by/4.0/).
Share and Cite
MDPI and ACS Style
Xie, S.; Li, H. Research on the Spatial Agglomeration of Commodity Trading Markets and Its Influencing Factors in China. Sustainability 2022, 14, 9534. https://0-doi-org.brum.beds.ac.uk/10.3390/su14159534
AMA Style
Xie S, Li H. Research on the Spatial Agglomeration of Commodity Trading Markets and Its Influencing Factors in China. Sustainability. 2022; 14(15):9534. https://0-doi-org.brum.beds.ac.uk/10.3390/su14159534
Chicago/Turabian StyleXie, Shouhong, and Hanbing Li. 2022. "Research on the Spatial Agglomeration of Commodity Trading Markets and Its Influencing Factors in China" Sustainability 14, no. 15: 9534. https://0-doi-org.brum.beds.ac.uk/10.3390/su14159534
Note that from the first issue of 2016, this journal uses article numbers instead of page numbers. See further details here.