

Acceleration and Deceleration Rates in Interrupted Flow Based on Empirical Digital Tachograph Data

Korea Institute of Civil Engineering and Building Technology, Goyang 10223, Gyeonggi, Korea
Sustainability 2022, 14(18), 11165; https://0-doi-org.brum.beds.ac.uk/10.3390/su141811165
Submission received: 5 July 2022
/
Revised: 20 August 2022
/
Accepted: 31 August 2022
/
Published: 6 September 2022
(This article belongs to the Special Issue Data-Driven Analysis and Control Methods in ITS and Accident Prevention)
Abstract
:The acceleration and deceleration rates are crucial road design reference values in terms of traffic safety. The purpose of acceleration and deceleration lanes is to reduce the speed difference between the mainline and ramp to minimize rear-end collision. Thus, in traffic safety and traffic flow operational aspects, the acceleration and deceleration lane lengths need to be long. Moreover, excessively long minimum acceleration or deceleration lane length regulations may cause hesitancy to connect new facilities with the road. Despite their relevance, acceleration and deceleration rates have not been updated for many decades. In this study, we analyze the digital tachograph data of vehicles stopped at signalized intersections at red lights and empirically deduce the acceleration and deceleration rates that reflect recent vehicle performance and driver behavior. Finally, we suggest a new corner clearance distance to safely connect the new road near a signalized intersection in urban and rural areas derived from our empirical acceleration and deceleration rates.
1. Introduction
The acceleration and deceleration rates of a vehicle are key parameters in determining the acceleration or deceleration lane length and corner clearance distance of an intersection or interchange. The purpose of acceleration and deceleration lanes is to reduce the speed difference between the mainline and ramp to minimize rear-end collision. AASHTO [1] recommended the merging speed to be within 10 km/h slower than the mainline operating speed. According to Lee [2], when the merging speed is 20 km/h or more slower than the mainline operating speed, the total delay increases more than five times. Furthermore, the regulations about the corner clearance distance from the intersection or interchanges required a sufficient offset to reduce the conflict between acceleration or deceleration vehicles from the intersection and access vehicles. Thus, in traffic safety and traffic flow operational aspects, the acceleration and deceleration lane lengths need to be long. Moreover, excessively long minimum acceleration or deceleration lane length regulations may cause hesitancy to connect new facilities with the road. When there is strict limited spare space in a highly urbanized area, it causes a dramatic increase in road construction costs. Despite their relevance, acceleration and deceleration rates have not been updated for many decades. It is argued that acceleration and deceleration rates should be changed by reflecting recently improved vehicle performance. Another opinion is that the reference values of acceleration and deceleration should be a comfortable rate rather than vehicles’ engine performance.
In this study, we analyze the digital tachograph (DTG) data and empirically deduce the acceleration and deceleration rates that reflect recent vehicle performance and driver behavior. Unlike uninterrupted flow, vehicles suffer from stop-and-go states in signalized intersections due to the various acceleration and deceleration performances between vehicle types. The vehicles approach the signalized intersection while decelerating to stop at red lights and accelerating after the lights change to green [3,4]. These acceleration or deceleration behaviors differ depending on traffic composition and driver characteristics [5,6]. Thus, this study analyzes the various type of vehicles’ DTG data whose vehicles stopped at signalized intersections at red lights to show a driver’s preference behavior when accelerating and decelerating. Finally, we suggest the corner clearance distance of a signalized intersection reflecting an empirically observed acceleration and deceleration rate.
2. Literature Review
2.1. Current Regulations about Auxiliary Lane
Regulations in South Korea on road structure and facility standards provide guidelines on the mainline and ramp designs, such as acceleration or deceleration lanes. According to MOLIT [7], most vehicles approaching a deceleration lane drive slower than the free-flow speed of the mainline. The Korean road standards consider 1.96 m/s2, which is 20% of gravity acceleration; drivers usually slow down with a comfortable deceleration rate [7]. The minimum acceleration lane length is determined by the required acceleration of vehicles. In Korean regulation, vehicle performance is based on a 13-ps/ton truck, reflecting a high vehicle composition of trucks. On level terrain, the acceleration rate of a vehicle is calculated using Equation (1), and the average acceleration to the cruising speed is shown in Table 1.
where g: gravitational acceleration (9.8 m/s2), μ: rolling friction coefficient (0.01), ε: acceleration resistance ratio (0.05), R: air resistance coefficient (0.03 kg·sec2/m4), ξ: mechanical efficiency (0.9), A: projected area (6.2 m2), W: vehicle weight (14,000 kg), BHP: engine poser (PS), BHP/W = 0.013 (PS/kg), V: free-flow speed (km/h).
Based on the Korean regulations, the minimum acceleration and deceleration lane length on level terrain is calculated using Equation (2), and the calculated values are shown in Table 2.
where L: acceleration or deceleration lane length (m), v1: decelerated speed (km/h), V1: initial speed (km/h), v2: initial speed (km/h), V2: accelerated speed (km/h), d: deceleration rate (1.96 m/s2), a: acceleration rate (m/s2, Table 1).
The American standards are similar to the Korean standards. According to ASSHTO [1], approximately two-thirds of drivers apply deceleration rates greater than 2.0 m/s2 to come to a stop line. The deceleration lane length in ASSHTO [1] is estimated based on such deceleration rates. For the acceleration lane, they consider the merging speed that is within 10 km/h of the mainline operating speed. ASSHTO’s [1] guideline could be seen that acceleration and deceleration lanes mainly depend on the design speed. The minimum acceleration and deceleration lane lengths on level terrain are presented in Table 3. The method of calculation is basically the same as that of Korea.
2.2. Current Regulations about Corner Clearance Distance from Intersection
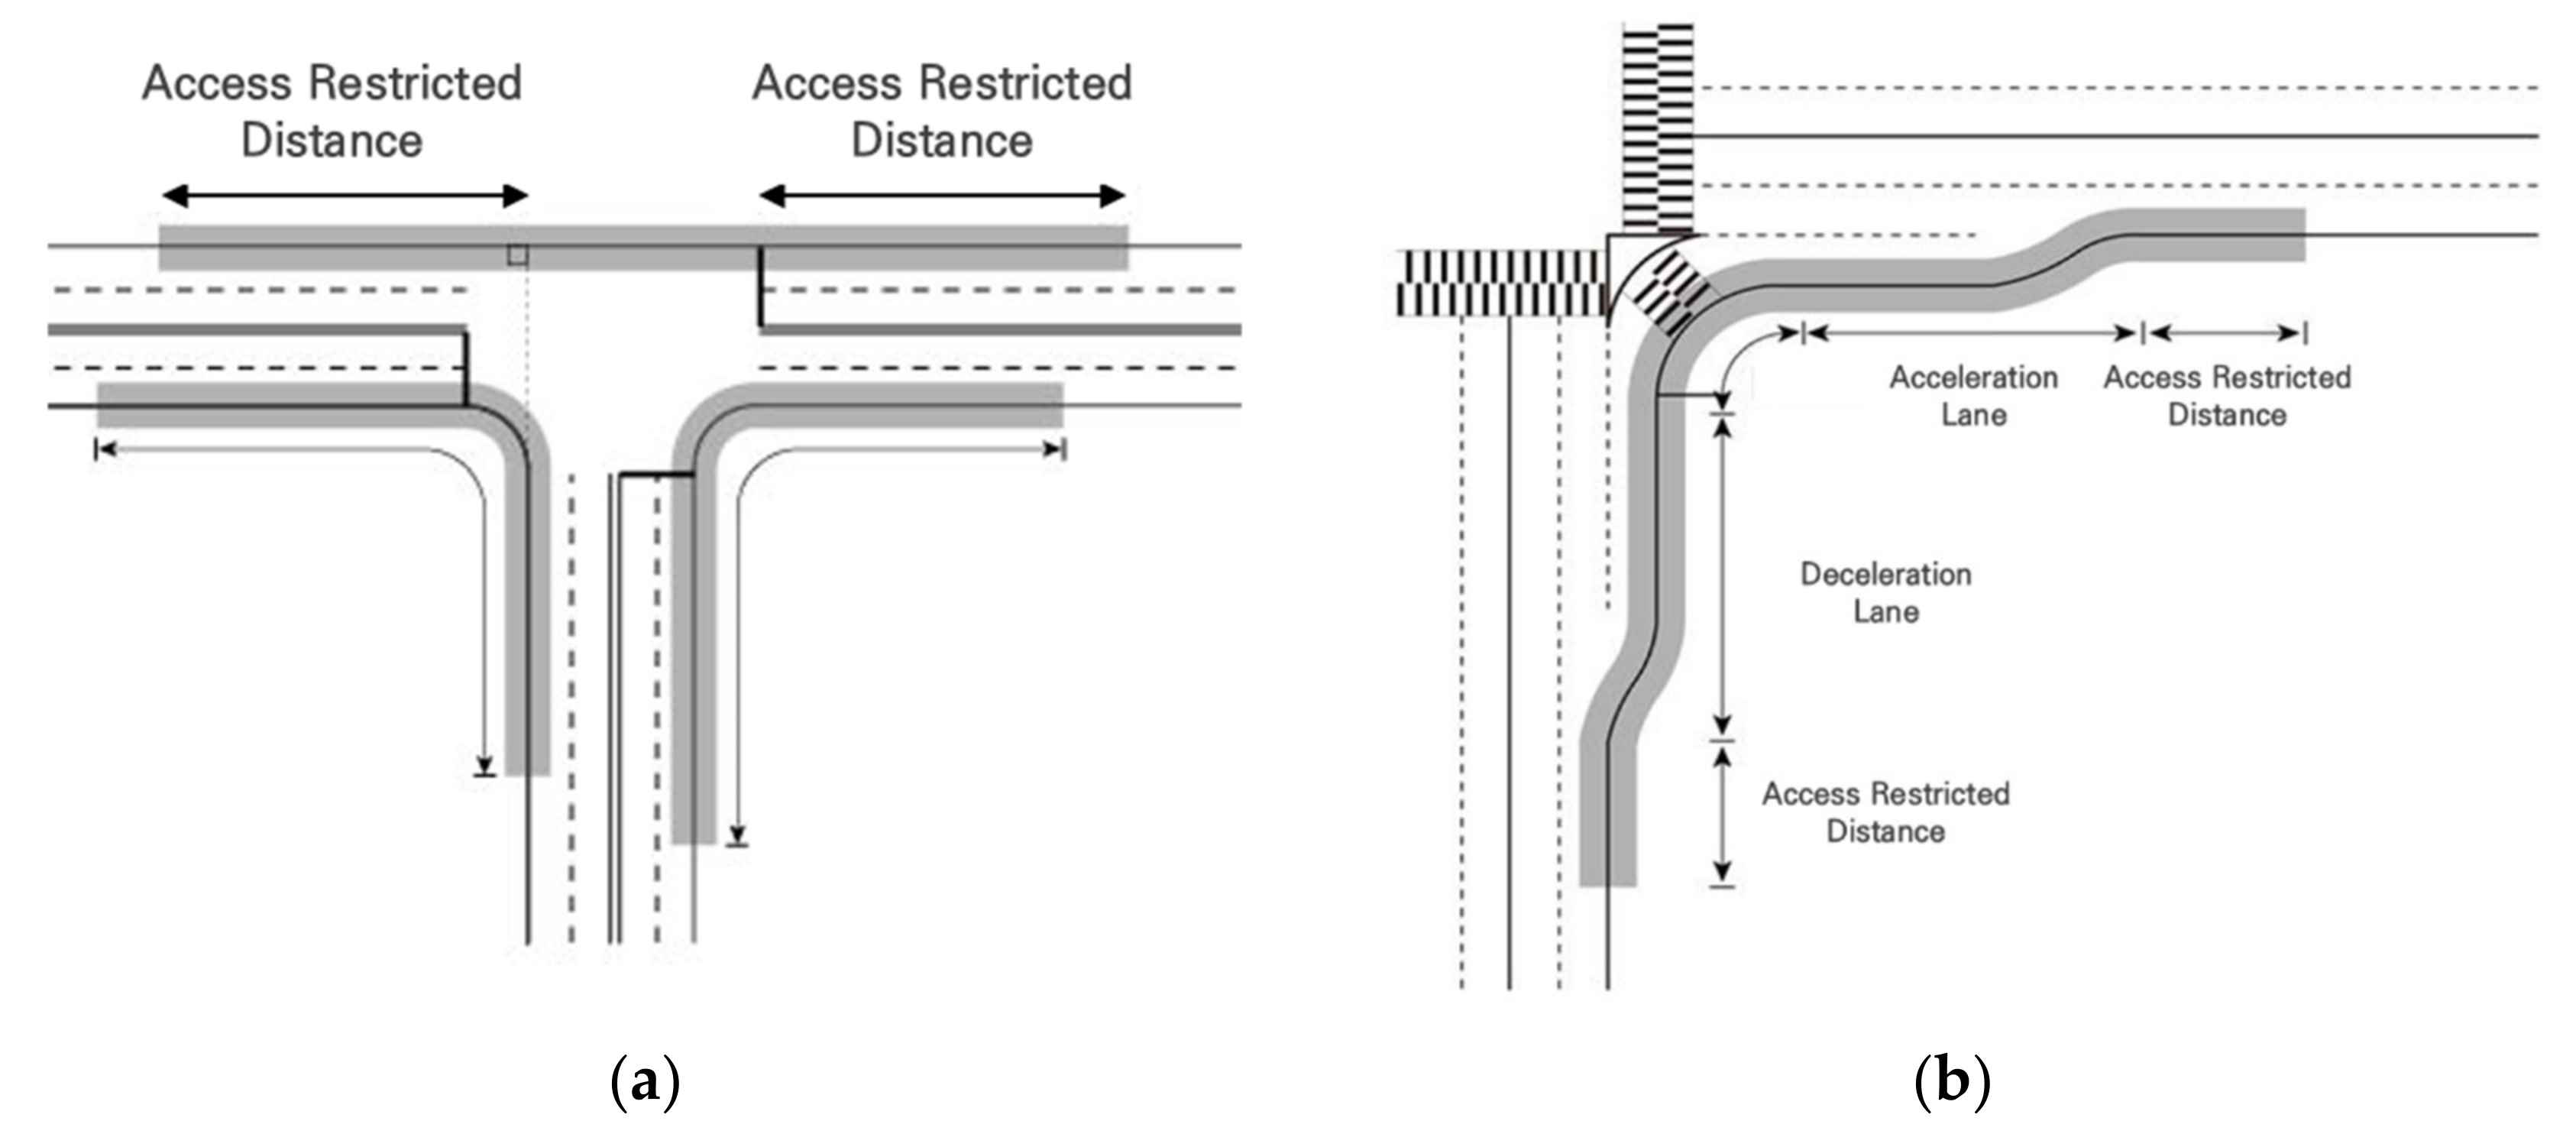
The South Korean Road Access Management Rules restrict road access from an at-grade intersection within the corner clearance distance [8]. The access-restricted area and corner clearance distance are shown in Figure 1 and Table 4. The corner clearance distance in the approaching area is settled from the stop line, and the departure area is settled from the outbound of the geometrical area of the intersection. The corner clearance distance along road design speed differs depending on urban or rural areas (Table 4).
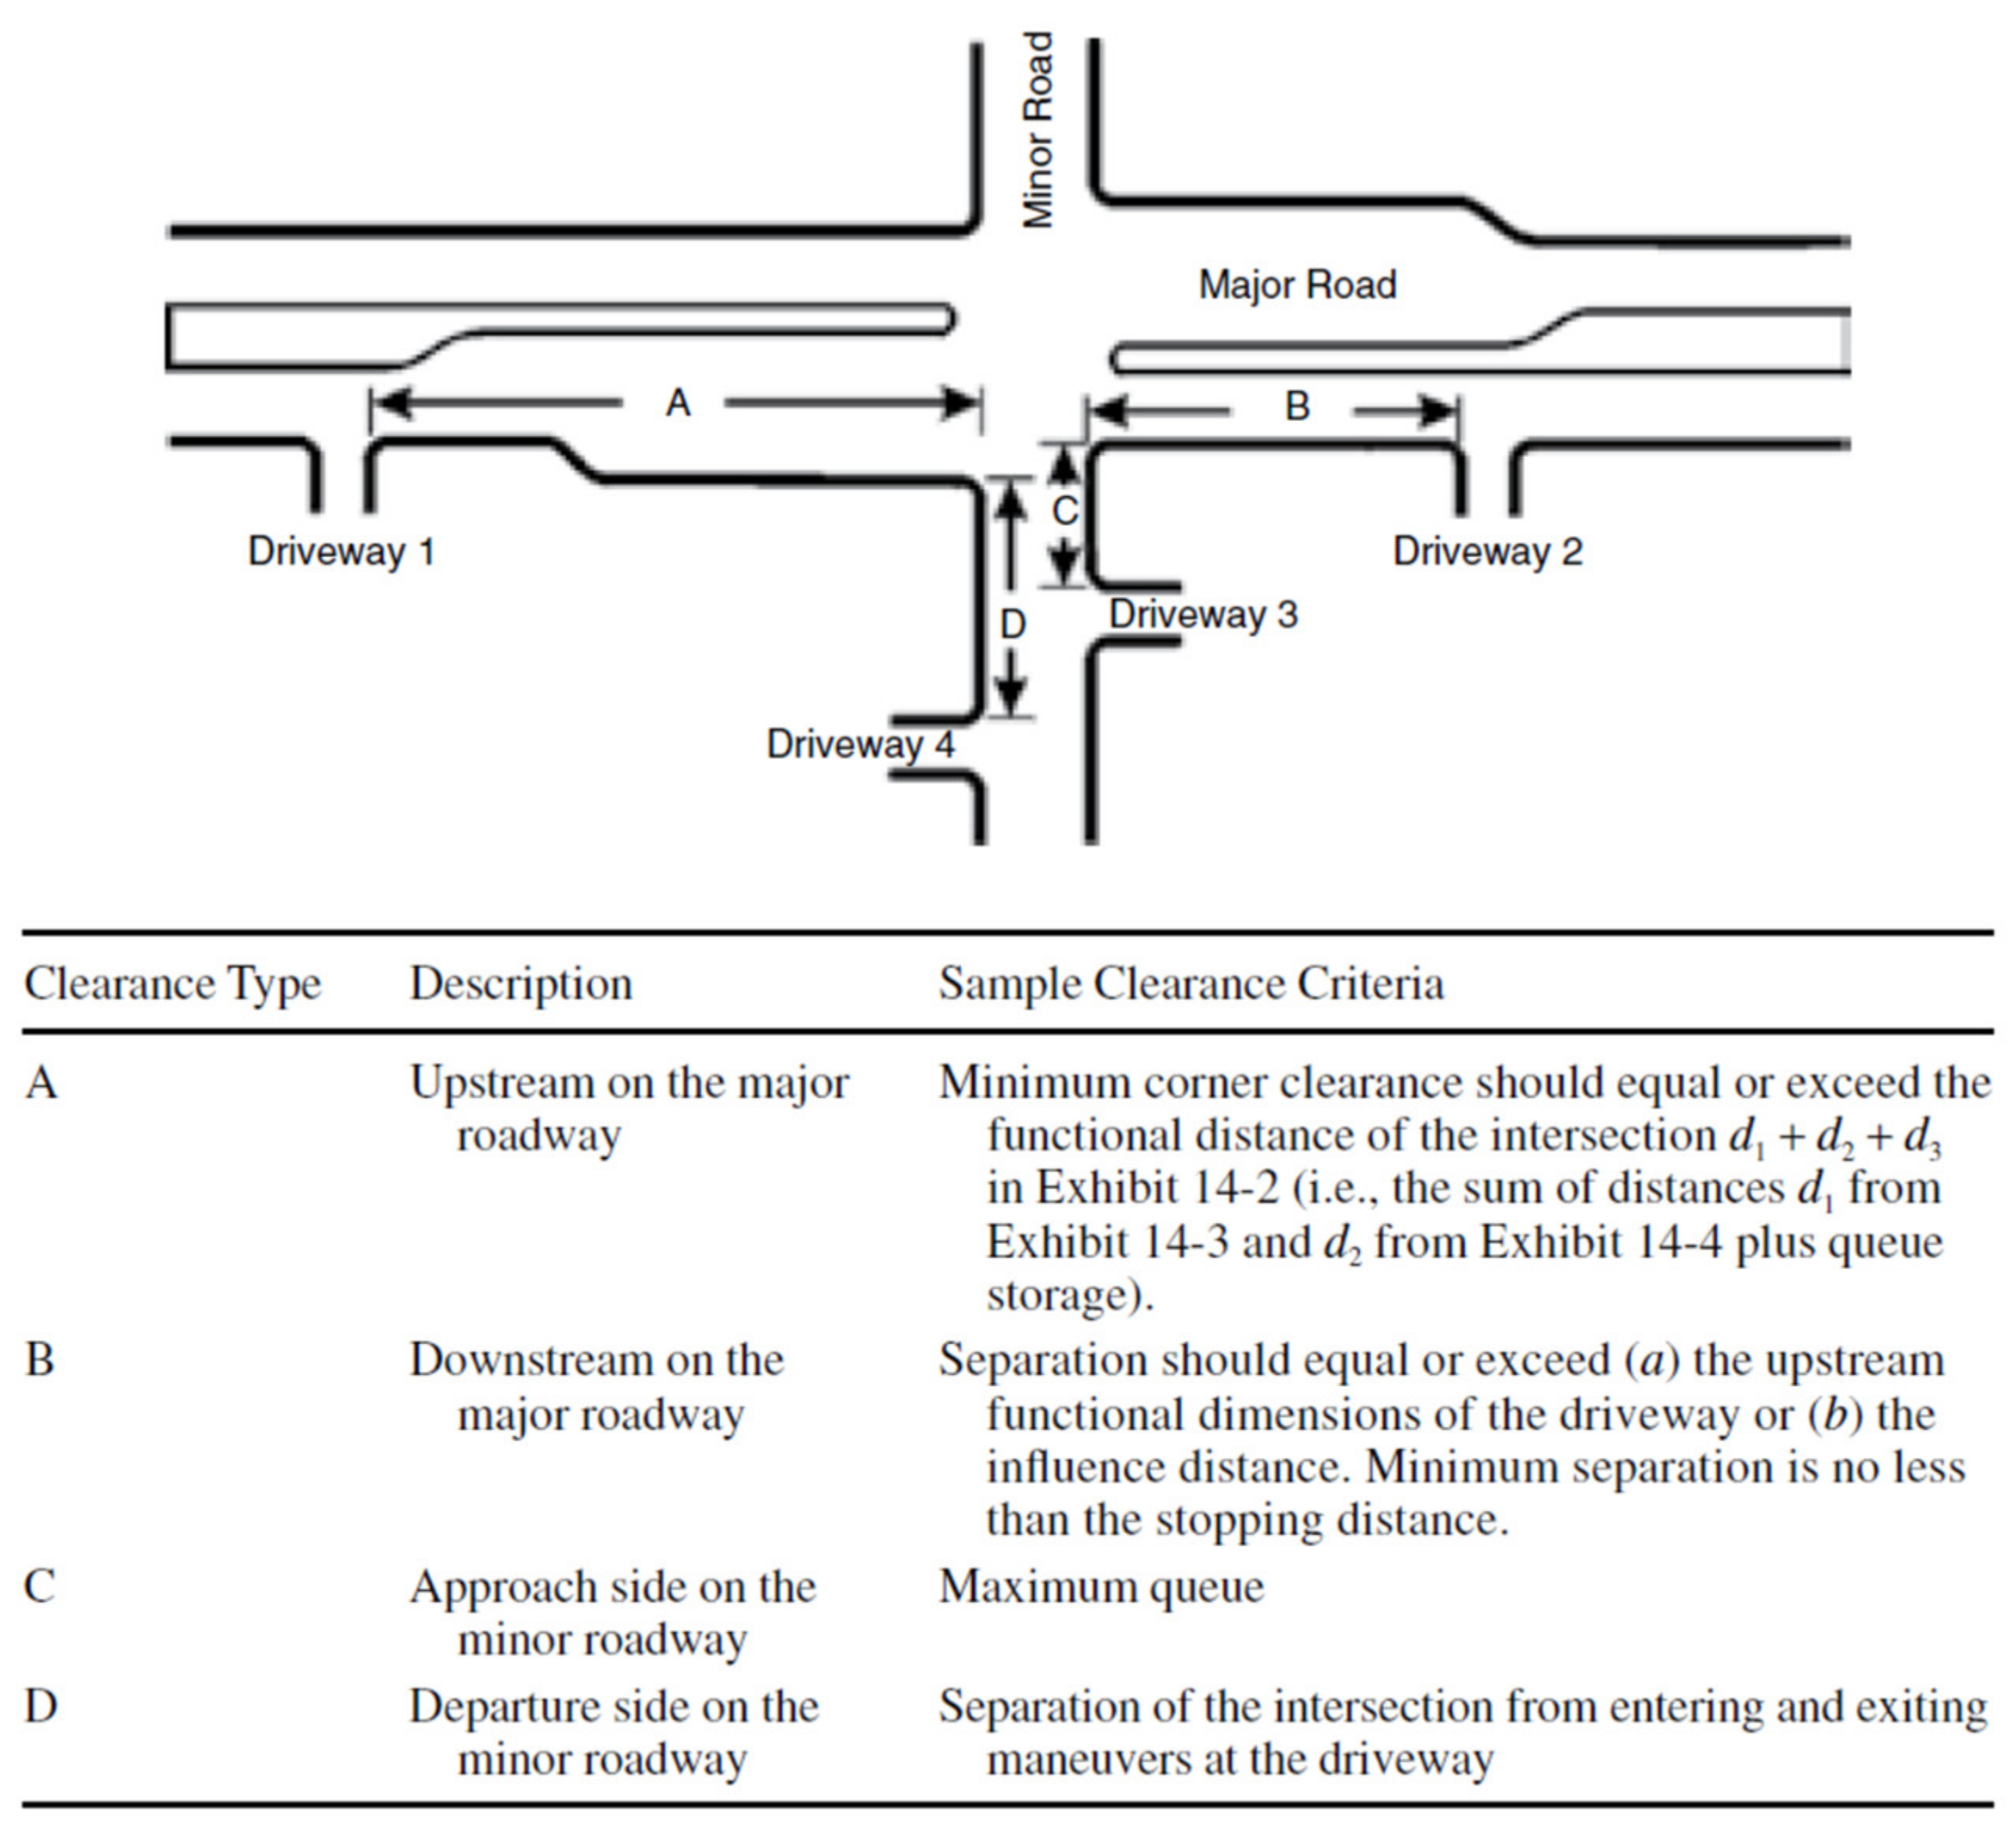
In the US, the road access restricted distance is called corner clearance. The concept of corner clearance is the spacing gap between an intersection and the nearest access connection, as in Figure 2 [9,10]. The clearance type A and C are deceleration areas, and type B and D are acceleration areas. The upstream clearance distance, such as type A, should be longer than the sum of reaction time distance, deceleration distance and queue distance. The downstream clearance distance, such as type B, includes the stopping sight distance [10].
2.3. Acceleration and Deceleration Behavior of Vehicles
There are various studies related to vehicle acceleration and deceleration behavior [5,11,12,13,14,15,16,17,18,19,20,21,22,23,24]. A recent study [5] found that the acceleration rate gradually increases from lowest to maximum depending on the initial speed of the vehicle. This phenomenon is observed in all vehicle types except trucks. The maximum acceleration rate of each vehicle types were 1.0 m/s2 for truck, 0.64 m/s2 for motorized three-wheeler, 1.96 m/s2 for motorized two-wheeler, 2.23 m/s2 for diesel car, and 2.87 m/s2 for gasoline car, respectively. Wang et al. [23] show a similar acceleration rate to Bokare and Maurya [5], and the other studies [12,15] report lower values. Bokare and Maurya [5] propose a negative exponential acceleration model for trucks, diesel cars and gasoline cars. For the deceleration maneuver process, maximum deceleration rates differ depending on vehicle types such as trucks and passenger cars. Bokare and Maurya [5] proposed the polynomial deceleration model. However, the constant acceleration or deceleration model is the simplest to adapt to the road design [22].
The acceleration and deceleration behavior at signalized intersections depends on various factors such as driver tendency, vehicle type, geometric design, etc. [18]. There are limited studies related to signalized intersections due to the complex experimental variables that influence the acceleration or deceleration [19,25,26]. Mondal and Gupta [19] found that a small motorized vehicle achieves maximum acceleration rate at low speed and highly decelerates during a stopping process at the intersection. It is observed that the average acceleration and maximum deceleration of vehicles vary from 0.9 to 1.40 m/s2 and 2.21 to 3.01 m/s2.
3. Data Collection and Screening
3.1. DTG
Korean commercial vehicles, such as trucks, taxis and buses, should install DTGs according to the Traffic Safety Act. A DTG records data such as vehicle type, speed, longitude, latitude, heading, acceleration, engine revolutions and break signals. The DTG data columns are shown in Table 5. The driver’s personal information, such as gender, is protected by the Personal Information Protection Act. Thus, researchers can limitedly access the anonymous vehicle ID. Furthermore, since the DTG is installed only in commercial vehicles, it is impossible to observe the non-commercial driver’s behavior. Despite these limitations of DTG raw data, it is valuable raw data for empirically deducing the driving patterns according to vehicle type. This study collected 24-h DTG data for 1 month in April 2018.
3.2. Study Sites
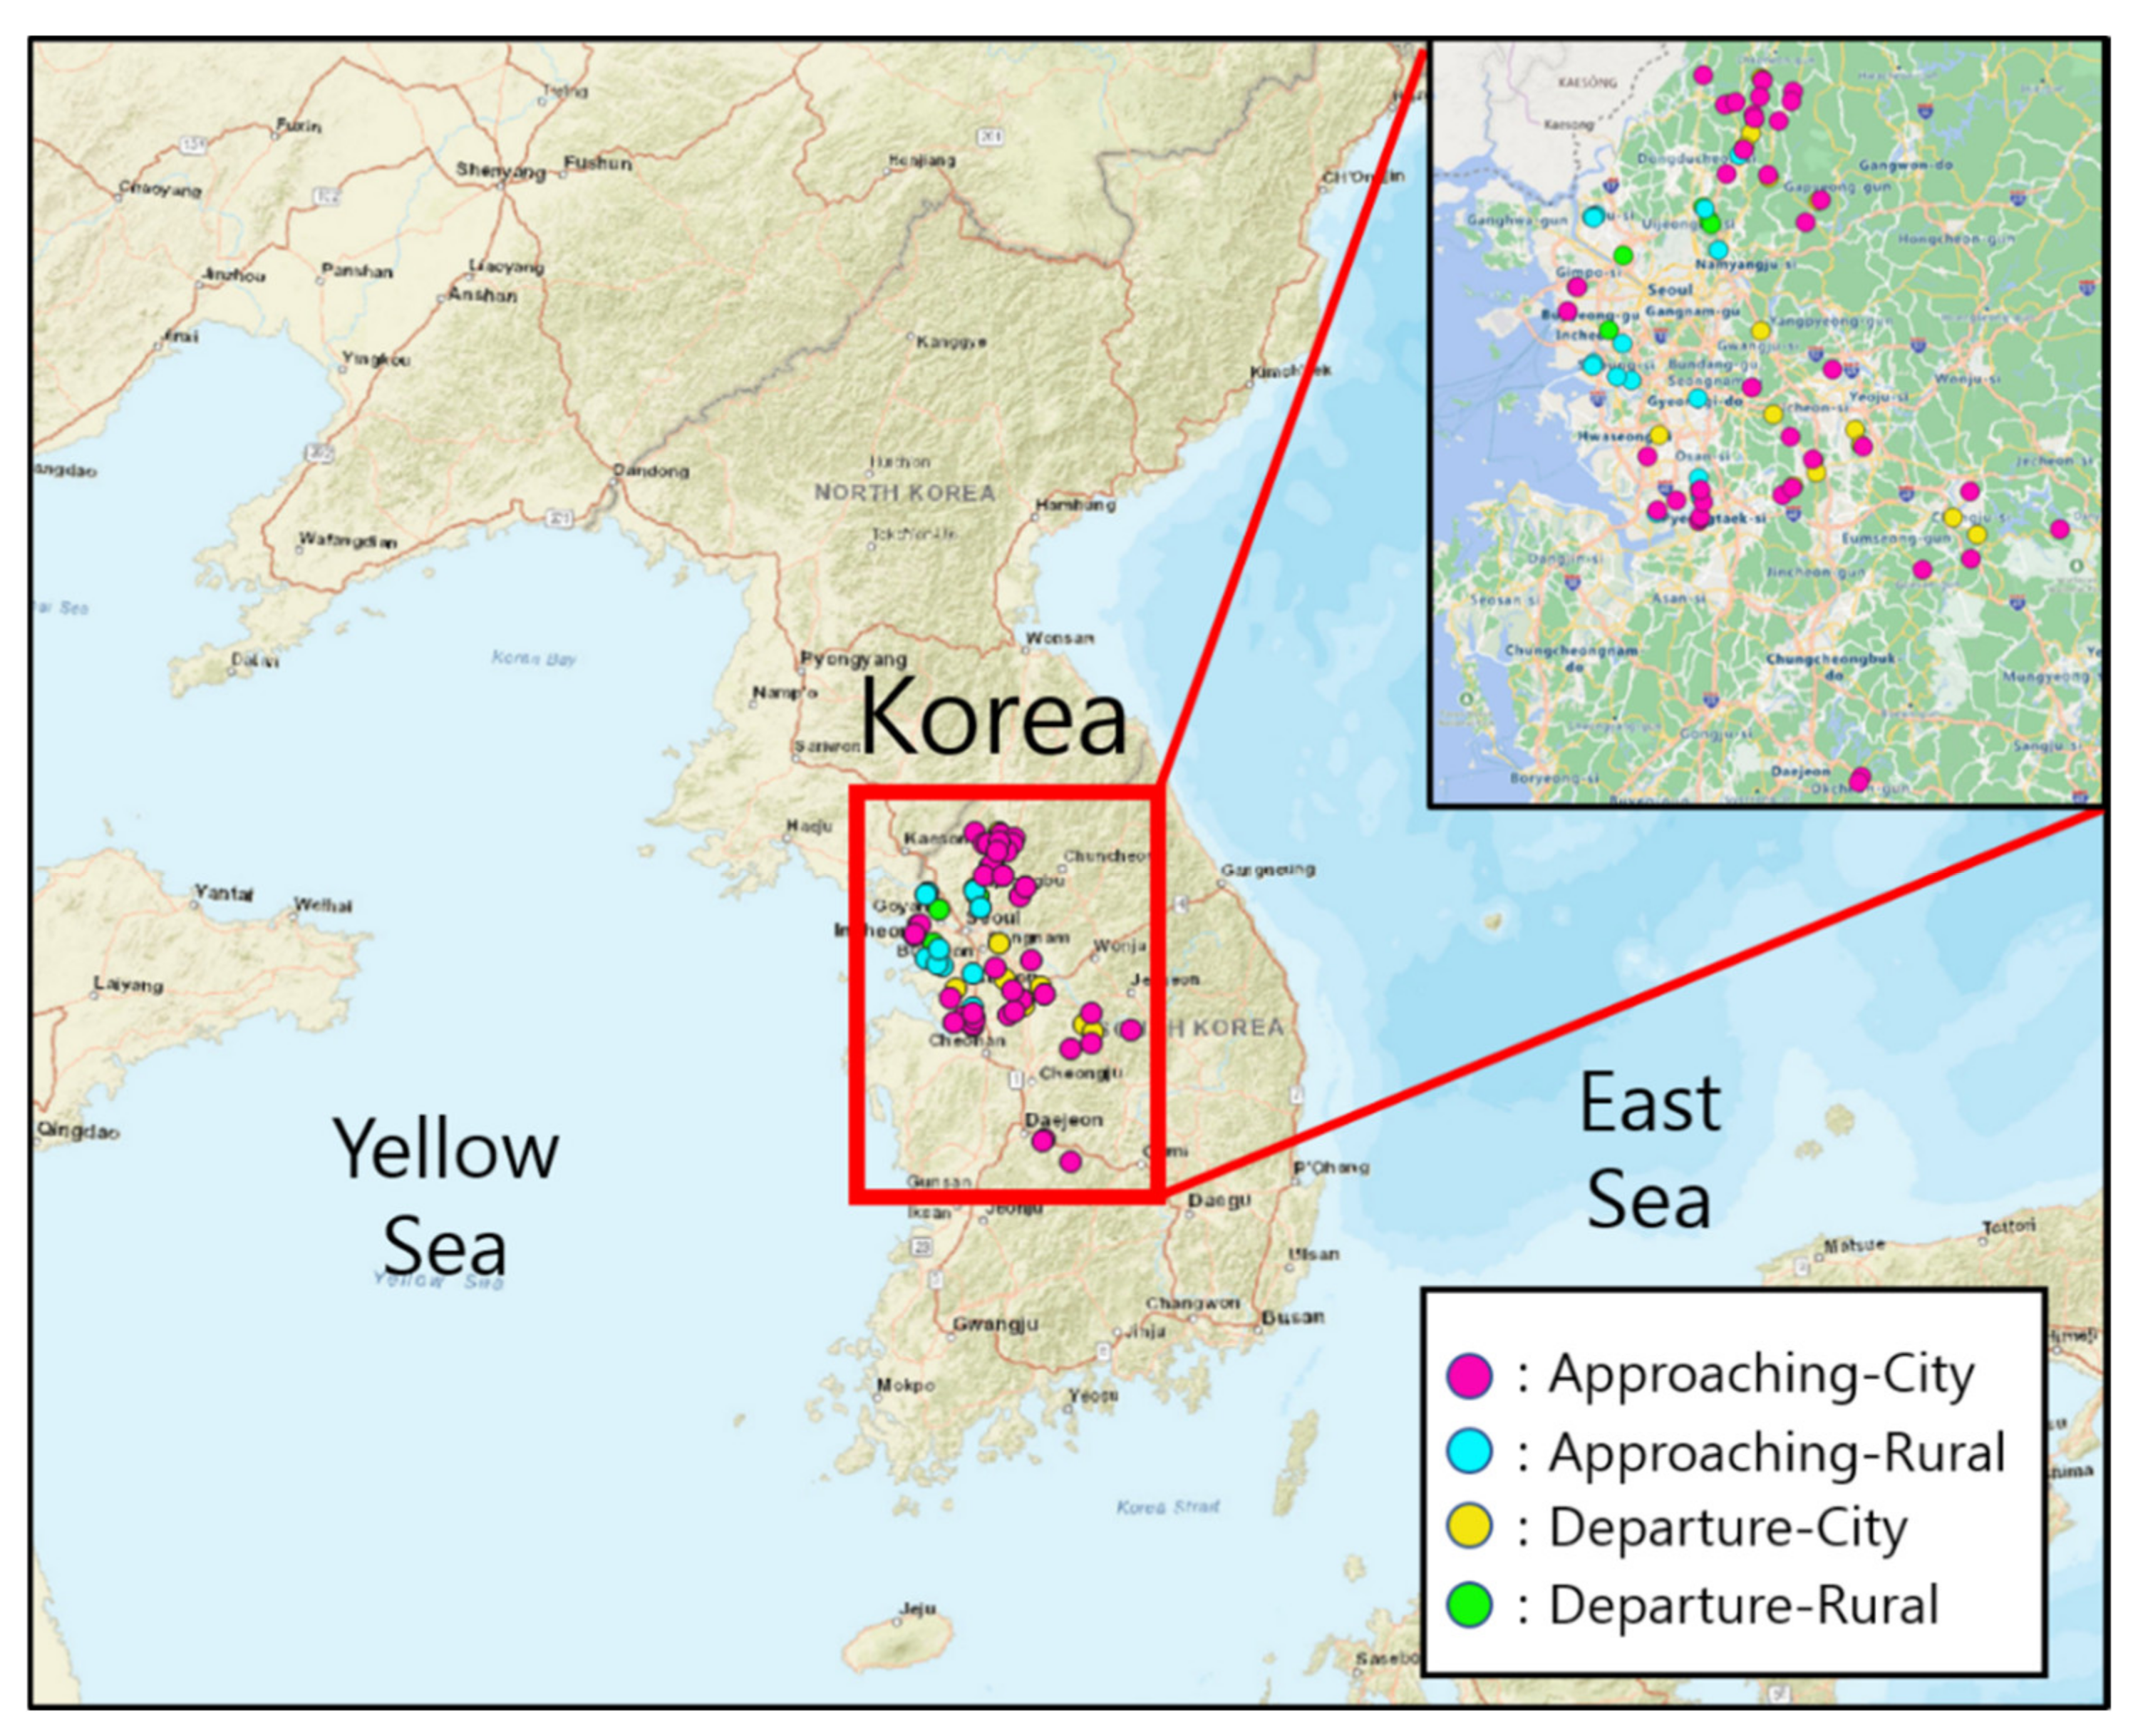
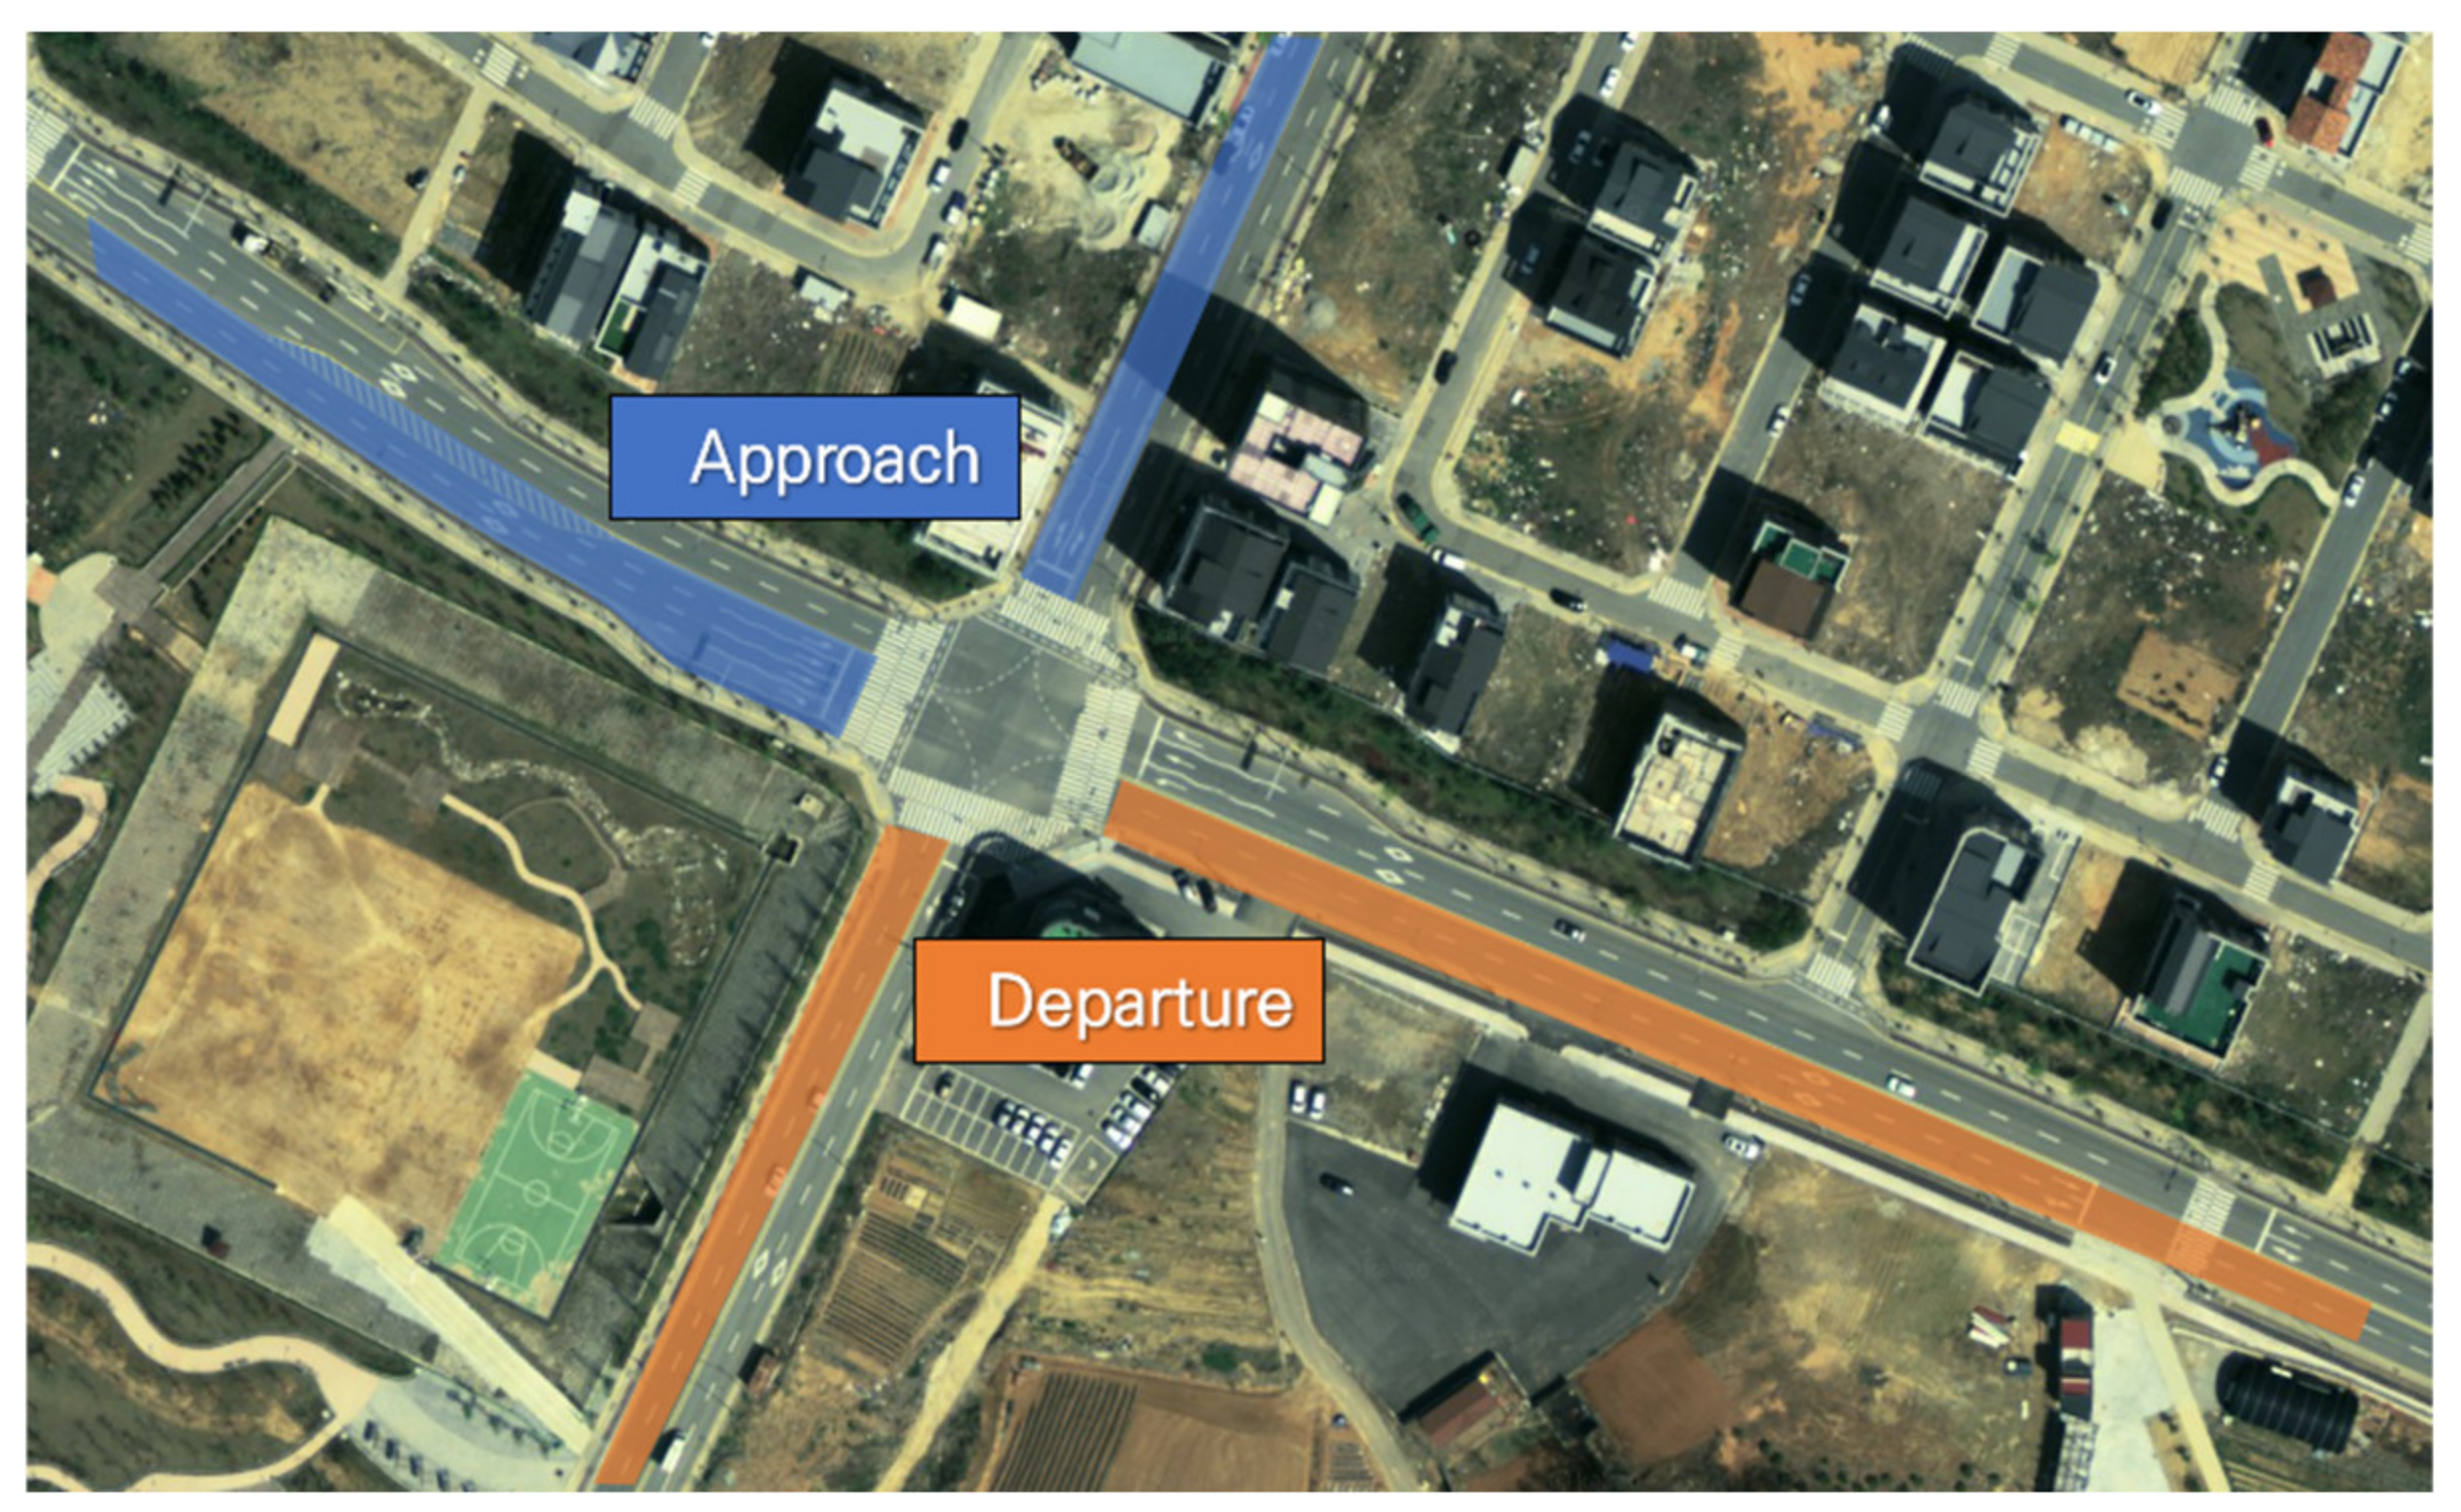
To observe drivers’ acceleration and deceleration behavior, 77 study sites were selected inside the managing area of Korea’s Regional Construction and Management Administration (Figure 3). Those study sites are 1–3 flat grade lanes in one direction, and the speed limits are 50–80 km/h. The traffic conditions vary for a 24-h 1 month. Thus, it is not described in this section, but it is generalized by a large population of data size. The 77 study sites are signalized intersections that have 27 approach areas (in deceleration) and 50 departure areas (in acceleration) (Figure 4). The 27 approach areas comprise 7 urban and 20 rural areas, whereas the 50 departure areas comprise 18 urban and 32 rural areas. The latitude and longitude of those study sites are presented in Table 6.
3.3. Data Screening Algorithm
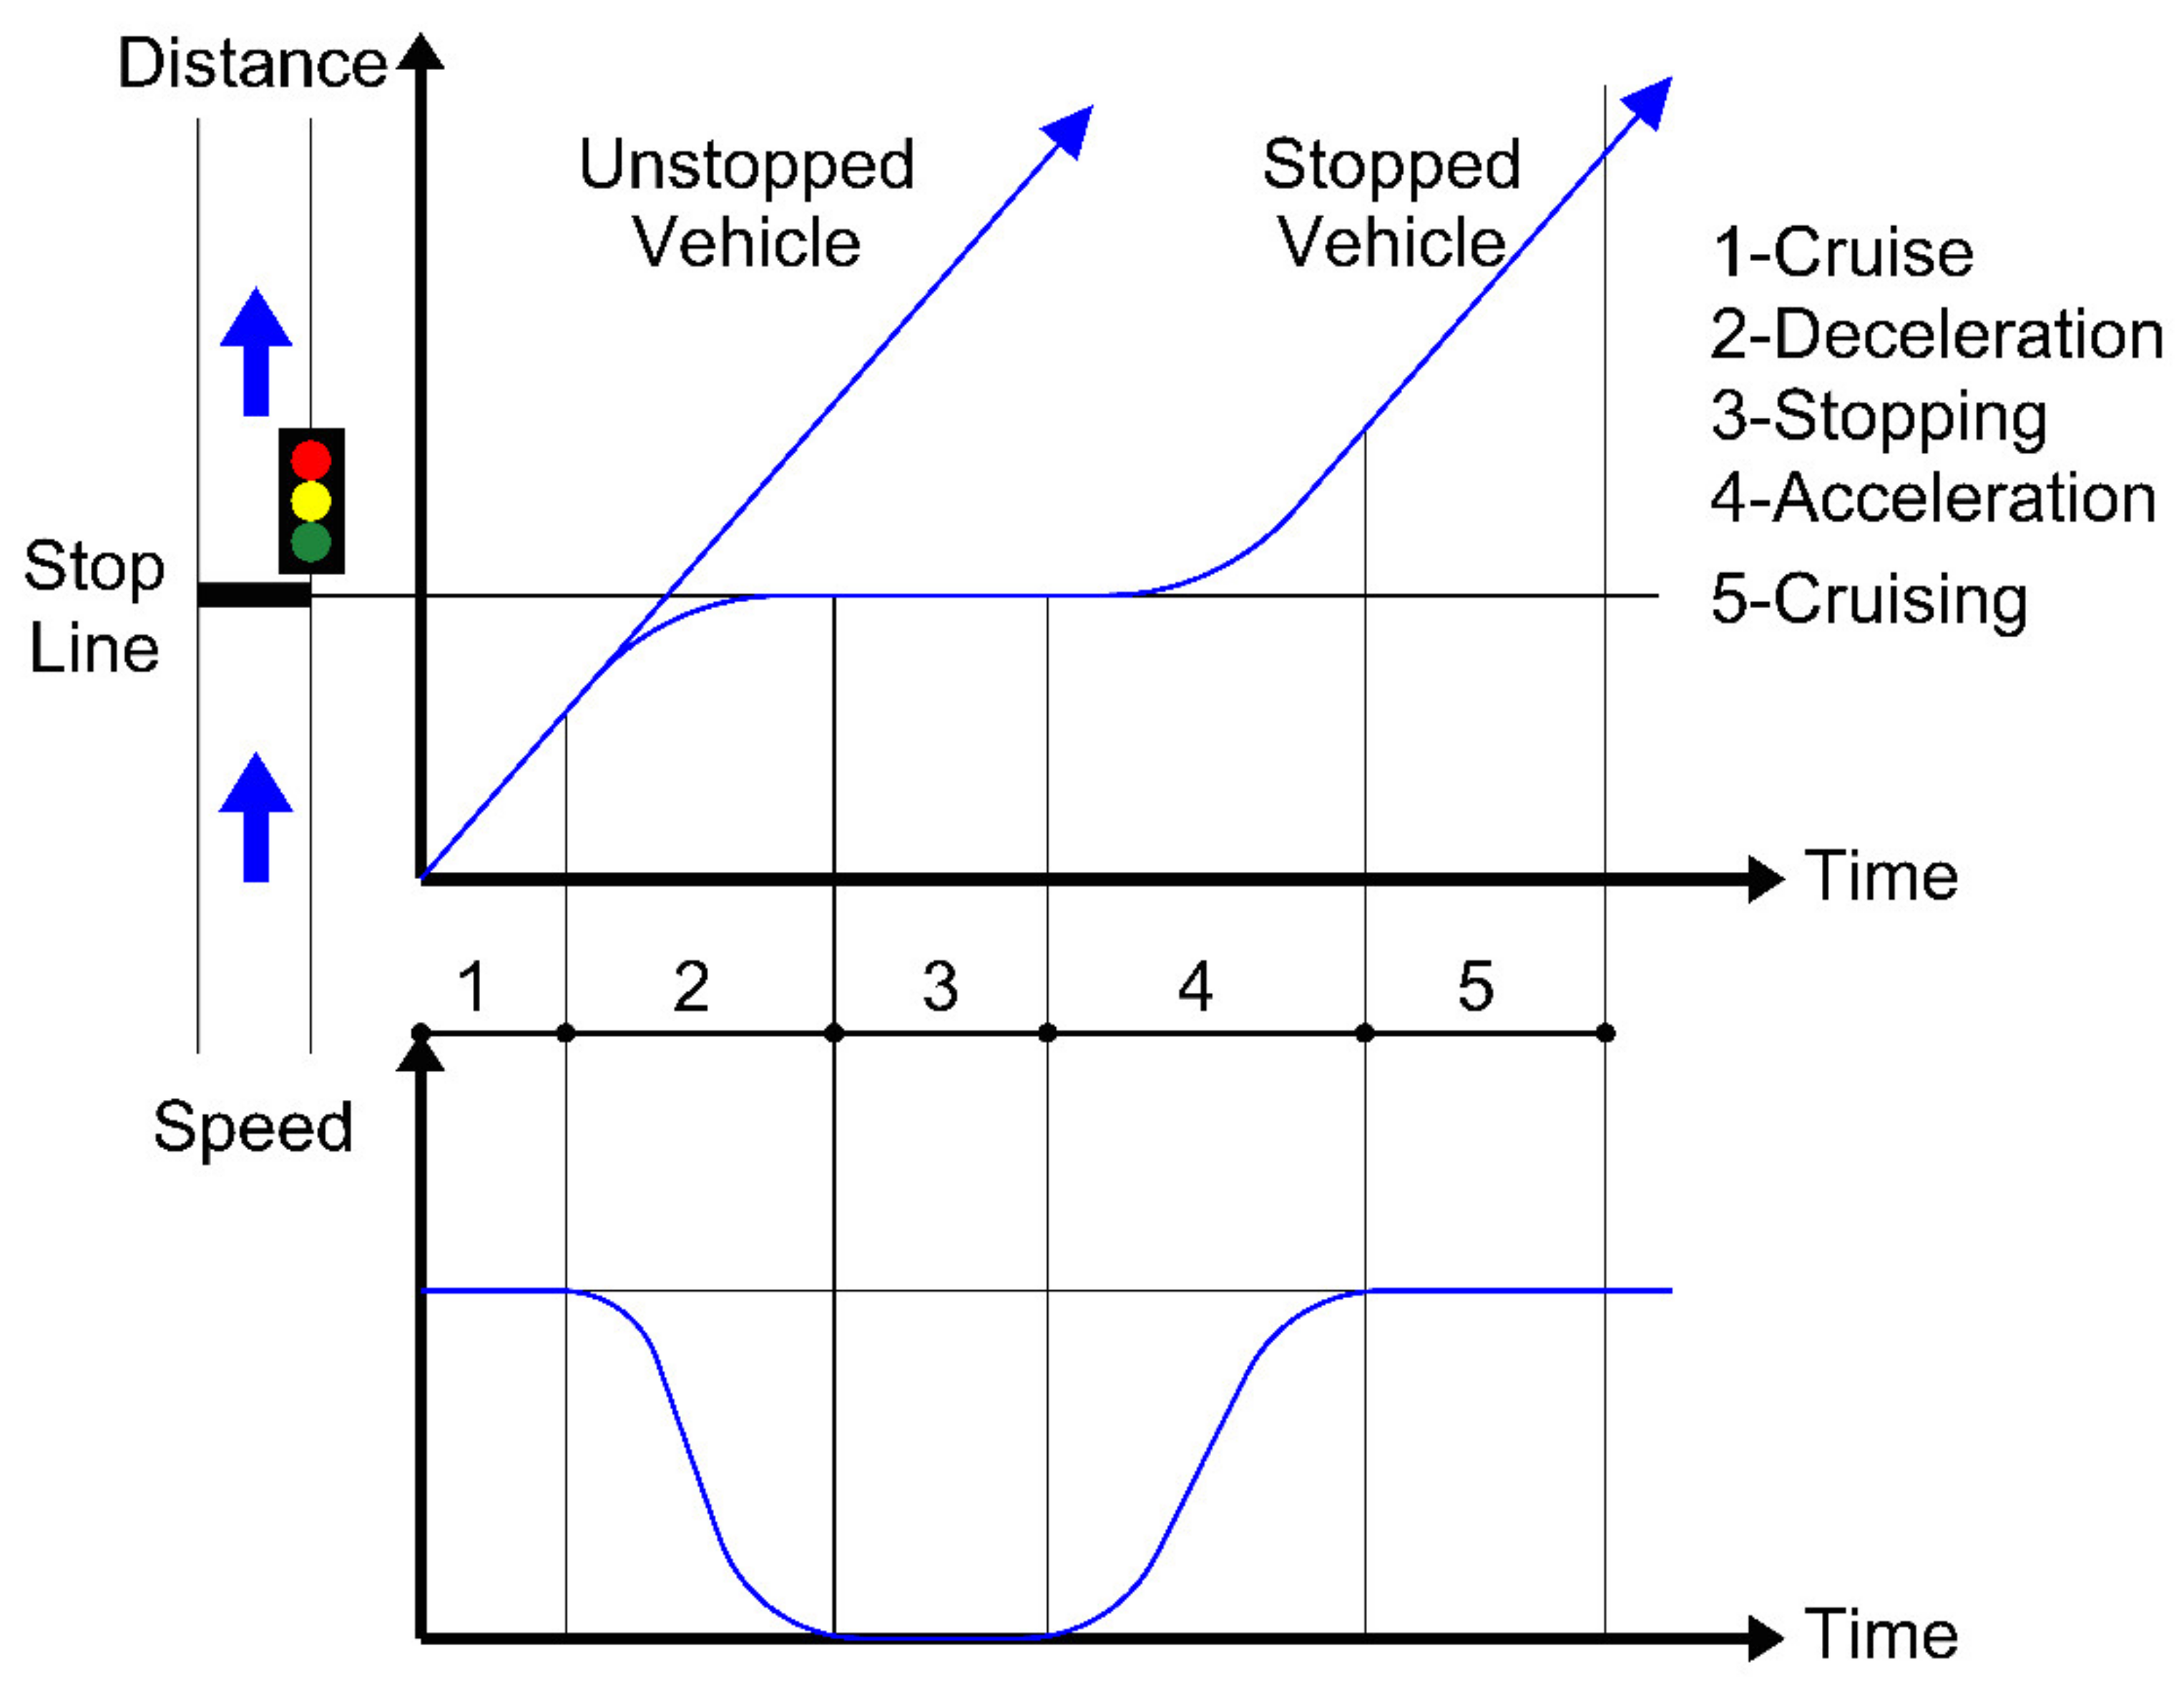
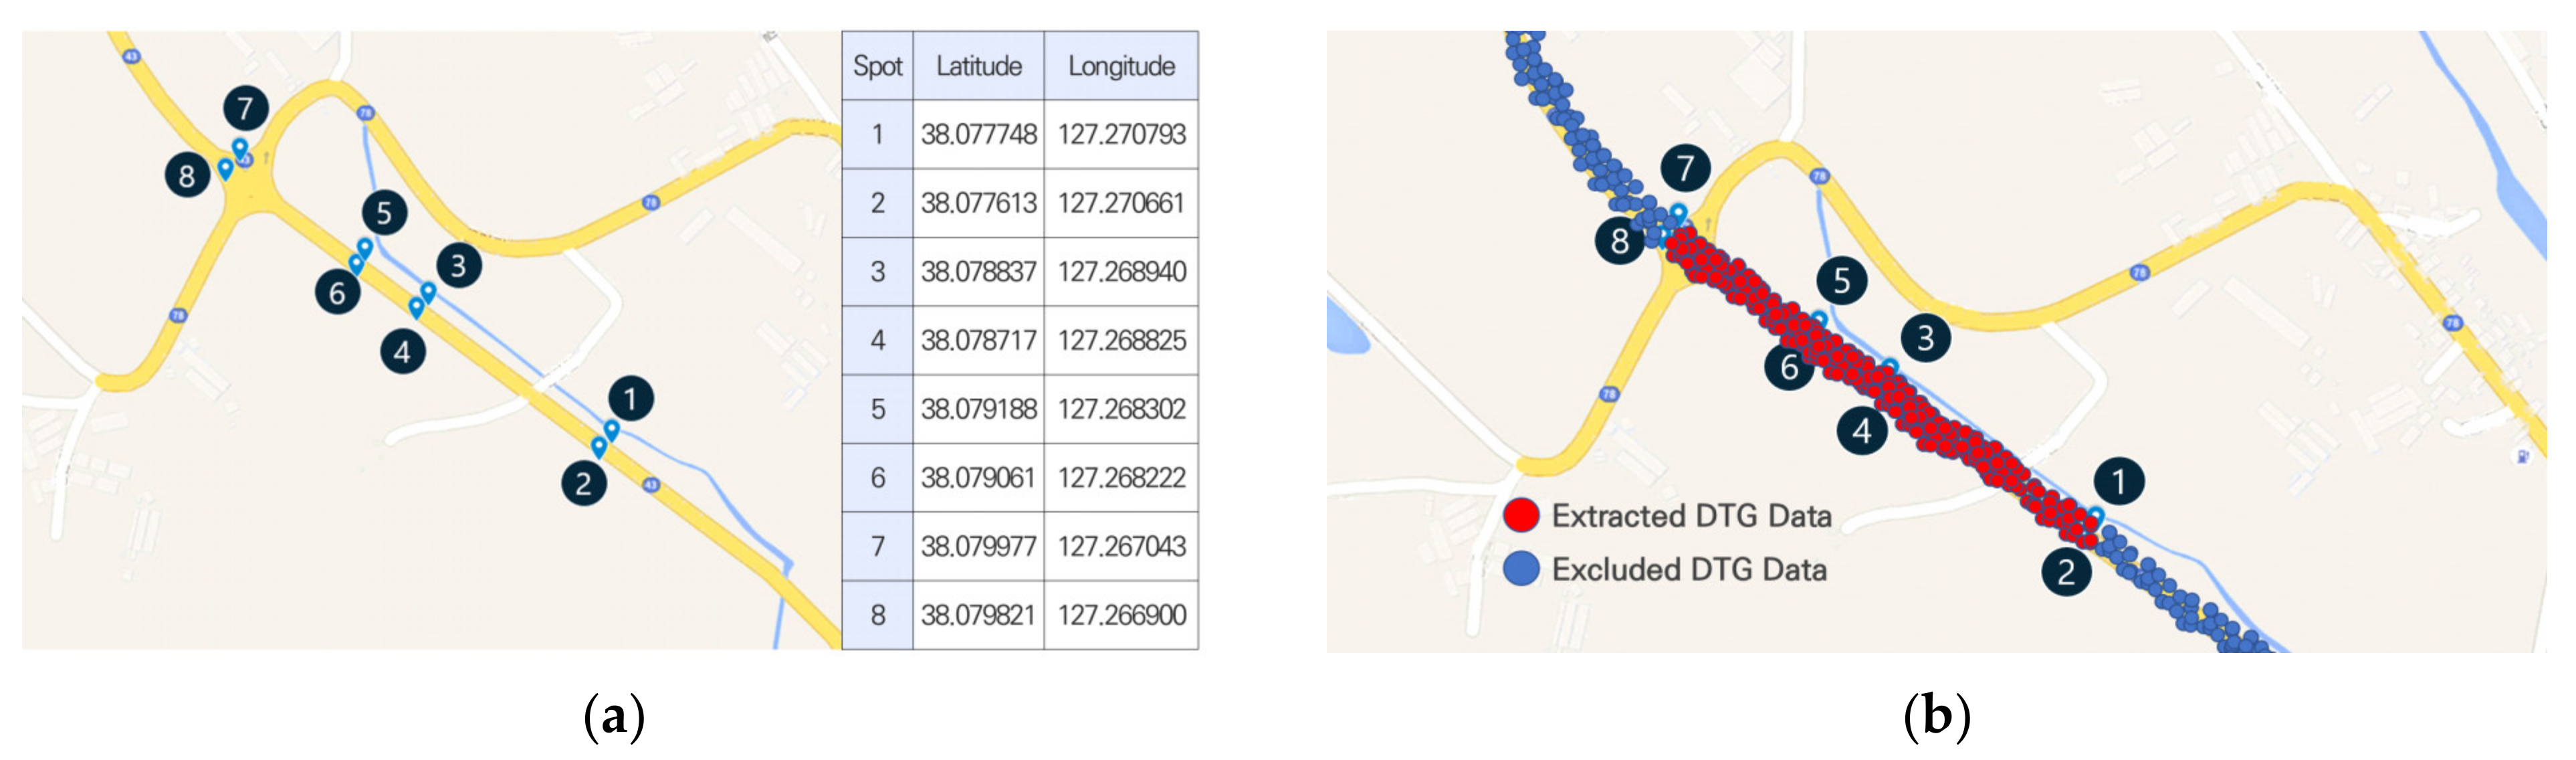
In the signalized intersection, vehicles approach with deceleration and stop during the red signal. After changing to the green light, they accelerate to the desired speed. Figure 5 shows vehicle movements time–distance and speed–time diagrams at a signalized intersection [5]. To settle a target by analyzing the DTG data, study sites were modeled with closed polygon areas. DTG data, which had GPS coordinates inside the closed polygon area, were extracted. The closed polygons were drawn widely along some core waypoints to collect DTG data without omission of the acceleration or deceleration process. The types of core waypoints include stop lines, taper start/end points, centerline and a maximum 450 m length. The maximum length of the closed polygon follows the influence area of the merging or diverging area in TRB [27]. The waypoints of closed polygons are set as shown in Figure 6a, and data extracted from there are shown in Figure 6b.
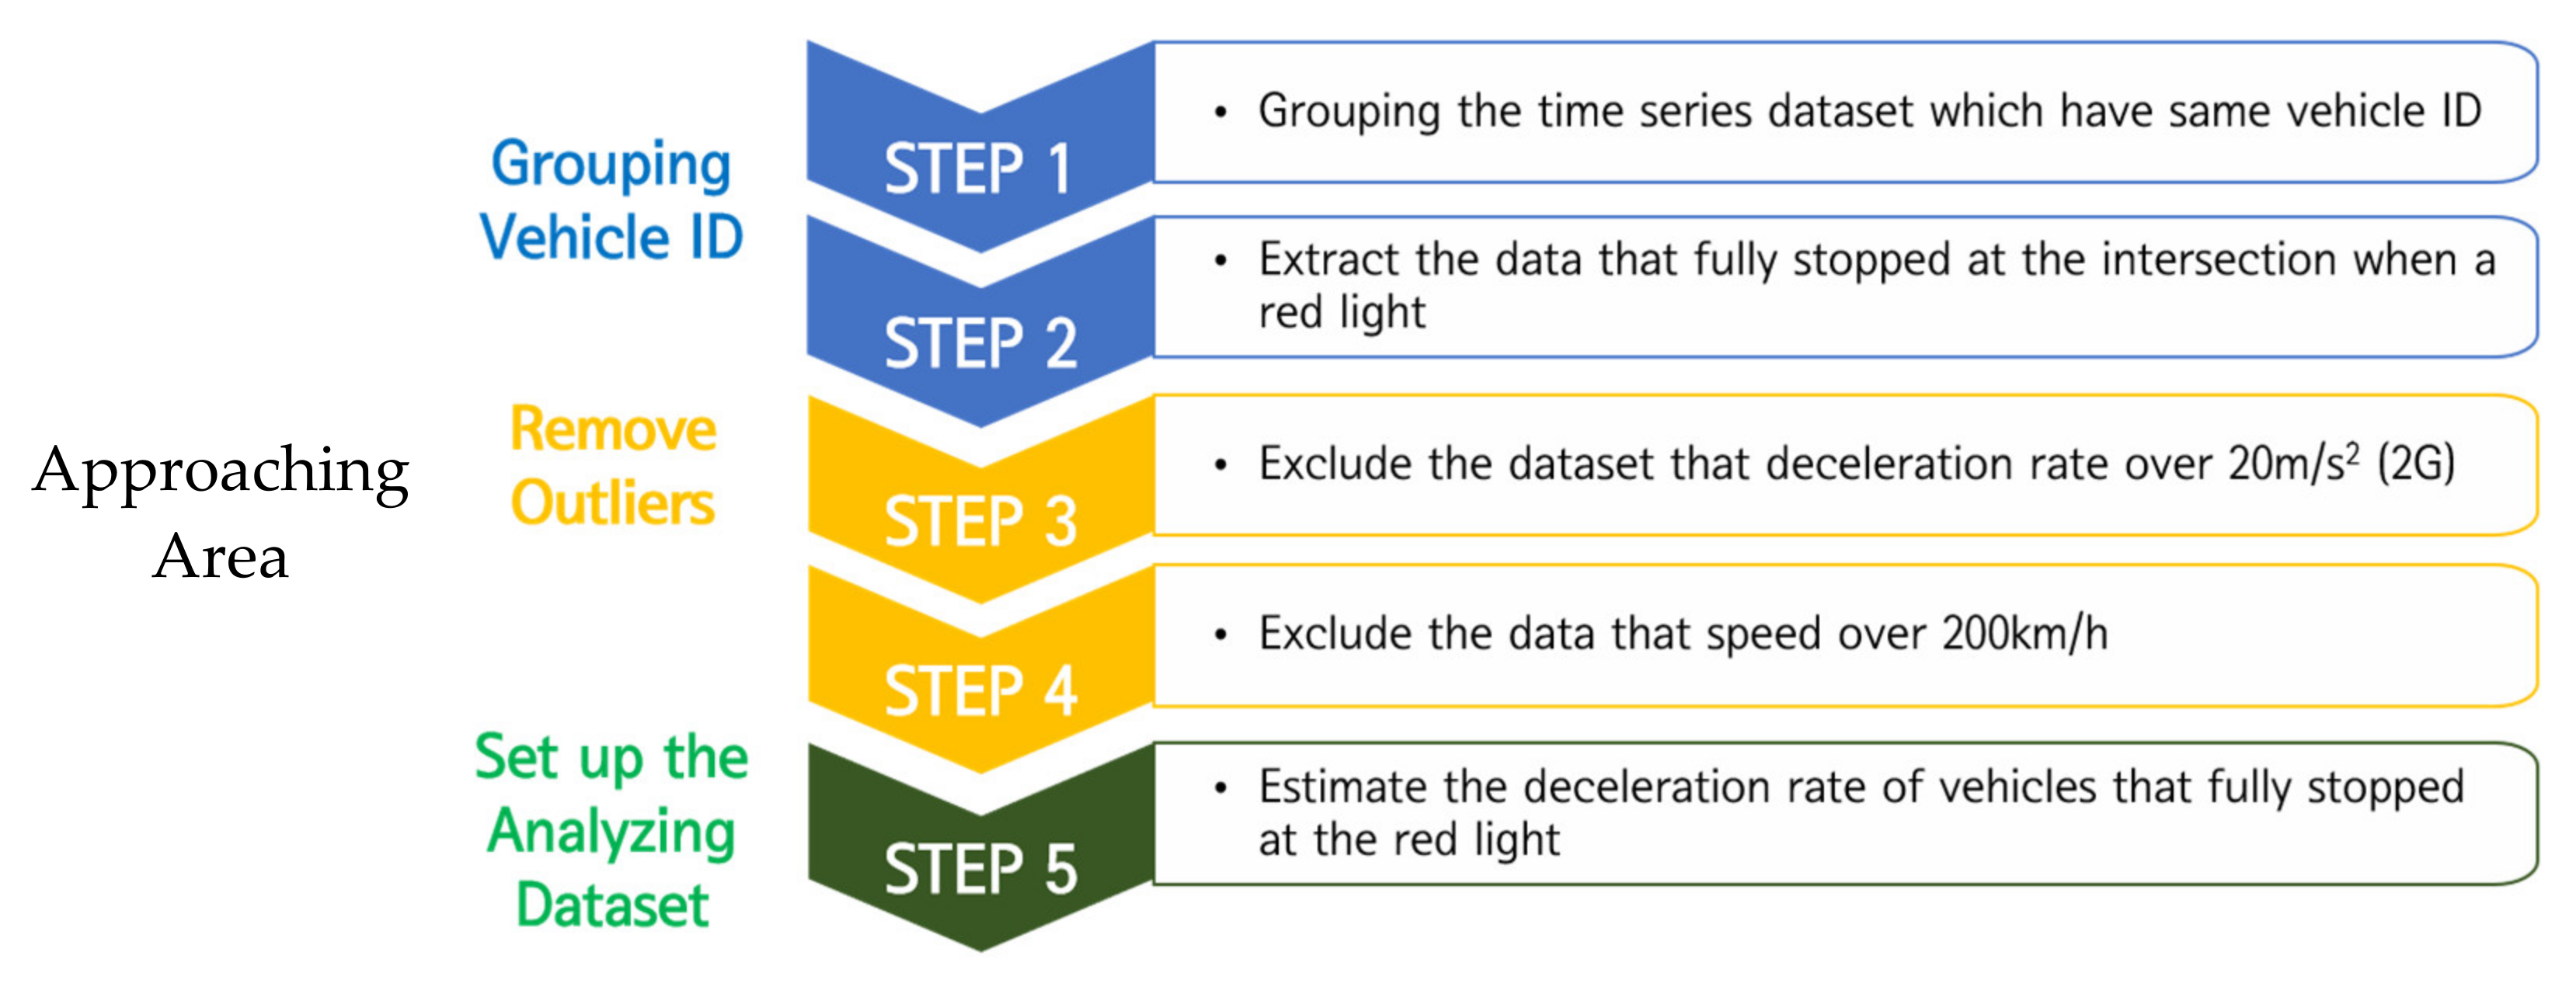
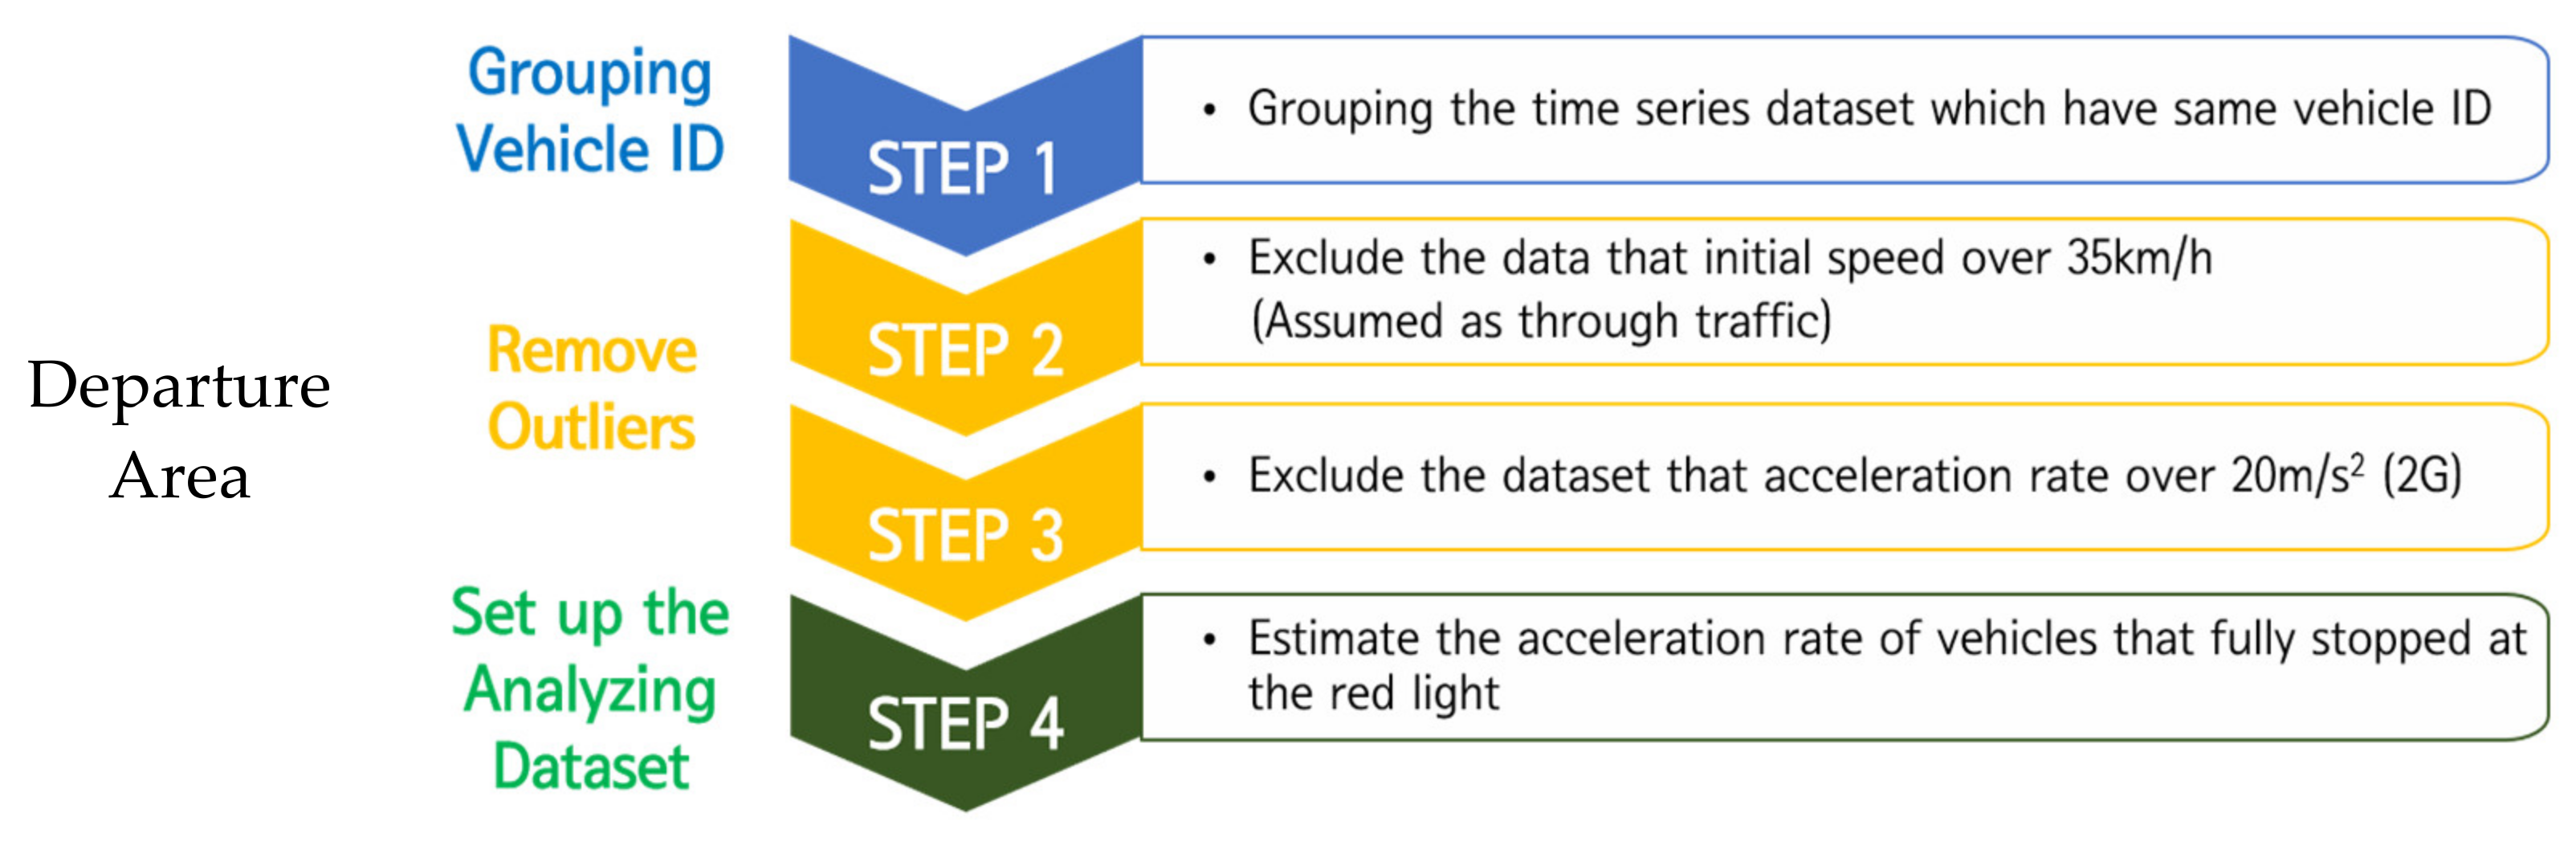
After extracting DTG data from the study sites, the analysis data should be screened (Figure 7). The data screening threshold values are set large enough in order to mitigate the analyst’s subjectivity and just filter the outliers. First, data from the approach areas were grouped by identical vehicle IDs and timeslots. Second, only data that showed perfect stops at the intersections were selected. Third, data with a deceleration of higher than 20 m/s2 (approximately 2 g, many vehicle manufacturers report warning the drivers when they accelerate or decelerate over 10 m/s2; thus, this threshold is set to roughly double the vehicle manufacturers reporting threshold) were excluded as outliers. Fourth, data with speed values above 200 km/h were excluded. Finally, the decelerations of vehicles at red lights were analyzed, and the 90th percentile value was set as the representative value. Data from the departure areas were processed similarly. First, they were grouped by vehicle IDs and timeslots, and data with an initial vehicle speed of higher than 35 km/h, which are through traffic, were excluded. Then, data with acceleration greater than 20 m/s2 (approximately 2 g, many vehicle manufacturers report warning to the drivers when they accelerate or decelerate over 10 m/s2; thus, this threshold is set roughly double than vehicle manufacturers reporting threshold) were excluded as outliers. Finally, the accelerations of vehicles at red lights were analyzed, and the 90th percentile value [28] was set as the representative value.
4. Analysis Result
4.1. Collected Data
A total of 18,542 and 27,019 vehicles from the approach and departure areas, respectively, were identified through the data screening algorithm. Among the vehicles identified in the approach areas, 6968 (37.6%), 4384 (23.6%) and 7190 (38.8%) were buses, taxis and trucks, respectively. Meanwhile, the departure area vehicles comprised 12,594 (46.6%) buses, 5753 (21.3%) taxis and 8672 (32.1%) trucks. The analysis results were categorized into 12 classes (Table 7). Because the raw DTG data are collected in 1-km/h units, the acceleration/deceleration error is approximately 0.28 m/s2. Non-commercial vehicles, such as passenger cars, are not equipped with DTG. Thus, passenger car behaviors are not represented in these results, but they might be similar to taxis, which have similar mechanical performance. These raw DTG data show deceleration and acceleration processes at signalized intersections. The DTG data were collected in various traffic conditions for 24 h for one month. Thus, 90th percentile values [28] were set as the representative value to filter the variation of observed acceleration/deceleration values. Furthermore, observed values significantly differ from the data in emergency stop-and-go situations.
4.2. Approach Area
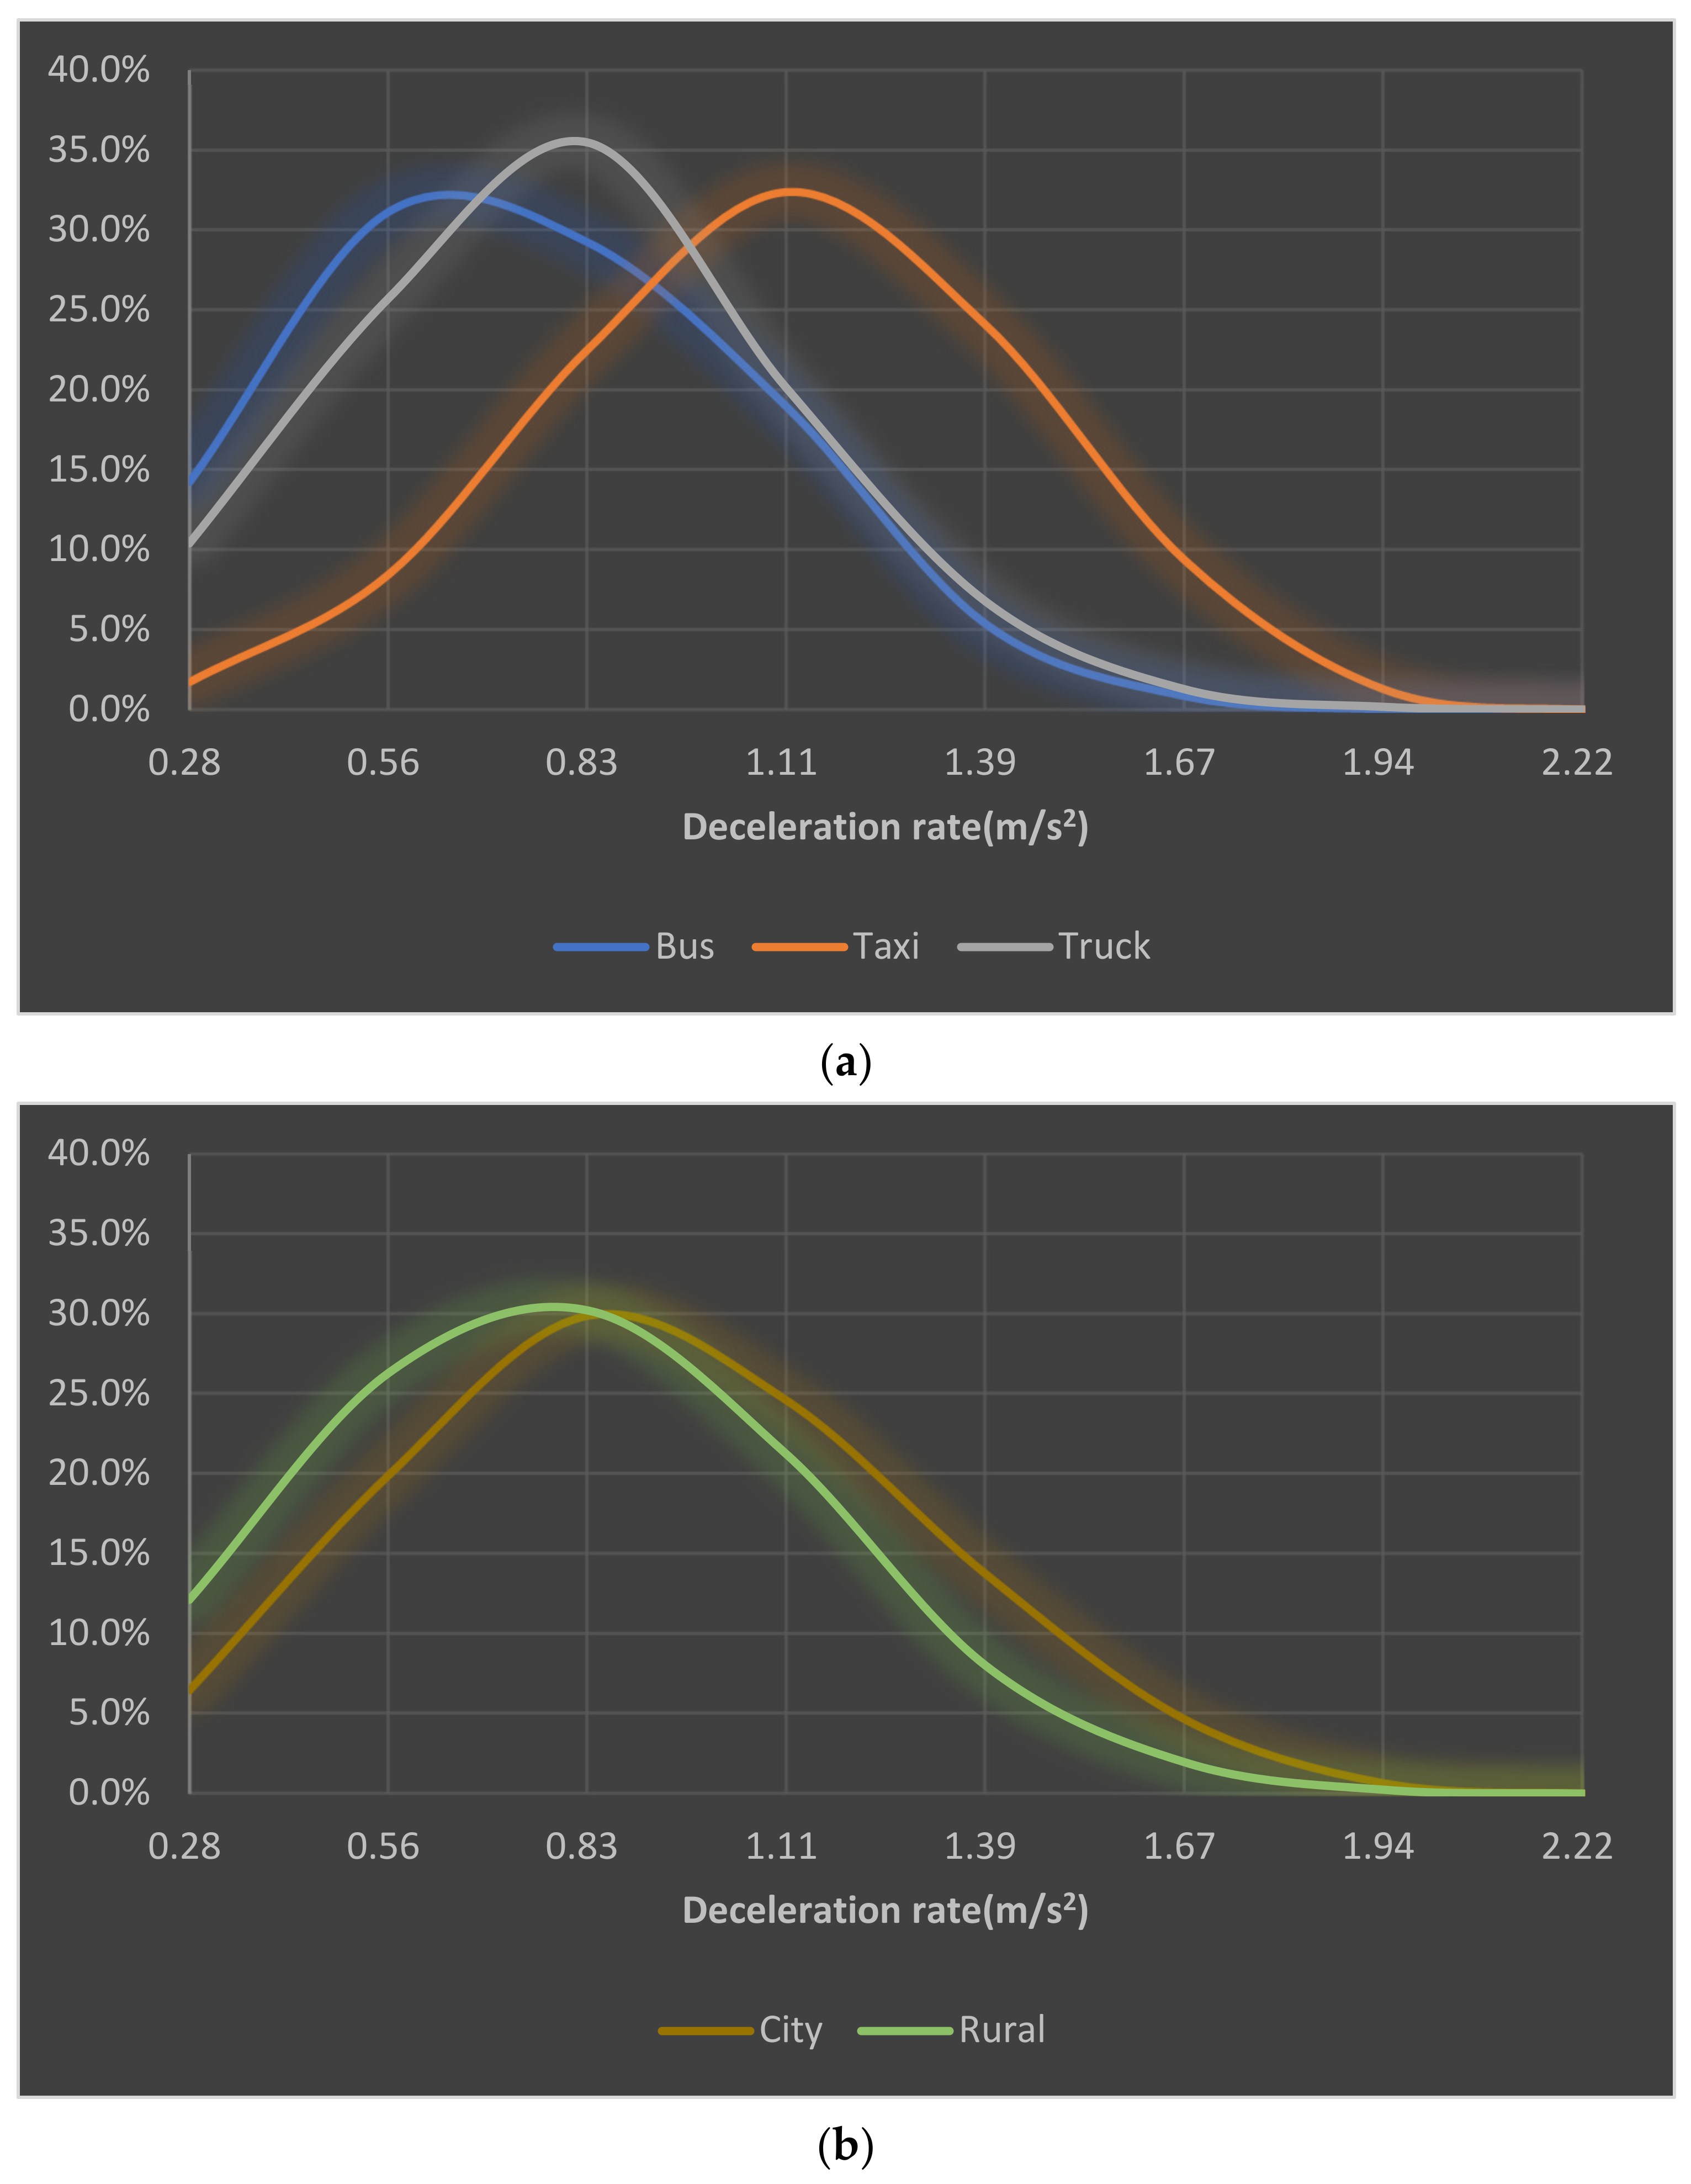
As shown in Table 8 and Figure 8, the deceleration rate of taxis is higher than those of buses and trucks; they significantly differ under 0.05 significance. The 90th percentile of deceleration rates is 1.04, 1.41 and 1.09 m/s2 for buses, taxis and trucks, respectively. According to our T-test results (Table 9), the deceleration rates of buses and trucks are homoscedastic, whereas that of taxis is heteroscedastic.
All types of vehicle deceleration rates in urban and rural areas are heterogeneous and have different average values under 0.05 significance.
4.3. Departure Area
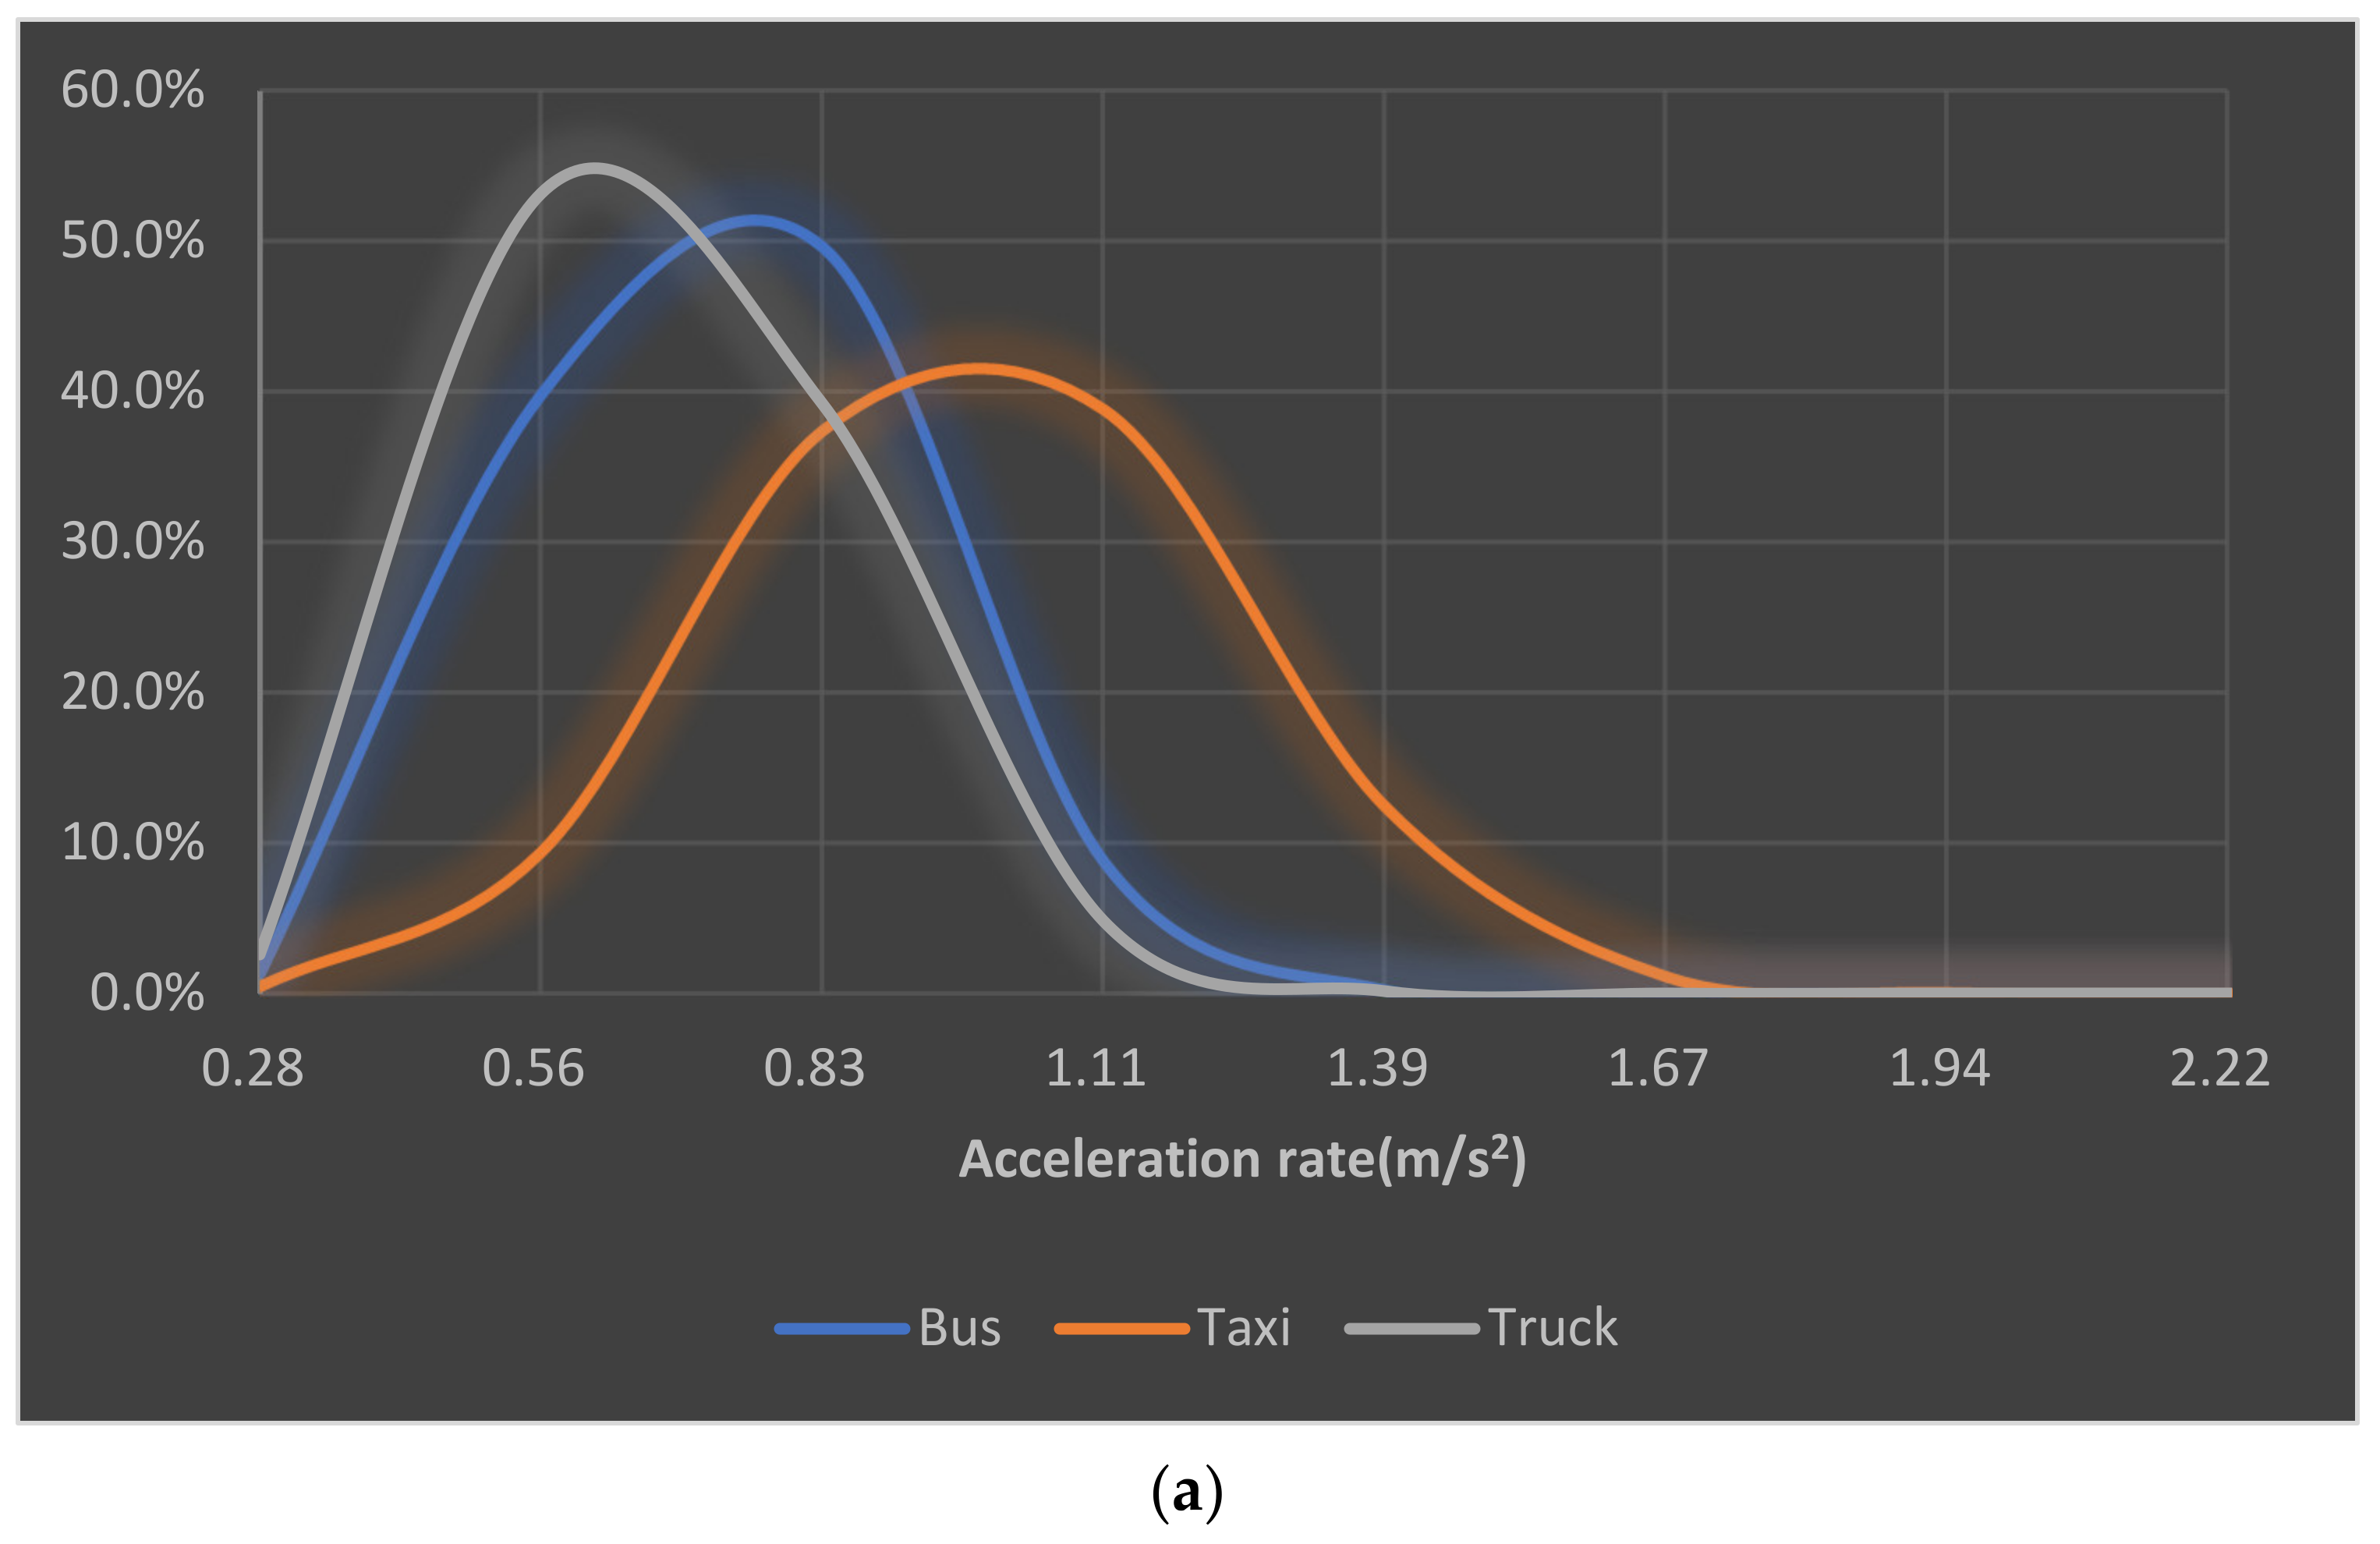
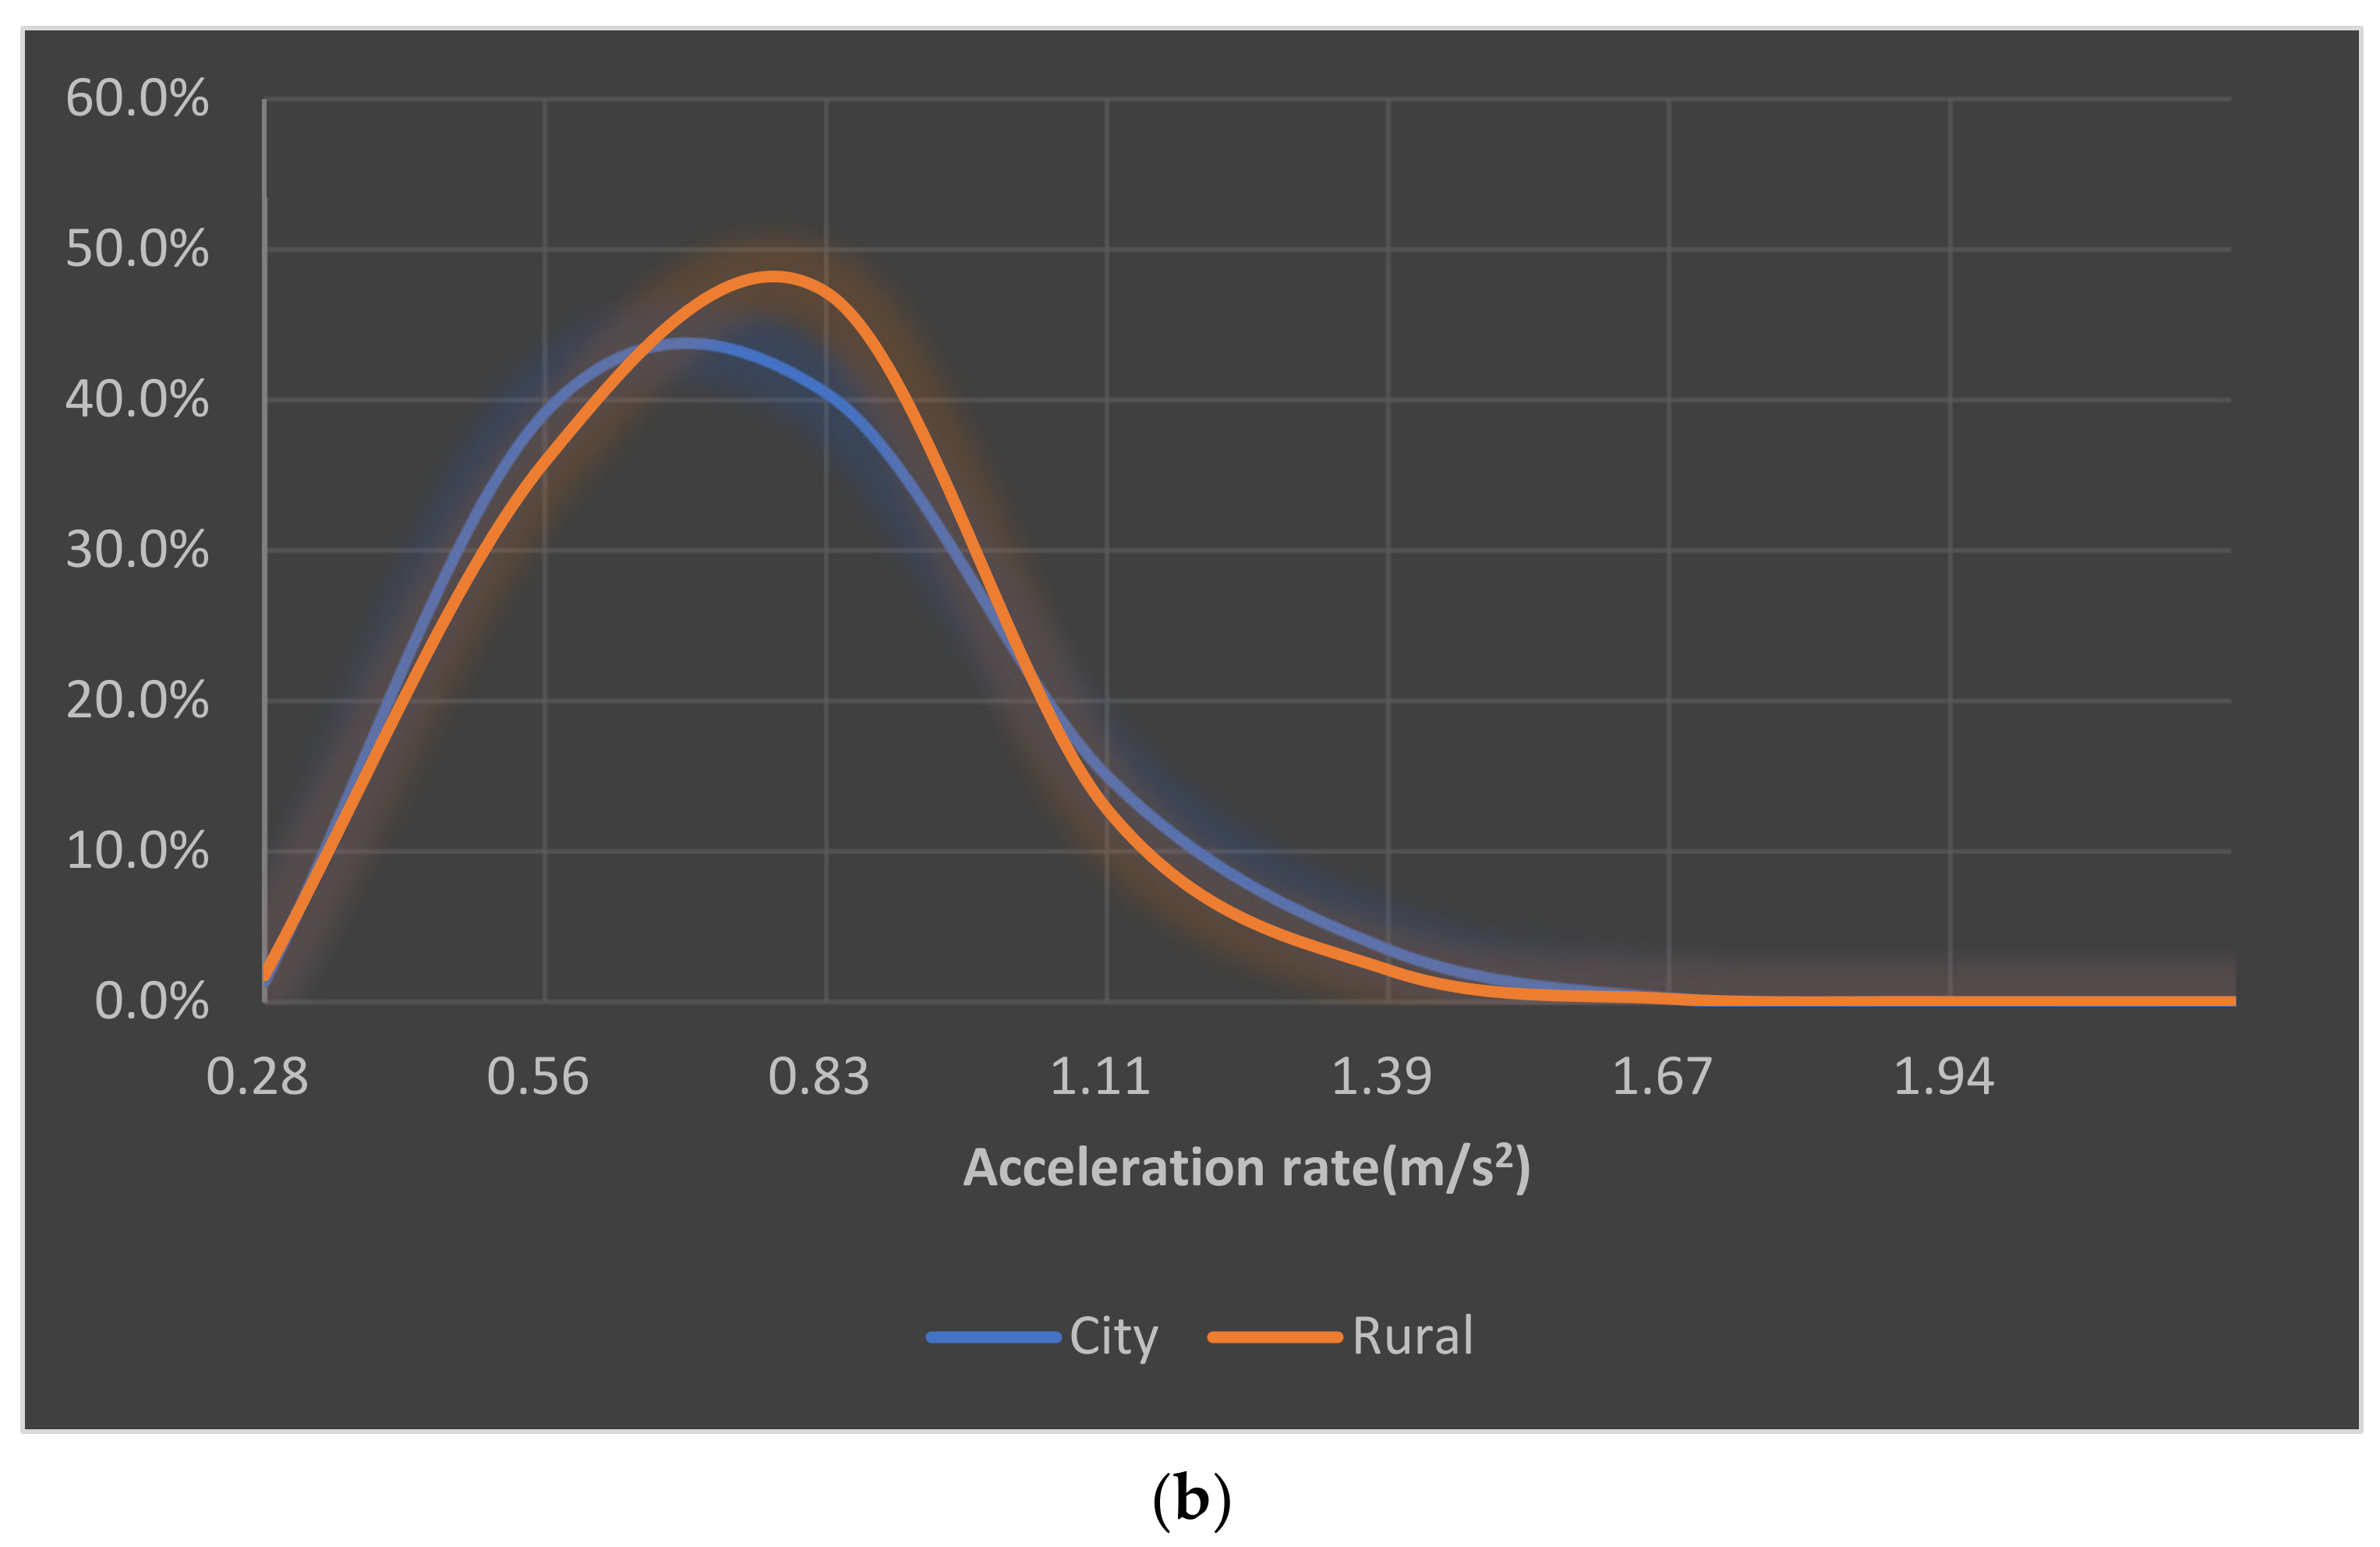
As shown in Table 10 and Figure 9, the acceleration rate of taxis is higher than those of buses and trucks; they significantly differ under 0.05 significance. The 90th percentile of acceleration rates is 0.82, 1.16 and 0.77 m/s2 for buses, taxis and trucks, respectively. According to our T-test results (Table 11), the acceleration rates of buses, taxis and trucks are heteroscedastic.
All types of vehicle acceleration rates in urban and rural areas are heterogeneous and have different average values under 0.05 significance.
5. Discussion
The 90th percentiles of acceleration and deceleration values are selected as representative values [28]. The empirically observed acceleration and deceleration values are shown in Table 8 and Table 10. In all cases, the acceleration and deceleration rates are heterogeneous between the urban and rural areas. Reflecting the heavy vehicle turbulence, the lowest acceleration and deceleration rates between heterogeneous vehicle types are selected as design values. The design values of acceleration for trucks are 0.71 and 0.78 m/s2 in urban and rural areas, respectively. The design values of deceleration for buses are 0.98 and 1.07 m/s2 in urban and rural areas, respectively. The corner clearance distances of a signalized intersection reflecting an empirically observed value are calculated from Equation (2). The suggested corner clearance distances of a signalized intersection, derived from the empirical analysis results of drivers’ behaviors, are shown in Table 12.
6. Conclusions
Road management authorities, such as AASHTO and MOLIT, have their own reference acceleration and deceleration rate values. However, vehicles’ driving performance has significantly improved along with technology development since these reference values were set. The concept of comfortable driving behavior has also changed over time. In this study, we analyzed the acceleration and deceleration behaviors with empirical DTG data from commercial vehicles and adapted them to the corner clearance distance from/to the signalized intersection. The major limitation of this study is that the non-commercial passenger cars’ behavior cannot be observed from DTG data. Furthermore, despite the importance of a driver’s personal information factors, such as driving experience, gender, etc., it was excluded from the raw data column for the respect for anonymity of the Personal Information Protection Act. However, these empirical study results are still valuable because this study deduced the representative acceleration and deceleration values by monitoring multiple vehicle maneuvers from 24-h DTG data for 1 month in multiple study sites.
To improve traffic safety, access management objectives should be updated following the suggested corner clearance distance. The latest acceleration and deceleration behaviors introduced in this study will also contribute to road design guidelines’ revisions, such as auxiliary lanes. When updating the current road design guidelines, additional data collection and analysis would be required to comprehensively reflect gender, age and non-commercial drivers’ behavior to overcome the limitation of this study. The already existing road infrastructures are difficult to immediately reconstruct following revised regulations. However, it is necessary to gradually upgrade those geometric architectures step by step. For example, during a regular maintenance work period, road management authorities should change the road design by reflecting recent regulations for road users’ safety and traffic operational efficiency.
In the close future, driving behaviors are expected to change significantly with the introduction of autonomous vehicles and electric vehicles. For the road infrastructure guidance services to advise the autonomous vehicle’s safe and harmonized driving under mixed traffic conditions with conventional vehicles, it is crucial to predict the conventional vehicles driving path via V2V or V2I cooperation. In this aspect, empirical analysis of acceleration and deceleration rate of conventional buses, trucks and taxis in this study can significantly improve the accuracy of driving path prediction for moderate driving guidance such as the right of way recommendation. This study has some limitations that cannot show the non-commercial drivers’ behavior. Furthermore, this study only focuses on the vehicles that stopped at signalized intersections at red lights and analyze the 90th percentile acceleration and deceleration rate. Thus, various intersection designs and road speed limit variations are not considered in detail. For the more precise prediction of conventional vehicle movements and to accomplish the advanced road design and accompany the driving service, further empirical research using roadside unit detection data needs to be followed in the near future.
Funding
This work is supported by the Korean Agency for Infrastructure Technology Advancement grant funded by the Ministry of Land, Infrastructure and Transport (Grant RS-2022-00142565).
Institutional Review Board Statement
Not applicable.
Informed Consent Statement
Not applicable.
Data Availability Statement
Raw DTG data were collected by the Korean Transportation Safety Authority. The acquisition of raw DTG data is restricted by the Korean Traffic Safety Act. For limited purposes, you may request data access or a copy of the data from the Korean Transportation Safety Authority.
Conflicts of Interest
The author declares no conflict of interest.
References
- ASSHTO. A Policy on Geometric Design of Highways and Streets; ASSHTO: Washington, DC, USA, 2018. [Google Scholar]
- Lee, J. A study of total delay occurrence depending on merging speed from acceleration lane. J. Korea Inst. Intell. Transp. Syst. 2020, 19, 62–73. [Google Scholar] [CrossRef]
- Gowri, A.; Ramaswamy, S. Evaluation of right-turn lanes at signalized intersection in non-lane-based heterogeneous traffic using microscopic simulation model. Transp. Lett. 2015, 7, 61–72. [Google Scholar] [CrossRef]
- Mondal, S.; Gupta, A. Queue-based headway distribution models at signal controlled intersection under mixed traffic. Transp. Res. Rec. J. Transp. Res. Board 2020, 2674, 768–778. [Google Scholar] [CrossRef]
- Bokare, P.S.; Maurya, A.K. Acceleration-deceleration Behaviour of Various Vehicle Types. Transp. Res. Procedia 2017, 25, 4733–4749. [Google Scholar] [CrossRef]
- Patil, G.R.; Pawar, D.S. Microscopic Analysis of Traffic Behavior at Unsignalized Intersections in Developing World. Transp. Lett. 2016, 8, 158–166. [Google Scholar] [CrossRef]
- MOLIT. Explanation of Korean Rules about the Road Structure and Facilities Standard; MOLIT: Sejong, Korea, 2020. [Google Scholar]
- Junhyung, L.; Shin, C.-H.; Youngjin, K.; Seungmin, K. Automatic detection of the access-restricted sections based on geographic characteristics of at-grade intersections in high definition maps. Korea Spat. Plan. Rev. 2019, 103, 27–39. [Google Scholar] [CrossRef]
- Institute of Transportation Engineering. Transportation and Land Development, 2nd ed.; Institute of Transportation Engineering: Washington, DC, USA, 2002. [Google Scholar]
- TRB. Access Management Manual, 2nd ed.; TRB: Washington, DC, USA, 2014. [Google Scholar]
- Akcelik, R.; Biggs, D. Acceleration profile models for vehicles in road traffic. Trans. Sci. 1987, 21, 36–54. [Google Scholar] [CrossRef]
- Arasan, V.T.; Koshy, R.Z. Methodology for modeling highly heterogeneous traffic flow. J. Transp. Eng. 2005, 131, 544–551. [Google Scholar] [CrossRef]
- Bennett, C.R.; Dunn, R.C.M. Driver Deceleration Behavior on a Freeway in New Zealand. Transp. Res. Record 1995, 1510, 70–74. [Google Scholar]
- Bonneson, J.A. Modeling queued driver behavior at signalized junctions. Transp. Res. Record 1992, 1365, 99–107. [Google Scholar]
- Dey, P.P.; Biswas, P. Acceleration of queue leaders at signalized intersections. Indian Highways 2011, 39, 49–54. [Google Scholar]
- Gattis, J.L.; Bryant, M.A.; Duncan, L.K. Truck acceleration speeds and distances at weigh stations. Transp. Res. Rec. 2010, 2195, 20–26. [Google Scholar] [CrossRef]
- Glauz, W.D.; Harwood, D.W.; John, A.D. Projected Vehicle Characteristics through 1995. Transp. Res. Rec. J. Transp. Res. Board 1980, 772, 37–44. [Google Scholar]
- Long, G. Acceleration characteristics of starting vehicles. Transp. Res. Rec. J. Transp. Res. Board 2000, 1737, 58–70. [Google Scholar] [CrossRef] [Green Version]
- Mondal, S.; Gupta, A. Evaluation of driver Acceleration/Deceleration behavior at signalized intersections using vehicle trajectory data. Transp. Lett. 2022, 1–13. [Google Scholar] [CrossRef]
- Rao, S.K.; Madugula, M.S. Acceleration characteristics of automobiles in the determination of sight distance at stop-controlled intersections. Civil Eng. Pract. Design Eng. 1986, 5, 487–498. [Google Scholar]
- Searle, J. Equations for Speed, Time and Distance for Vehicles under Maximum Acceleration; SAE Technical Paper Series, SP-1433:1-7; SAE: Warrendale, PA, USA, 1999. [Google Scholar]
- Samuels, S.E.; Jarvis, J. Acceleration and Deceleration of Modern Vehicles; Australian Road Research Report 86; Australian Road Research Board: Vermont South, VIC, Australia, 1978. [Google Scholar]
- Wang, J.; Dixon, K.K.; Li, H.; Ogle, J. Normal acceleration behavior of passenger vehicles starting from rest at all-way stop-controlled intersections. Transp. Res. Rec. 2004, 1883, 158–166. [Google Scholar] [CrossRef]
- Wang, J.; Dixon, K.K.; Li, H.; Ogle, J. Normal deceleration behavior of passenger vehicles at stop sign–controlled intersections evaluated with in-vehicle Global Positioning System data. Transp. Res. Rec. 2005, 1937, 120–127. [Google Scholar] [CrossRef]
- Fildes, B. Older drivers’ safety and mobility: Current and future issues. Transp. Res. Part F Traffic Psychol. Behav. 2006, 9, 307–308. [Google Scholar] [CrossRef]
- Snare, M. Dynamic Model for Predicting Maximum and Typical Acceleration Rates of Passenger Vehicles. Master’s Thesis, Virginia Polytechnic Institute and State University, Blacksburg, VA, USA, 2002. [Google Scholar]
- TRB. Highway Capacity Manual; TRB: Washington, DC, USA, 2010. [Google Scholar]
- TRB. Determination of Stopping Sight Distances; TRB: Washington, DC, USA, 1997. [Google Scholar]
Figure 1.
South Korean rules of road access restricted area [2]. (a) Unchannelized Intersection; (b) channelized Intersection.
Figure 1.
South Korean rules of road access restricted area [2]. (a) Unchannelized Intersection; (b) channelized Intersection.


Figure 3.
Study Sites.

Figure 4.
Departure and approach areas of study sites (same in city and rural areas).

Figure 5.
Time–distance and speed–time diagrams in a signalized intersection [5].
Figure 5.
Time–distance and speed–time diagrams in a signalized intersection [5].

Figure 6.
Extracted study sites’ DTG data. (a) Settle Polygon by Analyzing DTG Data; (b) Extracted DTG Data.
Figure 6.
Extracted study sites’ DTG data. (a) Settle Polygon by Analyzing DTG Data; (b) Extracted DTG Data.

Figure 7.
Data screening process.


Figure 8.
Deceleration rate distribution. (a) Deceleration rate distribution by vehicle type (City + Rural); (b) Deceleration rate distribution by area (Bus + Taxi + Truck).
Figure 8.
Deceleration rate distribution. (a) Deceleration rate distribution by vehicle type (City + Rural); (b) Deceleration rate distribution by area (Bus + Taxi + Truck).

Figure 9.
Deceleration rate distribution. (a) Acceleration rate distribution by vehicle type (City + Rural); (b) Acceleration rate distribution by area (Bus + Taxi + Truck).
Figure 9.
Deceleration rate distribution. (a) Acceleration rate distribution by vehicle type (City + Rural); (b) Acceleration rate distribution by area (Bus + Taxi + Truck).


Table 1.
Driving speed and average acceleration rate in Korean road design regulation [7].
Table 1.
Driving speed and average acceleration rate in Korean road design regulation [7].
| Driving Speed (km/h) | 70 | 63 | 60 | 55 | 51 | 50 | 45 | 42 | 40 | 35 | 30 | 28 | 20 |
| Average Acceleration Rate (m/s2) | 0.28 | 0.34 | 0.36 | 0.41 | 0.46 | 0.47 | 0.54 | 0.59 | 0.63 | 0.74 | 0.88 | 0.95 | 1.38 |
Table 2.
Korean minimum deceleration and acceleration lane length [7].
Table 2.
Korean minimum deceleration and acceleration lane length [7].
| Mainline Design Speed (km/h) | 120 | 110 | 100 | 90 | 80 | 70 | 60 | ||
|---|---|---|---|---|---|---|---|---|---|
| Ramp Design Speed (km/h) | 80 | Deceleration Lane Length (m) | 120 | 105 | 85 | 60 | - | - | - |
| 245 | 120 | 55 | |||||||
| 70 | 140 | 120 | 100 | 75 | 55 | - | - | ||
| 335 | 210 | 145 | 50 | - | - | - | |||
| 60 | 155 | 140 | 120 | 100 | 80 | 55 | - | ||
| 400 | 285 | 220 | 130 | 55 | - | - | |||
| 50 | Acceleration Lane Length (m) | 170 | 150 | 135 | 110 | 90 | 70 | 50 | |
| 445 | 330 | 265 | 175 | 100 | 50 | - | |||
| 40 | 175 | 160 | 145 | 120 | 100 | 85 | 65 | ||
| 470 | 360 | 300 | 210 | 135 | 85 | - | |||
| 30 | 185 | 170 | 155 | 135 | 115 | 95 | 80 | ||
| 500 | 390 | 330 | 240 | 165 | 110 | 70 | |||
Table 3.
Minimum deceleration and acceleration lane lengths [1].
Table 3.
Minimum deceleration and acceleration lane lengths [1].
| Mainline Design Speed | Design Speed on Ramp | |||||||||
|---|---|---|---|---|---|---|---|---|---|---|
| Stop Condition | 20 km/h | 30 km/h | 40 km/h | 50 km/h | 60 km/h | 70 km/h | 80 km/h | |||
| Initial Vehicle Speed on Ramp | ||||||||||
| Design Speed | Merge/Diverge Speed | 0 km/h | 20 km/h | 28 km/h | 35 km/h | 42 km/h | 51 km/h | 63 km/h | 70 km/h | |
| Deceleration Lane Length (m) | 50 km/h | 47 km/h | 75 m | 70 m | 60 m | 45 m | - | - | - | - |
| 37 km/h | 60 m | 50 m | 30 m | - | - | - | - | - | ||
| 60 km/h | 55 km/h | 95 m | 90 m | 80 m | 65 m | 55 m | - | - | - | |
| 45 km/h | 95 m | 80 m | 65 m | 45 m | - | - | - | - | ||
| 70 km/h | 63 km/h | 110 m | 105 m | 95 m | 85 m | 70 m | 55 m | - | - | |
| 53 km/h | 150 m | 130 m | 110 m | 90 m | 65 m | - | - | - | ||
| 80 km/h | 70 km/h | 130 m | 125 m | 115 m | 100 m | 90 m | 80 m | 55 m | - | |
| 60 km/h | 200 m | 180 m | 165 m | 145 m | 115 m | 65 m | - | - | ||
| Acceleration Lane Length (m) | 90 km/h | 77 km/h | 145 m | 140 m | 135 m | 120 m | 110 m | 100 m | 75 m | 60 m |
| 67 km/h | 260 m | 245 m | 225 m | 205 m | 175 m | 125 m | 35 m | - | ||
| 100 km/h | 85 km/h | 170 m | 165 m | 155 m | 145 m | 135 m | 120 m | 100 m | 85 m | |
| 74 km/h | 345 m | 325 m | 305 m | 285 m | 255 m | 205 m | 110 m | 40 m | ||
| 110 km/h | 91 km/h | 180 m | 180 m | 170 m | 160 m | 150 m | 140 m | 120 m | 105 m | |
| 81 km/h | 430 m | 410 m | 390 m | 370 m | 340 m | 290 m | 200 m | 125 m | ||
| 120 km/h | 98 km/h | 200 m | 195 m | 185 m | 175 m | 170 m | 155 m | 140 m | 120 m | |
| 88 km/h | 545 m | 530 m | 515 m | 490 m | 460 m | 410 m | 325 m | 245 m | ||
| 130 km/h | 103 km/h | 215 m | 210 m | 205 m | 195 m | 185 m | 170 m | 155 m | 135 m | |
| 92 km/h | 610 m | 580 m | 550 m | 530 m | 520 m | 500 m | 375 m | 300 m | ||
Table 4.
Road access restricted distance in South Korean act.
| Design Speed (km/h) | Road Access Restricted Distance (m) | |
|---|---|---|
| Urban | Rural | |
| 50 | 25 | 40 |
| 60 | 40 | 60 |
| 70 | 60 | 85 |
| 80 | 70 | 100 |
Table 5.
The DTG data column.
| No. | Description | Type | Unit |
|---|---|---|---|
| 1 | Vehicle ID | String | - |
| 2 | Vehicle Type Code | String | Bus/Truck/Taxi/Etc. |
| 3 | Speed | Integer | km/h |
| 4 | Engine Revolution | Integer | RPM |
| 5 | Break Signal | Binary | On (1)/Off (0) |
| 6 | GPS Longitude | Integer | WGS84 (00.000000) |
| 7 | GPS Latitude | Integer | WGS84 (000.000000) |
| 8 | Heading | Integer | Degree |
| 9 | Longitude Acceleration | Integer | m/s2 (1 decimal place) |
| 10 | Latitude Acceleration | Integer | m/s2 (1 decimal place) |
| 11 | Date | Integer | YYMMDD hhmmssss (0.01 s) |
Table 6.
Latitude and longitude of study sites.
| Approaching | Departure | |||||||||||||
|---|---|---|---|---|---|---|---|---|---|---|---|---|---|---|
| City | Rural | City | Rural | Rural | ||||||||||
| # | Latitude | Longitude | # | Latitude | Longitude | # | Latitude | Longitude | # | Latitude | Longitude | # | Latitude | Longitude |
| 1 | 37.72394 | 127.0976 | 1 | 37.18925 | 127.5607 | 1 | 37.88737 | 127.1944 | 1 | 37.14497 | 127.5859 | 21 | 37.29773 | 127.2334 |
| 2 | 37.71236 | 127.1063 | 2 | 37.14929 | 127.5792 | 2 | 37.74994 | 127.0846 | 2 | 38.09039 | 127.08 | 22 | 37.11436 | 127.428 |
| 3 | 37.64546 | 127.1287 | 3 | 36.96333 | 127.8685 | 3 | 37.64594 | 127.1285 | 3 | 38.07761 | 127.2707 | 23 | 38.03541 | 127.2626 |
| 4 | 37.75593 | 127.0812 | 4 | 36.91914 | 127.9448 | 4 | 37.73332 | 126.7306 | 4 | 37.98989 | 127.2425 | 24 | 37.98027 | 127.2444 |
| 5 | 37.63339 | 126.8251 | 5 | 38.08305 | 127.2653 | 5 | 37.73571 | 126.7379 | 5 | 37.90179 | 127.2093 | 25 | 37.12298 | 126.9041 |
| 6 | 37.44244 | 126.7788 | 6 | 38.07767 | 127.2711 | 6 | 37.73288 | 126.7306 | 6 | 37.84019 | 127.1561 | 26 | 37.03031 | 127.9245 |
| 7 | 37.03973 | 127.0685 | 7 | 38.07764 | 127.2707 | 7 | 37.72938 | 126.7237 | 7 | 37.83776 | 127.2877 | 27 | 36.93195 | 128.2054 |
| 8 | 37.97938 | 127.2444 | 8 | 37.72857 | 126.7291 | 8 | 38.01607 | 127.1509 | 28 | 36.85829 | 127.9231 | |||
| 9 | 37.94273 | 127.2329 | 9 | 36.9791 | 126.931 | 9 | 38.02147 | 127.1833 | 29 | 36.83129 | 127.77 | |||
| 10 | 37.90797 | 127.2127 | 10 | 37.35839 | 126.7312 | 10 | 38.04843 | 127.3675 | 30 | 36.9852 | 126.9345 | |||
| 11 | 37.17683 | 126.9398 | 11 | 37.35166 | 126.7283 | 11 | 38.02462 | 127.3628 | 31 | 37.77306 | 127.4562 | |||
| 12 | 37.83117 | 127.2911 | 12 | 37.3145 | 126.8521 | 12 | 37.97296 | 127.3216 | 32 | 37.04245 | 127.3603 | |||
| 13 | 38.01835 | 127.1597 | 13 | 37.271 | 127.0628 | 13 | 37.71588 | 127.4075 | 33 | 37.55244 | 126.675 | |||
| 14 | 37.90043 | 127.2083 | 14 | 37.32441 | 126.8045 | 14 | 37.01141 | 126.9937 | 34 | 37.55195 | 126.6798 | |||
| 15 | 37.76978 | 127.4483 | 15 | 37.40899 | 126.8238 | 15 | 37.0232 | 127.3295 | 35 | 37.48959 | 126.6473 | |||
| 16 | 37.04685 | 127.3636 | 16 | 37.01965 | 127.0716 | 16 | 37.34237 | 127.4901 | 36 | 37.49089 | 126.648 | |||
| 17 | 37.44091 | 127.2634 | 17 | 37.03354 | 127.0701 | 17 | 36.959 | 127.0651 | 37 | 37.17142 | 127.3566 | |||
| 18 | 37.11088 | 127.4305 | 18 | 37.06642 | 127.0641 | 18 | 36.96051 | 127.0661 | 38 | 36.3062 | 127.5749 | |||
| 19 | 37.22813 | 127.3023 | 19 | 36.96691 | 127.0712 | 39 | 36.2925 | 127.5665 | ||||||
| 20 | 37.08091 | 127.4366 | 20 | 36.96839 | 127.0719 | 40 | 36.16964 | 127.7732 | ||||||
| 41 | 37.0067 | 127.0782 | ||||||||||||
| 42 | 37.03691 | 127.0716 | ||||||||||||
Table 7.
Data analysis cases.
| Area | Vehicle Type | |||
|---|---|---|---|---|
| Bus + Taxi + Truck | Bus | Taxi | Truck | |
| Urban + Rural | Case 1 | Case 2 | Case 3 | Case 4 |
| Urban | Case 5 | Case 6 | Case 7 | Case 8 |
| Rural | Case 9 | Case 10 | Case 11 | Case 12 |
Table 8.
Analysis results of deceleration in approach areas.
| Case (Vehicle, Area) | Deceleration Rate (m/s2) | Total | Avg. | Max. | 90th mPCTL | |||||||
|---|---|---|---|---|---|---|---|---|---|---|---|---|
| 0.28 | 0.56 | 0.83 | 1.11 | 1.39 | 1.67 | 1.94 | 2.22 | |||||
| Case 1 (All, All) | 1820 | 4392 | 5580 | 4191 | 1919 | 565 | 74 | 1 | 18,542 | 0.74 | 1.97 | 1.20 |
| Case 2 (Bus, All) | 995 | 2172 | 2039 | 1322 | 375 | 61 | 4 | 0 | 6968 | 0.63 | 1.76 | 1.04 |
| Case 3 (Taxi, All) | 77 | 372 | 989 | 1421 | 1056 | 411 | 57 | 1 | 4384 | 0.99 | 1.97 | 1.41 |
| Case 4 (Truck, All) | 748 | 1848 | 2552 | 1448 | 488 | 93 | 13 | 0 | 7190 | 0.68 | 1.88 | 1.09 |
| Case 5 (All, Urban) | 490 | 1506 | 2260 | 1859 | 1039 | 352 | 50 | 1 | 7557 | 0.80 | 1.97 | 1.28 |
| Case 6 (Bus, Urban) | 321 | 862 | 905 | 447 | 89 | 13 | 0 | 0 | 2637 | 0.62 | 1.57 | 0.98 |
| Case 7 (Taxi, Urban) | 57 | 316 | 837 | 1192 | 882 | 333 | 48 | 1 | 3666 | 0.98 | 1.97 | 1.41 |
| Case 8 (Truck, Urban) | 112 | 328 | 518 | 220 | 68 | 6 | 2 | 0 | 1254 | 0.67 | 1.74 | 1.03 |
| Case 9 (All, Rural) | 1330 | 2886 | 3320 | 2332 | 880 | 213 | 24 | 0 | 10,985 | 0.69 | 1.89 | 1.13 |
| Case 10 (Bus, Rural) | 674 | 1310 | 1134 | 875 | 286 | 48 | 4 | 0 | 4331 | 0.64 | 1.76 | 1.07 |
| Case 11 (Taxi, Rural) | 20 | 56 | 152 | 229 | 174 | 78 | 9 | 0 | 718 | 1.00 | 1.89 | 1.44 |
| Case 12 (Truck, Rural) | 636 | 1520 | 2034 | 1228 | 420 | 87 | 11 | 0 | 5936 | 0.69 | 1.88 | 1.09 |
Table 9.
Deceleration rate T-test results.
| Bus | Taxi | Truck | Urban | Rural | |
|---|---|---|---|---|---|
| Variance | 1.21 | 1.39 | 1.21 | 1.56 | 1.40 |
| N | 6968 | 4384 | 7190 | 7557 | 10,985 |
| Degree of Freedom | 14,156 | 8757 | 15,644 | ||
| F | 1.00 | 1.15 | 1.12 | ||
| P (F ≤ f) One-tail | 0.48 | 8.4 × 10⁻⁸ | 6.53 × 10⁻⁸ | ||
| F Critical One-tail | 1.04 | 1.05 | 1.04 | ||
| T Statistic | −10.64 | 49.26 | 22.71 | ||
| P (T ≤ t) One-tail | 1.23 × 10⁻²⁶ | 0 | 1.3 × 10−112 | ||
| T Critical One-tail | 1.64 | 1.65 | 1.64 | ||
| P (T ≤ t) Two-tail | 2.46 × 10⁻²⁶ | 0 | 2.5 × 10−112 | ||
| T Critical Two-tail | 1.96 | 1.96 | 1.96 |
Table 10.
Analysis results of acceleration in departure areas.
| Case (Vehicle, Area) | Acceleration Rate (m/s2) | Total | Avg. | Max. | 90th PCTL | |||||||
|---|---|---|---|---|---|---|---|---|---|---|---|---|
| 0.28 | 0.56 | 0.83 | 1.11 | 1.39 | 1.67 | 1.94 | 2.22 | |||||
| Case 1 (All, All) | 431 | 10,175 | 11,810 | 3766 | 765 | 67 | 5 | 0 | 27,019 | 0.64 | 1.90 | 0.94 |
| Case 2 (Bus, All) | 176 | 5021 | 6253 | 1111 | 33 | 0 | 0 | 0 | 12,594 | 0.61 | 1.30 | 0.82 |
| Case 3 (Taxi, All) | 30 | 544 | 2154 | 2235 | 718 | 67 | 5 | 0 | 5753 | 0.86 | 1.90 | 1.16 |
| Case 4 (Truck, All) | 225 | 4610 | 3403 | 420 | 14 | 0 | 0 | 0 | 8672 | 0.55 | 1.28 | 0.77 |
| Case 5 (All, Urban) | 200 | 5534 | 5703 | 2114 | 494 | 41 | 2 | 0 | 14,088 | 0.65 | 1.86 | 0.96 |
| Case 6 (Bus, Urban) | 107 | 3580 | 3318 | 405 | 4 | 0 | 0 | 0 | 7414 | 0.58 | 1.28 | 0.78 |
| Case 7 (Taxi, Urban) | 21 | 417 | 1561 | 1635 | 490 | 41 | 2 | 0 | 4167 | 0.85 | 1.86 | 1.15 |
| Case 8 (Truck, Urban) | 72 | 1537 | 824 | 74 | 0 | 0 | 0 | 0 | 2507 | 0.52 | 1.11 | 0.71 |
| Case 9 (All, Rural) | 231 | 4649 | 6098 | 1651 | 273 | 26 | 3 | 0 | 12,931 | 0.64 | 1.90 | 0.91 |
| Case 10 (Bus, Rural) | 69 | 1449 | 2924 | 709 | 29 | 0 | 0 | 0 | 5180 | 0.65 | 1.30 | 0.88 |
| Case 11 (Taxi, Rural) | 9 | 127 | 595 | 596 | 230 | 26 | 3 | 0 | 1586 | 0.88 | 1.90 | 1.18 |
| Case 12 (Truck, Rural) | 153 | 3073 | 2579 | 346 | 14 | 0 | 0 | 0 | 6165 | 0.56 | 1.28 | 0.78 |
Table 11.
Acceleration rate T-test results.
| Bus | Taxi | Truck | Urban | Rural | |
|---|---|---|---|---|---|
| Variance | 0.35 | 0.71 | 0.34 | 0.64 | 0.54 |
| N | 12,594 | 5753 | 8672 | 14,088 | 12,931 |
| Degree of Freedom | 8428 | 18,864 | 27,017 | ||
| F | 0.49 | 1.04 | 1.20 | ||
| P (F ≤ f) One-tail | 0 | 0.03 | 1.82 × 10⁻²⁵ | ||
| F Critical One-tail | 0.96 | 1.03 | 1.029 | ||
| T Statistic | −73.90 | 24.28 | 3.98 | ||
| P (T ≤ t) One-tail | 0 | 1.6 × 10−128 | 3.52 × 10⁻⁵ | ||
| T Critical One-tail | 1.65 | 1.64 | 1.64 | ||
| P (T ≤ t) Two-tail | 0 | 3.3 × 10−128 | 7.03 × 10⁻⁵ | ||
| T Critical Two-tail | 1.96 | 1.96 | 1.96 |
Table 12.
Suggestion of corner clearance distance of signalized intersection reflecting DTG analysis results.
Table 12.
Suggestion of corner clearance distance of signalized intersection reflecting DTG analysis results.
| Type | Design Speed (km/h) | 80 | 70 | 60 | 50 | ||
|---|---|---|---|---|---|---|---|
| Approaching Area (m) | Suggestion | Urban | a = 0.98 m/s2 | 193 | 156 | 119 | 87 |
| Rural | a = 1.07 m/s2 | 177 | 143 | 109 | 80 | ||
| MOLIT [7] | 96 | 78 | 60 | 43 | |||
| AASHTO [1] | 130 | 110 | 95 | 75 | |||
| Departure Area (m) | Suggestion | Urban | a = 0.71 m/s2 | 196 | 153 | 110 | 74 |
| Rural | a = 0.78 m/s2 | 178 | 139 | 100 | 68 | ||
| MOLIT [7] | None | ||||||
| AASHTO [1] | 200 | 150 | 95 | 60 | |||
Publisher’s Note: MDPI stays neutral with regard to jurisdictional claims in published maps and institutional affiliations. |
© 2022 by the author. Licensee MDPI, Basel, Switzerland. This article is an open access article distributed under the terms and conditions of the Creative Commons Attribution (CC BY) license (https://creativecommons.org/licenses/by/4.0/).
Share and Cite
MDPI and ACS Style
Lee, J. Acceleration and Deceleration Rates in Interrupted Flow Based on Empirical Digital Tachograph Data. Sustainability 2022, 14, 11165. https://0-doi-org.brum.beds.ac.uk/10.3390/su141811165
AMA Style
Lee J. Acceleration and Deceleration Rates in Interrupted Flow Based on Empirical Digital Tachograph Data. Sustainability. 2022; 14(18):11165. https://0-doi-org.brum.beds.ac.uk/10.3390/su141811165
Chicago/Turabian StyleLee, Junhyung. 2022. "Acceleration and Deceleration Rates in Interrupted Flow Based on Empirical Digital Tachograph Data" Sustainability 14, no. 18: 11165. https://0-doi-org.brum.beds.ac.uk/10.3390/su141811165
Note that from the first issue of 2016, this journal uses article numbers instead of page numbers. See further details here.