


Adopting Electric Motorcycles for Ride-Hailing Services: Influential Factors from Driver’s Perspective

Department of Civil and Environmental Engineering, Universitas Gadjah Mada, Yogyakarta 55281, Indonesia
*
Author to whom correspondence should be addressed.
Sustainability 2022, 14(19), 11891; https://0-doi-org.brum.beds.ac.uk/10.3390/su141911891
Submission received: 16 August 2022
/
Revised: 14 September 2022
/
Accepted: 20 September 2022
/
Published: 21 September 2022
(This article belongs to the Collection Emerging Technologies and Sustainable Road Safety)
Abstract
:Recently, the Indonesian government has been increasingly encouraging the population to utilize electric vehicles. In the public transportation sector, including ride-hailing services, the use of electric vehicles, especially motorcycles, is promoted. This study aims to explore the willingness to adopt electric motorcycles among ride-hailing drivers by specifying the preference for buying or renting in adopting electric motorcycles. Using a stated preference method, an interview survey was conducted on 416 ride-hailing drivers in Yogyakarta, Indonesia. Nine variables were tested to understand the determinants of electric motorcycle adoption, including purchase or rental costs, cost for motorcycle title transfer, fuel price, maximum coverage distance, maximum speed, the distance between battery exchange stations, annual tax, and credit payment. By using the ordered logit model, the results revealed two variables affecting the purchase of electric motorcycles: purchase price and maximum coverage distance. Meanwhile, four variables significantly influenced the determination of electric motorcycle rental: coverage distance, fuel price, rental fees, and the distance between battery exchange stations. Sociodemographic variables also significantly affect the decision to rent but not purchase electric motorcycles. Meanwhile, full-time drivers and students who work part-time as drivers are more likely to rent electric motorcycles. This study also found that renting electric motorcycles had a better likelihood of adoption than owning them. Finally, several policies were proposed to boost the adoption of electric motorcycles among ride-hailing drivers, including subsidy provisions, technology improvement, and priority provisions for drivers who use electric motorcycles.
1. Introduction
Although the use of motorcycles is unsafe [1,2,3], motorcycles are a space-efficient travel mode because of their size and mobility [4,5,6,7]. In some Indonesian cities, such as Solo [8] and Yogyakarta [9], the narrow streets in the city center cause people to prefer to use motorcycles rather than cars and public transport. People living in Yogyakarta also have a high dependence on motorcycles to support their daily needs [9]. A similar situation also occurred in many cities in Asia, Africa, and Latin America, where motorcycle use and ownership has grown dramatically in the last three decades [10].
In the last few decades, the emergence of motorcycle-based ride-hailing (MBRH) services has caused Indonesian people to become more dependent on motorcycles. The high dependence of the community on MBRH services is because, apart from transportation, they can also be used to deliver fresh food and shopping goods [11]. Interestingly, the delivery services offered by MBRH service have been proven to reduce people’s mobility [12]. Unfortunately, the majority of motorcycles used in ride-hailing services are gasoline-powered motorcycles [13]. Based on an Institute for Essential Services Reform (IESR) report, the current demand for electric motorcycles is very low compared to the total production capacity, which has reached 877,000 units/year [14]. For example, sales of electric motorcycles in 2020 only reached 0.26% (1947 units) of the 750,000 production target. Due to this, since 2020, the government has dealt with the MBRH companies, i.e., Gojek and Grab, as the two biggest ride-hailing companies [15], to encourage MBRH drivers to use electric motorcycles. The government and MBRH companies conducted a pilot program in 2020 by providing electric motorcycles without rental fees. Moreover, Grab provided more than 6000 electric motorcycles for their drivers in 2021 [16]. As discussed by Wu and Kontou, it is expected that electric motorcycles could be a solution for green transportation and reduce the emissions produced by gasoline-powered motorcycles [17].
However, previous studies showed many barriers to adopting electric vehicles. An investigation revealed that refueling times and the limited driving range of electric vehicles had become the reasons for people in the Netherlands to keep owning gasoline-powered cars rather than adopting electric cars [18]. Meanwhile, a study in Norway revealed that the charging station quantity significantly affected the growth of electric vehicle adoption [19]. A similar finding was also discovered in France, where it was said that the position of charging stations in public spaces impacted the adoption of electric vehicles [20]. Supporting other studies, a study in the United States revealed that battery range, cost, charging stations, and safety are significant concerns, ordered from the highest to lowest, in adopting electric vehicles [21]. Additionally, state regulatory factors also significantly influenced the adoption of electric vehicles. A study showed that exemptions from value added tax (VAT) and purchase tax could significantly increase the demand for electric vehicles in Norway [22]. Meanwhile, policy incentives for electric vehicles, including free/discounted electric charging, purchase tax reduction/exemption, and free parking, effectively stimulated the willingness to buy electric vehicles in China [23]. The study also found that driving privileges for electric car drivers, such as free access to bus lanes and driving restriction rescission, could also increase the adoption of electric vehicles [23]. A similar result was found by Li et al. [24], showing that financial subsidies, driving privileges, preferential tax, and free parking for electric vehicles increased the number of consumers of electric cars. However, another study revealed that not all electric car consumers were affected by bus lane driving privileges and toll exemptions [22].
Therefore, this study aims to examine the factors influencing the preferences of MBRH drivers in adopting electric motorcycles. A study showed that involving electric vehicles as a mode option for ride-hailing service is crucial to creating an improved potential commercial future for ride-hailing [25]. Moreover, studies also found that ride-hailing services, not only motorcycle-based but also car-based, have replaced the mode option of private vehicles and public transport in Asian countries [26,27] and American and European countries [28,29,30]. Although previous studies have also investigated the adoption of electric ride-hailing [31,32,33], those studies focused on car-based ride hailing. In fact, there are different characteristics between electric cars and motorcycles. For example, the difference in purchase price between electric and gasoline-powered motorcycles is not as high as the purchase price difference between electric and gasoline-powered cars. In addition, the electric motorcycles’ refueling time is much shorter than electric cars. Due to this, this study is expected to enhance the existing literature on electric vehicles from a motorcycle mode context. Furthermore, this study examined the adoption of electric motorcycles for ride-hailing services in two models: buying and renting. A ride-hailing study in the United States also considered the preference to buy, rent, or lease a new vehicle, where they found that renting and leasing services offered by ride-hailing companies could attract drivers to adopt a new car [32]. Currently, vehicle rental is also in great demand in various countries such as European countries, including Spain [34], Italy [35], and Germany [36]. In this regard, this study could expand the current knowledge concerning preferences for electric motorcycles for ride-hailing services in the case of purchasing and renting an electric motorcycle. On a practical level, this study is expected to assist the government and MBRH companies in determining appropriate policies for encouraging the shift from gasoline-powered to electric motorcycles, which positively impacts air pollution [37] and traffic noise [38].
The remainder of this paper is organized as follows. The literature review containing previous studies on electric motorcycle preferences and electric ride-hailing is presented in Section 2. Section 3 discusses the study method, followed by survey design and data collection in Section 4. The findings of the research are discussed in Section 5. The paper is completed with the conclusion, policy recommendation, and future research possibilities in Section 6.
2. Literature Review
Although the literature shows that many studies investigated the determinants of electric vehicle adoption, most focused on car mode [39,40,41]. Meanwhile, limited studies explored the factors influencing the adoption of electric motorcycles. In an Indonesian cities context, a study employed a mixed logit model to assess the extent to which electric motorcycles have the potential to replace gasoline-powered motorcycles [8]. By using a stated preference survey, respondents were faced with five scenarios in which they must choose between gasoline motorcycles, electric motorcycles, and no motorcycles. The variables considered in his study consist of initial payment, monthly installments, fuel price, speed, coverage distance, and charging duration. By involving 1208 respondents, the results reveal that there is likely a market for electric motorcycles. However, they will need to be priced similarly to cheap gas-powered motorcycles and have comparable performance. Speed, coverage distance, charging duration, and cost were crucial factors in adopting electric motorcycles. It was also found that electric motorcycles had a greater chance of replacing gasoline-powered motorcycles under the conditions of an increase in fuel prices and a significant improvement in battery technology.
Studies on the preference for electric motorcycles were also conducted in Asia countries such as Vietnam [42] and China [43,44,45]. A study in Hanoi, Vietnam, explored the market share of electric motorcycles by including three alternative modes offered to 400 households: 100 cc gasoline-powered motorcycle, 250 cc gasoline-powered motorcycle, and electric motorcycle [27]. The motorcycles’ attributes consist of license requirements, range, refueling time, sales tax, price, maintenance costs, speed, acceleration, and operating costs. By applying the mixed logit model, the study revealed that technological advancements and incentives (especially sales taxes) substantially impacted electric motorcycle adoption. Meanwhile, an increase in gasoline costs could also significantly expand the market share of electric scooters. A different study analyzed the key factors affecting willingness to buy and willingness to pay (WTP) for electric motorcycles in Macau, China [43]. Using a binary logistic regression, the study concluded that people in Macau comprehend electric motorcycles less. They paid greater attention to the actual cost of electric motorcycles, such as selling price, government incentives for tax, maintenance fees, and charging charges, rather than to electric motorcycles’ speed and load capacity. Then, by implementing the contingent valuation technique, it was found that the amount users were willing to pay for electric motorcycles was around 1.3 thousand Macau Pataca (MOP) or USD 160.36, far lower than the pricing disparity of 8000 MOP (USD 986.83) between gasoline-powered and electric motorcycles.
Another study was also conducted in European countries such as Italy [46], Spain [47], and France [48]. For example, by interviewing 906 individuals and applying multinomial logit and random parameter logit models, the study found that purchase price, engine performance, yearly tax and insurance premium, fuel efficiency, coverage distance, manufacturer’s nation, and replaceable battery were determinants of the choice decision between electric and petrol scooters in Italy [46].
Meanwhile, the literature also shows that many studies explore the adoption of electric ride-hailing. By categorizing the ride-hailing drivers into fuel or hybrid ride-hailing drivers and electric ride-hailing drivers, a study in Shenzhen, China, revealed that fuel cost significantly influences the adoption of electric cars for hybrid ride-hailing drivers but not for electric ride-hailing drivers. Meanwhile, ride-hailing drivers’ characteristics, including education level, full-time ride-hailing driver, and monthly income, are significantly related to the electric car adoption for ride-hailing services. They also found that vehicle sources consisting of private cars and vehicles on the platform, charging stations, charging duration, and coverage distance significantly affect the adoption of electric ride-hailing [31]. Moreover, a study conducted in the United States revealed that younger ride-hailing drivers who travel often and own more automobiles are more likely to convert to fuel-efficient vehicles. Meanwhile, those who have a postgraduate level, live in urban areas, and are under 48 years old are more pro-fuel-efficiency than their counterparts [32]. Another study on electric ride-hailing also showed that, similar to private electric cars, charging infrastructures for ride-hailing has become one of the essential determinants for electric car adoption [49,50].
3. Methods
3.1. D-Efficiency
D-efficiency or D-optimum design is a technique to create optimal scenarios in state choice experiments. This technique was used to minimize the variance of the estimated regression coefficients [51]. The optimum scenario created can be measured from a D-efficiency value with the following equation:
where ND is the number of scenarios, X is a matrix of independent variables, (X′X)−1 is a matrix inverse of independent variable multiplication, and p is a parameter.
The D-efficiency value ranges from 0 to 100, where the higher the D-efficiency value, the more optimal scenario will be obtained. However, one study showed that although the ideal D-Efficiency value is 100, it can be considered reasonable if the value is more than 0.8 [52].
3.2. Ordered Logit Model
Almost all studies discussed in the Section 2 used a discrete choice model in analyzing the adoption of electric motorcycles, such as a mixed logit model [8,42], binary logit model [43], multinomial logit and random parameter logit model [46], or generalized ordered logit model [47]. Studies on electric ride-hailing also used a similar method: the ordered logit model [31] and the multinomial logit model [32]. Due to this, this study applied the ordered logit model in exploring the determinants of electric motorcycle adoption among MBRH drivers. The ordered logit model was also used to determine the influencing factors of hybrid car adoption in Indonesian cities and produced a good model fit and satisfactory results [41].
The ordered logit model is a model used to forecast the likelihood of an occurrence where the dependent variable is based on the discrete choice of ordinal datasets [53]. The dependent variable of this study is the likelihood of MBRH driver-q in adopting an electric motorcycle, with five ordered responses: definitely not adopt (j1), not adopt (j2), undecided (j3), adopt (j4), and definitely adopt (j5), both by purchasing and renting electric motorcycles. The utility (Us) can be formulated as follows:
where Xsm explains independent variables along an m-number of variables, βm means a vector of the estimated parameters, and εs means a random error term. Meanwhile, the measurement model is formulated as follows:
where τ1,2 parameters are thresholds to be estimated. Where F is the cumulative distribution function of logistic distribution, the probability for each choice is given by:
4. Survey Design and Data Collection
4.1. Questionnaire Design
The questionnaire form consists of two sections. The first section is questions related to the respondents’ characteristics, including gender, age, education level, income, and driver status (full-time ride-hailing drivers and students who work part-time as ride-hailing drivers or current university students). The second section is an ordered response regarding the desire to buy and rent electric motorcycles. Respondents answered the questions in the second section on a five-point Likert scale, from 1 for definitely not buy to 5 for definitely buy. A similar level was also applied to electric motorcycle rental cases (1 for definitely not rent to 5 for definitely rent). On the basis of the literature review and adapted to the Indonesian context, five and eight variables were selected for buying and renting electric motorcycles, respectively. Each variable consisted of multiple levels, with each level describing a respondent-selectable option. Table 1 explains the considered variables and their levels.
For the buying model, the first variable used in this study is coverage distance. In this study, three levels of coverage distance were used: 50, 100, and 150 km, with the consideration that the shortest distance for the use of one battery is 50 km, for the use of two batteries is 100 km, and the longest distance is 150 km with a note that the electric motorcycle is driven at 30 km/h on flat roads. The second variable is purchase price, which refers to the purchase price of an electric motorcycle brand of Viar with one battery (IDR 18 million or USD 1218), Gesits with one battery (IDR 25 million or USD 1692), and Gogoro Series 2 (IDR 35 million or USD 2368). The next variable is maximum speed. This variable becomes one of the weaknesses of electric motorcycles if compared to conventional motorcycles. In previous studies, the maximum speed used by Guerra was 60, 70, 80, 90, and 100 km/h [8], while Jones et al. used a maximum speed of 40, 50, and 60 km/h [42]. Chiu and Tzeng used a maximum speed of 40, 50, 60, and 80 km/h [54]. Due to this, this study used a maximum speed of 60 km/h as the lowest level, while the two levels above are 80 km/h and 100 km/h, or an increase of 20 km/h per level. The fourth variable is credit payment. As discussed by Guerra, many Indonesian people buy motorcycles by credit payment [8]. Therefore, it is expected that the availability of credit payments could stimulate electric motorcycle adoption. The following variable is the fuel price, because Jones et al. found that an increase in gasoline prices has the potential to substantially increase the market share of electric scooters [42]. The fuel price was determined as a fixed price and an increase of 10% by assuming that not all respondents use the same type of motorcycle. The sixth variable is the annual tax fee. One of the incentives that can be used to accelerate the adoption of electric motorcycles is to waive the annual tax fee for electric motorcycle users. This study uses two levels, free and paid, as in conventional motorcycles. The seventh variable is the distance between the battery exchange stations. This study determined two levels for this variable: less than 10 km and equal to or more than 10 km. The last variable is related to the cost of motorcycle title transfer. This variable was included because it can reduce the selling price of electric motorcycles to make them more attractive to users. Two levels were used for this study: with (10% as the current situation) and without (free) the cost of motorcycle title transfer.
Meanwhile, not all of the variables above were used for the electric motorcycle rental model. Only variables of coverage distance, fuel price, maximum speed, and the distance between the battery exchange stations that could be used for the rental model. Additionally, this study considers rental cost in the rent model to replace the purchase price variable. In addition, the rental cost variable was used by viewing electric vehicle rental as a trial for MBRH services. According to the existing conditions, this study determined two levels of rental costs: IDR 40 and 60 thousand or USD 2.71 and 4.06.
Furthermore, respondents were given options based on the aforementioned attributes designed in several scenarios. Using a D-optimum design, there are 12 scenarios for the buying model with a D-Efficiency value of 94.91, and 10 scenarios for the renting model with a D-Efficiency value of 95.15. Table 2 and Table 3 show the scenarios generated using the D-optimum design for the buying and renting models for electric motorcycle adoption, respectively.
4.2. Data Collection
The sampling technique used a face-to-face survey between May and June 2022. Surveyors randomly intercepted MBRH drivers and asked for their willingness to participate as a respondent. After completing the questionnaire form, responders were compensated in the form of money. Due to the absence of official data from operators regarding the number of drivers, the minimum number of respondents was calculated based on the Isaac and Michael method [55], with a significance level of 5%. The results showed that the minimum sample size was 385 respondents. A total of 450 questionnaires were distributed to MBRH drivers in three regencies in Yogyakarta province: Yogyakarta, Sleman, and Bantul. Those regencies were chosen by considering field observation showing the high demand for ride-hailing services in those regencies compared to other Yogyakarta province regencies (i.e., Gunung Kidul and Bantul). This survey screened a total of 416 valid questionnaires, for an effective response rate of 93.2%. The high effectiveness rate of the questionnaire survey is attributable to the utilization of an interview survey, which makes it simpler for respondents to either explain their replies or request explanations for certain questionnaire items.
5. Results and Discussion
5.1. Data Sample
As shown in Table 4, out of 416 respondents who completed all demographic questions and fully answered all choice experiments, in terms of age, the largest proportion of respondents was in the age range of 20 to 25 years at 28.13%, followed by the age of 30 to 40 years, above 40 years, 25 to 30 years, and 17 to 20 years at 27.40%, 20.43%, 19.47%, and 4.57%, respectively. The respondents’ average age was 30.57 years old, with a standard deviation of 9.32 years. In terms of gender, 97.12% of respondents were male, while, interestingly, 2.88% of respondents were female. Furthermore, most respondents had a high school education level or lower, accounting for 90.62%. Meanwhile, the rest (9.38%) had a graduate level or higher. Interestingly, 19.71% of university students work in ride-hailing companies as part-time workers. Approximately 65% of MBRH drivers worked in ride-hailing companies as their main job (i.e., full-time workers). Looking into the monthly income of MBRH drivers, including other jobs’ income, 51.20% of them had income between IDR 1,916,000 and IDR 3,850,000 (USD 129.67 and 260.55). However, 36.30% of them, dominated by university students who worked part time as MBRH drivers, had an income of less than IDR 1,916,000 (USD 129.67), lower than the regional minimum wage. Meanwhile,10.82% and 1.68% of them had an income between IDR 3,850,000 and IDR 5.750.000 (USD 260.55 and 389.13) and more than IDR 5.750.000 (USD 389.13), respectively.
Meanwhile, Table 5 shows the percentage distribution of electric motorcycle adoption choices across scenarios. It can be seen that Scenario 6 (lowest purchase price, fixed cost for title transfer and fuel price, no tax exemption, highest coverage distance, medium speed, the distance between charging stations is more than 10 km, and without credit payment) produces the highest percentage of buying electric motorcycles, accounting for 39.90% and 21.15% for adopting and definitely adopting, respectively. Meanwhile, the highest percentage of renting electric motorcycles occurs in Scenario 9 (cheapest rental cost, highest coverage distance, lowest speed, increase in gasoline price, and the distance between charging stations is more than 10 km), where 18.27% of MBRH drivers definitely rent, and 49.04% rent electric motorcycles. In contrast, the lowest percentage of not adopting electric motorcycles (purchase model) occurs in Scenario 5 (highest purchase price, fixed cost for title transfer and fuel price, tax exemption, lowest coverage distance, lowest speed, the distance between charging stations is more than 10 km, and with credit payment) for the purchase model, by 37.98% for definitely not adopt and 30.77% for not to adopt. Meanwhile, Scenario 6 (highest rental cost, lowest coverage distance, highest speed, increase in fuel price, and the distance between charging stations is more than 10 km) becomes the lowest percentage of adopting electric motorcycles for the rent model, accounting for 34.13% and 27.88% in terms of definitely not adopt and not adopt, respectively.
5.2. Model Results
From 416 respondents, 2496 datasets were acquired in the purchase model from twelve scenarios (each respondent faced six scenarios), while 2080 datasets were obtained in the rental model from ten scenarios (each respondent faced five scenarios). Table 6 shows the results of an ordered logit model. The model is estimated by a maximum likelihood method using STATA v.14 [56]. For the purchase model, out of eight considered variables, only the purchase price and coverage distance variables have a significant effect on electric motorcycle adoption. Shown by a negative value of the purchase price variable, it demonstrates that an increase in electric motorcycle purchase price will reduce the MBRH drivers’ willingness to adopt electric motorcycles. This finding is consistent with those reported by previous studies [42,46,54], which found that the probability of purchasing an electric motorcycle decreases as the purchase price rises. Contrarily, a positive sign of coverage distance means that MBRH drivers will be more inclined to use electric motorcycles as coverage distance increases. The absence of a correlation between the annual tax variable and the adoption of electric motorcycles is not consistent with the study conducted by Scorrano and Danielis [46] in Italy, which combines the variable of tax exemption with insurance premiums. In Italy, the electric scooter policy is exempt from tax for five years and frequently receives discounts up to 50 percent on insurance premiums. The insignificant variable of an annual tax in this study was deemed to be caused by the low annual tax for motorcycle mode. Meanwhile, the insignificant correlation between costs for title transfer and electric bicycle adoption contradicts the findings from Jones et al. [42], who claimed that the elimination of this cost would greatly increase the market share of electric scooters in Vietnam.
For the rental model, four variables significantly influence the adoption of electric motorcycles: coverage distance, cost for motorcycle title transfer, rental cost, and fuel price. Shown by positive signs for coverage distance and fuel price, the model results reveal that MBRH drivers are more likely to adopt an electric motorcycle via rental if the maximum coverage distance for electric motorcycles and fuel price increases. In contrast, negative signs for battery exchange stations and rental costs indicate that the farther the battery exchange station location and the more expensive the rental price, the lower the chances of MBRH drivers adopting electric motorcycles. Meanwhile, the insignificant variable of maximum speed for both buying and renting models is different from previous studies, showing that the maximum speed has an effect on the adoption of electric motorcycles, with the amount a user is willing to pay for an increase of 1 km/h being USD 65 [54], USD 26 [42], and USD 0.81 to 2.39 [8]. However, this study’s result is in line with previous studies [54,57,58], which found that speed was not significant in the adoption of electric vehicles.
Furthermore, taking into account the sociodemographic variable, it can be seen from Table 6 that there is no significant correlation between all sociodemographic variables and purchasing electric motorcycles. Meanwhile, significant correlations occurred between sociodemographic variables (i.e., age, education level, current university students, full-time drivers, and income/rental cost) and electric motorcycle adoption. Shown by negative signs for age and education level, the model revealed that younger drivers and drivers without bachelor’s degrees are more likely to adopt electric motorcycles by renting from ride-hailing companies. This finding is consistent with a previous study in the United States showing the preferences for electric vehicle adoption among young ride-hailing drivers [32]. In contrast, positive signs for full-time drivers and current university students coefficients show that those people have a higher probability of renting electric motorcycles than their counterparts.
This study also considered a variable that interacts with income and price, as people with lower incomes are more sensitive to price. A similar method has been carried out by a study in India to explore the fuel economy valuation of Indian motorcycle buyers [59]. The model results show that there is no relationship between income/purchase price and purchasing electric motorcycles. Meanwhile, for the rent model, shown by a negative sign, it can be seen that people with a lower income and rental cost ratio tend to adopt electric motorcycles by renting from ride-hailing companies.
However, because many independent variables for the purchase model were insignificant, this study applied a binomial logit model to produce better model results. This study assumed that the choice of definitely adopt and adopt was merged as adopt, while the choice of undecided, not adopt, and definitely not adopt was merged to not adopt. As shown in Table 6, although the binomial logit model produced a higher value of Pseudo R2 (i.e., better model fit) than the ordered logit model, there was no difference in significant variables between the two logit models. Even for the rent model, the education level that significantly affects the decision to rent electric motorcycles in the ordered logit model becomes an insignificant variable for the binomial logit model. Due to this, it can be concluded that the use of the ordered logit model could be accepted to explore the influence factors in electric motorcycle adoption among MBRH drivers.
5.3. Probability of Electric Motorcycle Adoption
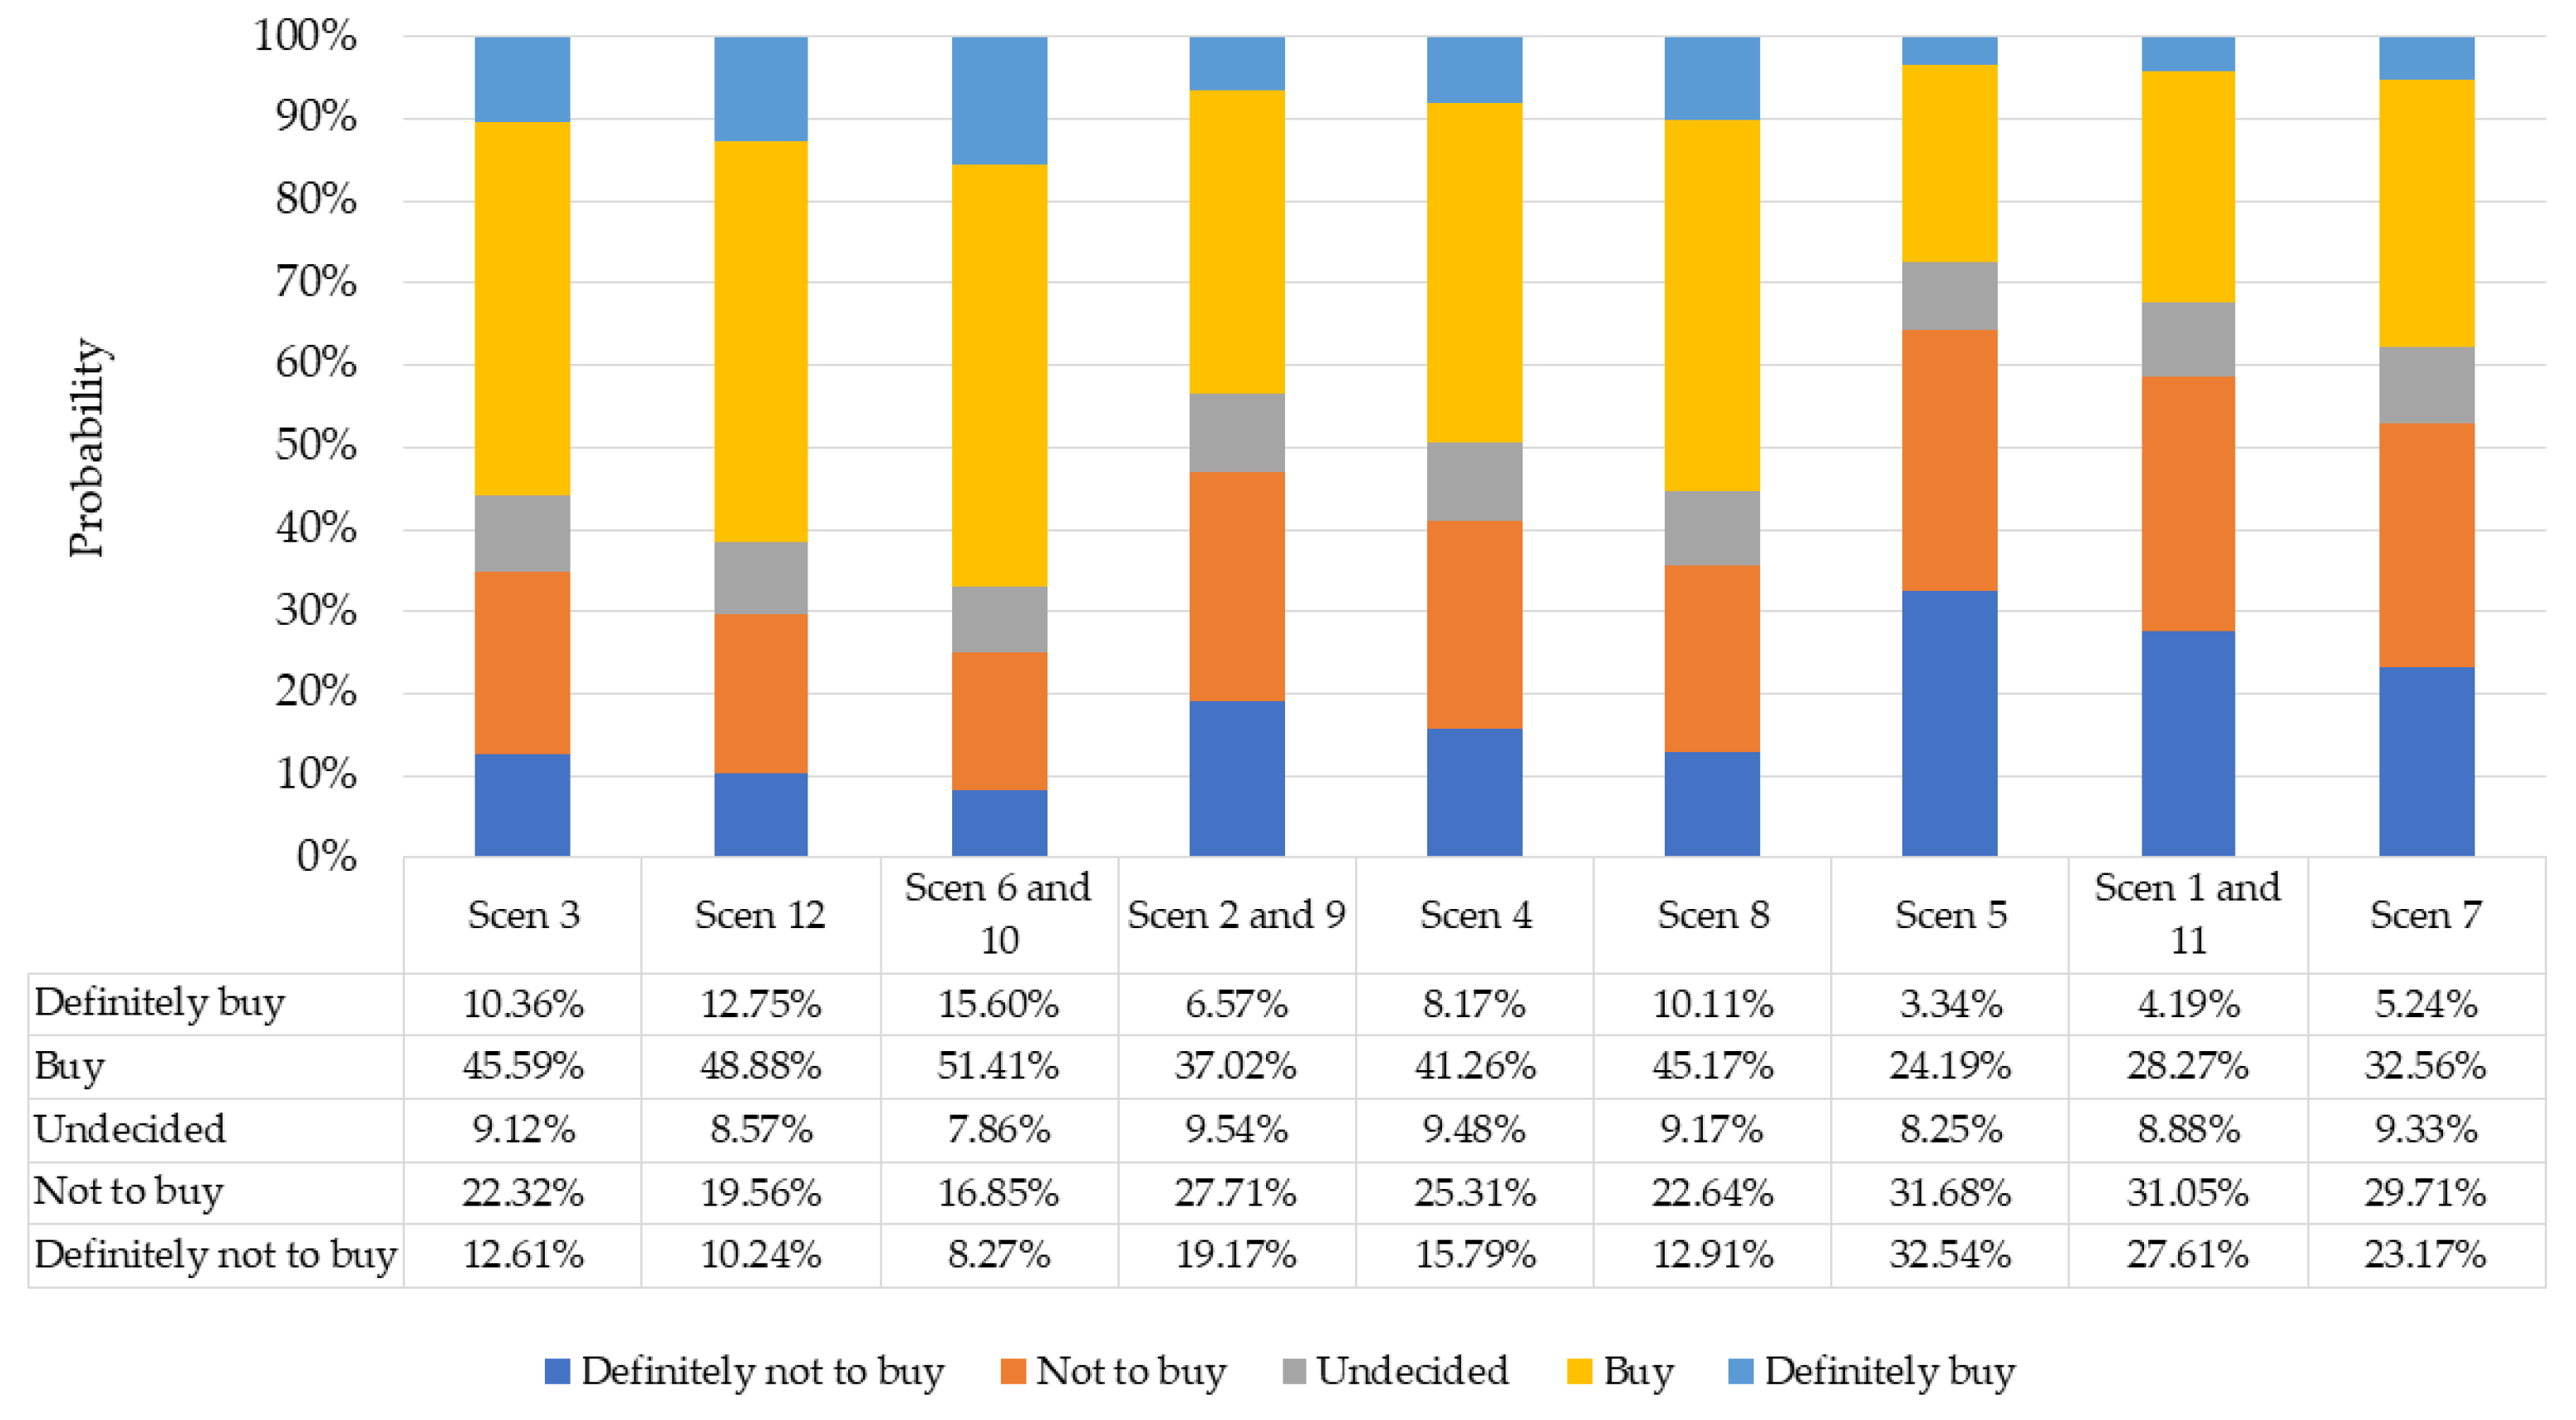
The probability values were calculated by estimating the likelihood that electric motorcycles will be purchased and rented by MBRH drivers. Figure 1 shows the results of purchase model’s probability values for all scenarios. However, it should be noted that because there were only two significant variables out of eight considered variables, it results in the same scenario for Scenarios 1 and 11, Scenarios 2 and 9, and Scenarios 6 and 10. To make an easier interpretation, Figure 1 is arranged according to purchase price, starting with the lowest price and the shortest coverage distance to the most expensive purchase price and the longest coverage distance. As demonstrated in Figure 1, increasing the coverage distance could increase the likelihood of buying and definitely buying. Previous studies also show that coverage distance is a determinant in the adoption of electric motorcycles [42,46,54]. Even Guerra [8] has accounted for willingness to pay for electric motorcycles, showing that respondents are willing to pay IDR. 36,885 (USD 2.5) per month for a 10 km increase in coverage distance.
This study’s results revealed that an increase in coverage distance from 50 km (Scenario 3) to 100 km (Scenario 12) at IDR 18 million purchase price would increase the probability of buying from 45.6% to 48.9% (3.3%), and the probability to definitely buy from 10.4% to 12.8% (2.4%). Meanwhile, an increase in coverage distance from 50 km (Scenario 3) to 150 km (Scenario 6 and 10) could increase the probability of buying from 45.6% to 51.4% (5.8%) and the probability of definitely buying from 10.4% to 15.6% (5.2%). Additionally, for a purchase price of IDR 25 million, increasing the coverage distance from 50 km (Scenarios 2 and 9) to 100 km (Scenario 4) will raise the likelihood of buying from 37.0% to 41.2% (4.2%), and the likelihood of definitely buying from 6.6% to 8.2% (1.6%), while the chance of buying and definitely buying rises from 37.0% to 45.2% (8.2%) and from 6.6% to 10.1% (3.5%), respectively, if the coverage distance is increased from 50 km (Scenarios 2 and 9) to 150 km (Scenario 8). Lastly, at a purchase price of IDR 35 million, extending the distance from 50 km (Scenario 5) to 100 km (Scenarios 1 and 11) would improve the probability of buying and definitely buying from 24.2% to 28.3% (4.1%) and from 3.3% to 4.2% (0.9%), respectively, while the increase in distance from 50 km (Scenario 5) to 150 km (Scenario 7) would raise the likelihood of buying from 24.2% to 32.6% (8.4%) and the likelihood of definitely buying from 3.3% to 5.2% (1.9%).
Meanwhile, the likelihood of not buying increases with increasing purchase price. First, for a coverage distance of 50 km, if the purchase price goes from IDR 18 million (Scenario 3) to IDR 25 million (Scenarios 2 and 9), the probability of electric motorcycle buying drops from 45.6% to 37.0% (−8.6%), and the likelihood of definitely buying drops from 10.4% to 6.6% (−3.8%). In another case, if the purchase price increases from IDR 18 million (Scenario 3) to IDR 35 million (Scenario 5), the probability of buying decreases from 45.6% to 24.2% (−21.4%), and the probability of definitely buying drops from 10.4% to 3.3% (−7.1%). Second, in terms of maximum coverage distance up to 100 km, increasing the purchase price from IDR 18 million (Scenario 12) to IDR 25 million (Scenario 4) reduces the likelihood of purchasing from 48.9% to 41.3% (−7.6%) and the likelihood of definitely buying from 12.8% to 8.2% (−4.6%). Meanwhile, the rise in purchase price from IDR 18 million (Scenario 12) to IDR 35 million (Scenarios 1 and 11) reduces the chance of purchasing from 48.9% to 28.3 (−20.6%), and the probability of definitely buying from 12.8% to 4.2% (−8.6%). Last but not least, for the 150 km coverage distance, an increase in the purchase price from IDR 18 million (Scenarios 6 and 10) to IDR 25 million (Scenario 8) would decrease the chance of purchasing from 51.4% to 45.2% (−6.2%) and the probability of definitely buying from 15.6% to 10.1% (−5.5%). On the other hand, the purchase price rise from IDR 18 million (Scenarios 6 and 10) to IDR 35 million (Scenario 7) would decrease the likelihood of purchasing from 51.4% to 32.6% (−18.8%), and the probability of definitely buying from 15.6% to 5.2% (−10.4%).
The adoption of electric motorcycles by MBRH drivers is most likely to occur in Scenarios 6 and 10, where the purchase price is the lowest and the maximum coverage distance is the highest, with 15.6% and 51.4% for definitely buy and buy, respectively. Furthermore, looking into Scenarios 8 and 3, it can be revealed that both scenarios have the same probability values, meaning that the purchase price has a greater impact on MBRH drivers’ adoption of electric motorcycles than the distance traveled.
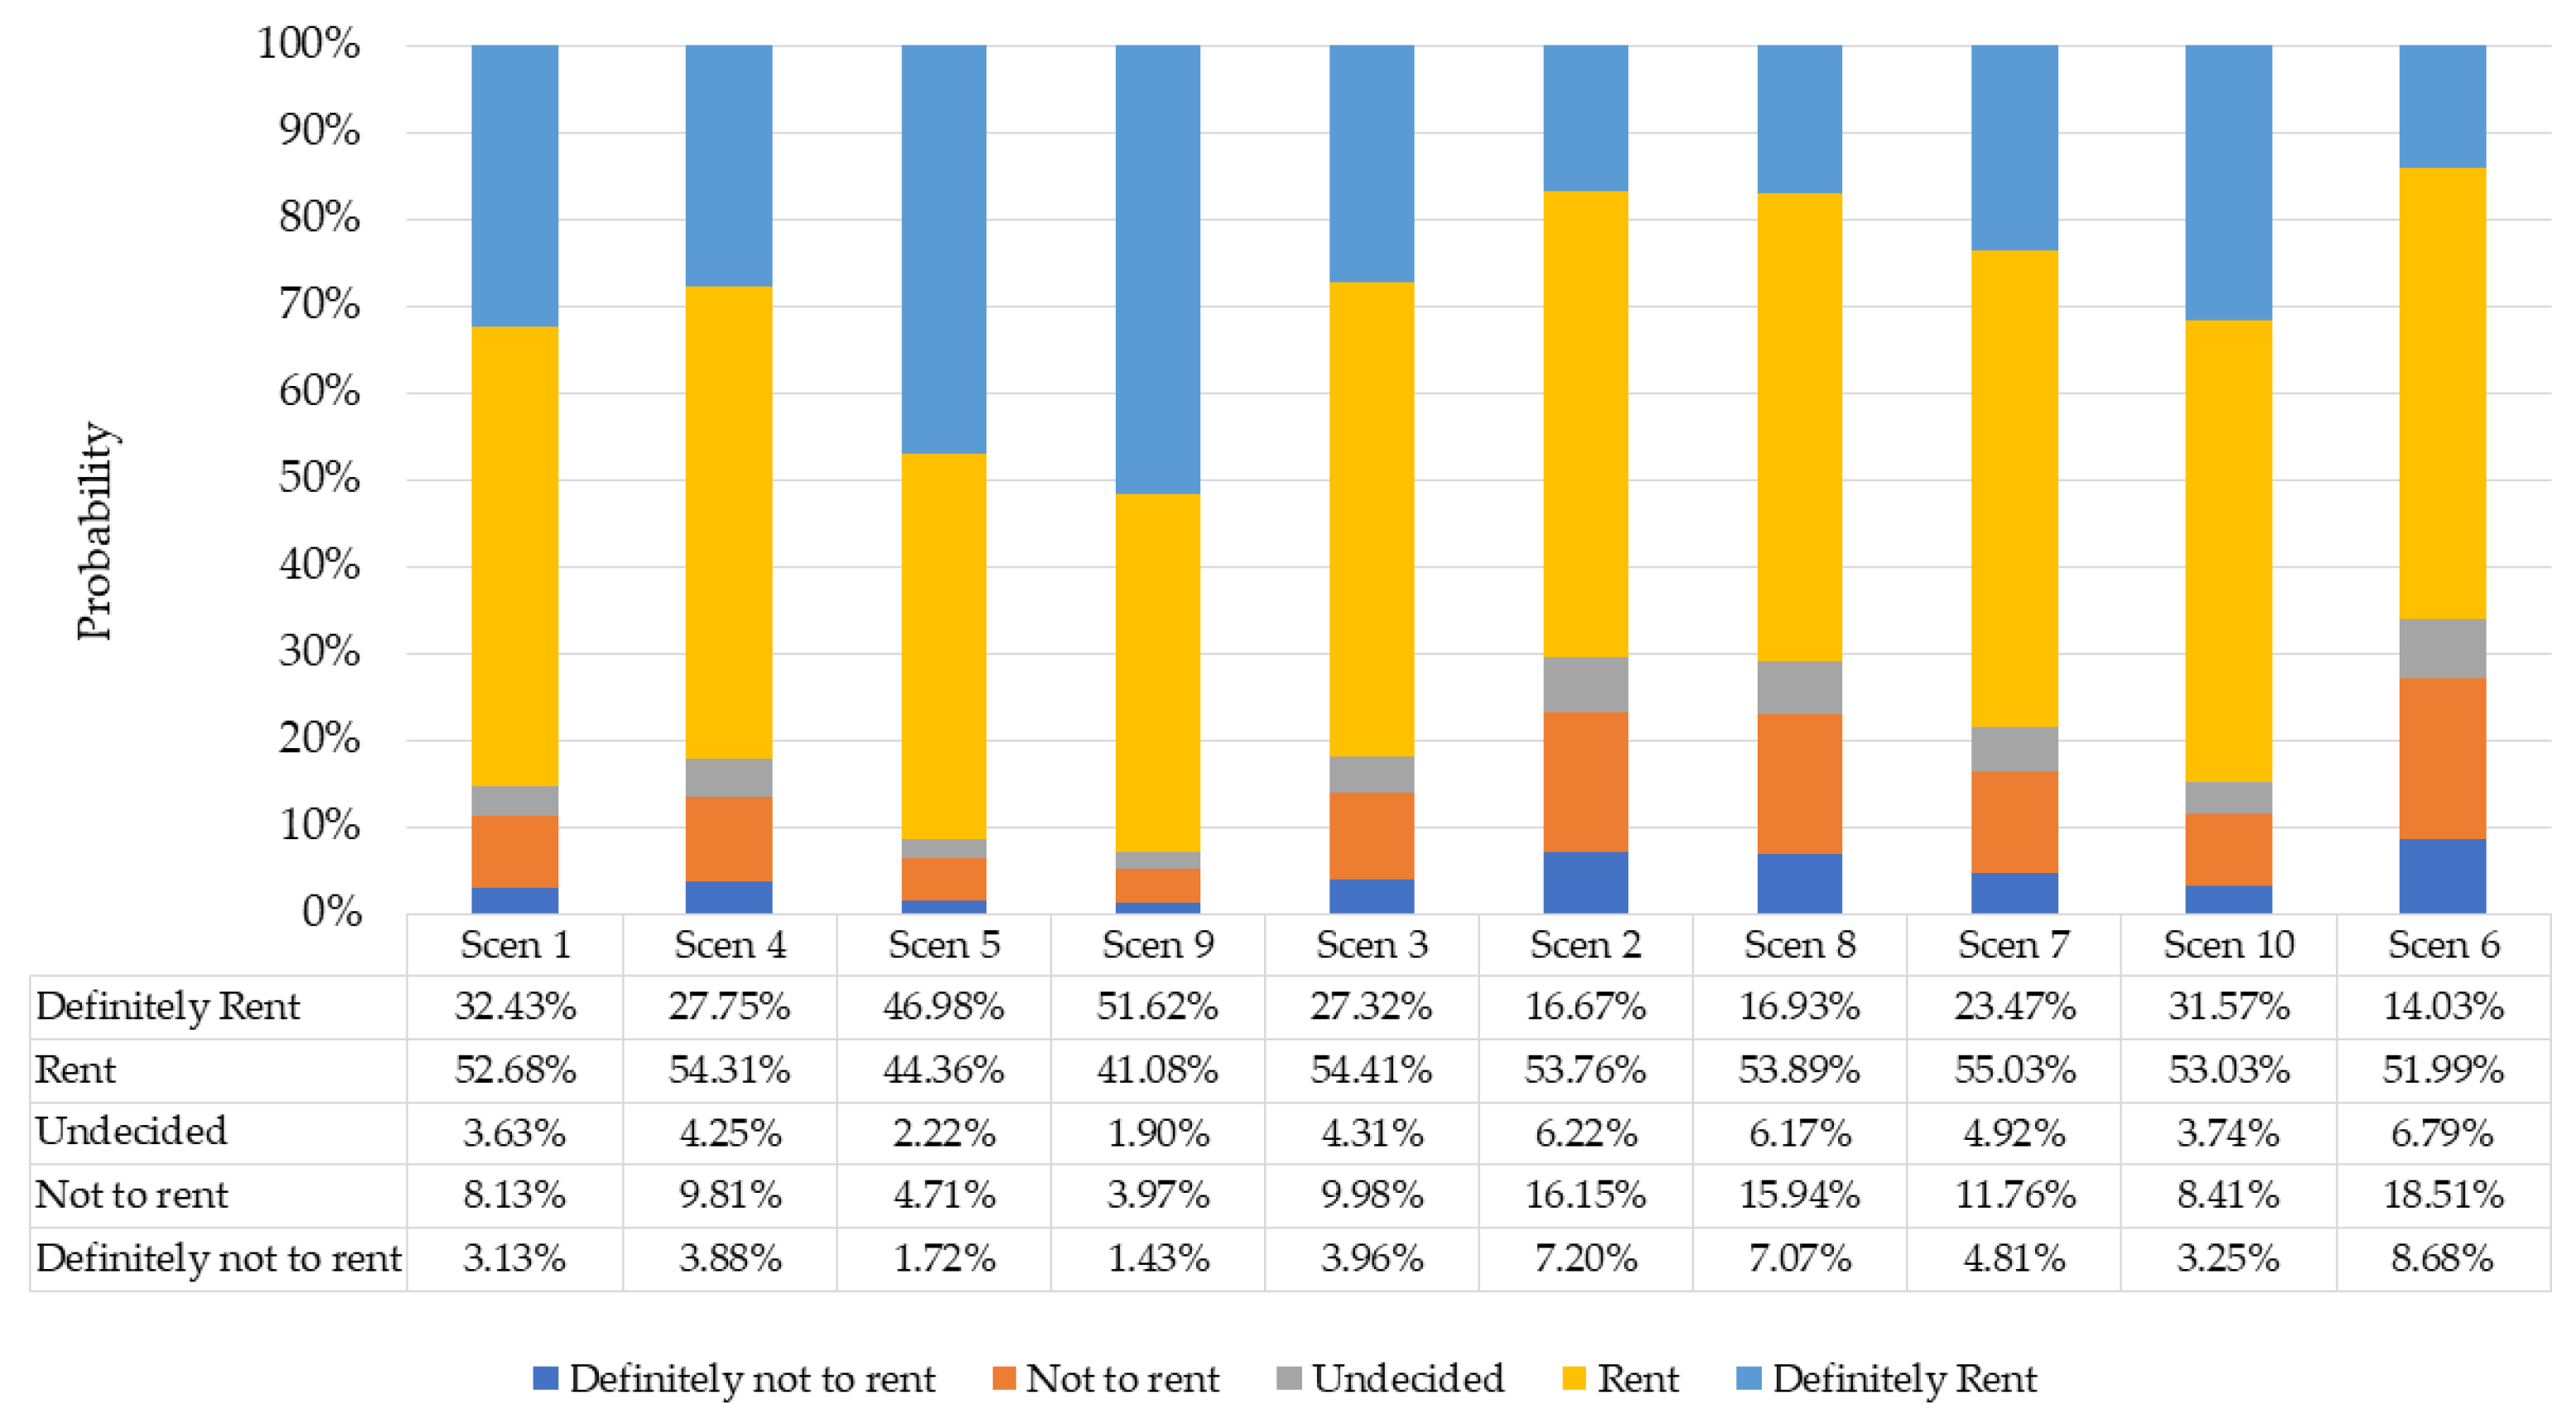
Figure 2 shows the probability values of electric motorcycle adoption for the rent model. The scenarios in Figure 2 were sorted from the lowest to the highest value of rental cost, fuel price, battery exchange station, and coverage distance variables. The impact of the battery exchange station placement can be seen in Scenarios 1 and 4, where the likelihood of definitely renting an electric motorcycle will decline as the distance between battery exchange stations increases. When electric motorcycles’ coverage distance is 50 km, the rental rate is IDR 40 thousand, and the fuel price is fixed, the model results revealed that the chance of electric motorcycle renting increases from 52.7% to 54.3% (1.6%), but definitely renting decreases from 32.4% to 27.8% (−4.6%), respectively, when the battery exchange station location distance was changed from less than 10 km (Scenario 1) to more than 10 km (Scenario 4). Furthermore, the probability of renting an electric motorcycle increases, nevertheless, if the location of battery exchange stations is farther away, which is compensated by increasing the maximum coverage distance in Scenarios 5 and 9.
The impact of the fuel price can be seen in Scenarios 3 and 10, where it will increase the probability of definitely renting an electric motorcycle. From Figure 2, it can be seen that an increase in fuel price affected an increase in the probability of definitely renting by 4.3% (from 27.3% to 31.6%) but a decrease in the probability of renting by 1.4% (54.4% to 53.0%). However, according to Guerra, a rise in fuel costs must be coupled with advancements in battery technology in order to maximize the potential demand for electric motorcycles as an alternative to conventional motorcycles. Although the cost of recharging the battery is less than the cost of refueling, the battery needs to be replaced after several years, and the battery price is still high [8].
Moreover, in Scenarios 7 and 10, the effect of maximum coverage distance was explored. In these scenarios, the probability of definitely renting an electric motorcycle increases as the maximum coverage distance also increases. The model results show that 8.1% of drivers’ probability to definitely rent electric motorcycles increased from 23.5% to 31.6%, caused by a 50 km increase in the maximum coverage distance of electric motorcycles. Meanwhile, the impact of rental costs is demonstrated in Scenarios 5 and 7, where an increase in rental costs could decrease the likelihood of definitely renting an electric motorcycle. A rental cost rise from IDR 40,000 (Scenario 5) to IDR 60,000 (Scenario 7) would increase the probability of renting from 44.4% to 55.0% (10.6%) but would drop the probability of definitely rent from 47.00% to 23.5% (−23.5%). To conclude, according to the probability values, Scenario 9, followed by Scenario 5, offers the best chance to increase electric motorcycle adoption among MBRH drivers.
6. Conclusions and Recommendations
The study presents the findings of a 2022 stated preference survey conducted in Yogyakarta, Indonesia, among MBRH drivers on their preference for electric motorcycles. This study explored how prospective purchasers and renters evaluate the qualities of electric motorcycles. To the best of our knowledge, this is the first stated preference study on this issue of electric motorcycle adoption among MBRH drivers in Indonesia, and most likely in Southeast Asian countries, that categorized the adoption model into purchasing and renting.
This study discovers that the demand for electric motorcycles depends on a variety of monetary, technical, and driver characteristics. Purchasing electric motorcycles among MBRH drivers is affected by purchase price and coverage distance. Meanwhile, the choice to rent electric motorcycles is influenced by coverage distance, fuel price, battery exchange stations, and rental costs. Surprisingly, a variety of government policies, including a free annual tax and no cost for title transfer, as well as electric motorcycles’ performance of maximum speed, were found to have no significant effect on electric motorcycle adoption for both buying and renting among MBRH drivers. Meanwhile, sociodemographic variables, including age, education level, and the ratio of monthly income to rental cost, have a significant impact on the choice to rent electric motorcycles. Full-time drivers and students with part-time driving jobs are also more likely to rent electric motorcycles. This study also found that the highest probability of definitely buying an electric motorcycle is 15.60%, where the variable purchase price is IDR 18 million and the maximum coverage distance is 150 km. Meanwhile, with a rental rate of IDR 40 thousand per day, a maximum coverage distance of 150 km, and a rise in fuel prices produced the highest probability of definitely renting an electric motorcycle by 51.62%. To conclude, by comparing the two models, the likelihood of adopting electric motorcycles by renting is higher than by buying.
From the study’s findings, the following recommendations have been made to boost the enthusiasm of MBRH drivers to use electric motorcycles. First, the government needs to provide subsidies to make the purchase price of new electric motorcycles more affordable compared to gasoline-powered motorcycles. Second, electric motorcycle manufacturers need to improve the technology such that the electric motorcycle’s performance is comparable to that of conventional motorcycles. In terms of maximum speed, the current speed of electric motorcycles is sufficient for the needs of MBRH drivers, but in terms of coverage distance, it still needs to be improved. Third, ride-hailing companies may work with other parties to supply electric motorcycles for rental services, generate extra revenue per trip, and give priority to driver–partners who have previously utilized electric motorcycles while receiving orders.
One area of significant caution is that this study focuses on the technological and economic factors and government policies that determine the demand for electric motorcycles and ignores the attitudes (environmental awareness) of MBRH drivers that may be crucial in the decision of electric motorcycle adoption. Due to this, the next studies need to consider those variables in the adoption model, as conducted by Scorrano and Rotaris [60]. The future study also needs to add the option of buying an electric motorcycle without a battery or converting a conventional motorcycle that is owned into an electric motorcycle. Another area of caution is related to the sample’s representativeness. Further study needs to compare the age, gender, and income of MBRH drivers between the sample and the population of MBRH drivers, with the aim of proving that the sample is representative of the population. Interestingly, because there were female drivers of MBRH, understanding female riding behavior related to safety issues is worth exploring in the following research agenda. Lastly, the long-term adverse effects of electric motorcycle adoption, such as a possible sharp increase in electricity prices over time once a large number of drivers switch to electric vehicles, leaving the cities green and the suburbs polluted, and the production and disposal of batteries, need to be investigated in future studies.
Author Contributions
Conceptualization, T.A.W., M.Z.I. and D.; methodology, T.A.W. and M.Z.I.; formal analysis, T.A.W. and M.Z.I.; investigation, T.A.W.; writing—original draft, T.A.W. and M.Z.I.; writing—review and editing, M.Z.I. and D. All authors have read and agreed to the published version of the manuscript.
Funding
This study was funded by Universitas Gadjah Mada (Thesis recognition program in 2022, Grant No. 1525/UN1/DITLIT/Dit-Lit/PT.01.05/2022).
Institutional Review Board Statement
The study was conducted according to the guidelines of the Declaration of Helsinki and approved by the Institutional Review Board (or Ethics Committee) of Universitas Gadjah Mada.
Informed Consent Statement
Informed consent was obtained from all subjects involved in the study.
Data Availability Statement
Not applicable.
Conflicts of Interest
The authors declare no conflict of interest.
References
- Tamakloe, R.; Das, S.; Nimako Aidoo, E.; Park, D. Factors affecting motorcycle crash casualty severity at signalized and non-signalized intersections in Ghana: Insights from a data mining and binary logit regression approach. Accid. Anal. Prev. 2022, 165, 106517. [Google Scholar] [CrossRef] [PubMed]
- Woratanarat, P.; Ingsathit, A.; Chatchaipan, P.; Suriyawongpaisal, P. Safety riding program and motorcycle-related injuries in Thailand. Accid. Anal. Prev. 2013, 58, 115–121. [Google Scholar] [CrossRef] [PubMed]
- Wu, C.Y.H.; Loo, B.P.Y. Motorcycle safety among motorcycle taxi drivers and nonoccupational motorcyclists in developing countries: A case study of Maoming, South China. Traffic Inj. Prev. 2016, 17, 170–175. [Google Scholar] [CrossRef] [PubMed]
- Fan, H.S.L. Passenger car equivalents for vehicles on Singapore expressways. Transp. Res. Part A 1990, 24, 391–396. [Google Scholar] [CrossRef]
- Yeung, J.S.; Wong, Y.D.; Secadiningrat, J.R. Lane-harmonised passenger car equivalents for heterogeneous expressway traffic. Transp. Res. Part A 2015, 78, 361–370. [Google Scholar] [CrossRef]
- Adnan, M. Passenger Car Equivalent Factors in Heterogenous Traffic Environment-are We Using the Right Numbers? Procedia Eng. 2014, 77, 106–113. [Google Scholar] [CrossRef]
- Ramlan, R.; Irawan, M.Z.; Munawar, A. Behavioral factors of motorcyclists in right-turn movements at unsignalized intersections: An insight from Yogyakarta, Indonesia. IATSS Res. 2021, 45, 116–122. [Google Scholar] [CrossRef]
- Guerra, E. Electric vehicles, air pollution, and the motorcycle city: A stated preference survey of consumers’ willingness to adopt electric motorcycles in Solo, Indonesia. Transp. Res. Part D 2019, 68, 52–64. [Google Scholar] [CrossRef]
- Irawan, M.Z. A joint choice decision model of intra-household interaction-based motorcycle mode and departure time in Yogyakarta, Indonesia. IOP Conf. Ser. Mater. Sci. Eng. 2019, 650, 012042. [Google Scholar] [CrossRef]
- Law, T.H.; Hamid, H.; Goh, C.N. The motorcycle to passenger car ownership ratio and economic growth: A cross-country analysis. J. Transp. Geogr. J. 2015, 46, 122–128. [Google Scholar] [CrossRef]
- Irawan, M.Z.; Bastarianto, F.F.; Dewanti; Sugiarto, S.; Amrozi, M.R.F. Measuring the perceived need for motorcycle-based ride-hailing services on trip characteristics among university students in Yogyakarta, Indonesia. Travel Behav. Soc. 2021, 24, 303–312. [Google Scholar] [CrossRef]
- Irawan, M.Z.; Belgiawan, P.F. Ride-hailing app use for same-day delivery services of foods and groceries during the implementation of social activity restrictions in Indonesia. Int. J. Transp. Sci. Technol. 2022; In Press. [Google Scholar]
- Rizki, M.; Syahputri, J.; Belgiawan, P.F.; Irawan, M.Z. Electrifying Tourist Mobility in Bali, Indonesia: Setting the Target and Estimating the CO2 Reduction Based on Stated Choice Experiment. Sustainability 2021, 13, 11656. [Google Scholar] [CrossRef]
- Hijauku Kendaraan Listrik Indonesia: Potensi Besar, Pasar Kurang. Available online: https://hijauku.com/2021/02/05/kendaraan-listrik-indonesia-potensi-besar-pasar-kurang/ (accessed on 15 August 2022).
- Irawan, M.Z.; Rizki, M.; Chalermpong, S.; Kato, H. Mapping the motorcycle-based ride-hailing users in Yogyakarta: An analysis of socio-economic factors and preferences. Asian Transp. Stud. 2022, 8, 100073. [Google Scholar] [CrossRef]
- Grab Indonesia Ayo Bergabung Menjadi Mitra Grab Electric Sebagai Pekerjaan Sampingan Mahasiswa. Available online: https://www.grab.com/id/en/blog/driver/grab-indonesia-ayo-bergabung-menjadi-mitra-grab-electric-sebagai-pekerjaan-sampingan-mahasiswa/ (accessed on 15 August 2022).
- Wu, Y.-C.; Kontou, E. Designing electric vehicle incentives to meet emission reduction targets. Transp. Res. Part D Transp. Environ. 2022, 107, 103320. [Google Scholar] [CrossRef]
- Hoen, A.; Koetse, M.J. A choice experiment on alternative fuel vehicle preferences of private car owners in the Netherlands. Transp. Res. Part A Policy Pract. 2014, 61, 199–215. [Google Scholar] [CrossRef]
- Mersky, A.C.; Sprei, F.; Samaras, C.; Qian, Z.S. Effectiveness of incentives on electric vehicle adoption in Norway. Transp. Res. Part D Transp. Environ. 2016, 46, 56–68. [Google Scholar] [CrossRef]
- Pierre, M.; Jemelin, C.; Louvet, N. Driving an electric vehicle. A sociological analysis on pioneer users. Energy Effic. 2011, 4, 511–522. [Google Scholar] [CrossRef]
- Egbue, O.; Long, S. Barriers to widespread adoption of electric vehicles: An analysis of consumer attitudes and perceptions. Energy Policy 2012, 48, 717–729. [Google Scholar] [CrossRef]
- Bjerkan, K.Y.; Nørbech, T.E.; Nordtømme, M.E. Incentives for promoting Battery Electric Vehicle (BEV) adoption in Norway. Transp. Res. Part D Transp. Environ. 2016, 43, 169–180. [Google Scholar] [CrossRef]
- Wang, N.; Tang, L.; Pan, H. Effectiveness of policy incentives on electric vehicle acceptance in China: A discrete choice analysis. Transp. Res. Part A Policy Pract. 2017, 105, 210–218. [Google Scholar] [CrossRef]
- Li, W.; Long, R.; Chen, H. Consumers’ evaluation of national new energy vehicle policy in China: An analysis based on a four paradigm model. Energy Policy 2016, 99, 33–41. [Google Scholar] [CrossRef]
- Hensher, D.A.; Nelson, J.D.; Mulley, C. Electric car sharing as a service (ECSaaS)–Acknowledging the role of the car in the public mobility ecosystem and what it might mean for MaaS as eMaaS? Transp. Policy 2022, 116, 212–216. [Google Scholar] [CrossRef]
- Rizki, M.; Joewono, T.B.; Belgiawan, P.F.; Irawan, M.Z. The travel behaviour of ride-sourcing users, and their perception of the usefulness of ride-sourcing based on the users’ previous modes of transport: A case study in Bandung City, Indonesia. IATSS Res. 2021, 45, 267–276. [Google Scholar] [CrossRef]
- Chalermpong, S.; Kato, H.; Thaithatkul, P.; Ratanawaraha, A.; Fillone, A.; Hoang-Tung, N.; Jittrapirom, P. Ride-hailing applications in Southeast Asia: A literature review. Int. J. Sustain. Transp. 2022; In Press. [Google Scholar]
- Graehler, M.; Mucci, R.A.; Erhardt, G.D. Understanding the Recent Transit Ridership Decline in Major US Cities: Service Cuts or Emerging Modes? In Proceedings of the 98th Annual Meeting of the Transportation Research Board (TRB), Washington, DC, USA, 13–17 January 2019.
- Hall, J.D.; Palsson, C.; Price, J. Is Uber a substitute or complement for public transit? J. Urban Econ. 2018, 108, 36–50. [Google Scholar] [CrossRef]
- Tirachini, A. Ride-hailing, travel behaviour and sustainable mobility. Transportation 2019, 47, 2011–2047. [Google Scholar] [CrossRef]
- Du, M.; Cheng, L.; Li, X.; Yang, J. Acceptance of electric ride-hailing under the new policy in Shenzhen, China: Influence factors from the driver’s perspective. Sustain. Cities Soc. 2020, 61, 102307. [Google Scholar] [CrossRef]
- Bansal, P.; Sinha, A.; Dua, R.; Daziano, R.A. Eliciting preferences of TNC users and drivers: Evidence from the United States. Travel Behav. Soc. 2020, 20, 225–236. [Google Scholar] [CrossRef]
- Jenn, A.; Laberteaux, K.; Clewlow, R. New mobility service users’ perceptions on electric vehicle adoption. Int. J. Sustain. Transp. 2018, 12, 526–540. [Google Scholar] [CrossRef]
- Mendez-Manjon, I.; Plasencia-Lozano, P.; Pantiga-Facal, E. A GIS-Based evaluation of the motorcycle sharing systems in Spain. Transp. Res. Procedia 2021, 58, 487–494. [Google Scholar] [CrossRef]
- Amirnazmiafshar, E.; Diana, M. A review of the socio-demographic characteristics affecting the demand for different car-sharing operational schemes. Transp. Res. Interdiscip. Perspect. 2022, 14, 100616. [Google Scholar] [CrossRef]
- Habla, W.; Huwe, V.; Kesternich, M. Electric and conventional vehicle usage in private and car sharing fleets in Germany. Transp. Res. Part D Transp. Environ. 2021, 93, 102729. [Google Scholar] [CrossRef]
- Gebhardt, L.; Ehrenberger, S.; Wolf, C.; Cyganski, R. Can shared E-scooters reduce CO2 emissions by substituting car trips in Germany? Transp. Res. Part D Transp. Environ. 2022, 109, 103328. [Google Scholar] [CrossRef]
- Sheng, N.; Zhou, X.; Zhou, Y. Environmental impact of electric motorcycles: Evidence from traffic noise assessment by a building-based data mining technique. Sci. Total Environ. 2016, 554, 73–82. [Google Scholar] [CrossRef] [PubMed]
- Inci, E.; Tatar Taspinar, Z.; Ulengin, B. A choice experiment on preferences for electric and hybrid cars in Istanbul. Transp. Res. Part D Transp. Environ. 2022, 107, 103295. [Google Scholar] [CrossRef]
- Buranelli de Oliveira, M.; Moretti Ribeiro da Silva, H.; Jugend, D.; De Camargo Fiorini, P.; Paro, C.E. Factors influencing the intention to use electric cars in Brazil. Transp. Res. Part A Policy Pract. 2022, 155, 418–433. [Google Scholar] [CrossRef]
- Irawan, M.Z.; Belgiawan, P.F.; Widyaparaga, A.; Budiman, A.; Muthohar, I.; Sopha, B.M. Case Studies on Transport Policy A market share analysis for hybrid cars in Indonesia. Case Stud. Transp. Policy 2018, 6, 336–341. [Google Scholar] [CrossRef]
- Jones, L.R.; Cherry, C.R.; Vu, T.A.; Nguyen, Q.N. The effect of incentives and technology on the adoption of electric motorcycles: A stated choice experiment in Vietnam. Transp. Res. Part A 2013, 57, 1–11. [Google Scholar] [CrossRef]
- Zhu, L.; Song, Q.; Sheng, N.; Zhou, X. Exploring the determinants of consumers’ WTB and WTP for electric motorcycles using CVM method in Macau. Energy Policy 2019, 127, 64–72. [Google Scholar] [CrossRef]
- Wu, J.H.; Wu, C.W.; Lee, C.T.; Lee, H.J. Green purchase intentions: An exploratory study of the Taiwanese electric motorcycle market. J. Bus. Res. 2015, 68, 829–833. [Google Scholar] [CrossRef]
- Weinert, J.; Ogden, J.; Sperling, D.; Burke, A. The future of electric two-wheelers and electric vehicles in China. Energy Policy 2008, 36, 2544–2555. [Google Scholar] [CrossRef] [Green Version]
- Scorrano, M.; Danielis, R. The characteristics of the demand for electric scooters in Italy: An exploratory study. Res. Transp. Bus. Manag. 2021, 39, 100589. [Google Scholar] [CrossRef]
- Aguilera-García, Á.; Gomez, J.; Sobrino, N. Exploring the adoption of moped scooter-sharing systems in Spanish urban areas. Cities 2020, 96, 102424. [Google Scholar] [CrossRef]
- Latinopoulos, C.; Patrier, A.; Sivakumar, A. Planning for e-scooter use in metropolitan cities: A case study for Paris. Transp. Res. Part D Transp. Environ. 2021, 100, 103037. [Google Scholar] [CrossRef]
- Alam, M.R.; Guo, Z. Charging infrastructure planning for ride-sourcing electric vehicles considering drivers’ value of time. Transp. Lett. 2022; In Press. [Google Scholar]
- Ke, J.; Cen, X.; Yang, H.; Chen, X.; Ye, J. Modelling drivers’ working and recharging schedules in a ride-sourcing market with electric vehicles and gasoline vehicles. Transp. Res. Part E Logist. Transp. Rev. 2019, 125, 160–180. [Google Scholar] [CrossRef]
- Bliemer, M.C.J.; Rose, J.M. Experimental design influences on stated choice outputs: An empirical study in air travel choice. Transp. Res. Part A Policy Pract. 2011, 45, 63–79. [Google Scholar] [CrossRef]
- Nijs, V. Design of Experiments. Available online: https://radiant-rstats.github.io/docs/design/doe.html (accessed on 9 September 2022).
- Garrow, L.A. Discrete Choice Modelling and Air Travel Demand; Ashgate Publishing Limited: Farnham, UK, 2010. [Google Scholar]
- Chiu, Y.C.; Tzeng, G.H. The market acceptance of electric motorcycles in Taiwan experience through a stated preference analysis. Transp. Res. Part D 1999, 4, 127–146. [Google Scholar] [CrossRef]
- Isaac, S.; Michael, W. Handbook in Research and Evaluation: A Collection of Principles, Methods, and Strategies Useful in the Planning, Design, and Evaluation of Studies in Education and the Behavioral Sciences; EdITS Publishers: London, UK, 1995. [Google Scholar]
- Long, J.S.; Freese, J. Regression Models for Categorical Dependent Variables Using Stata; Stata Press: Lakeway Drive, DC, USA; College Station: Texas, TX, USA, 2006. [Google Scholar]
- Bunch, D.S.; Bradley, M.; Golob, T.F.; Kitamura, R.; Occhiuzzo, G.P. Demand for clean-fuel vehicles in California: A discrete-choice stated preference pilot project. Transp. Res. Part A Policy Pract. 1993, 27, 237–253. [Google Scholar] [CrossRef]
- Calfee, J.E. Estimating the demand for electric automobiles using fully disaggregated probabilistic choice analysis. Transp. Res. Part B Methodol. 1985, 19, 287–301. [Google Scholar] [CrossRef]
- Bansal, P.; Dua, R.; Krueger, R.; Graham, D.J. Fuel economy valuation and preferences of Indian two-wheeler buyers. J. Clean. Prod. 2021, 294, 126328. [Google Scholar] [CrossRef]
- Scorrano, M.; Rotaris, L. The role of environmental awareness and knowledge in the choice of a seated electric scooter. Transp. Res. Part A 2022, 160, 333–347. [Google Scholar] [CrossRef]
Figure 1.
Probability values of electric motorcycle adoption for buying model.

Figure 2.
Probability values of electric motorcycle adoption for renting model.


Table 1.
Considered variables and levels.
| Variable | No. of Level | Description | Purchase Model | Rental Model |
|---|---|---|---|---|
| Purchase price (in million IDR) * | 3 | 18, 25, 35 | √ | |
| Cost for motorcycle title transfer | 2 | Free, Fixed (10%) | √ | |
| Fuel price | 2 | Fixed, Increase 10% | √ | √ |
| Coverage distance (km) | 3 | 50, 100, 150 | √ | √ |
| Maximum speed (km/h) | 3 | 60, 80, 100 | √ | √ |
| Battery exchange station (km) | 2 | <10, ≥10 | √ | √ |
| Annual tax | 2 | No, Yes | √ | |
| Credit payment | 2 | No, Yes | √ | |
| Rental cost (thousand IDR) * | 2 | 40, 60 | √ |
* USD 1 = IDR 14,776 (August, 2022).
Table 2.
Scenarios for buying electric motorcycles.
| Scen. | Price (Million IDR) | Cost for Title Transfer | Fuel Price | Distance (km) | Battery Station Loc. (km) | Credit Payment | Speed | Tax |
|---|---|---|---|---|---|---|---|---|
| 1 | 35 | Free | Fixed | 100 | <10 | Yes | 100 | Yes |
| 2 | 25 | Fixed | Fixed | 50 | <10 | No | 100 | No |
| 3 | 18 | Free | Increase | 50 | <10 | No | 60 | Yes |
| 4 | 25 | Free | Fixed | 100 | ≥10 | No | 60 | No |
| 5 | 35 | Fixed | Fixed | 50 | ≥10 | Yes | 60 | No |
| 6 | 18 | Fixed | Fixed | 150 | ≥10 | No | 80 | Yes |
| 7 | 35 | Free | Increase | 150 | <10 | No | 80 | No |
| 8 | 25 | Fixed | Increase | 150 | <10 | Yes | 60 | Yes |
| 9 | 25 | Free | Increase | 50 | ≥10 | Yes | 80 | Yes |
| 10 | 18 | Free | Increase | 150 | ≥10 | Yes | 100 | No |
| 11 | 35 | Fixed | Increase | 100 | ≥10 | No | 100 | Yes |
| 12 | 18 | Fixed | Increase | 100 | <10 | Yes | 80 | No |
Table 3.
Scenarios for renting electric motorcycles.
| Scen. | Rental Cost (Thousand IDR) | Fuel Price | Distance (km) | Battery Station Loc. (km) | Speed |
|---|---|---|---|---|---|
| 1 | 40 | Fixed | 50 | <10 | 60 |
| 2 | 60 | Fixed | 100 | ≥10 | 60 |
| 3 | 60 | Fixed | 150 | <10 | 100 |
| 4 | 40 | Fixed | 50 | ≥10 | 80 |
| 5 | 40 | Increase | 100 | <10 | 100 |
| 6 | 60 | Increase | 50 | ≥10 | 100 |
| 7 | 60 | Increase | 100 | <10 | 80 |
| 8 | 60 | Increase | 50 | <10 | 60 |
| 9 | 40 | Increase | 150 | ≥10 | 60 |
| 10 | 60 | Increase | 150 | <10 | 80 |
Table 4.
Descriptive statistics.
| Variable | n | % | Mean | SD |
|---|---|---|---|---|
| Age | 30.57 | 9.32 | ||
| Gender (male) | 404 | 97.12% | ||
| Education level (bachelor’s degree or higher) | 39 | 9.38% | ||
| Current university students | 82 | 19.71% | ||
| MBRH driver as the primary job | 272 | 65.38% | ||
| Monthly income | ||||
| Less than IDR 1,916,000 | 151 | 36.30% | ||
| Between IDR 1,916,000 and 385,000 | 213 | 51.20% | ||
| Between IDR 3,850,001 and 5,750,000 | 45 | 10.82% | ||
| More than IDR 5,750,000 | 7 | 1.68% |
Table 5.
The distribution of choice across scenarios (percent).
| Scen. | Definitely Not to Adopt | Not to Adopt | Undecided | Adopt | Definitely to Adopt |
|---|---|---|---|---|---|
| Purchase model | |||||
| 1 | 33.65 | 23.08 | 10.10 | 28.85 | 4.33 |
| 2 | 19.71 | 40.87 | 10.58 | 26.44 | 2.40 |
| 3 | 10.58 | 28.37 | 9.13 | 44.71 | 7.21 |
| 4 | 15.38 | 34.62 | 10.10 | 34.62 | 5.29 |
| 5 | 37.98 | 30.77 | 6.73 | 21.15 | 3.37 |
| 6 | 12.50 | 19.71 | 6.73 | 39.90 | 21.15 |
| 7 | 26.44 | 25.00 | 12.98 | 32.69 | 2.88 |
| 8 | 22.12 | 24.52 | 9.13 | 42.31 | 1.92 |
| 9 | 24.52 | 28.37 | 11.06 | 33.65 | 2.40 |
| 10 | 11.54 | 22.12 | 7.21 | 45.67 | 13.46 |
| 11 | 30.29 | 30.29 | 6.73 | 29.33 | 3.37 |
| 12 | 13.46 | 19.71 | 7.69 | 45.19 | 13.94 |
| Rent model | |||||
| 1 | 20.19 | 22.12 | 7.69 | 43.27 | 6.73 |
| 2 | 25.48 | 38.94 | 7.21 | 25.96 | 2.40 |
| 3 | 16.83 | 27.40 | 7.21 | 41.83 | 6.73 |
| 4 | 17.31 | 33.65 | 5.77 | 39.42 | 3.85 |
| 5 | 10.58 | 18.75 | 5.29 | 38.46 | 26.92 |
| 6 | 34.13 | 27.88 | 12.50 | 24.52 | 0.96 |
| 7 | 24.04 | 24.52 | 10.10 | 40.38 | 0.96 |
| 8 | 29.81 | 33.17 | 6.25 | 29.33 | 1.44 |
| 9 | 9.62 | 17.31 | 5.77 | 49.04 | 18.27 |
| 10 | 18.27 | 29.33 | 5.29 | 38.94 | 8.17 |
Table 6.
Result of ordered and binomial logit model.
| Purchase Model | Rent Model | |||||||
|---|---|---|---|---|---|---|---|---|
| Ordered | Binomial | Ordered | Binomial | |||||
| Coef. | SE | Coef. | SE | Coef. | SE | Coef. | SE | |
| Variable | ||||||||
| Purchase cost | −0.071 | 0.007 *** | −0.058 | 0.008 *** | - | - | ||
| Rental cost | - | - | −0.638 | 0.052 *** | −0.598 | 0.059 *** | ||
| Motorcycle title transfer cost | 0.045 | 0.074 | 0.046 | 0.085 | - | - | - | - |
| Fuel price | 0.012 | 0.084 | 0.064 | 0.096 | 0.279 | 0.087 *** | 0.206 | 0.099 ** |
| Coverage distance | 0.047 | 0.009 *** | 0.049 | 0.010 *** | 0.084 | 0.010 *** | 0.082 | 0.012 *** |
| Battery exchange station | 0.019 | 0.074 | −0.002 | 0.086 | −0.215 | 0.086 ** | −0.301 | 0.100 *** |
| Credit payments | −0.078 | 0.074 | 0.007 | 0.086 | - | - | - | - |
| Maximum speed | 0.015 | 0.022 | 0.006 | 0.026 | 0.023 | 0.025 | 0.005 | 0.029 |
| Annual tax | 0.020 | 0.075 | 0.083 | 0.085 | - | - | - | - |
| Sociodemographic | ||||||||
| Age | −0.003 | 0.004 | 0.003 | 0.005 | −0.022 | 0.005 *** | −0.019 | 0.006 *** |
| Gender (male) | −0.001 | 0.215 | 0.062 | 0.254 | −0.112 | 0.239 | −0.151 | 0.278 |
| Full-time drivers | 0.038 | 0.107 | 0.001 | 0.121 | 0.338 | 0.117 *** | 0.355 | 0.137 *** |
| Current university students | −0.012 | 0.143 | −0.044 | 0.165 | 0.536 | 0.158 *** | 0.438 | 0.182 ** |
| Education (bachelor’s degree) | −0.069 | 0.047 | −0.034 | 0.054 | −0.130 | 0.052 ** | −0.116 | 0.060 |
| Income/purchase price | −0.001 | 0.001 | 0.001 | 0.001 | - | - | - | - |
| Income/rental cost | - | - | - | - | −0.009 | 0.002 *** | −0.008 | 0.002 *** |
| Threshold | ||||||||
| τ1 | −2.979 | 0.431 | - | - | −5.368 | 0.519 | - | - |
| τ2 | −1.665 | 0.428 | - | - | −4.000 | 0.513 | - | - |
| τ3 | −1.282 | 0.428 | - | - | −3.679 | 0.512 | - | - |
| τ4 | 1.115 | 0.432 | - | - | −1.202 | 0.509 | - | - |
| Model statistic | ||||||||
| Final log-likelihood | −3526.64 | −1628.71 | −2884.79 | −1332.19 | ||||
| Pseudo R2 | 0.027 | 0.041 | 0.047 | 0.069 | ||||
*** means p < 0.01 and ** means 0.01 ≤ p < 0.05.
Publisher’s Note: MDPI stays neutral with regard to jurisdictional claims in published maps and institutional affiliations. |
© 2022 by the authors. Licensee MDPI, Basel, Switzerland. This article is an open access article distributed under the terms and conditions of the Creative Commons Attribution (CC BY) license (https://creativecommons.org/licenses/by/4.0/).
Share and Cite
MDPI and ACS Style
Waluyo, T.A.; Irawan, M.Z.; Dewanti. Adopting Electric Motorcycles for Ride-Hailing Services: Influential Factors from Driver’s Perspective. Sustainability 2022, 14, 11891. https://0-doi-org.brum.beds.ac.uk/10.3390/su141911891
AMA Style
Waluyo TA, Irawan MZ, Dewanti. Adopting Electric Motorcycles for Ride-Hailing Services: Influential Factors from Driver’s Perspective. Sustainability. 2022; 14(19):11891. https://0-doi-org.brum.beds.ac.uk/10.3390/su141911891
Chicago/Turabian StyleWaluyo, Tanto Adi, Muhammad Zudhy Irawan, and Dewanti. 2022. "Adopting Electric Motorcycles for Ride-Hailing Services: Influential Factors from Driver’s Perspective" Sustainability 14, no. 19: 11891. https://0-doi-org.brum.beds.ac.uk/10.3390/su141911891
Note that from the first issue of 2016, this journal uses article numbers instead of page numbers. See further details here.