1. Introduction
Across the world, the adoption of a neo-liberal higher education (HE) model has pressurized institutions to become efficient from both market and societal perspectives. Universities are compelled to enhance the quality of their education to satisfy the needs and expectations of students and gain a competitive edge in the educational arena. An important indicator of the university’s education quality is the student attrition rate [
1].
Preventing student attrition (increasing retention) is critical to the success of universities. This is also identified with student success [
2,
3]. Student success has received considerable attention in the U.S. [
4] and has been an important issue within the European policy agenda [
1]. The United States ranks 19th in graduation rates among 28 OECD countries, having a drop-rate of 40% and costs associated with lost earnings of USD 3.8 billion, annually [
5].
According to the HE Standards Panel [
6], in Australia “measuring completion, attrition, retention, and student success data captures behaviors and gives a timely, overarching picture of academic progress”, highlighting the centrality of these measures in the students’ learning journey.
The phenomenon of attrition can be very severe in HE; consequently, it should be identified timeously to help students continue their studies [
7,
8]. Despite taking measures to tackle this issue, undergraduate students tend to drop out and HE institutions find it difficult to address this multifaceted and costly reality [
9]. Predicting attrition is difficult because of the multifarious nature of its causes and complex interconnections of its predictors. To deal with this complexity and multiplicity, several researchers have built their predictive models based on a particular context. Beer and Lawson [
10] posited that attrition is a complex and wicked problem that requires agile and collaborative solutions that simple models can accommodate, instead of bureaucratic strategic plans.
The prediction of the set of variables that lead to attrition are an evident part of learning analytic (LA) endeavors to improve learning environments by providing flexible, timely and trustful data [
11]. In the educational context, LA “provide institutions with opportunities to support student progression and to enable personalized, rich learning” [
12] (pp. 157).
A major challenge in LAs is the atheoretical nature that characterizes many of its models [
12,
13,
14]. There is a clear need to shift the focus on theory-driven LA models [
15] that are defined by variables that are malleable and amenable to intervention and improvement [
16].
However, attrition is not just an event (e.g., failing or passing a course) or a measurable outcome (e.g., students’ grades); it is also a process of decision making during which intentions are created to determine whether the student should persist or withdraw [
3,
17,
18,
19]. Students intending to drop out of university are considered as being at risk and their decision to leave is reflected in their thoughts about the number of times that they have failed during an academic course.
Researchers, who have studied retention and educational quality, advocate that universities should predominantly consider students’ perceptions about their needs and what is important for them [
20,
21]. Similarly, studies that assess learning theories and models have shifted their focus away from teachers’ roles and responsibilities and the design of teaching tasks towards: (1) the importance and relevance of learning [
22]; (2) students’ beliefs about learning [
23,
24]; (3) fear of academic failure; and (4) the way they perceive and experience the learning environment [
25]. While studies—that have built attrition models—have assessed the students’ perspectives of their courses [
21], as far as the authors’ knowledge, no research has been conducted on the significance of students’ perceptions of what is important for their learning progress affecting their attrition status. Furthermore, additional research is urged to deepen our knowledge of the factors that cause the problem of student attrition in the Arabic higher education context [
7].
Our research aims to pre-emptively identify students who are prone to attrition by considering their evaluations of the importance of the factors influencing their learning progress. Based on the theoretical models of attrition and guided by the demands of LAs, a research model was formulated and tested with structural equation modelling (SEM). Timeously collecting information on the importance of the learning progress for students who are at risk of attrition will allow institutions to develop mechanisms to tackle this phenomenon by supporting and facilitating the learning progression of students [
16,
26,
27].
2. Theoretical Background
In the extant literature on attrition, retentions (dropout), transfers, and graduation rates are the criteria of students’ academic success as a multidisciplinary and multidimensional concept [
28,
29,
30], which can be defined as the factors of the university’s environment and/or student’s attributes [
31]. Kuh et al. (2007) argued that there is no all-encompassing theoretical framework that situates and articulates all of the impinging factors of students’ success, defined as the amount of learning that college students experience during their studies [
30].
To address this complexity, researchers explore student success by narrowing down its theorized predictive system to a specific context and the usage of related constructs. Success can be explored from the perspective of LAs [
27] and students’ learning progress as a reflection of their interaction with the learning environment and integration into the university [
30,
32,
33].
Learning analytics can be defined as ‘the measurement, collection, analysis and reporting of data about learners and their contexts, for the purposes of understanding and optimizing learning and the environments in which it occurs’ [
26].
Many studies provide evidence for the efficacy of LA models aimed at improving student success and increasing student retention [
16,
34]. It is argued that efficacy is attributed, essentially, to the use of fixed predictive factors (including grades, pre-college performance, and student demographics) which cannot be manipulable or subject to intervention [
16]. To predict which students are underperforming or are at risk of dropping out, LA applications should incorporate variables that can be assessed on an on-going basis, facilitating the interventions to improve students’ learning experience and foster their progress [
16].
Several models have been developed, revised, and tested involving attrition in universities [
35,
36,
37]. However, Vincent Tinto’s [
3,
17] social and academic integration model and John P. Bean’s [
19] empirical model of the dropout syndrome, can be regarded as significant advancements in the research field of attrition in HE.
This study’s causal research model has been developed based on Tinto’s theoretical framework—his integration approach—to predict the premature departure of students from an institution [
3,
17,
21]. Bean’s model of the dropout syndrome, according to which students’ intentions to leave is the most crucial factor affecting the decision to drop out, was also utilized [
19].
Tinto’s integration model postulated that the failure to integrate into a university environment academically and socially is the primary reason behind the decision to drop out [
17]. Bean’s (1985) model differed from Tinto’s (1975) integration model in that the former considers students’ intentions to leave as the most important predictor of their decision to drop out. Specifically, Bean found that when the variable of intention was included, his model absorbed the effects of other components (academic, social) that influence the decision to drop out (1985). Consequently, Tinto revised his model in 1993 and incorporated intention as a key determinant of the decision to drop out along with institutional experience and external commitments.
Both these models share the perspective that the decision to drop out is an ongoing goal-oriented process, where competing intentions to stay or leave are adjusted according to the students’ level of social and academic integration and their sense of belonging to the institution’s community. Academic integration refers to the correspondence between students and the academic schemata, which is reflected in their satisfaction with the learning progress and interest in the academic course [
30]. Integration of students into the social fabric of the institution mainly depends on their interaction with peers and instructors [
3,
17].
Additionally, Bean and Tinto highlighted the importance of students’ background (such as external commitments, family status, prior educational experiences, and personal attributes). However, since the institutions have little or no control over these variables, they should focus on strengthening factors that are directly under their jurisdiction and create the necessary conditions for students to succeed [
33,
38]. Studies have found that external socio-economic factors do not sufficiently explain students’ success [
39].
The emphasis on intention in Bean’s [
19] and Tinto’s [
3] models verifies the general premise that intention precedes behavior and can serve as a predictor of a decision. Empirical studies in psychology have often used intention as a proxy for actual behavior [
40]—students’ intentions to drop out can proximate their decision to discontinue their courses. Several studies have demonstrated that intention to leave is a significant explanatory variable of attrition [
41].
Students’ intentions to attain their educational goals and succeed in their learning programs can be hampered by uncontrollable emotional or mental states, such as the fear of failure, stress, and anxiety [
23,
42]. The negative impact of the fear of failure—in the form of avoidance behaviors (including procrastination)—on persistence, academic performance, and motivation, is well documented in the extant literature [
43,
44]. Martin et al. found a reciprocal relationship between the psychological academic risk factors of anxiety, fear of failure, and lack of control over academic buoyancy [
45]. Perrin et al. have shown through qualitative research that the fear of disappointing others (relatives and peers) influences academic motivation [
46]. In the context of performance-avoidance goals, the fear of failure increases anxiety that exerts negative influences on academic performance and motivation in pursuing goals, ultimately leading to withdrawal from the course [
43,
47].
Presumably, the intention to quit—negatively affecting their willingness to complete their studies [
10]—arises out of the students’ failure to see themselves as capable of successfully completing a course. Consequently, they drop out or, more likely, compromise with borderline grades that embody this sense of failure.
Noel-Levitz stated that “progression is the rate at which a cohort participates in any activity that an institution has determined to be correlated with persistence” [
48]. In Tinto’s models of integration and persistence [
3,
21], learning is the outcome of students’ interactions and experiences with the institution’s community which directly impact students’ intentions to persist. Greater academic and social integration of students encourages the increased persistence to succeed and finally graduate [
33]. Persistence to complete their degree is inextricably linked with students’ success; they will persist further if their learning increases [
21].
Learning within the institution’s environment can be active, supportive, and interactive [
49]. Active learning refers to the intentional effort of students to acquire knowledge. Supportive learning is grounded in teachers’ effectiveness [
50] and interactive learning pertains to the interaction between students, their peers, and teaching staff [
49]. Consequently, students’ success includes all the criteria that represent progress towards their degree [
30].
Therefore, learning progress plays a pivotal role in students’ success and can be used as a predictor of their attrition status.
3. Proposed Research Model and Hypothesis Formulation
Our study proposes a research model to investigate whether students’ attrition status can be predicted by factors that contribute to their learning progress. Attrition status is represented by students who are prone to dropping out and at risk of academic failure. It is reflected in the number of times that students are considered to have dropped out or failed, have been denied entry to final exams due to poor attendance rates, and have obtained a nearly passing mark.
The concept of learning progress consists of four sets of variables: academic integration (teacher effectiveness, course schedule, and course provided learning materials and infrastructure), social integration (interaction with peers and instructors), performance (exam scores), and students’ persistence towards learning (effort and absenteeism).
Assuming that the students’ goal is to complete their studies, their evaluation of the importance of the variables of learning progress will represent their beliefs related to academic achievement. Stronger beliefs combined with a reduced sense of failure increase the likelihood of the intention to complete the academic course.
In the educational literature, the GPA is regarded as a tangible measure of students’ success [
51] and is commonly used as an indicator of academic achievement and a predictor of students’ intention to withdraw [
17,
19]. However, the GPA is not just a metric of academic momentum. It is also the outcome of the interplay of several cognitive and non-cognitive factors. Specifically, the GPA has been expressed as an effect of personality traits, self-efficacy, motivation, learning strategies, achievement goals, study skills, and study habits [
52,
53,
54]. Studies have observed that when students’ intentions to withdraw is controlled, the impact of the variables that explain attrition—except the GPA—becomes insignificant [
19,
51]. Similarly, Cabrera, Nora and Castaneda considered the GPA as a separate construct in their model of student persistence [
55]. Therefore, the GPA, on its own, represents a complete system and it should be treated as an endogenous variable within the model.
The students’ interactions with faculty members was not considered as part of the social integration factor because the proposed predictive model includes inputs that are closely related to classroom-based learning processes and outcomes. Studies have found that students’ interactions with faculty does not play an important role in students’ educational evolvement [
56,
57].
Additionally, Bean and Tinto highlighted the importance of students’ backgrounds (such as external commitments, family status, prior educational experiences, and personal attributes) [
3,
17,
19]. However, since the institutions have little or no control over these variables, they should focus on strengthening factors that are directly under their jurisdiction and create the necessary conditions for students to succeed [
38]. Studies have found that external socio-economic factors do not sufficiently explain students’ success [
39].
Following the attrition literature and with the aim of improving the causal processes and inferences, four more covariates were included in the model. These covariates reflected students’ academic semesters [
9,
58,
59], the class types (traditional, online, blended) student attendance [
36,
60,
61], the type of administration (private, public) [
30,
62] and the location of the university (urban, rural) [
63].
3.1. Structural Hypothesis (H1)
According to Tinto, the process of students’ development and academic integration is fueled or hindered by institutional characteristics such as its resources, facilities, structural arrangements, and synthesis of its members. Students perceive the teaching process and institution’s facilities as learning opportunities and means to reach their goals, and thus, are considered essential for successful learning and integration into university [
17].
Teacher effectiveness is a highly debated sub-factor, due to its strong link with the quality of education and its repercussions on societies and economies. Effective teaching is expected to have a significant impact on the learning progress, academic achievement, and the intentions to persist by encouraging and motivating students [
50,
64,
65].
The course provided infrastructure (IT systems, classrooms, etc.) is expected to have an impact on students’ satisfaction and active learning, especially for distance learning students [
61,
66,
67].
The course schedule is another institutional characteristic that directly affects students’ motivation and persistence [
38], learning progress, and academic success [
68]. Raisman found that a non-compatible course schedule is among the top four causes of tertiary students dropping out [
69].
Studies have shown that peer-to-peer interaction can lead to academic success, cognitive development, and learning strategies [
49,
70]. Positive experiences with fellow students facilitate their adaptation and assimilation into the new learning environment and foster their engagement behavior and feelings of commitment toward the institution [
30,
71].
Interaction with academic staff is considered a major component of the overall education quality and a core aspect of students’ learning experience and successful progression. A positive experience of interaction with an instructor leads to high levels of satisfaction with the course [
60] and enables students to identify with the respective community [
30].
Students’ efforts are considered a vital component of the trajectory leading to academic success [
72,
73]. The investment of time and energy by students to meet the course requirements has a direct influence on their learning progress [
74] and plays a critical role in mediating students’ persistence between integration and intentions [
75].
Class attendance is another influential variable of the learning progress, academic performance [
76,
77] and study success [
78]. Findings from a meta-analytic study showed that class attendance is the best-known predictor of academic performance [
52].
According to the arguments above it is hypothesized that:
Hypothesis H1. An increase in learning progress variables will decrease students’ attrition status.
3.2. Mediation Hypothesis (H2)
Following Bean’s proposition, it is expected that learning progress variables (e.g., academic integration, absenteeism, etc.) are precursors to the GPA [
19]. Consequently, the GPA may act as a mediator by intervening in the relationship between learning progress and students’ attrition status. Thus, the following hypothesis is proposed:
Hypothesis H2. The GPA captures part of the total effect of the learning progress on attrition status.
3.3. Moderation Hypotheses (H3)
The rates of students’ persistence differ according to the semester [
9,
51]. While the fear of attrition looms across all semesters [
58], it is most evident during the first two semesters [
39,
49,
58]. Institutional characteristics, interactions with instructors, and teacher effectiveness are more influential in the subsequent semesters [
58]. Kowalski found that first-year students are more learning oriented and less grade oriented than students in higher years [
79]. Therefore, the relationship between the learning progress and students’ attrition may depend on whether students are first-year students or in a higher year (moderated effect). In line with the above argument, the following hypothesis is postulated:
Hypothesis H3. The academic semester moderates the structural relations in the model.
3.4. Moderated Mediation Hypothesis (H4, H5, H6, H7)
The existence of the hypothesized mediational model across the two groups and the strength of the causal chain between the learning progress, the GPA and the attrition status (SF → GPA → ATS) cannot be defined a priori. Presumably, both groups of students are aware of the need to gain academic momentum in order to remain at university and complete their studies successfully. Therefore, it was expected that the hypothesized mediational model will hold across the two groups of students. Accordingly, the following hypothesis is formulated:
Hypothesis H4. The academic semester moderates the relationship SF→ GPA→ ATS such that the GPA functions as a mediator for both subgroups of students.
First-year students have a higher chance to obtain a lower GPA than those in higher years [
80], and students with a low GPA in the first year are potential candidates to withdraw from their courses prematurely [
81]. Furthermore, if learning orientation is higher for first-year students [
79], then we expect that the impact of the learning progress on their GPA status (SF → GPA) will be stronger for first-year students than higher-year students. On this basis, the following hypothesis is proposed:
Hypothesis H5. The academic semester moderates the relationship between the learning progress and attrition status, such that the impact of the learning progress (SF) on the GPA status is stronger for first-year students.
First-year students may not have a clear view of what it takes to be successful in university, and this may be reflected in the importance they attach to the role of the GPA in the decision to drop out. Consequently, the influence of the GPA on the decision to drop out may be attenuated for first-year students. According to this line of reasoning, the study proposes the following hypothesis:
Hypothesis H6. The academic semester moderates the relationship between the learning progress and the attrition status, such that the impact of the GPA status on the attrition status (ATS) is weaker for first-year students.
The first year at university is regarded as critical because student success is highly dubious [
38,
51]. The lack of social and academic integration makes first-year students more vulnerable to attrition [
82]. The step towards the process of integration is a new role for first-year students. Any inexperienced perceptions of success or failure and inaccurate evaluations of the strengths and weaknesses of the learning and institutional conditions can affect their new role by affecting their effort to persist and complete their degree. Therefore, the influence of the SF on the ATS might be stronger over first-year students. Accordingly, the following hypothesis is set:
Hypothesis H7. The academic semester moderates the relationship between the learning progress and the attrition status, such that the impact of the learning progress (SF) on the attrition status (ATS) is higher for first-year students.
4. Research Method
The present research falls into the post-positivism paradigm, following a deductive reasoning, to formulate and test its hypothesized relationships. As such, a quantitative survey method was employed, targeting tertiary Saudi students’ perceptions over their level of academic integration, social interaction, performance, and learning behavior in the context of their learning environment.
Based on a thorough literature review, a survey instrument of 18 items was developed. The questionnaire was assessed by two academic experts in the field of education, to ensure the content and face validity of the items. Students’ perceptions about the importance of their level of academic integration, social interaction, performance, and learning persistence have on their learning progress was assessed using a nine-item five-point Likert scale.
Students’ beliefs about their attrition status were measured by four items on a four-point scale. Students were also asked to rate academic performance according to their GPA on a five-point scale with 1 being “Poor” and 5 being “Excellent”. The instrument also included questions regarding students’ semester, the type of classes (traditional, online, blended) the type of institution (public, private) and the location of university (urban, rural).
At its heart, Saudi Arabia’s tertiary education system is similar to that in the United States; it includes associate degrees, bachelor’s degrees, master’s degrees, and doctoral degrees as benchmark credentials [
83]. The Saudi Arabian educational system has taken the lead in recent years in efforts to diversify the country’s economy, away from one that is reliant on oil and toward one that is more sustainable [
84,
85]. While significant progress has been made towards the development of a quality education system, there is room for progress, especially with regard to learning outcomes [
85].
The targeted population consisted of all full-time undergraduate students in Saudi Arabia which total around 1,422,000 [
86]. Saudi Arabia has 52 universities, of which 29 are public and 14 are private [
87]. Approximately 5% of the total number of students, is enrolled in private universities and 80% are enrolled in public universities [
86]. Although there is no official breakdown of statistics of first and higher year students enrolled in public and private universities, the new entrants estimated to constitute 12% of the students’ total population, by 2020 [
88].
It is utterly impractical to locate and identify all population units and maintain that they have an equal chance of becoming sample members. Further, there is no sufficient information about the number of students studying in the different types of classes, as well as the number of students in each semester. Since it is not feasible to organize the population into strata (subgroups) and select the sample units randomly, the present research employed the widely used convenience sampling approach. The sample is likely to be unrepresentative of the population as a whole; however, Ritter et al. (2004) supported that convenience samples can be used for web research [
89]. To increase the representativeness and to reduce coverage error, the targeted sample consisted of three private universities and seven public universities, of which three were located in rural areas and the rest in urban areas.
A sample size greater than 385 students was considered sufficient for the study [
90]. A web-based survey using Google forms was conducted. Initially a pilot survey was performed on a sample of 120 students to simulate the process of the formal survey and the statistical analysis. Students were invited to participate in the survey, without any incentives, through posts on popular social media platforms and through the university in Facebook campus student groups, as well as Twitter and WhatsApp. Overall, 530 valid questionnaires were gathered and used for further analysis.
The steps in the statistical analysis included the identification of the data structure through the exploratory factor analysis (EFA), the validation of the constructs through the confirmatory factor analysis (CFA), and the application of structural equation modeling (SEM).
The mediation analysis was performed by employing the method of the bootstrapped bias-corrected confidence intervals (sub-samples = 2000, CI = 95%) and the significance of the indirect effect [
91,
92,
93] of the SF on the ATS through the GPA. A multiple group invariance analysis was applied to test whether the global SEM model is germane for first and for higher year students. Initially, the semester variable was categorized into two groups (first and higher year students). Then, the structural invariance approach was employed, which involved the computation of the chi-squared difference test (Δχ
2) between the constrained in structural paths model and the unconstrained model, assuming the unconstrained model is correct [
94]. If the non-invariance is present, then the two models differ significantly, implying that the academic semester has a moderating effect on the structural relationships in the model.
To assess whether the mediating effect of the GPA on the ATS is moderated by the academic semester, the equality of the coefficients of the path from the GPA to the ATS was tested between the two groups [
93] through the pairwise comparison available in the AMOS package. Following the framework of the total effect moderation model [
95], the equality of the relation of the SF to the GPA and the SF to the ATS, was also tested. Prior to the pairwise comparisons, a bootstrapping approach was adopted to find whether the mediation holds for each model.
The statistical analyses were conducted using the SPSS and AMOS statistical packages.
5. Data Analysis and Results
5.1. Descriptive Analysis
The results indicated that most students (56%) attended traditional classes, 30% attended blended classes, and 11% attended an online course. One-third of the total sample belonged to the freshman year and only 16% to the fourth, senior-most year. The rest were split evenly across the second and third years. In the context of students’ self-evaluation of their GPA, almost 35% of the students considered their performance as average, 23% as high, 14% as very high, and 18.5% as excellent. The balance of the students (10%) regarded their performance as low or very low. Interestingly, one-third of the students stated that teacher effectiveness and the learning materials provided were “not important at all” and over 21% said that it was “slightly important”. The lowest evaluation was attached to personal effort where 34% of students believed it to be of “no importance” and 24.5% of “low importance”.
The frequencies of the four items linked to attrition status revealed that, on average, 44% of the students reported that they received pass marks, dropped out or were denied from continuing only a “few times”. Approximately 39% of the students indicated “never”, 13.4% “many times”, and 3.5% “plenty of times”.
5.2. Estimation of the EFA and the CFA
The results of the EFA are presented in
Table 1. The Bartlett test of sphericity and the Kaiser–Meyer–Olkin (KMO) test affirmed the data’s suitability for the factor analysis [
96]. The application of the principal axis factoring method with the varimax rotation technique, suggested a two-factor solution with eigenvalues > 1. The two factors explained almost 57.8% of the variance. All thirteen variables received factor loadings above 0.5 [
96].
The first factor comprised the nine items representing the learning progress, labelled as the success factor (SF). The second factor was named the attrition status (ATS) and comprised four items determining students’ attrition. Success factor items with the highest loading value were teacher effectiveness (Teacheff) and course learning materials (Courlearnmat), indicating that they were the most significant contributors in forming the success factor. The absentee status achieved the lowest loading. The attrition status variables, with the strongest loading value, were failure (Failedstat) and dropping out (Dropstat), while students’ self-perceptions about their academic performance (Lowgrdstat) had the weakest loading value (
Table 1).
Table 2 presents the results of the CFA and the goodness-of-fit indices of the measurement model. The results show that all indicators of their respective constructs have significant (
p < 0.01) regression weights (standardized in parenthesis).
The fit indices indicated that the model had a good overall fit to the data. The NFI, CFI, IFI, and TLI indices had values that were above the threshold value of 0.90, signifying a reasonable fit [
94,
97]. The RMSEA was 0.064, which was below the value of 0.08, essential for an adequate fit [
94,
97]. The chi-squared/d.f. ratio of 3.20 was below the cut-off value of 3.0, but this test is susceptible to sample sizes and tends to reject the null of a good fit for large samples [
97]. Overall, the results from the CFA showed evidence of construct validity.
Cronbach’s Alpha was evaluated so as to ensure the internal consistency of the latent variables. The estimated coefficients of 0.94 and 0.72 for the SF and the ATS, respectively, exceeded the recommended value of 0.70, indicating an adequate internal consistency [
97].
5.3. Estimation of the SEM
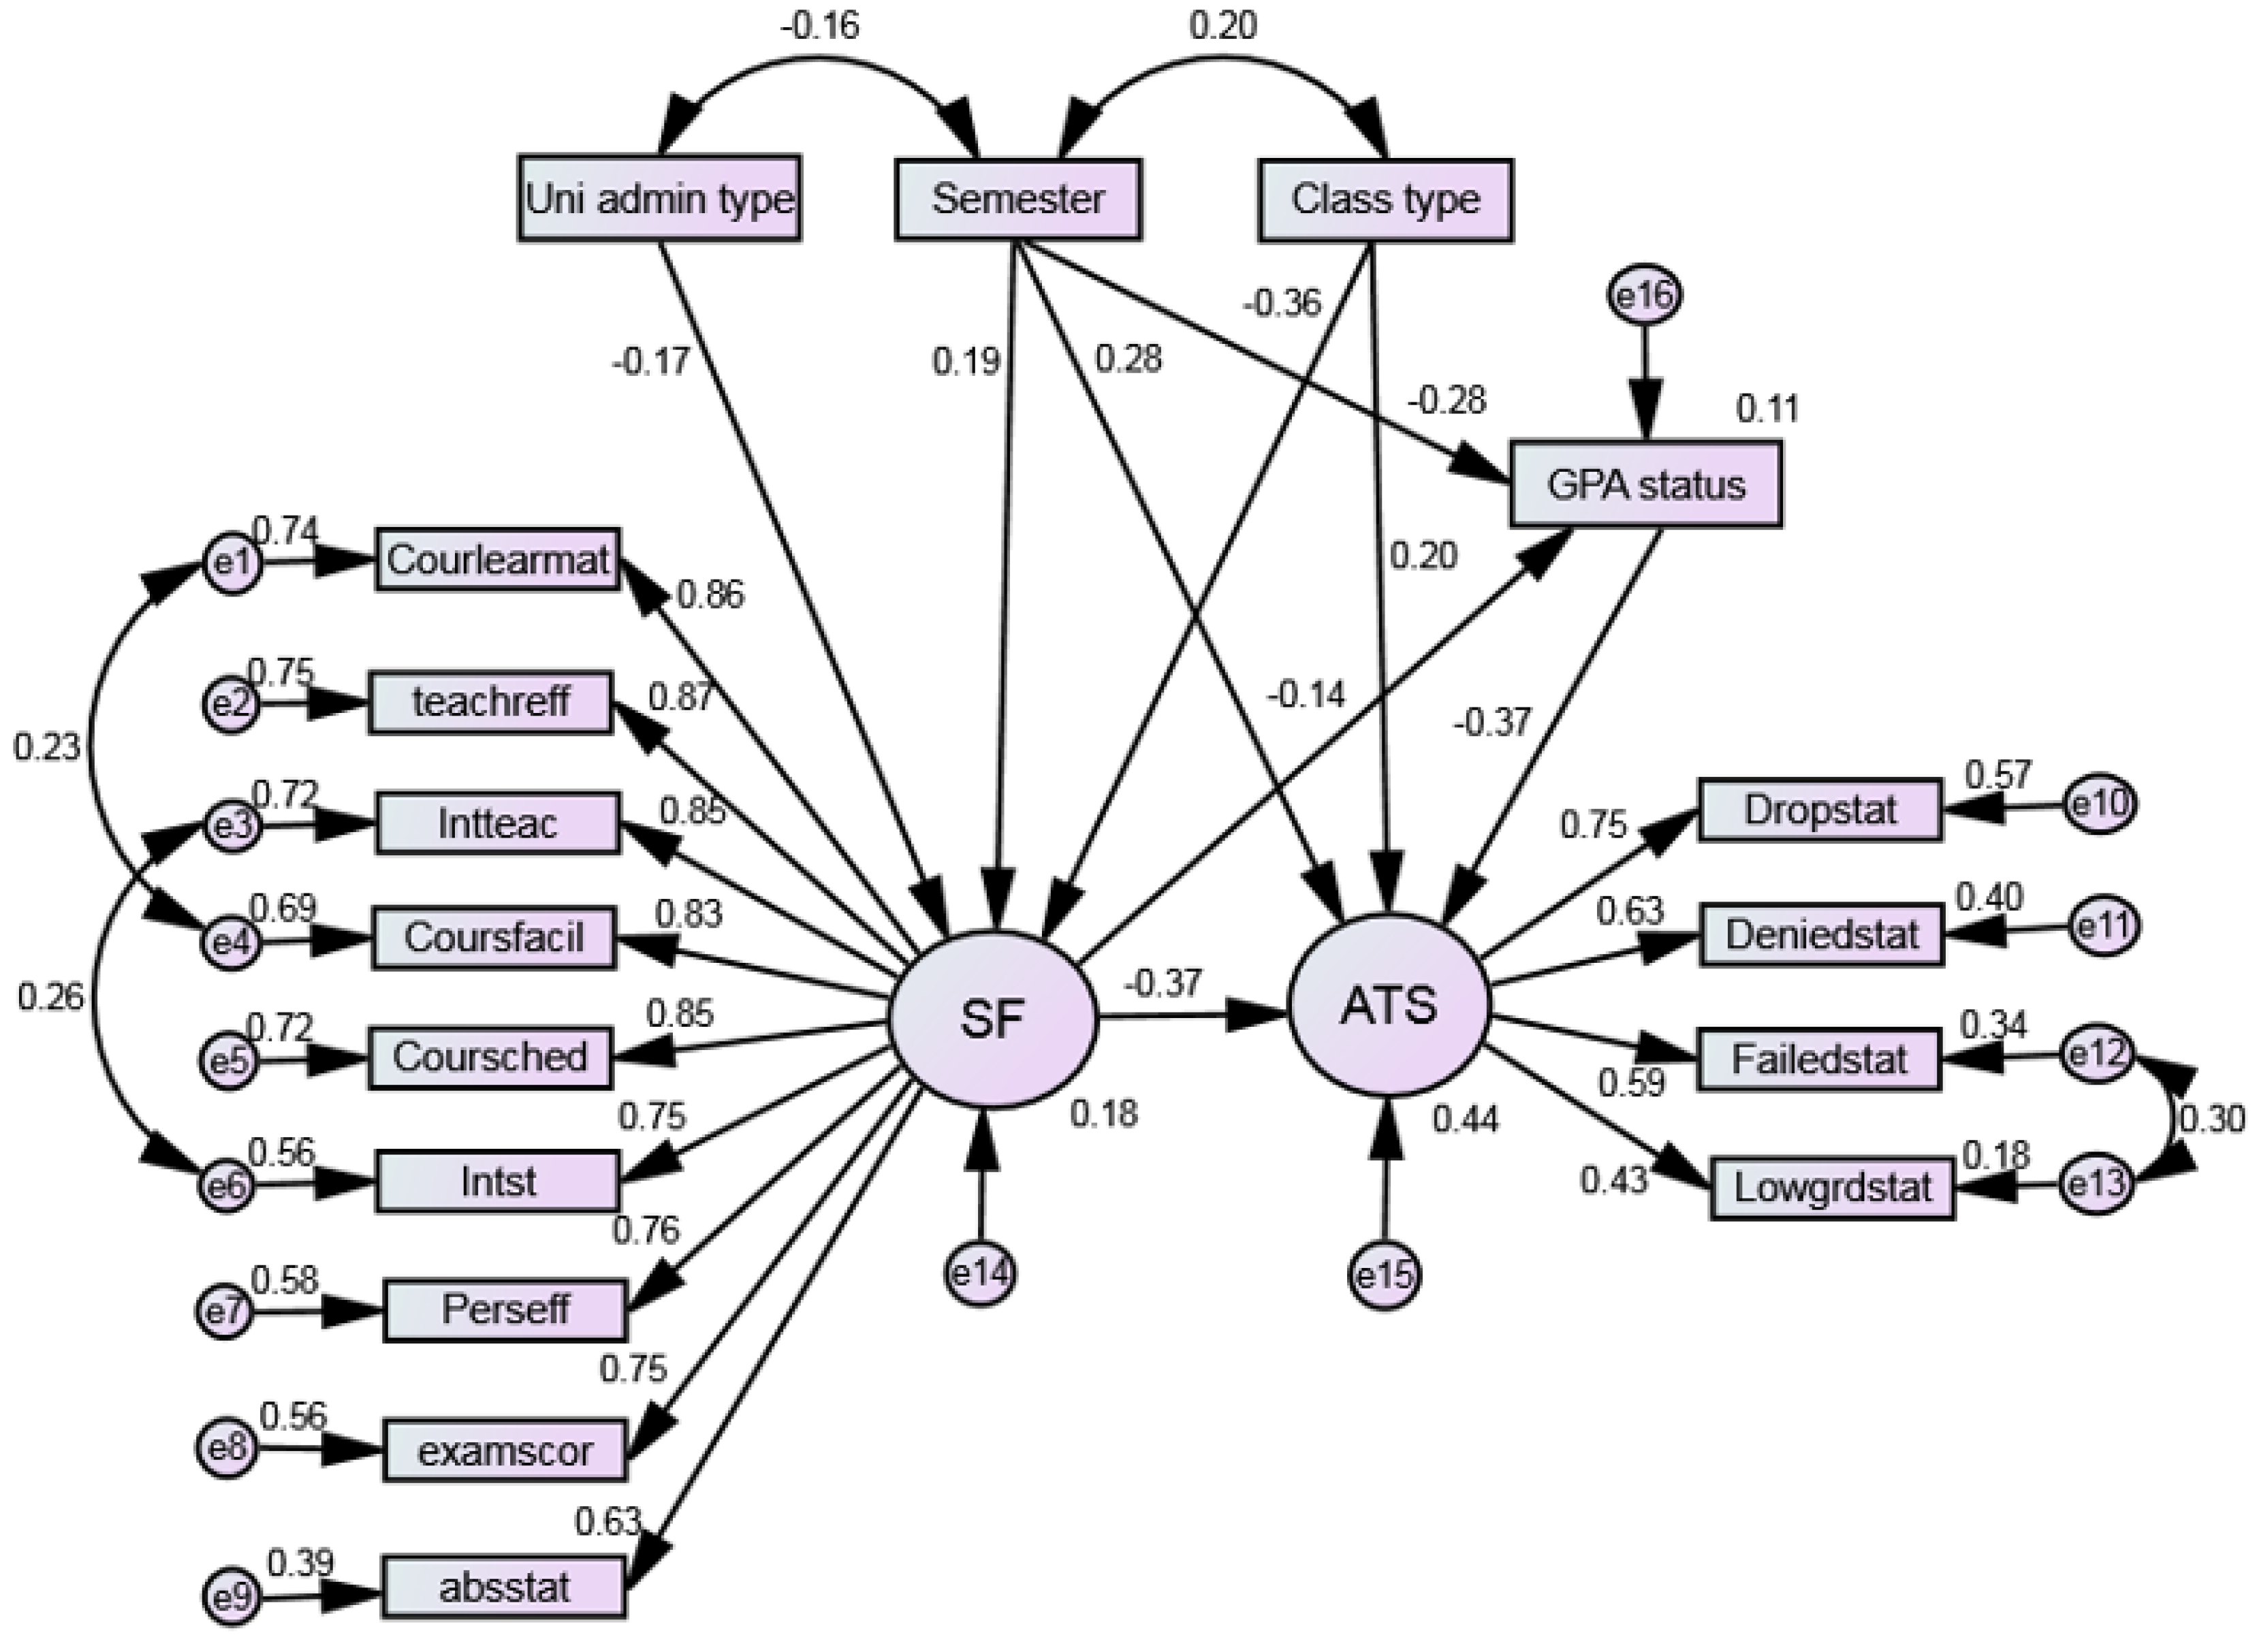
The path diagram in
Figure 1 displays all of the significant relationships (
p < 0.05) with the standardized coefficients reported, including the correlations between the control covariates and the squared multiple correlations (SMRs) for the latent variables. The variable representing the university’s location did not have any significant contribution and therefore was dropped from the model.
According to the SMR values, 44% of the variance in the ATS was accounted for by the success factor and the three exogenous variables. The regression coefficients of the structural part of the model, together with the significant covariates and the fit indices, are presented in
Table 3. The ratio of the chi-squared to the degrees of freedom was below the threshold value of 3 and the RMSEA value was below 0.08, suggesting an adequate fit. All other fit indices (GFI, CFI, NFI, TLI, and IFI) had values above the recommended value of 0.90 for an acceptable fit.
The results of the structural model illustrated that the success factor (SF) had a significant (
p < 0.01) and relatively large negative impact (−0.37) on the attrition status (ATS) (
Figure 1). The negative sign indicated that the higher (lower) the importance students attach to the learning progress (SF) the lower (higher) their attrition status would be. This finding confirmed hypothesis one.
As it was expected, the path of GPA → ATS received a negative sign which means that students with a higher (lower) GPA are less (more) prone to attrition. The negative impact of the SF on the GPA status suggests that the higher the students assess the importance of the learning progress variables, the lower their GPA status is.
All covariates exhibited a significant effect (p < 0.01) on the ATS. Among them, only the academic semester had a significant impact on all three endogenous variables. Its positive influence on the SF and on the ATS indicated that the higher (lower) the semester, the higher (lower) the perceived importance of the learning progress variables and the higher the students’ attrition status. Furthermore, the higher the semester; the lower the GPA status of students.
The path coefficient of SF → ATS remained significant after the GPA status entered the model but its strength reduced from −0. 40 to −0.37. This reduction is an indication that the GPA may fulfill the role of a partial mediator in the relationship between the SF and the ATS. The mediation analysis through the bootstrapping tests revealed a significant (p < 0.01) indirect effect (effect: 0.052; 95% CI: 0.019 to 0.095) and a significant (p < 0.01) direct effect of the SF on the ATS (effect: 0.37; 95% CI: −0.480 to −0.245). According to these results, the proposition of the second hypothesis was supported, in that the GPA partially mediates the relationship between the SF and the ATS.
The results of the multi-group analysis (
Table 4) revealed a significant (
p < 0.01) chi-squared difference (Δχ
2), indicating that the unconstrained (global) model fit the data better than the constrained one. This meant that the two models differed, with the academic semester having a moderated effect on the structural part of the model. Therefore, hypothesis three is confirmed. The results related to the significance of the structural paths between the two models showed that the path coefficient of SF → Classtype for the first year subgroup was non-significant while the relation of SF → GPA for the higher year subgroup was significant at the level of 0.10 (
Table 4).
The application of the bias-corrected bootstrap test resulted in a significant indirect effect (effect: 0.058; 95% CI: 0.014 to 0.125) for the first year students and a non-significant indirect effect (effect: 0.011; 95% CI: −0.02 to 0.044) for the higher years students. This result provided evidence that the mediation process is present only in the group of first year students. Consequently, hypothesis four is not satisfied.
Hypotheses five, six, and seven were tested through the use of the pairwise path coefficient differences between the two models. The critical ratio (CR) for the difference in the coefficients of the path from the SF to the GPA status was statistically significant (CR = 3.904 > |1.96|), which implies that the influence of the learning progress on the GPA status is stronger for first year students than for higher year students. This result confirmed the fifth hypothesis.
The insignificance of the differences in the coefficients of the path from the GPA status to the ATS (CR = −0.852 < |1.96|) and in the coefficients of the path from the SF to the ATS (CR = −1.557 < |1.96|), indicated that the academic semester does not moderate the direct effects of these two paths. Therefore, the sixth and seventh hypotheses of the study were not supported.
6. Discussion
Recent advances demand that LA initiatives should rest on sound theoretical models.
Inspired and guided by Bean’s theorization of the prominent role of students’ intentions and Tinto’s students’ perspective theory to study attrition “through the eyes of students”, a model was proposed to predict attrition at an early stage. The model included input variables as a set of indicators that shape students’ learning progress. Students who are prone to attrition were the output variable, which was evident in students’ past academic experiences (e.g., failure), in indicating their intention to drop out. To our knowledge, this is the first study to be conducted in this specific context.
The results of the EFA and the CFA revealed that the set of measures of academic and social integration, as well as students’ performance and behavior towards learning, formed a single construct, labelled the success factor. This finding partially supports Tinto [
3] and Cabrera et al. [
55], according to whom social and academic integration are complementary and independent. Furthermore, the claim that the two forms of integration are distinct, is challenged by the presence of the common variance between the errors of the interaction with lecturers and peers. However, Kuh et al. [
30] asserted that the items used in the survey instruments may not fully capture the aspects of these interactions and reveal the evidence of their distinctive nature.
The results of the EFA and the CFA also suggested that teacher effectiveness was the most significant in shaping the success factors. This finding is consistent with theoretical arguments and empirical evidence [
96,
98] that teacher effectiveness is the most influential variable to students’ learning progress.
The relative insignificance of personal effort, discovered in both the descriptive analysis and the CFA, might raise some concerns about the provision of feedback on students’ efforts, the size of the workload assigned to them, and the way students use the feedback to fill gaps in their learning progress. An additional explanation could be that, on average, students in this study sample tended to adopt a performance-avoidance goal orientation, as characterized by their low levels of academic effort [
44].
The SEM analysis empirically supported the proposed research model. The model explained the 44% of the attrition variance, a result almost identical to that of Cabrera et al. [
55]. The analysis revealed that an increase in students’ learning progress (SF) will decrease their attrition status (ATS), thus satisfying the first hypothesis (H1) of the study. The findings also indicated that, as expected theoretically, the higher the GPA of students, the lower their attrition status. The negative impact of the SF on the GPA indicated that the higher (lower) the students valued the importance of learning progress variables, the lower (higher) their GPA status. This rather unexpected finding has a two-fold interpretation. First, it may reflect the lack of students’ positive engagement with the learning process. The low levels of students’ efforts that were discovered from the analysis, are an indication of the low level of active learning, while the significance of the teacher effectiveness found in the model can be read as a lack of supportive learning. Furthermore, some concerns are raised about students’ satisfaction with interactive learning. The correlation between the error terms of the two interaction variables is an indication that students believe that a smoother learning progress can be attained if they work both with peers and instructors. Students experiencing low levels of these three aspects of learning will dwindle down the intention to persist with negative effects on their academic performance. A second explanation of the negative influence of the SF on the GPA can be found in the self-protective strategies, students adopt to cope with the meaning of failure. Martin and Marsh found that over one-third of students in the first and second years in universities, adopt the so-called defensive-pessimism strategy which can lead to a poorer academic performance [
99,
100].
All of the observed exogenous variables were shown to exert a significant influence on the ATS, in concert with the theoretical and empirical findings discussed in the previous sections. An exception to this was the location of the university (urban, rural) which, in contrast to the results of Yi et al. [
63], was not significant and therefore not retained in the final model. The direction of the relationships of the class type on the SF (−0.36) and the ATS (0.20) revealed that as students move from traditional classes to online classes, their perceptions of the importance of the learning variables becomes lower and their intention to drop out, higher. The lack of impact of the class type on the student’s GPA status mirrors the results of several studies where the direction and significance of the relationship between the GPA and online courses was not entirely clear [
101]. Compared to students in public universities, students in private universities, appeared to evaluate lower (−0.17) the importance of learning progress variables.
The students who endeavor to avoid failure were more evident in higher semesters, as indicated by the positive impact (0.28) of the semester on the ATS. Simultaneously, students in higher semesters appeared to attach a higher importance (0.19) to the learning progress (SF) and have a lower (−0.28) GPA status. These three results combined to indicate that students at higher semesters are more aware that their reward for success passes through their learning progress, than their GPA status.
The mediation analysis supported the second hypothesis (H2) by illustrating that a student’s GPA is an important part of the effect of the SF on the ATS. The results of the multi-group analysis showed that the structural parameters varied significantly across the first year and higher years students, thus satisfying the third hypothesis (H3) of the study. However, the fourth hypothesis (H4) was not confirmed since further analysis provided evidence that the GPA functions as a mediator between the SF and the ATS only for the subgroup of students enrolled in the first year. This finding reflects the higher effort made by first year students in comparison to higher year students to gain academic momentum in order to cope with feelings of uncertainty and to overcome fears of failing.
Hypothesis five (H5) was confirmed by finding that the size of the negative effect of the SF on the GPA was significantly stronger for first year students. The high negative effect of the SF on the GPA for first year students and the lower effect for students in higher years, suggests that students progressively learn how to use the resources of their learning environment to obtain a higher GPA, with likely less effort.
Overall, the above arguments harmonize with the conclusion of Kowalski’s research that “students became more-grade oriented and work-avoidant and less learning-oriented over time” [
79] (p. 79).
The pairwise comparisons also show that the paths GPA → ATS and SF → ATS did not differ across the two groups of students and therefore hypotheses six (H6) and seven (H7) were not supported. There was no weaker effect of the GPA on the ATS for first year students (H6), indicating that the GPA has a prominent role in determining the student’s decision to withdraw from their courses. The effect of the SF on the ATS (H7), although amplified for students in higher years, was not significantly different from the effect of first year students. Theoretically, this result posits that the mechanism by the which learning progress (SF) directly influences the attrition status of students, was not affected by the academic semester.
6.1. Theoretical Contribution
This research contains four major theoretical contributions. The first and most significant theoretical implication is that there is a strong indication that the construct of the learning progress is comprehensive and an important instrument in predicting students at risk of dropping out. Second, regardless of whether previous models of attrition are theoretical or data driven, in contrast to the present model, most of them utilize (entirely or partially) determinants of students’ dropout decisions which are not malleable to institutional intervention, due to their fixed and intangible nature (e.g., socio-demographics, academic skills, self-esteem). Third, although the significance of the learning progress to students’ academic success is well documented, predicting that the phenomenon of attrition at an early stage has not been explored from this perspective, as a reflection of the learning environment variables which can be quantified, gathered, and used as data for tracking students who are at risk to drop out. Lastly, previous models of students’ attrition consider the variable of the GPA as exogenous (covariate), while the present study showed that the GPA can be introduced as an endogenous variable that acts as a significant partial mediator of the relationship between the learning progress and the attrition status, which is moderated by students’ semesters.
6.2. Practical Implications
The practical implications of the study can be summarized in the words of Tinto [
38] (pp. 117) that students’ success is “the result of intentional, structured, and proactive actions and policies directed toward the success of all students”. Identifying the aspects that are considered important by the students for their academic advancement—and doing so in a timely way—will allow institutions to develop the appropriate learning and teaching analytics tools to tackle the issue of attrition of students enrolled in HE, by supporting and furthering their learning progression. These tools should be designed to foster the knowledge construction and a sense of community among students and instructors.
The importance of the GPA as a mediator in the causal process of the learning progress and attrition status for first year students, emanates from the need to create an effective support program targeting exclusively to first year students.
6.3. Limitations and Further Research
The model lacks the presence of potentially important variables related to behavior and cognition (e.g., self-efficacy, self-regulation). This can be justified on the grounds that the proposed model is conceptualized using variables that are specific to a learning environment, are easily assessed, and are conducive to intervention. However, the inclusion of covariates reflecting students’ beliefs about the type of self-protective strategies they adopt against the fear of failure and about institutions’ learning environment orientation, can refine the interpretability of our model. As such, the role of the GPA as a mediator or as a moderator should be reexamined across the two subgroups of students. In this context, further investigation may be needed to identify the sources of invariance between first year and higher years students.
The present study maintains that students’ perceptions of evaluating the importance of factors pertained to the learning progress, reflects their need for achievement, which in turn leads to the completion of the course. However, the objective to complete the course may not hold true for all students, which can cause some bias to our findings. This limitation can be negated to a certain extent by the fact that the required methods and principles students need to follow to reach their goal (completion) are determined by the institution and not by their own mental schemata.
We also recognize two methodological limitations: First, the model applied to a particular country and the sampling approach was non-probabilistic which largely limits the generalizability of the research findings to other student populations. Although the dataset of the model is country-context sensitive, its variables have a global scope (e.g., learning materials, teacher effectiveness). This means that the framework of the model can be applied to different countries and university settings. Further research can strengthen the external validity of the scale and also the existence of our causal relationships and effects by using different and independent samples. Second, as with any quantitative model, this model predicts averages. Therefore, if an intervention program is implemented to reduce student attrition that is purely guided by such a model without considering the individual needs and concerns of students, it is likely to be unsuccessful. Consequently, a mixed-method approach, including both qualitative and quantitative techniques, may provide a more comprehensive understanding of the students’ learning experience and their needs.
Finally, future research could deploy machine learning techniques, such as neural networks or a decision tree analysis to facilitate the projection of attrition rates and provide university administrators with a practical tool to timeously prevent student attrition.

 ,
, 

