
Cross-Country Linkages and Asymmetries of Sovereign Risk Pluralistic Investigation of CDS Spreads


1
Symbiosis Institute of Business Management, Symbiosis International (Deemed University), Electronic City, Bengaluru 560100, India
2
Department of Economics, School of Economics and Political Sciences, National and Kapodistrian University of Athens, 1 Sofokleous Street, 10559 Athens, Greece
*
Author to whom correspondence should be addressed.
Sustainability 2022, 14(21), 14056; https://0-doi-org.brum.beds.ac.uk/10.3390/su142114056
Submission received: 21 September 2022
/
Revised: 14 October 2022
/
Accepted: 26 October 2022
/
Published: 28 October 2022
(This article belongs to the Special Issue Corporate Sustainability and Innovation in SMEs)
Abstract
:Credit Default Swap (CDS) spread is a realistic measure of credit risk. Changes in the spreads showcase changes in the underlying uncertainty or credit volatility regarding the credit risk, associated with the asset class. We use Multifractal Detrended Fluctuation Analysis (MF-DFA) to further investigate the presence of asymmetries and the difference between Greece and G7 countries in terms of credit risk. We have considered 2587 daily observations for each of the 48 CDS spreads. Hence, a total of 124,176 data points were under consideration across six yearly CDS categories of Greece and most of the G7 countries (Germany, USA, UK, Canada, Japan). The tenure of these CDS were 1 year, 2 years, 3 years, 5 years, 7 years, 10 years, 20 years, and 30 years. We have found that the Greek CDS spread movement is purely stochastic and anti-persistent, having practically no predictability at all. On the other hand, the remaining countries’ CDSs were highly predictable, showing a consistent long memory or long-range dependence, having embedded the bubble caused by herding. This is reflected in terms of flight-to-quality behavior and in estimates of CDS premiums for insurance against a default on government bonds.
1. Introduction
The financial crisis raises once again questions about the drivers of a key variable, known as CDS spread. Differences between CDS spreads can indicate the relative riskiness of various categories of debt. A credit default swap is nothing but insurance where the insurer assists the lender in order to prevent him from complete or partial loss on account of bankruptcy. The lender on the other hand pays a specified premium for the duration of the contract. Hence, if the CDS spread of a bank is 200 bps, this indicates that the premium to be paid is about USD 2 for every USD 100 worth of debt. These contracts can be traded. Usually the trading works for hedging, speculation, and arbitrage. CDS markets globally began shrinking following the 2008 credit crisis. As a CDS is a measure used by investors to hedge their credit risk, the CDS spread is considered a measure of credit risk. CDS spreads are mostly driven by fundamental variables such as firm volatility and leverage [1], market conditions, investor risk aversion, excess demand, liquidity, and idiosyncratic factors [2,3,4,5,6,7,8].
Ref [9] documented that deviations between CDS and bond spreads are related to counterparty risk, common volatility in EMU equity markets, market illiquidity, funding costs, and flight-to-quality. Ideally, fear of being either on the uptrend or on the downtrend for a continuous period is crucial. Under such circumstances, CDS spreads will show herd [10] and long memory [11]. Ref [12] confirmed the strong link between CDSs and implied volatility markets and found that the credit market is generally a leading indicator for movements in the volatility market during the subprime crisis.
Fear due to turmoil in a credit situation often surges the spreads high. However, it is a wide belief that spreads do not really capture the essence of true credit risk in the long run. Spreads typically determine market liquidity and counterparty risks among many other parameters. This indicates long range dependence and herd behavior by the participants [13]. Long range dependence or long memory is nothing but the extremely slow decomposing of the autocorrelation function (any stationary time series) [14,15,16,17]. Herding is often found to be the most probable reason behind bubble and long memory in financial time series [18,19,20,21]. By some accounts, spreads do capture the essence of true credit risk in the long run. Therefore, it is imperative to check the context before making the judgement [22,23]. Furthermore, the Hurst exponent has been proved to be a reliable indicator for herding behavior in many studies, as herding generates persistence in the financial time series [24].
Another area of study with respect to CDSs has been examining the long memory features of CDS spread volatility by using a DFA, Modified ICSS Test, and FIGARCH (from GARCH family models). It was proved that significant long-memory exists. It was also found that the Efficient Market Hypothesis is not applicable to the CDS market [25,26,27]. Since the CDSs have long memory, structural changes can be easily predicted [28]. However, this field of the CDS market has remained rather unexplored.
Our study attempts to bridge the gap by using multifractal detrended fluctuation analysis (MF-DFA) to find herding, bubble, and long memory traits between the spreads of Greece and most G7 countries’ (Germany, USA, UK, Canada, Japan) CDSs during a very volatile period. We have selected Greece as a peripheral country in a relationship with most of the G7 developed countries (Germany, USA, UK, Canada, Japan) for its CDS during a very volatile period. Since capital markets and most other related markets have an inherent fractal structure [29], using a fractal-based predictive mechanism is logical. Moreover, a relatively recent study showed that time-varying long-range dependence in markets disrupts financial systems [30].
In this work, we test the development of the sovereign credit default swaps between Greece and five economically developed countries (Germany, USA, UK, Canada, Japan). So, the purpose of our paper is to study the credit risk by comparing the spreads of sovereign CDSs through the difference between the leading “core”, economically developed countries and the weakest “peripheral”, emerging market (Greece). The reasoning behind this seems quite obvious. For instance, Germany’s exposure to Greece was about EUR 86.7 bn, i.e., 28% of its total borrowings [31,32,33] just before the economic crisis in 2014. The CDS premium between Greece and other countries, such as Germany, is interpreted as the last one used as a benchmark—and a risk-free benchmark as well. Therefore, it is used to calculate the bond spread, as all of Germany’s public debt trade is very low (sub-zero yields). The expansion of sovereign spreads can be attributed to differences in the credit worthiness of the issuers between Greece and the other developed countries and the relative liquidity of their bonds. Volatility and spreads of CDS between the markets of these countries become further complicated by the impact of market fears and herding caused by extreme events such as fiscal and external imbalances, political instability, and colossal debt.
As we know, the Greek credit event in March 2012 represented a unique episode of macro-financial stress and totally increased sovereign risk. The reason for choosing Greece is that this country was the first member state of the eurozone to default. This event raised policy makers’ strong concerns and it was probably a well-anticipated event by market participants.
The evolution of CDS spreads is a key indicator of the panic that conquers market participants. A widening of spreads means that investors evaluate it riskier to participate in the debt of Greece than that of the other developed countries. Consequently, they demand a higher premium as fears are raised that the Greek economy could face increasing problems within a deteriorating economic climate. Investors experiencing times of increasing stress will exchange into the asset-classes of developed countries because of their higher liquidity and because they are considered safer. We attribute the widening of the Greek CDS spreads to worries about the high debt and the rising risk aversion (including the fiscal situation and outlook, competitiveness of the Greek economy, reduced economic activity, and downgrading from rating agencies).
The turmoil in liquidity has been concentrated mostly in the bond market of developed countries, which has benefited the debt of those countries in relation to that of Greece. During the period of widening yield spreads that were observed in the years under review, both the credit risk premium and the liquidity premium have contributed to the recent further widening of bond yield spreads versus the government bonds of developed countries. Finally, we contribute to the empirical literature by highlighting basic CDS deviations in the context of the Greek debt crisis. In addition, this study addresses the presence of asymmetries in sovereign risk via a multifractal investigation of CDS spreads.
Limitations of the study may be in the experimental setup for measuring the fluctuations, as well as in the finite available data in some cases; the original fluctuations may be affected by some trends.
This research contributes to the existing literature in two ways. Firstly, this study is one of the first to address the presence of asymmetries in sovereign risk pluralistic investigation of CDS spreads between the spreads of Greece and most of the G7 countries’ (Germany, USA, UK, Canada, Japan) CDS during a very volatile period using multifractal detrended fluctuation analysis (MF-DFA) to find herding, bubble, and long memory traits. Secondly, unlike several earlier studies focused on the CDS spreads, the current study investigates a variety of tenures of these CDSs (1 year, 2 years, 3 years, 5 years, 7 years, 10 years, 20 years, and 30 years).
Motivated by the rapid widening of CDS spreads, we seek to answer three main research questions: (1) Why did investors make a discrimination between the asset-classes of developed countries (Germany, USA, UK, Canada, Japan) and emerging countries (Greece), providing a distinct indication of flight-to-quality behavior? (2) Are developed countries (Germany, USA, UK, Canada, Japan) and Greek CDSs highly predictable? (3) Do the countries examined and Greece’s CDSs follow the same pattern during the Greek debt crisis?
2. Data and Methodology
The period of our study ranges from 2012 to 2022, capturing the Greek sovereign credit event that impacted the credit default swap, the Greek referendum, the bailouts, and the Brexit referendum. Prospects for a restructuring of the Greek debt gave rise to strong fears of an amplification of systemic risk. We have taken into consideration 2587 daily observations for each of the 48 CDS spreads (eight apiece, for Germany, USA, UK, Canada, Japan, and Greece) starting from 22 August 2012 to 21 July 2022 (Source: Bloomberg). We therefore examined the CDS spreads starting from 22 August 2012 to 21 July 2022 (Source: Bloomberg). Hence, a total of 124,176 data points were under consideration across eight annual categories of HR SNR CR (Greece), FRG SNR CR (Germany), CAN SNR CR (Canada), USA SNR CR (USA), JPN SNR CR (Japan), and UK SNR CR (UK). The tenure of these CDSs were 1 year, 2 years, 3 years, 5 years, 7 years, 10 years, 20 years, and 30 years. All spreads were Euro-denominated. We have used multifractal detrended fluctuation analysis (MF-DFA) for finding H(q) value, where ‘H’ is the Hurst Exponent and ‘q’ is the order [34,35]. We have used Espen Ihlen’s algorithm in MATLAB 13 [36].
We have used MFDFA and FIGARCH to test persistence in CDS spreads for various tenures. This approach is named as a pluralistic approach as two completely different methodologies were deployed for the quest of persistence, herding and long-range dependence. Therefore, we can accept the outcome with conviction provided the results are consistent across the approaches. Recent studies on the long-range dependence of volatility indices too have taken such pluralistic approaches to good effect [37,38].
Based on data from Mandelbrot’s research [39], scaling exponents are both unique in nature and time dependent. Hence, the monofractal method was never total proof for it could depict an incorrect narrative. Asset prices such as CDSs have multiple dimensions that further increase their complexity. That is why multifractal analysis is preferred over monofractal. CDS spread, alike other financial time series, are stochastic in nature. The power–law relationship and the persistent pattern in most cases were two important facets of such time series [39]. He went on to say that asset prices in such cases are far from normal. Moreover, it tends to obey the Lévy stable condition; in other words, α range from 0 to 2, where α = 2 satisfies the condition for the Gaussian distribution. Thus, he reformulated the “Rescaled Range Analysis” (R/S) proposed by Hurst back in 1951. The Hurst exponent express H = 1/α; when α = 2, it becomes stochastic or, in other words, it follows the Brownian motion. The legacy of ‘Fractals’ were further investigated by a group of researchers [40] who constructed the mathematical formulae to measure the impact of multifractality in a noisy time series. Time series with consistent noises can be transformed into ‘random walk’ series by subtracting the mean value [36]. Ref. [36] integrated it further: According to his calculation procedure, the calculation for the root mean square variation (RMS) is crucial. The RMS values were calculated for the localized areas with clear patterns or trends. Finally, all these RMS were summarized. These RMS samples usually exhibit their ‘power law’ characteristics. In a technical way this process is termed as Detrended Fluctuation Analysis (DFA). The exponent for this relation is the ‘Hurst Exponent’ [41,42]. [36] extended this calculation until the qth-order, which became MF-DFA or multifractal detrended fluctuation analysis. The multifractal power law has more than one exponent. The Hurst Exponent and Fractal Dimensions change from monofractal to multifractal, with the latter being more reliable (Mandelbrot et al.,1997) [39]. Since our data points were 2587 for each CDS, we altered the segments and scale in the MATLAB code as proposed by [36]. We used segment = 4 (instead of 8) and scale = 300 (instead of 1000), since length = 2587 (unlike Ihlen’s code with 8000). In the first loop, a sample of 1–300 will be taken. In the second loop, samples 301–600 will be considered; the third loop considers samples 601–900 and the fourth loop considers samples 901–2587. A polynomial trend fit will happen in each segment (loop). Quadratic and cubic polynomials are used in this code. We have values for the fifth order (q = 5) Hurst Exponent and considered it for interpretations as suggested by Kantelhardt [43] see (Table 1).
Furthermore, we deploy a FIGARCH model, considering conditional heteroscedasticity, to reveal evidence of long memory across these CDS spreads. FIGARCH is different from ARCH, however, for it allows for long memory in the conditional variance. It has to be noted that it is preferred over Autoregressive Fractionally Integrated Moving Average (ARFIMA) models as it can detect mean-reverting long memory or the true form of long-range dependence. Usually, financial time series have d = 1 (fractional integrating parameter), which is consistent for log closing prices of various asset classes. Moreover, it is in harmony with the efficient market hypothesis (EMH), which confirms that closing levels of asset classes are strictly martingales and log returns are martingale differences (usually first difference). To elaborate further, we may add that martingales are sequences of random variables with the future expectation equaling the present value. Additionally, the squared returns typically carry a fractional value of d.
If we consider a time series, such as the first level difference of the CDS spreads:
where is a serially uncorrelated process with zero-mean and unit variance; is a time-varying measurable function with respect to the information set available at time t − 1 (); and is the time dependent conditional variance of . The FIGARCH model of [44] is given by:
where, is the fractional differential (long memory) parameter; L is the lag operator; β(L) is a finite order lag polynomial with the roots assumed to be situated outside the unit circle; and represents the autoregressive coefficient of an ARFIMA (1,d,0) model. The FIGARCH model does not reach a constant level quickly, it takes iterations. Furthermore, it is reduced to a standard GARCH when d = 0 and to an integrated GARCH (IGARCH) when d = 1.
3. Empirical Results
We came across some interesting findings in the fifth series of the Hurst exponent analysis presented in Table 2, Table 3, Table 4, Table 5, Table 6 and Table 7. Interestingly, both the MFDFA approach and FIGARH approach yielded similar outcome in all the observations. The CDS spreads of developed countries (Germany, USA, UK, Canada, Japan) are persistent across categories. This confirms herd, bubble, and long-range dependence. On the other hand, the Greek CDS spreads are anti-persistent across categories. There are no traces of herd, bubble, and long-range dependence. However, in all cases, the Hurst exponent increases with the tenure of the CDSs (from 0.400 to 0.488 for the Greek CDS and from 0.689 to 1.000 for the CDSs of developed countries). For instance, the change in the Hurst exponent for Greek CDS spreads is 22% across categories, whereas the same for its German counterpart is around 21%. This suggests a significant arbitrage opportunity for both CDS spreads. Usually, the ‘Absence-of-Arbitrage’ is the assumption behind derivatives. CDSs are no exception. However, in reality, persistent arbitrage does exist.
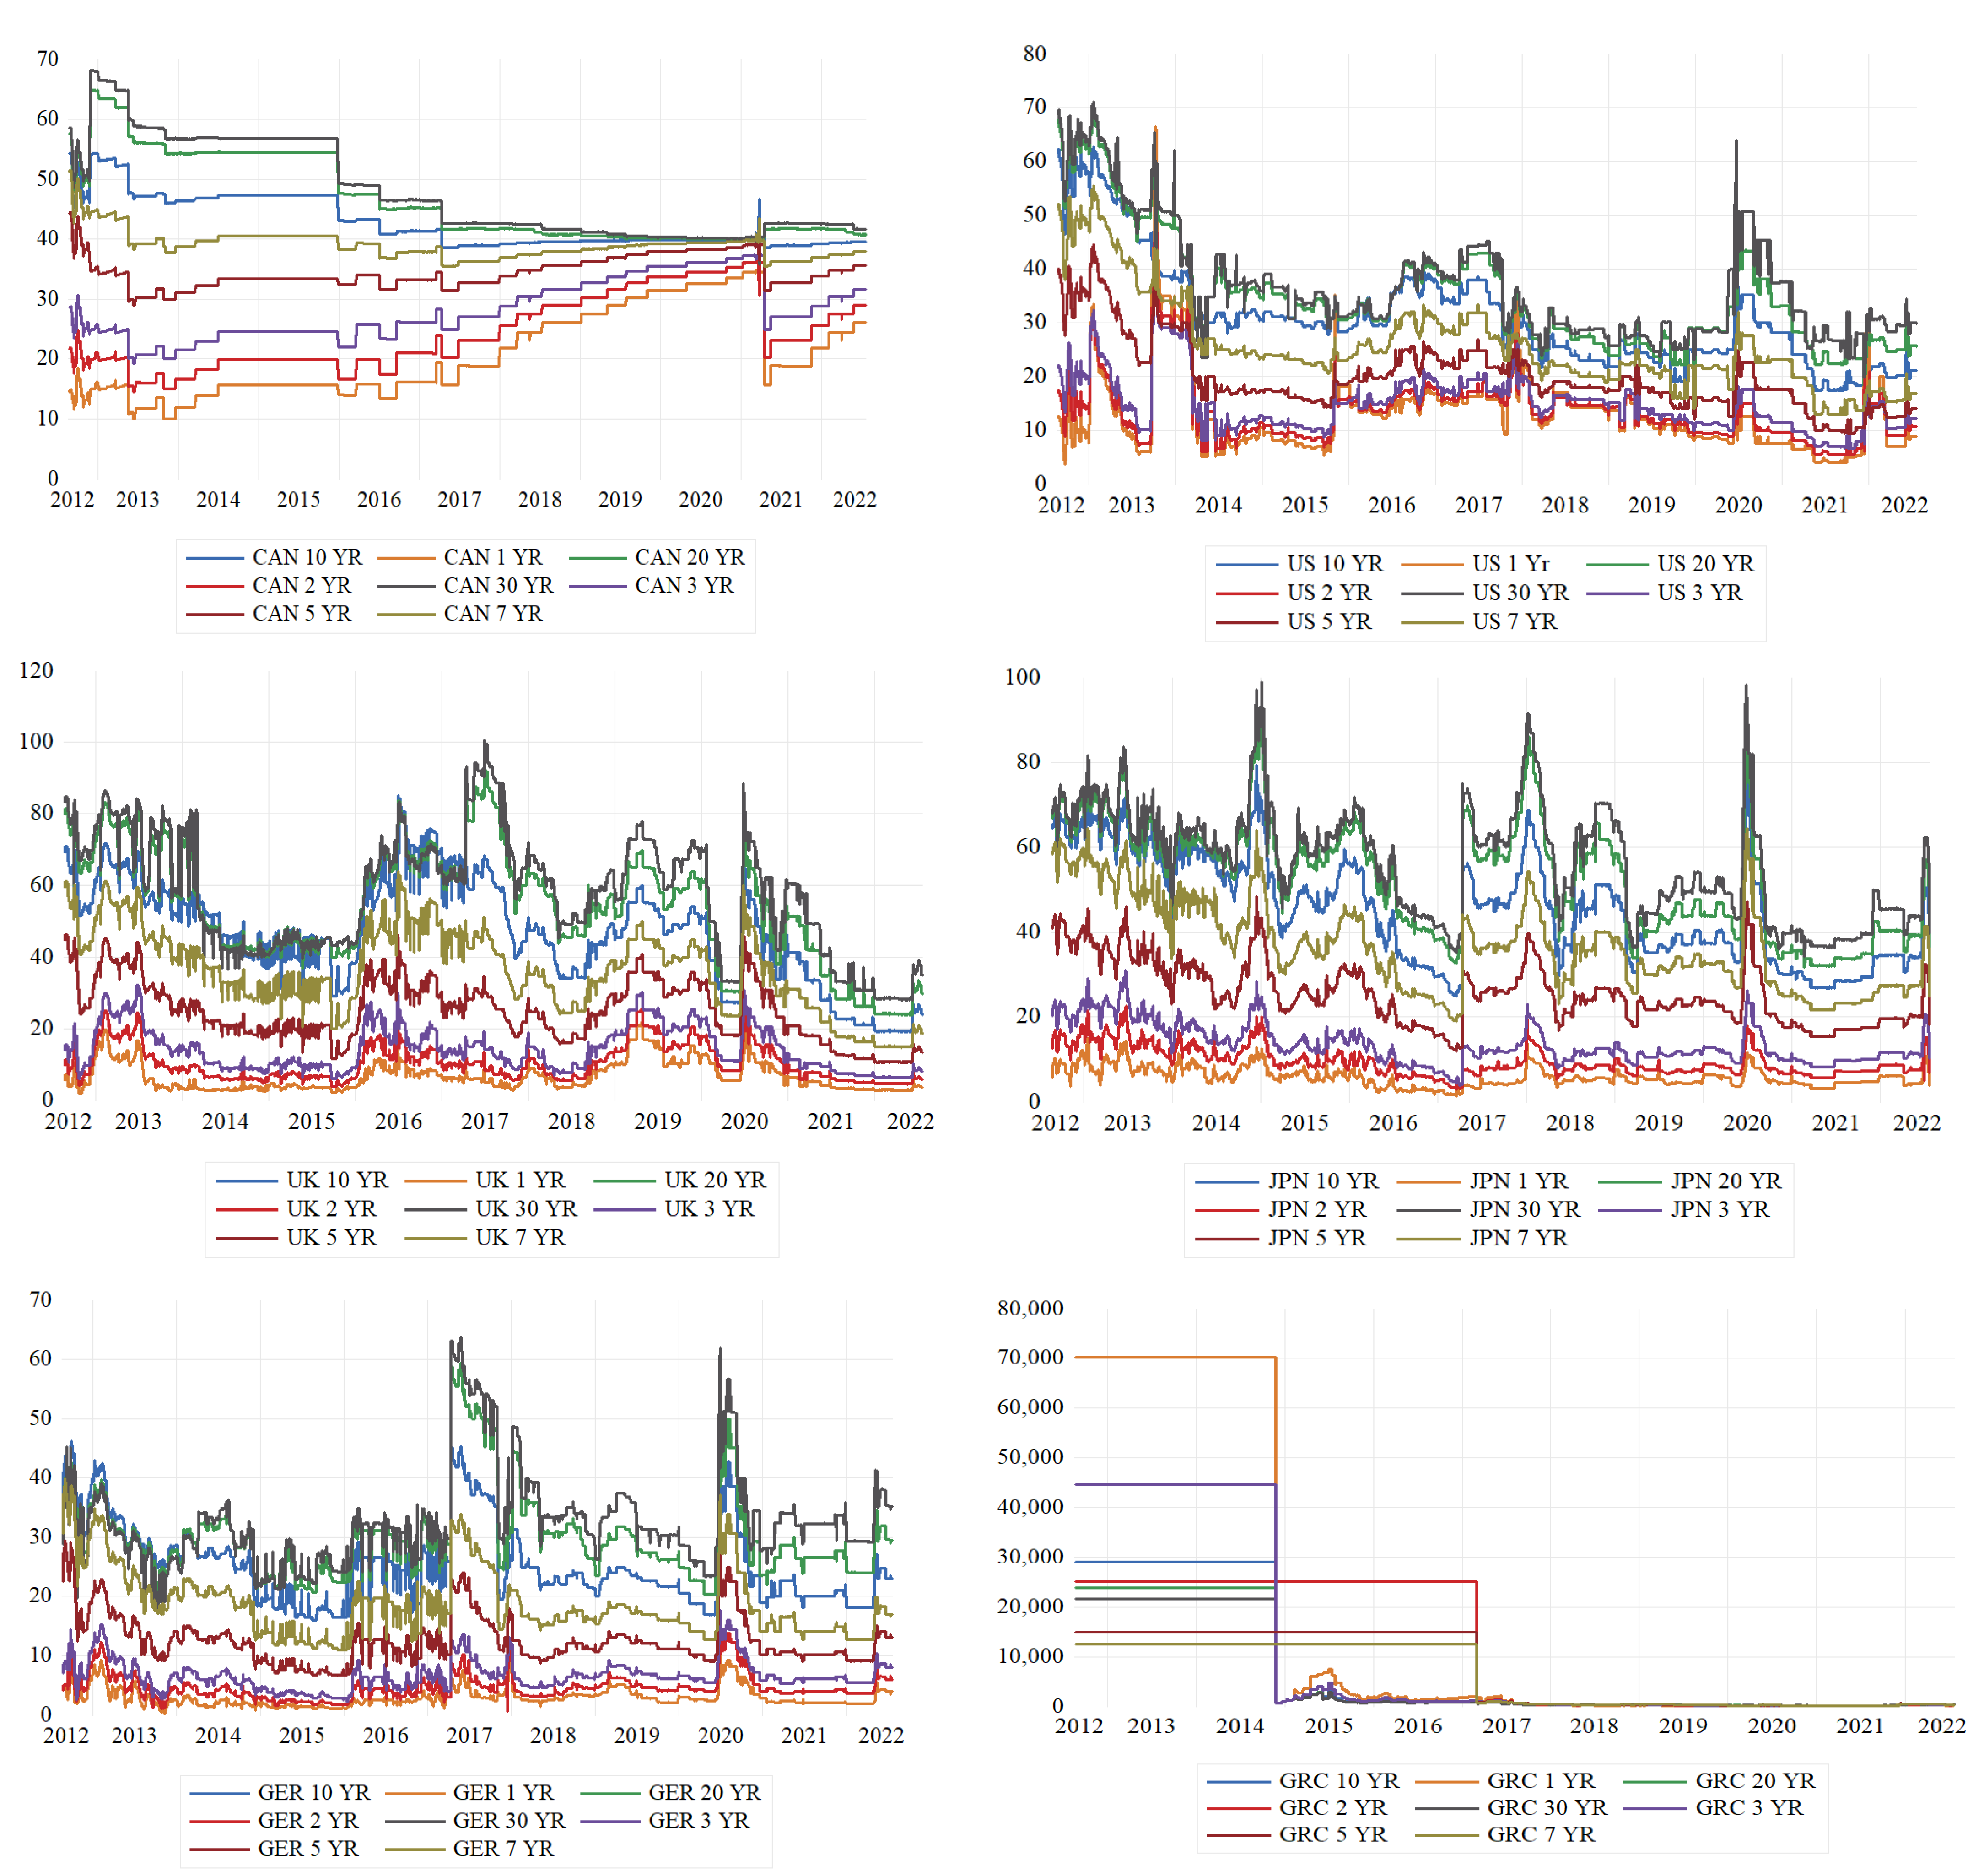
Developed countries (Germany, USA, UK, Canada, Japan) benefited, more or less, from the Greek crisis. The CDS spreads went up gradually in all the different tenures. Longer term spreads went up faster than their shorter-term counterparts. Money chased after less uncertain markets, which makes sense seeing similar patterns in most of the developed countries. This formed the persistent pattern. Technically speaking, the statistical dependence between two points of events that show signs of exaggeration weakens at first slowly and then exponentially. This pushes the Hurst exponent to a substantially higher level. On the other hand, Greek CDS spreads witnessed a binary plot, which means it is stochastic. Hence, the Hurst exponent is lower than the Brownian motion cut-off of 0.5. Greek CDS behavior was well described as “investor inertia” [45]. A large period of inactivity is followed by a sudden change of the pattern and bursts of activities. Under such uncertain situations, investor inactivity is quite understandable. In Figure 1, scatter plots of the CDS spreads are illustrated for each market.
4. Conclusions
By using a multifractal detrended fluctuation (MFDFA) and fractionally integrated GARCH (FIGARCH) analysis during the Greek debt crisis, we showed that the examined CDS spreads of developed countries were persistent across categories, confirming herd, bubble, and long-range dependence. On the other hand, Greek CDS spreads were anti-persistent across categories, implying the absence of herd, bubble, and long-range dependence traces. The differences in the change of the Hurst exponent between the CDS spreads of developed countries suggest a better arbitrage opportunity for the CDS spreads of the developed countries examined herein. Financial assets across the globe chased safer havens. The developed countries under consideration herein received consistent inflows (including Germany) forming their resilience and long-range dependence on various CDS categories.
This analysis illustrates how investors discriminated between two totally different categories in terms of debt and countries, providing a distinct indication of flight-to-quality behavior on the part of investors that was interpreted as reflecting an increased discrimination among investors with respect to their flight-to-quality destinations. The asset classes of the developed countries (Germany, USA, UK, Canada, Japan) examined, seemed to be preferred by investors during these years. However, the dispersion among issuing countries remained.
The results of the study have particular significance for maintaining the financial stability and highlighting risk contagion among markets. Therefore, it showed that global investors fully differentiate the meaning between an emerging market—such as Greece—and developed markets—such as Germany, USA, UK, Canada, and Japan—and do not consider them as a single sovereign risk, in terms of globalization. These findings can have varied effects on investors wishing to differentiate their portfolios. At the same time, they puzzle all the policy makers. In our analysis on CDSs, we also found very little discernible direct impact of the Greek credit event on the examined CDS market. This probably confirms that the Greek credit event had been well-anticipated.
The empirical evidence presented in this study has relevant implications for CDS market participants. For example, investors, speculators, and arbitrageurs may use their better understanding of the existence of asymmetries in the link between CDS spreads among the examined countries in order to improve their asset allocation, portfolio diversification, credit risk management, and trading decisions. In addition, the measures adopted by policy makers aimed at minimizing any destabilizing effects of crises in the financial system during turbulent times might also be different depending on the expected sign of changes in major risk factors [46].
The results of this paper show that there is an asymmetry in the impact of shocks to sovereign credit spreads of peripheral countries (Greece) from other countries when shocks are pervasive, i.e., they affect larger countries or multiple countries. This asymmetry is consistent with markets believing that adverse effects of shocks to sovereign credit spreads from peripheral countries would bring about policy responses offsetting the impact of these shocks, which would lessen the risk of holding sovereign bonds from peripheral countries. In addition, important policy implications emerge in relation to the future role of the ECB. There is a clear distinction among countries marked by the crisis, providing further support to the hypothesis that a symmetric shock may have long-run asymmetric consequences even in the presence of a common ECB strategy to face any crisis.
Author Contributions
Conceptualization, B.G.; methodology, B.G.; software, B.G.; validation, B.G. and S.P.; formal analysis, B.G.; investigation, B.G. and D.K.; resources, B.G.; data curation, B.G.; writing—original draft preparation, B.G. and S.P.; writing—review and editing, S.P. and D.K.; visualization, B.G. and D.K.; supervision, B.G. and S.P.; project administration, B.G., S.P. and D.K. All authors have read and agreed to the published version of the manuscript.
Funding
This research received no external funding.
Institutional Review Board Statement
Not applicable.
Informed Consent Statement
Not applicable.
Data Availability Statement
Not applicable.
Conflicts of Interest
The authors declare no conflict of interest.
References
- Greatrex, C.A. Credit Default Swap Market Determinants. J. Fixed Income 2009, 18, 18–32. [Google Scholar] [CrossRef]
- Tang, D.Y.; Yan, H. Understanding Transactions Prices in the Credit Default Swaps Market. J. Financ. Mark. 2017, 32, 1–27. [Google Scholar] [CrossRef]
- Fontana, A.; Scheicher, M. An analysis of euro area sovereign CDS and their relation with government bonds. J. Bank. Financ. 2016, 62, 126–140. [Google Scholar] [CrossRef]
- Pur, L.D.; Galil, K.; Rosenboim, M. The dynamics of sovereign yields over swap rates in the Eurozone market. Int. Rev. Financ. Anal. 2020, 72, 101578. [Google Scholar] [CrossRef]
- Samitas, A.; Papathanasiou, S.; Koutsokostas, D.; Kampouris, I. Are Timber and Water Investments Safe-Havens? A Volatility Spillover Approach and Portfolio Hedging Strategies for Investors. Financ. Res. Lett. 2022, 47, 102657. [Google Scholar] [CrossRef]
- Papathanasiou, S.; Dokas, I.; Koutsokostas, D. Value investing versus other investment strategies: A volatility spillover approach and portfolio hedging strategies for investors. North Am. J. Econ. Financ. 2022, 62, 101764. [Google Scholar] [CrossRef]
- Ghosh, B.; Papathanasiou, S.; Dar, V.; Gravas, K. Bubble in Carbon Credits during COVID-19: Financial Instability or Positive Impact (“Minsky” or “Social”)? J. Risk Financ. Manag. 2022, 15, 367. [Google Scholar] [CrossRef]
- Hermosillo, B.G.; Johnson, C. Transmission of financial stress in Europe: The pivotal role of Italy and Spain, but not Greece. J. Econ. Bus. 2017, 90, 49–64. [Google Scholar] [CrossRef]
- Arce, O.; Mayordomo, S.; Peña, J.I. Credit-risk valuation in the sovereign CDS and bonds markets: Evidence from the euro area crisis. J. Int. Money Financ. 2013, 35, 124–145. [Google Scholar] [CrossRef] [Green Version]
- Philippas, D.; Philippas, N.; Tziogkidis, P.; Rjiba, H. Signal-herding in cryptocurrencies. J. Int. Financ. Mark. Inst. Money 2020, 65, 101191. [Google Scholar] [CrossRef]
- Feng, Q.; Sun, X.; Liu, C.; Li, J. Spillovers between sovereign CDS and exchange rate markets: The role of market fear. N. Am. J. Econ. Financ. 2020, 55, 101308. [Google Scholar] [CrossRef]
- Castellanos, J.; Constantinou, N.; Ng, W.L. The signaling properties of the shape of the credit default swap term structure. J. Risk 2015, 17, 71–99. [Google Scholar] [CrossRef]
- Kariofyllas, S.; Philippas, D.; Siriopoulos, C. Cognitive biases in investors’ behaviour under stress: Evidence from the London Stock Exchange. Int. Rev. Financ. Anal. 2017, 54, 54–62. [Google Scholar] [CrossRef]
- Gündüz, Y.; Kaya, O. Impacts of the financial crisis on eurozone sovereign CDS spreads. J. Int. Money Financ. 2014, 49, 425–442. [Google Scholar] [CrossRef]
- Koutsokostas, D.; Papathanasiou, S. Mutual funds in Greece: Case study of domestic equity mutual funds during financial crisis. Manag. Financ. 2017, 43, 812–827. [Google Scholar] [CrossRef]
- Samitas, A.; Papathanasiou, S.; Koutsokostas, D.; Kampouris, I. Volatility Spillovers between Fine Wine and Major Global Markets during COVID-19: A Portfolio Hedging Strategy for Investors. Int. Rev. Econ. Financ. 2022, 78, 629–642. [Google Scholar] [CrossRef]
- Tsagkanos, A.; Siriopoulos, C. Stock markets and industrial production in north and south of Euro-zone: Asymmetric effects via threshold cointegration approach. J. Econ. Asymmetries 2015, 12, 162–172. [Google Scholar] [CrossRef]
- Huang, W.L.; Tsai, I.C.; Lin, W.Y. Economic policy uncertainty, investors’ attention and US real estate investment trusts’ herding behaviors. J. Risk 2020, 22, 35–63. [Google Scholar] [CrossRef]
- Papathanasiou, S.; Vasiliou, D.; Magoutas, A.; Koutsokostas, D. Do Hedge and Merger Arbitrage Funds Actually Hedge? A Time-Varying Volatility Spillover Approach. Financ. Res. Lett. 2021, 44, 102088. [Google Scholar] [CrossRef]
- Lin, W.Y.; Wu, M.H.; Chen, M.C. Asymmetry herding behavior of real estate investment trusts: Evidence from information demand. J. Risk 2018, 21, 99–137. [Google Scholar] [CrossRef]
- Koutsokostas, D.; Papathanasiou, S.; Balios, D. Adjusting for risk factors in mutual fund performance and performance persistence. J. Risk Financ. 2019, 20, 352–369. [Google Scholar] [CrossRef]
- Ho, S.H. Long and short-runs determinants of the sovereign CDS spread in emerging countries. Res. Int. Bus. Financ. 2016, 36, 579–590. [Google Scholar] [CrossRef]
- Blommestein, H.; Eijffinger, S.; Qian, Z. Regime-dependent determinants of Euro area sovereign CDS spreads. J. Financ. Stab. 2016, 22, 10–21. [Google Scholar] [CrossRef]
- Martínez, F.M.; Granero, S.M.A.; Torrecillas, M.J.; Mckelvey, B. A Comparison of Three Hurst Exponent Approaches to Predict Nascent Bubbles in S & P500 Stocks. Fractals 2017, 25, 1750006. [Google Scholar] [CrossRef] [Green Version]
- Günay, S.; Shi, Y. Long-memory in volatilities of CDS spreads: Evidences from the emerging markets. Rom. J. Econ. Forecast. 2016, 19, 122–137. [Google Scholar]
- Ghosh, B.; Papathanasiou, S.; Ramchandani, N.; Kenourgios, D. Diagnosis and prediction of IIGPS’ countries bubble crashes during BREXIT. Mathematics 2021, 9, 1003. [Google Scholar] [CrossRef]
- Ghosh, B.; Papathanasiou, S.; Dar, V.; Kenourgios, D. Deconstruction of the Green Bubble during COVID-19 International Evidence. Sustain. Spec. Issue Creat. Econ. Sustain. Dev. 2022, 14, 3466. [Google Scholar] [CrossRef]
- Diebold, F.X.; Inoue, A. Long Memory and Regime Switching. J. Econom. 2000, 105, 131–159. [Google Scholar] [CrossRef] [Green Version]
- Peters, E.E. Fractal Structure in the Capital Markets. Financ. Anal. J. 1989, 45, 32–37. [Google Scholar] [CrossRef]
- Dajcman, S. Time-varying long-range dependence in stock market returns and financial market disruptions—A case of eight European countries. Appl. Econ. Lett. 2012, 19, 953–957. [Google Scholar] [CrossRef]
- Dany, G.; Gropp, R.E.; Littke, H.; Von Schweinitz, G. Germany’s Benefit from the Greek Crisis, IWH Online, No. 7 Halle Institute for Economic Research (IWH). 2015. Available online: https://www.econstor.eu/bitstream/10419/142208/1/io_2015-07.pdf (accessed on 20 September 2022).
- Konstantaras, K.; Philippas, D.; Siriopoulos, C. Trade asymmetries in the Mediterranean basin. J. Econ. Asymmetries 2018, 17, 13–20. [Google Scholar] [CrossRef]
- Dragomirescu-Gaina, C.; Philippas, D. Is the EMU government bond market a playground for asymmetries? J. Econ. Asymmetries 2013, 10, 21–31. [Google Scholar] [CrossRef]
- Ramos-Requena, J.P.; Trinidad-Segovia, J.E.; Sánchez-Granero, M.A. Introducing Hurst exponent in pair trading. Phys. A Stat. Mech. Its Appl. 2017, 488, 39–45. [Google Scholar] [CrossRef]
- Morales, R.; Di Matteo, T.; Gramatica, R.; Aste, T. Dynamical generalized Hurst exponent as a tool to monitor unstable periods in financial time series. Phys. A Stat. Mech. Its Appl. 2012, 391, 3180–3189. [Google Scholar] [CrossRef] [Green Version]
- Ihlen, E.A.F. Introduction to multifractal detrended fluctuation analysis in matlab. Front. Physiol. 2012, 3, 141. [Google Scholar] [CrossRef] [PubMed] [Green Version]
- Ghosh, B.; Bouri, E. Is Bitcoin’s Carbon Footprint Persistent? Multifractal Evidence and Policy Implications. Entropy 2022, 24, 647. [Google Scholar] [CrossRef]
- Ghosh, B.; Bouri, E. Long memory and fractality in the universe of volatility indices. Complexity 2022, 22, 6728432. [Google Scholar] [CrossRef]
- Mandelbrot, B.B.; Fisher, A.; Calvet, L. A Multifractal Model of Asset Returns, Working Papers—Yale School of Management’s Economics Research Network. 1997. Available online: https://users.math.yale.edu/~bbm3/web_pdfs/Cowles1164.pdf (accessed on 20 September 2022).
- Kantelhardt, J.W.; Zschiegner, S.A.; Koschielny-Bunde, E.S.; Havlin, A.; Bunde, H.E.S. Multi-fractal detrended fluctuation analysis of nonstationary time series. Phys. A 2002, 316, 87–114. [Google Scholar] [CrossRef] [Green Version]
- Hurst, H. Long-term storage capacity of reservoirs. Trans. Am. Soc. Civ. Eng. 1951, 116, 770–799. Available online: https://ascelibrary.org/doi/10.1061/TACEAT.0006518 (accessed on 20 September 2022). [CrossRef]
- Watkins, N.W.; Franzke, C. A brief history of long memory: Hurst, Mandelbrot and the road to Road to ARFIMA, 1951–1980. Entropy 2017, 19, 437. [Google Scholar] [CrossRef] [Green Version]
- Kantelhardt, J.W. Fractal and Multifractal Time Series. 2008, pp. 1–59. Available online: http://arxiv.org/abs/0804.0747 (accessed on 20 September 2022).
- Baillie, R.; Bollerslev, T.; Mikkelsen, H.O. Fractionally integrated generalized autoregressive conditional hetero-scedasticity. J. Econom. 1996, 74, 3–30. [Google Scholar] [CrossRef]
- Cont, R. Long range dependence in financial markets. In Fractals in Engineering: New Trends in Theory and Applications; Springer: London, UK, 2005. [Google Scholar] [CrossRef] [Green Version]
- Papathanasiou, S.; Koutsokostas, D.; Pergeris, G. Novel alternative assets within a transmission mechanism of volatility spillovers: The role of SPACs. Financ. Res. Lett. 2021, 47, 102602. [Google Scholar] [CrossRef]
Figure 1.
Plots of CDS spreads. Note: In the figure above, the plots of CDS spreads are displayed for the period from 22 August 2012 to 21 July 2022. All data were obtained from Bloomberg and Thomson Reuters Data Stream.
Figure 1.
Plots of CDS spreads. Note: In the figure above, the plots of CDS spreads are displayed for the period from 22 August 2012 to 21 July 2022. All data were obtained from Bloomberg and Thomson Reuters Data Stream.


Table 1.
Zone of the Hurst exponent interpretation.
| HE < 0.5 Anti-persistent, no shape, no herd behavior, fractal quotient is lesser |
| HE = 0.5 Follows theoretical random walk, entirely stochastic in nature |
| HE > 0.5 Evidently persistent, clear shape, trace of herd behavior, fractal quotient is higher |
Table 2.
Fifth order Hurst exponent analysis for Hellenic CDS spreads (Greece).
| CDS | Tenure (Years) | LRD * | d-MFDFA | Hq MFDFA | d-FIGARCH | Hq FIGARCH |
|---|---|---|---|---|---|---|
| HR SNR CR | 1 | No | −0.0672 | 0.4328 | −0.0810 | 0.4190 |
| HR SNR CR | 2 | No | −0.0361 | 0.4639 | −0.0250 | 0.4750 |
| HR SNR CR | 3 | No | −0.0716 | 0.4284 | −0.0998 | 0.4002 |
| HR SNR CR | 5 | No | −0.0998 | 0.4002 | −0.0248 | 0.4752 |
| HR SNR CR | 7 | No | −0.0697 | 0.4303 | −0.0407 | 0.4593 |
| HR SNR CR | 10 | No | −0.0571 | 0.4429 | −0.1000 | 0.4000 |
| HR SNR CR | 20 | No | −0.0868 | 0.4132 | −0.0867 | 0.4133 |
| HR SNR CR | 30 | No | −0.0117 | 0.4883 | −0.0135 | 0.4865 |
Note: In the table above, we cannot see persistence in Greek CDS spreads across (2587 observations in each tenure) defined categories of CDS. * Long Range Dependence. MFDFA and FIGARCH results are broadly consistent.
Table 3.
Fifth order Hurst exponent analysis for Germany’s CDS spreads.
| CDS | Tenure (Years) | LRD * | d-MFDFA | Hq MFDFA | d-FIGARCH | Hq FIGARCH |
|---|---|---|---|---|---|---|
| FRG SNR CR | 1 | Yes | 0.3800 | 0.8800 | 0.4001 | 0.9001 |
| FRG SNR CR | 2 | Yes | 0.4023 | 0.9023 | 0.4222 | 0.9222 |
| FRG SNR CR | 3 | Yes | 0.3270 | 0.8270 | 0.4869 | 0.9869 |
| FRG SNR CR | 5 | Yes | 0.3478 | 0.8478 | 0.4722 | 0.9722 |
| FRG SNR CR | 7 | Yes | 0.4556 | 0.9556 | 0.5000 | 1.0000 |
| FRG SNR CR | 10 | Yes | 0.4461 | 0.9461 | 0.4455 | 0.9455 |
| FRG SNR CR | 20 | Yes | 0.4011 | 0.9011 | 0.4304 | 0.9304 |
| FRG SNR CR | 30 | Yes | 0.4764 | 0.9764 | 0.4788 | 0.9788 |
Note: In the table above, we can see continuous persistence in Germany’s CDS spreads across (2587 observations in each tenure) defined categories of CDS. This indicates long range dependence or long memory. * Long Range Dependence. MFDFA and FIGARCH results are extremely consistent.
Table 4.
Fifth order Hurst exponent analysis for Japanese CDS spreads.
| CDS | Tenure (Years) | LRD * | d-MFDFA | Hq MFDFA | d-FIGARCH | Hq FIGARCH |
|---|---|---|---|---|---|---|
| JPN SNR CR | 1 | Yes | 0.3146 | 0.8146 | 0.3690 | 0.8690 |
| JPN SNR CR | 2 | Yes | 0.3165 | 0.8165 | 0.3947 | 0.8947 |
| JPN SNR CR | 3 | Yes | 0.3208 | 0.8208 | 0.2797 | 0.7797 |
| JPN SNR CR | 5 | Yes | 0.2936 | 0.7936 | 0.2330 | 0.7330 |
| JPN SNR CR | 7 | Yes | 0.3220 | 0.8220 | 0.4000 | 0.9000 |
| JPN SNR CR | 10 | Yes | 0.3698 | 0.8698 | 0.3988 | 0.8988 |
| JPN SNR CR | 20 | Yes | 0.3956 | 0.8956 | 0.4048 | 0.9048 |
| JPN SNR CR | 30 | Yes | 0.4204 | 0.9204 | 0.4388 | 0.9388 |
Note: In the table above, we can see continuous persistence in Japanese CDS spreads across (2587 observations in each tenure) defined categories of CDS. This indicates long range dependence or long memory. * Long Range Dependence. MFDFA and FIGARCH results are extremely consistent.
Table 5.
Fifth order Hurst exponent analysis for USA’s CDS spreads.
| CDS | Tenure (Years) | LRD * | d-MFDFA | Hq MFDFA | d-FIGARCH | Hq FIGARCH |
|---|---|---|---|---|---|---|
| USA SNR CR | 1 | Yes | 0.1893 | 0.6893 | 0.1999 | 0.6999 |
| USA SNR CR | 2 | Yes | 0.2134 | 0.7134 | 0.2321 | 0.7321 |
| USA SNR CR | 3 | Yes | 0.3202 | 0.8202 | 0.3192 | 0.8192 |
| USA SNR CR | 5 | Yes | 0.2473 | 0.7473 | 0.2567 | 0.7567 |
| USA SNR CR | 7 | Yes | 0.3321 | 0.8321 | 0.3432 | 0.8432 |
| USA SNR CR | 10 | Yes | 0.3637 | 0.8637 | 0.3854 | 0.8854 |
| USA SNR CR | 20 | Yes | 0.4470 | 0.9470 | 0.4102 | 0.9102 |
| USA SNR CR | 30 | Yes | 0.4122 | 0.9122 | 0.3861 | 0.8861 |
Note: In the table above, we can see continuous persistence in USA’s CDS spreads across (2587 observations in each tenure) defined categories of CDS. This indicates long range dependence or long memory. * Long Range Dependence. MFDFA and FIGARCH results are extremely consistent.
Table 6.
Fifth order Hurst exponent analysis for Canadian CDS spreads.
| CDS | Tenure (Years) | LRD * | d-MFDFA | Hq MFDFA | d-FIGARCH | Hq FIGARCH |
|---|---|---|---|---|---|---|
| CAN SNR CR | 1 | Yes | 0.4173 | 0.9173 | 0.4612 | 0.9612 |
| CAN SNR CR | 2 | Yes | 0.4644 | 0.9644 | 0.4983 | 0.9983 |
| CAN SNR CR | 3 | Yes | 0.4435 | 0.9435 | 0.4433 | 0.9433 |
| CAN SNR CR | 5 | Yes | 0.4544 | 0.9544 | 0.4766 | 0.9766 |
| CAN SNR CR | 7 | Yes | 0.4961 | 0.9961 | 0.4455 | 0.9455 |
| CAN SNR CR | 10 | Yes | 0.4994 | 0.9994 | 0.4973 | 0.9973 |
| CAN SNR CR | 20 | Yes | 0.5000 | 1.0000 | 0.4932 | 0.9932 |
| CAN SNR CR | 30 | Yes | 0.4844 | 0.9844 | 0.4863 | 0.9863 |
Note: In the table above, we can see continuous persistence in Canadian CDS spreads across (2587 observations in each tenure) defined categories of CDS. This indicates long range dependence or long memory. * Long Range Dependence. MFDFA and FIGARCH results are extremely consistent.
Table 7.
Fifth order Hurst exponent analysis for UK’s CDS spreads.
| CDS | Tenure (Years) | LRD * | d-MFDFA | Hq MFDFA | d-FIGARCH | Hq FIGARCH |
|---|---|---|---|---|---|---|
| UK SNR CR | 1 | Yes | 0.4671 | 0.9671 | 0.4220 | 0.9220 |
| UK SNR CR | 2 | Yes | 0.4667 | 0.9667 | 0.4071 | 0.9071 |
| UK SNR CR | 3 | Yes | 0.4456 | 0.9456 | 0.4303 | 0.9303 |
| UK SNR CR | 5 | Yes | 0.4542 | 0.9542 | 0.4473 | 0.9473 |
| UK SNR CR | 7 | Yes | 0.4321 | 0.9321 | 0.4052 | 0.9052 |
| UK SNR CR | 10 | Yes | 0.4350 | 0.9350 | 0.4141 | 0.9141 |
| UK SNR CR | 20 | Yes | 0.4330 | 0.9330 | 0.4109 | 0.9109 |
| UK SNR CR | 30 | Yes | 0.4224 | 0.9224 | 0.4261 | 0.9261 |
Note: In the table above, we can see continuous persistence in UK’s CDS spreads across (2587 observations in each tenure) defined categories of CDS. This indicates long range dependence or long memory. * Long Range Dependence. MFDFA and FIGARCH results are extremely consistent.
Publisher’s Note: MDPI stays neutral with regard to jurisdictional claims in published maps and institutional affiliations. |
© 2022 by the authors. Licensee MDPI, Basel, Switzerland. This article is an open access article distributed under the terms and conditions of the Creative Commons Attribution (CC BY) license (https://creativecommons.org/licenses/by/4.0/).
Share and Cite
MDPI and ACS Style
Ghosh, B.; Papathanasiou, S.; Kenourgios, D. Cross-Country Linkages and Asymmetries of Sovereign Risk Pluralistic Investigation of CDS Spreads. Sustainability 2022, 14, 14056. https://0-doi-org.brum.beds.ac.uk/10.3390/su142114056
AMA Style
Ghosh B, Papathanasiou S, Kenourgios D. Cross-Country Linkages and Asymmetries of Sovereign Risk Pluralistic Investigation of CDS Spreads. Sustainability. 2022; 14(21):14056. https://0-doi-org.brum.beds.ac.uk/10.3390/su142114056
Chicago/Turabian StyleGhosh, Bikramaditya, Spyros Papathanasiou, and Dimitrios Kenourgios. 2022. "Cross-Country Linkages and Asymmetries of Sovereign Risk Pluralistic Investigation of CDS Spreads" Sustainability 14, no. 21: 14056. https://0-doi-org.brum.beds.ac.uk/10.3390/su142114056
Note that from the first issue of 2016, this journal uses article numbers instead of page numbers. See further details here.