

Scientific Research of Innovation Ability of Universities in the United States of America and China

1
Postgraduate School, Shanghai University of Electric Power, Shanghai 200090, China
2
School of Education, Zhengzhou University, Zhengzhou 450000, China
3
School of Public Policy and Administration, Xi’an Jiaotong University, Xi’an 710000, China
*
Author to whom correspondence should be addressed.
Sustainability 2022, 14(21), 14586; https://0-doi-org.brum.beds.ac.uk/10.3390/su142114586
Submission received: 9 September 2022
/
Revised: 3 November 2022
/
Accepted: 3 November 2022
/
Published: 6 November 2022
(This article belongs to the Collection Innovative Practices in Education for Sustainability and Their Relation to Evaluation)
Abstract
:A better understanding of the universities’ ability to innovate can assist policymakers in identifying the key strengths and weaknesses and policy changes required to improve a nation’s innovation performance. However, no nation’s innovation system is the same as another due to various factors; thus, each system is unique and must be understood in this context. Hence, this study investigated the innovation ability of universities in the United States of America (US) and China from 1996 to 2021 using the system GMM technique. The findings of the study can be grouped into three themes: (i) research and development funding, the number of researchers engaged in research and development, and the number of colleges and universities influencing the impact of the innovation ability of universities across the countries; (ii) the innovation ability of Chinese universities is converging with that of US universities; thus, the gap between the innovation ability of Chinese and US universities is being narrowed—hence, declining; (iii) the innovation ability of Chinese and US universities improves the level of labor productivity, employment opportunities, and income classification group of the countries.
1. Introduction
Innovation is considered a key driver of growth and a factor in organizational and departmental productivity, efficiency, and competitiveness [1,2]. Many organizations have declared that the ability to improve and enhance innovation and promote innovation is one of the most significant growth factors [3]. Inventions are essential to the private and public sectors and humanity as a whole. Now that innovation is the most reliable tool for changing the past and present, how to manage innovation more effectively and successfully remains a question. Therefore, this question is fundamental in education because it is recognized as the second engine of human progress. In 2014, Forbes released an article about the future of higher education and how it depends on innovation. It is a topic that is more pertinent than ever five years on [4]. Institutions must adjust their economic models and service offerings as higher education grows more expensive and digital technologies become more vital to the educational experience in order to remain relevant to societies, economies, and, most importantly, students [5]. Similarly, educational innovations can be thought of as transformational processes that occur within the educational system, in how individuals learn, or in the learning environment. This process of change may be influenced by external, uncontrollable factors, in addition to being endogenous, or being guided or influenced by the learners themselves (such as students and teachers). While innovation and change are neither inherently good nor bad (since innovation can be both good and bad), teachers, students, and researchers frequently try to steer educational innovation in a desired direction of change, for instance, by making the learning process more effective or efficient. On the other hand, the role of education in the central aspect of environmental sustainability is discussed in a report of the UN system working group on the post-2012 UN development agenda to the UN secretary general [6], entitled “Achieving the Future We Want”, which proposes the development of new attitudes and consumption and production patterns that are supportive of sustainable development by providing the values, abilities, and knowledge required. For people, especially young people, to be prepared for careers that increase sustainability, they must receive the proper technical and vocational education and training. This suggests that if students are given access to an educational setting created to mold the necessary new attitudes and models, education can be effective in promoting sustainable development. Providing such a context calls for significant innovative efforts in development to address educational strategies, methodologies, and tools for the challenges of our rapidly changing world. These efforts must address globalization issues in both industrialized and developing countries, as well as the implementation of educational systems and capacity-building initiatives that integrate the disciplines of social sciences, humanities, natural sciences, and computer sciences.
However, it is nearly impossible to utter the terms “higher education” without mentioning the word “innovation”. Despite popular belief, higher education innovation is not just about staying ahead of the curve; it is also about continuing to be viable and relevant in a world that is becoming more unstable. Additionally, it involves deliberately changing the teaching and learning procedures in order to foster the growth of fresh concepts, increase creativity, foster collaboration, and advance inclusion and diversity, rather than merely disrupting them. Therefore, with higher education standards rising, it is more important than ever for institutions to think outside the box and tap into their creative imaginations.
University traditions and histories will make them resistant to change. Academic staff members within a faculty can build a privileged, frequently figurative vision of the scientific principles established in the academic peer review process, such as academic independence, academic identity, and the character of scientific research. It is well recognized that professional production and the graduation procedure are authoritative [7]. Numerous government funders, business partners, and potential students are now contesting this. One of the fundamental pillars of the historical university has been the creation and spread of knowledge. This is still common in established European university fields and is an area where many universities are excelling more and more. The willingness of the scholar to conduct the research of their choice is the essence of academic freedom. The agents of innovation, however, have the power to create or break the adopted organization because innovation is inherently risky. Thus, universities must adopt innovative ideas and strategies with the same rigor as they do in their research and teaching, yielding students and research bases to those succeeding in this field.
It will be more crucial than ever for universities to set themselves apart from other higher education providers and serve as a hub for research and innovation through the research degree process. Although this position may be at the institution, it is possible that this will not be enough to support them in the future [8]. The value of the Ph.D. itself is also starting to come under scrutiny. When knowledge is applied in a new and creative method to yield new results, research and knowledge production are transformed into innovations. The intellectual property rights accompanying such inventions are valuable to business and the economy. However, innovation must only serve to advance commerce. Furthermore, universities have a significant impact on social innovation. Universities may play a significant role in tackling social challenges by developing a new learning and innovation environment that can be handled across all sectors. Numerous worldwide societal issues seem to be outside the traditional public sector. A significant new factor is how the university views change. New partnerships in academic institutions may view change as a crucial engine of learning, creativity, and progress if universities think they can resist change by building stable environments and then adapting to it in demonstrable ways [9]. In addition, China and the United States are both faced with the challenge of expanding their innovation economies in a way that more people can benefit from them in order to ensure continued economic growth, the innovation ability of universities, research and development, national security, and global influence. Universities and research institutions are now generally acknowledged to have contributed significantly to the growth of numerous high-technology regions in China and the United States of America [10].
Hence, studying the innovation ability of universities in the United States of America and China can inform the development of experimental programs designed to produce better results. Both the US and China will benefit greatly by providing answers to the following questions. Do research and development funding, the number of researchers engaged in research and development, and the number of colleges and universities promote the universities’ innovation ability ranking in the countries? What is the possible connection between the level of labor productivity, employment opportunities, economic classification, and the universities’ innovation ability ranking in the countries? Are Chinese universities catching up with US universities in terms of innovation, since understanding whether China’s economy is innovative is still critical?
The contributions of this study can be observed as follows. First, to the best of the authors’ knowledge, none of the existing studies investigates whether research and development funding, the number of researchers engaged in research and development, and the number of colleges and universities are promoting the universities’ innovation ability ranking in the countries; moreover, the possible connections between the level of labor productivity, employment opportunities, income classification, and the universities’ innovation ability ranking in the countries also remain unexplored. The existing studies are either based on country analysis or not specifically on the universities’ innovation ability ranking but other variables, such as firms’ innovation, and technological innovations, thus only offering a theoretical contribution. Second, it is the ability to empirically examine whether the Chinese universities’ innovation is catching up with that of the US universities. Few studies, if any, empirically assess it between the two competing countries and use up-to-date data, thus offering an empirical contribution. Third, this work is the first, from a methodological perspective, to utilize the system GMM technique to investigate those relations and convergence phenomena, hence offering a methodological contribution. This technique is more efficient and resilient in treating heteroscedasticity and sequence autocorrelation than other techniques. In addition, the superiority of this technique over other techniques is that it ensures less bias and higher precision.
Therefore, this study will be of enormous importance in helping policymakers identify the key strengths and weaknesses and policy changes needed to enhance innovation across the countries. Similarly, it could be helpful to practitioners, analysts, and academics. However, the specific objectives of this study are as follows:
- To examine whether research and development funding, the number of researchers engaged in research and development, and the number of colleges and universities are promoting the universities’ innovation ability ranking in the countries;
- To analyze whether the Chinese universities’ innovation is catching up with the US universities’ innovation; and
- To explore the possible connections between the level of labor productivity, employment opportunities, income classification, and the universities’ innovation ability ranking in the countries.
The rest of the study is organized as follows: literature review, methodology used for achieving the study’s objectives, result presentation, discussion, and lastly, the concluding remarks of the study.
2. Literature Review
The term “innovation theory” in the context of education is used to describe the innovation process that takes place within the educational system, as well as the novelties, activities, and environment that support innovation. Three viewpoints—socioeconomic, psychological, and organizational/regulatory—are taken into consideration when analyzing the innovation process. These elements define the broader environment and circumstances in which innovation takes place, as well as the elements that impede or support that process. The innovation process is also actively controlled rather than accidental. A crucial new management function is incorporating novelties. However, innovation activities are merely a set of procedures followed to offer an innovation process at a specific educational level. The creative exploration of novel concepts and ideas, which occasionally results in them becoming projects with standard adaptation and application requirements, is how novelty in education manifests itself. There are innovations in education, provisioning, and activity-specific management. The teaching innovation theory (innovative educational systems) and innovative learning subcategories of the innovation phenomenon are described below. The goal of teaching the innovation theory is to redesign, improve, and alter the educational system or the specific components, features, and aspects within it (creation of new legal acts, new structures, models, learning paradigms, forms of integrated linkages, etc.). The term “learning” refers to a particular kind of knowledge acquisition, which results from intentional, purposeful, and scientifically sound activities during the educational process. Supportive learning is currently being replaced by innovative learning. This is believed to be the educational system’s response to the shift in both the educational goals and the society into a more advanced stage of development.
The innovation ability of any nation is best understood as being embedded in a national innovation system (NIS), which, as Christopher Freeman defined it, is “the network of public and private sector institutions whose activities and interactions initiate, import, alter, and disperse new technologies” because a nation’s innovation success depends on its national innovation system working efficiently and synergistically [11].
In the US, due to the traditional notion that the private sector will make the best decisions on allocating research and development investments, the US is governed by a federal government system that favors a relatively limited amount of direct public sector support for innovation. Political agreement is required for research funding to be appropriated. R&D expenditures have essentially remained flat over the past ten years as a result of Congress’ refusal to fully support the Obama administration’s budget requests, which was made possible by the “sequestration” policy adopted by the Congress. Since political capacities and obligations are divided among various actors, the federal political system tends to promote a more restricted amount of direct public sector support for innovation. Despite the articulation of a national innovation strategy by the White House, the vast dispersion of authority and influence, as well as the requirement for considerable coordination across government departments, prohibit any one agency from assuming the lead in implementing innovation policy. Changes in political priorities among elected officials may affect the government’s activity in areas where it is most active (funding fundamental research and regulating company behavior) [12].
China’s public sector, which includes government organizations that set research goals and government research and development labs, is deeply involved in all facets of innovation. The presence of state-run banks and state-owned businesses supports its involvement in innovation. Due to a succession of political reforms, the private sector continues to play a growing part in the innovation system, but underdeveloped capital markets limit its position as a financier [12]. Unlike in the US, where political federalism and party competition drive public policy, China’s public policy is shaped by a highly centralized political system dominated by a single party. Because of political unrest in China throughout the first half of the twentieth century, the government could not adopt a comprehensive approach to public policy that encouraged scientific research and technological growth [13]. During the 1950s, the country adopted a Soviet model of central planning after the founding of the people’s republic, which impeded the growth of science and technology talents. It battled through the cultural revolution, which eliminated virtually an entire generation of intellectuals in the 1960s and 1970s. Deng Xiaopeng’s “open door policy” and subsequent market-oriented reforms marked a significant shift in China’s centralization of political power [14]. Over the following three decades, decentralization greatly increased local authority, including that of those in charge of China’s Special Economic Zones (SEZs), while gradual regulatory changes permitted privately owned businesses to increase their involvement in R&D and the creation of new technologies and community-owned township and village enterprises to raise private capital [15]. The majority of China’s R&D is carried out through an integrated network of private firms. In 2015, private firms contributed three-quarters of the USD 211 billion in R&D investments [16].
Despite the fact that wealthier countries were the first to benefit from technical advances, the emerging countries’ participation in the globalization process allowed them to exploit their comparative advantages better and introduce foreign capital, managerial experience, and new technology as innovations [17,18]. The extraordinary capacity of innovation to drive growth can play a critical role in maintaining national competitiveness over the medium to long term, and strengthening the national innovative capacity is critical to ensuring long-term economic growth. However, one of the most commonly used metrics of innovation input is research and development spending (R&D). R&D intensity measures the relative investment in developing new knowledge (R&D expenditure as a proportion of GDP). Some governments have made this statistic a goal to better focus policy decisions and public investment. Another element that determines innovation performance is the number of researchers and institutions in a country [19].
Thus, innovation supports economic growth, or, more simply, innovation can result in increased productivity, which means that the same amount of input results in more output. As a result, more goods and services are created as productivity rises, implying that the economy is expanding. This, in turn, supports the income classification group of an economy. [20]. Likewise, labor productivity is influenced by innovation in a variety of ways. Product innovations are supposed to boost production efficiency by creating new demand and higher value for consumers, whereas process innovations are expected to increase production efficiency [21].
Furthermore, innovation convergence between countries or regions or institutions—for example, examining the innovation convergence between Chinese universities’ innovation and US universities’ innovation—means checking whether the Chinese universities’ innovation is catching up with that of the US universities, since US universities have a higher innovation ability ranking point than Chinese universities’ innovation ability ranking point.
Moreover, empirically, a number of studies have examined innovation ability in relation to other variables or phenomena. For instance, González et al. [22] looked at the effects of R&D and worker training on innovation performance in a sample of Spanish manufacturing firms, differentiating large and small businesses, and found that R&D is a critical component in explaining corporate innovation success. To analyze their relative importance and to what degree they are complements or substitutes, Hall et al. [23] used data from a sizeable, unbalanced panel data sample of Italian manufacturing firms created from four successive waves of a survey of manufacturing enterprises. They discovered that R&D and ICT are strongly linked to innovation and productivity, with R&D having a more robust link. Huady and Orviská [24] used a regression model of panel data covering EU countries from 1999 to 2011 to investigate the impact of research and development expenditures on a country’s innovation performance and economic growth. They discovered that lagged R&D expenditures positively affect innovation performance in these countries. Savrul and Incekara [25] studied the impact of R&D intensity on innovation performance at the country level between 2000 and 2012, concluding that R&D spending is a significant supporter of innovation success. Pegkas et al. [26] examined whether R&D investment influenced innovation in European Union countries from 1995 to 2014 and discovered that higher education R&D has a positive and significant impact on innovation. Based on panel data of 164 listed enterprises in China’s A-share artificial intelligence concept sector, Dong et al. [27] used the panel fixed effect regression method to examine the impact of R&D intensity on the innovation performance of artificial intelligence enterprises and found that the impact of R&D intensity on innovation performance is positive and significant. From 2001 to 2018, Lv et al. [28] used transnational regression analysis to examine the impact of R&D spending on technological innovation in 18 south and southeast Asian nations. They discovered that R&D spending in south and southeast Asia considerably boosts technological innovation. Furthermore, research on the impact of university science and technology innovation on business performance was conducted by Ren and Tan [29]. This paper developed a two-stage DEA model for the output and transformation of scientific and technological accomplishments. The data were used from Yangtze river’s 19 provinces and cities. The results of this study reveal that while there is a significant difference between them, both efficiencies are found to be fairly stable over a five-year period. The redundant input from universities and the insufficient output from businesses are to blame for the ineffectiveness. Based on the theory of planned behavior, Wang et al. [30] investigated the research on graduate students’ active scientific research innovation behavior by collecting 684 valid questionnaires through WeChat. The results demonstrate that academic interest, regulatory pressure, and circumstances that improve research and innovation capabilities all positively affect the willingness to conduct research and innovation; however, the impact of regulatory pressure is very small. In order to investigate the effect of innovation capability on the caliber of university research, Wang et al. [31] used a two-stage DEA model. The findings of this study demonstrate that the overall quality of scientific research in colleges and universities varies significantly when innovation in science and technology is prioritized while the transformation of scientific and technological achievements is ignored. Additionally, Chen et al. [32] investigated the capacity for innovation among college students in accordance with the extenics and creativity theory. Extensive application of extenics and creative learning can more effectively cultivate students’ comprehensive divergent thinking, associative ability, problem-solving ability, and the ability to use and integrate network-based information according to the function and performance analysis of the creativity theory and extenics resource. Moreover, some scholars have been drawn to universities because they have created a complex system with various inputs and multiple outputs. The DEA model is commonly used in research due to its advantages in handling many inputs and outputs at the same time, eliminating the need to subjectively establish production functions, and giving improved routes for incorrect decision-making units. For instance, Yuan et al. [33] put forth a combined evaluation model: the delayed non-radial super-efficiency DEA model. This model can account for the lag in scientific research input and output, the ranking of evaluation results, and the evaluation of value preference defects. The model was used to assess the scientific research productivity of 36 engineering colleges and universities, and the method of comparison and verification was used to demonstrate the model’s viability and efficacy. A recent study in some UK universities compared and evaluated the efficacy of technology transfer using DEA and SFC and discovered each and every one of these studies views the university-based scientific research process as a “black box”. On the one hand, the system’s flaws are not readily apparent, and its internal workings are neglected. On the other hand, the efficiency might be exaggerated. Furthermore, very few studies have looked at how school management affects scientific research, despite the fact that academics believe that efficient school management is a crucial element of productive research. The management and environment of university research have an impact on its validity [34]. Since the quantity and quality of academic papers published by the training unit are allegedly related to the degree and set minimum academic standards for graduation and training programs, graduate students “must” abide by the regulatory environment for scientific research, possess the drive to complete learning and scientific research tasks, while being able to adapt to the regulatory environment [35].
3. Methods
3.1. Data and Variables
This study employs panel data from the US and China. To achieve the first and second objectives of the study, the variables include the universities’ innovation ability ranking (INNOVATION) as a dependent variable, followed by research and development funding of the countries (% of GDP) (R&D), number of researchers engaged in research and development (per million people) (RESEARCHERS), and number of colleges and universities (INSTITUTIONS) as independent variables, with human development index (HDI) and per capita income (GDP per capita growth in USD, annual %) (PCI) as control variables. To achieve the third objective of the study, the variables include labor productivity (labor productivity per hour) (PRODUCTIVITY), employment opportunities (employment rate, ILO estimate) (EMPLOYMENT), and income classification of the countries, which are treated as dichotomous variables, where low-income economies = 1, lower-middle-income economies = 2, upper-middle-income economies = 3, and high-income economies = 4 (INCOME_CLASSIFICATION) are the dependent variables, followed by the universities’ innovation ability ranking (INNOVATION) as an independent variable, with labor force (in hundreds of millions) (LABOR), capital (gross capital formation in local currency) (CAPITAL), and consumption (final consumption in trillion, local currency) (CONSUMPTION) as control variables. The variables, namely labor, capital, and consumption, were logged due to their size in order to tackle the problem of heteroscedasticity and efficient estimation. The period of the study is from 1996 to 2021, and the choice of this period is motivated by the availability of the data on the dependent variable and the uncovered research period in the literature. The data for this research were obtained from the World Development Indicators statistical bulletin, the Education and Science statistical bulletin, SCImago universities’ innovation ability ranking point, Statista publications, and the International Labour Organization statistical bulletin [36,37,38,39,40].
3.2. Estimation Techniques
We begin our analysis with a graphical analysis of the variables under study. The second method is descriptive statistics for viewing the statistical characteristics of the series. The third method is the heterogeneity test for checking the cross-sectional dependence (CD) in the panels, i.e., Pesaran test [41], which most researchers rely on. The fourth method is the panel unit root tests for checking the stochastic properties of the panels, namely the Pesaran cross-sectional augmented Im–Pesaran–Shin (CIPS) panel unit root test, which deals with the problem of cross-sectional dependence and heterogeneous slope coefficients [42]. However, for those panels where there is no evidence of cross-sectional dependence, the panel unit root tests, including Levin et al. [43], henceforth LLC, and Im et al., henceforth IPS, will be used. These tests were chosen because the former allows for heterogeneity in intercepts across panel members under the null hypothesis of panels containing the unit root. In contrast, the latter allows intercept and slope coefficient heterogeneity [44]. In a situation where all the variables are stationary, there is no need for a cointegration test; otherwise, there is. The fifth method is the Arellano–Bond technique, a dynamic panel model based on the system generalized method of moments (system GMM) model, which is commonly employed for panel data, and it is used because it is more efficient and resilient in treating heteroscedasticity and autocorrelation than other techniques. Arellano and Bond [45] created the model, which was later refined by Arellano and Bover [46]. Another benefit of the model over other strategies is that it ensures less bias and higher precision. Similarly, in addition to the control of individual fixation, in the presence of different sources of endogeneity, such as “unobserved heterogeneity, simultaneity, and dynamic endogeneity”, the GMM model produces consistent results [47].
For achieving the third objective of the study, the system GMM model is represented by Equation (1). Meanwhile, for achieving the third objective, the system GMM model is represented by Equations (2)–(4).
where Innovation is the universities’ innovation ability; (1 + β) in Equation (1) is the coefficient of innovation convergence; R&D represents research and development funding; Researchers represent the number of researchers engaged in research and development; Institutions represent the number of institutions engaged in research and development; HDI represents the human development index; PCI represents per capita income; Productivity represents labor productivity; Employment represents employment opportunities; Income_classification represents the income classification group of the countries; Log_Labour represents the labor force; Log_Capital represents the capital; and Log_Consumption represents consumption. μi represents all the innovation abilities of the universities that we did not take into consideration; θt refers to the specific effect during the study period; εit is the error term; and i represents country i at time t. However, in order to achieve robust standard errors, the system GMM estimation technique adds robustness. Additionally, the estimation controls the fixed time effect by using a year dummy variable (time dummy variable).
Furthermore, Arellano and Bover [46] specification tests will be utilized to test the validity of the instruments in the system GMM estimation. The Arellano–Bond serial correlation test will be employed first to see whether the residuals have a second-order serial correlation; the null hypothesis is that they are serially uncorrelated. If the null hypothesis cannot be rejected, no second-order serial correlation exists, and the system GMM estimator is reliable. Second, both the null hypothesis of instrument validity and the validity of the additional moment limitations necessary for system GMM will be investigated using both the Sargan and Hansen tests. Therefore, if the null hypothesis is not rejected, the instruments are valid; otherwise, invalid.
4. Results
This section deliberates on the presentation and discussion of the study’s results. It starts with the preliminary analysis of the study, which includes a graphical representation of the variables, descriptive statistics of the variables, correlation analysis, cross-sectional dependence test, CIPS panel unit root test, panel cointegration tests, and lastly, the estimation of the system GMM model.
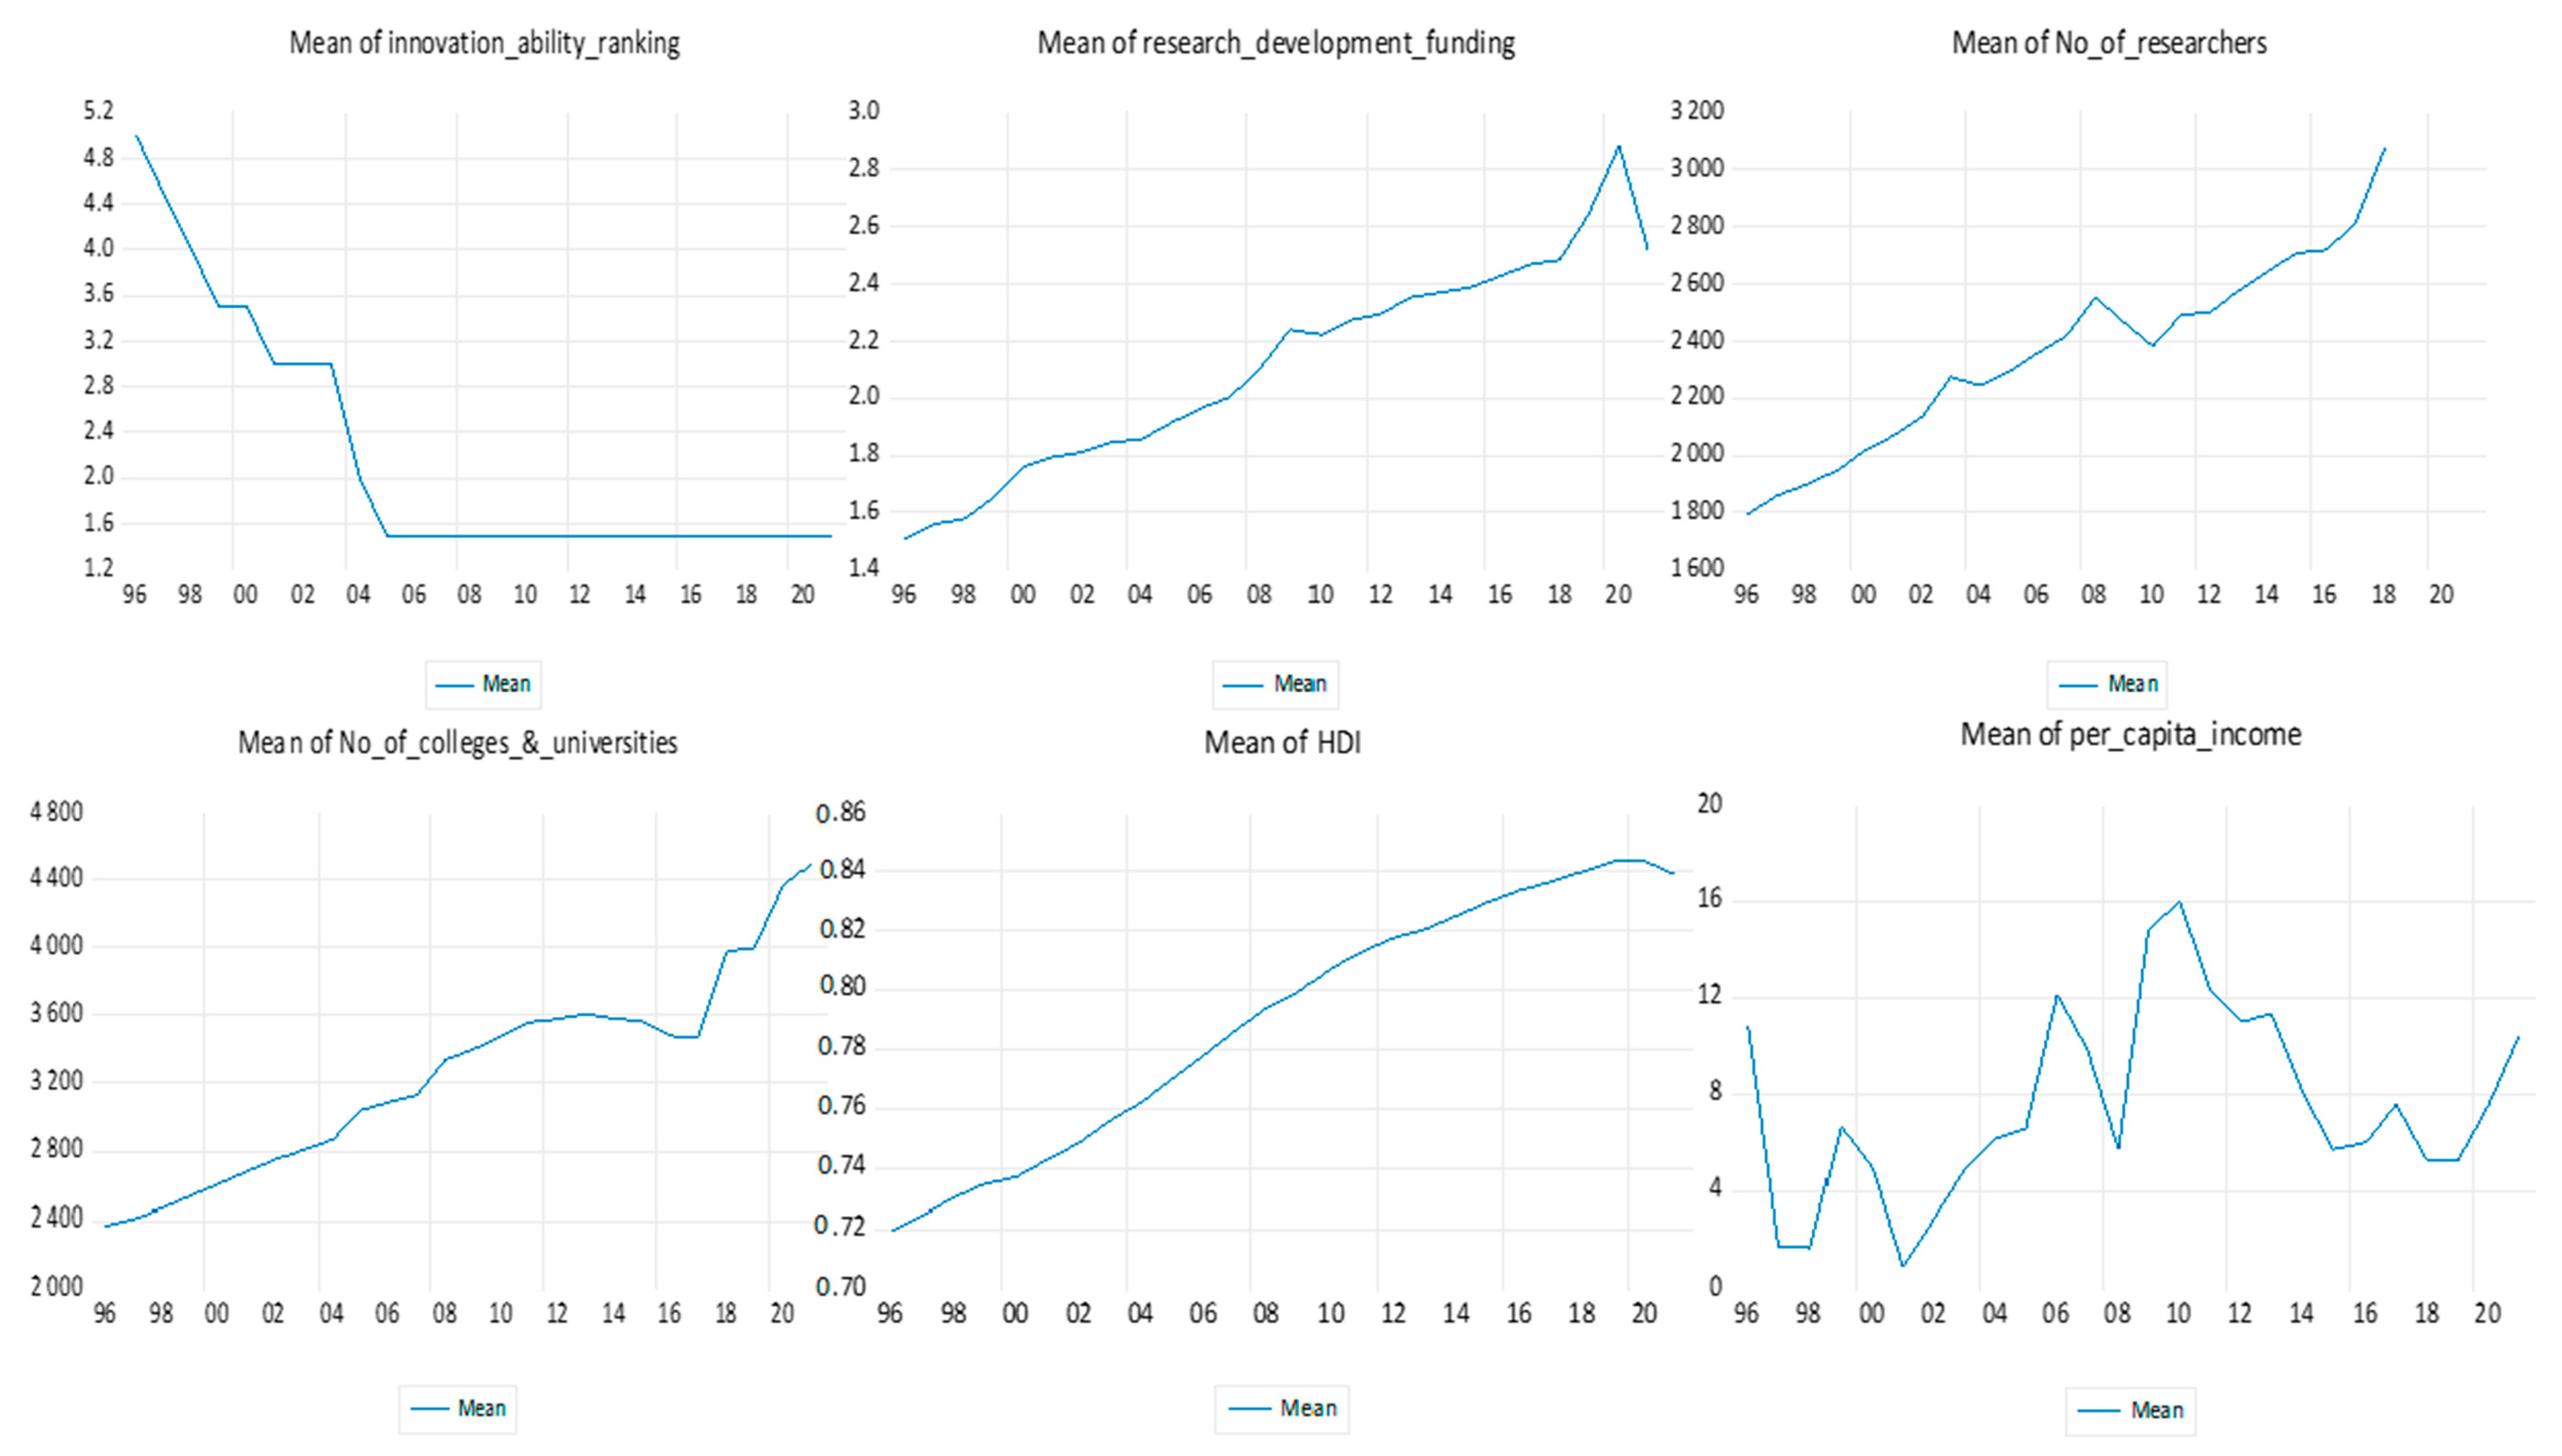
Figure 1 displays the graphical representations of the variables for achieving the first and second objectives of the study, namely universities’ innovation ability ranking, research and development funding, number of researchers engaged in research and development, number of colleges and universities, human development index, and per capita income. From the figure, the universities’ innovation ability ranking point fluctuates downward up to 2005 and then remains constant even in recent years—thus, a partly fluctuating and partly constant trend. Research and development funding increases throughout the period, except in 2020–2021—hence, an upward trend, except in recent years. The number of researchers engaged in research and development displays an upward trend throughout the period, even in recent years. The number of colleges and universities shows an upward trend throughout the period, even in recent years; however, there is a decline in 2016–2017. The human development index over the period continues to rise throughout, although it shows a sign of decline in recent years. Per capita income fluctuates throughout the period; however, there is a sign of an upward increase in recent years.
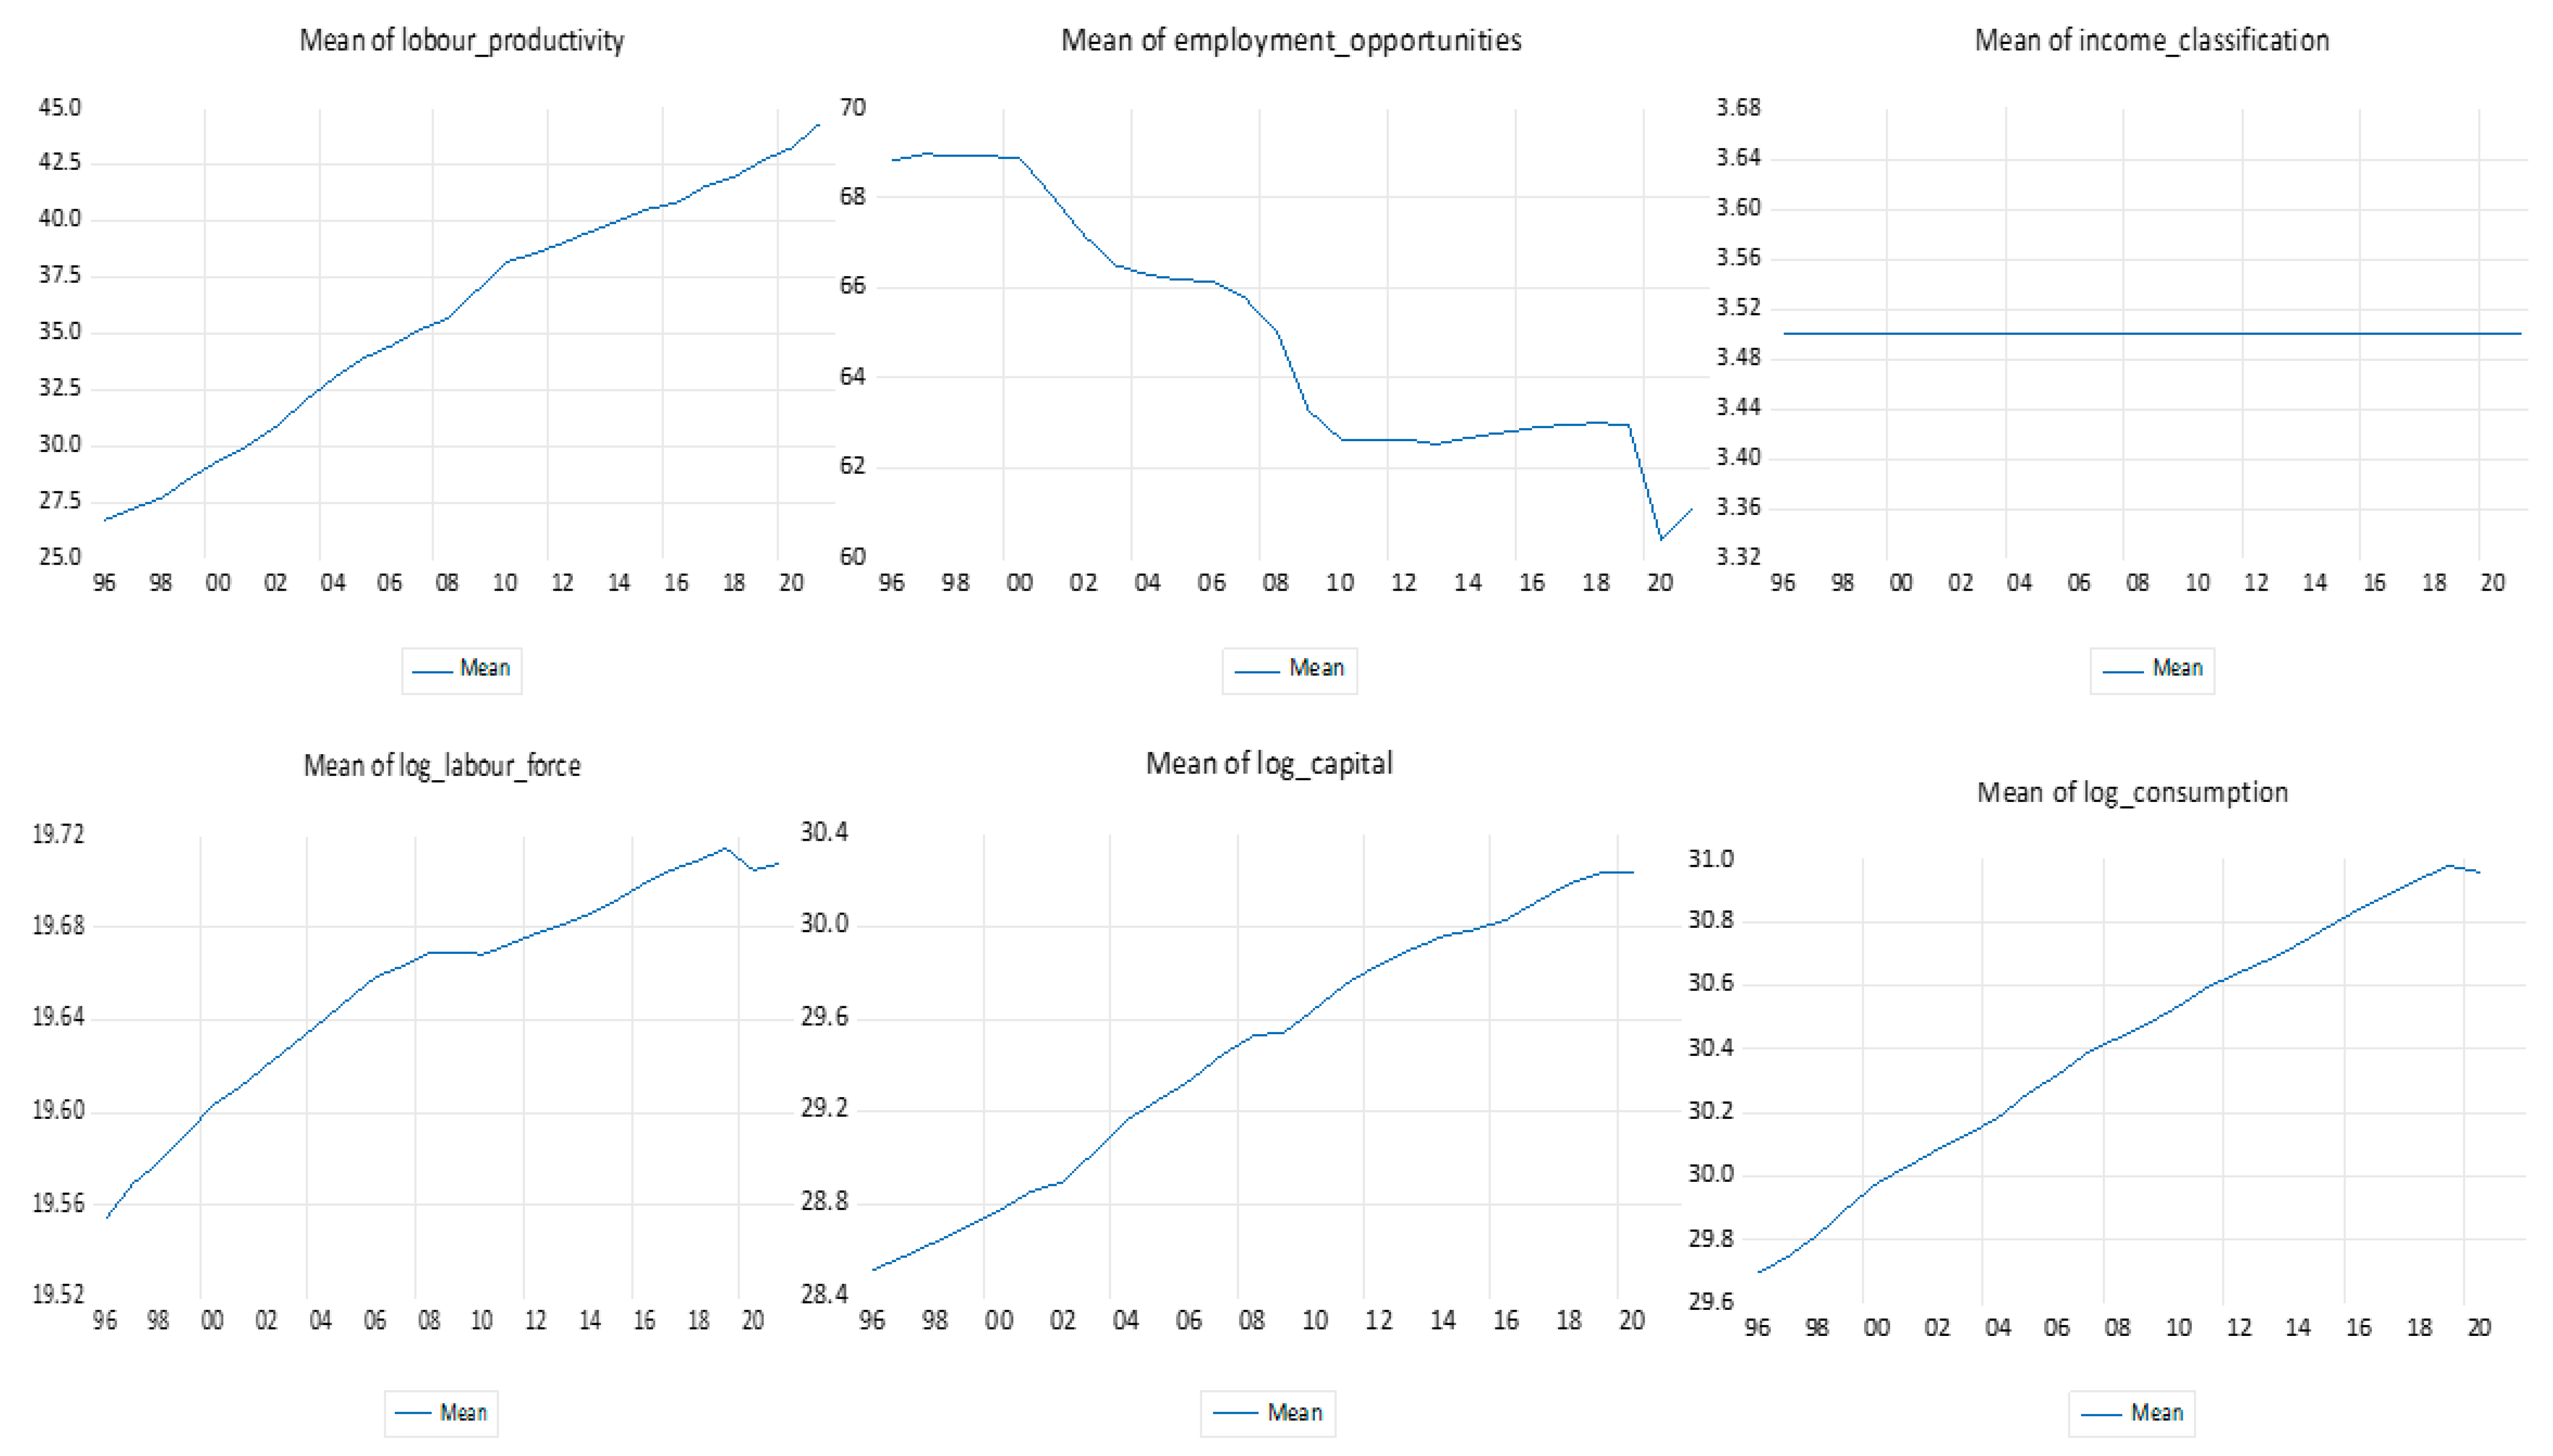
Figure 2 shows the graphical representations of the variables for achieving the third objective of the study, namely labor productivity, employment opportunities, income classification of the countries, labor force, capital, and consumption. From the figure, labor productivity shows a consistently upward trend, even in recent years. Employment opportunities show a declining trend; however, they are on an upward trend in recent years. The income classification of the countries is a constant trend throughout the period. The labor force shows an upward trend throughout, even in recent years. Capital and consumption show a similar upward trend, even in recent years.
Table 1 displays the analysis of the statistical characteristics of the variables for achieving the first and second objectives of the study. From the table, the mean and standard deviation of INNOVATION ABILITY, R&D, RESEARCHERS, INSTITUTIONS, HDI, and PCI of the countries are 2.3 point, 2% of GDP, 2359 researchers per million people, 3121 institutions, 0.8 index, 7.5 annual PCI growth; and 2.1 point, 0.7% of GDP, 1565 researchers per million people, 1325 institutions, 0.3 index, and 7.7 annual PCI growth, respectively. The maximum and minimum statistics of INNOVATION ABILITY, R&D, RESEARCHERS, INSTITUTIONS, HDI, and PCI of the countries are 9 points, 2.8% of GDP, 4860 researchers per million people, 5300 institutions, 0.9 index, 28.7 annual PCI growth; and 1 point, 0.6% of GDP, 382 researchers per million people, 1014 institutions, 0.6 index, and 0.9 annual PCI growth, respectively. The skewness shows that the elements of INNOVATION ABILITY, RESEARCHERS, and PCI of the countries are positively skewed and those of R&D, INSTITUTIONS, and HDI of the countries are negatively skewed. At the same time, the kurtosis ranges between 1 and 5—thus, low—which gives an insight that the data tend to have light tails. However, the p-values of the Jarque–Bera statistics for all variables, except that of INSTITUTIONS, are significant—thus, an explosive distribution.
Table 2 presents the analysis of the variables’ statistical characteristics for achieving the study’s third objective. From the table, the mean and standard deviation of PRODUCTIVITY, EMPLOYMENT, INCOME CLASSIFICATION, LOG_LABOUR, LOG_CAPITAL, and LOG_CONSUMPTION of the countries are 35.5%, 65.1%, 3.5, e19.7 million labor force, e29.4 trillion worth capital, e30.4 trillion worth consumption; and 29.2%, 5.6%, 0.5, e0.8 million labor force, e0.1 trillion worth capital, and e0.5 trillion worth consumption, respectively. The maximum and minimum statistics of PRODUCTIVITY, EMPLOYMENT, INCOME CLASSIFICATION, LOG_LABOUR, LOG_CAPITAL, and LOG_CONSUMPTION of the countries are 73.9%, 75.4%, 4, e20.5 million labor force, e31.4 trillion worth capital, e31.5 trillion worth consumption; and 3.2%, 56%, 3, e18.7 million labor force, e28.4 trillion worth capital, and e29.5 trillion worth consumption, respectively. The skewness shows that all the elements of the variables are positively skewed, except LOG_LABOUR, which is negatively skewed. At the same time, the kurtosis ranges between 1 and 3—thus, low—which gives an insight that the data tend to have light tails. However, the p-values of the Jarque–Bera statistics for all variables, except that of EMPLOYMENT, are significant—thus, an explosive distribution.
Table 3 is the correlation analysis with INNOVATION ABILITY as the dependent variable. According to this table, innovation ability is positively correlated with all the variables. However, innovation ability is adequately related to R&D, INSTITUTIONS, and HDI but weakly correlated with RESEARCHERS and PCI.
Table 4 reports the correlation analysis with PRODUCTIVITY as the dependent variable. The table shows that productivity is positively correlated with all the variables. However, there is a high correlation between productivity and INNOVATION ABILITY and LOG_LABOUR but a moderate correlation between productivity and LOG_CAPITAL, while there is a weak correlation between productivity and LOG_CONSUMPTION.
The correlation analysis with EMPLOYMENT as the dependent variable is shown in Table 5. The table shows that employment is positively correlated with all the variables, except LOG_CONSUMPTION. However, there is a high correlation between employment and INNOVATION ABILITY and LOG_LABOUR. Moreover, the correlation between employment and the other variables, namely LOG_CAPITAL and LOG_CONSUMPTION, is weak.
The correlation analysis with INCOME CLASSIFICATION as the dependent variable is shown in Table 6. The table shows that income classification is positively correlated with all the variables, except LOG_LABOUR. However, there is a high correlation between income classification and INNOVATION ABILITY and LOG_LABOUR but a moderate correlation between income classification and LOG_CAPITAL, while there is a weak correlation between income classification and LOG_CONSUMPTION.
The Pesaran test for cross-sectional dependence in the panels is shown in Table 7. Except for INNOVATION ABILITY, RESEARCHERS, PCI, and INCOME CLASSIFICATION, none of the variables in the table rejects the null hypothesis of no cross-sectional dependence among the countries. Therefore, for variables with evidence of cross-sectional dependence, the appropriate panel unit root to use is the Pesaran CIPS panel unit root test [42], while for variables with no evidence of cross-sectional dependence, the appropriate panel unit root to use is panel unit root tests, such as Levin et al., hereafter LLC, and Im et al. [43], henceforth IPS, based on the traditional augmented Dickey–Fuller (ADF) test.
Table 8 reveals the Pesaran CIPS panel unit root test results for panels with evidence of cross-sectional dependence, i.e., R&D, INSTITUTIONS, HDI, PCI, PRODUCTIVITY, EMPLOYMENT, LOG_LABOUR, and LOG_CAPITAL. The results show that R&D, HDI, PRODUCTIVITY, and LOG_CAPITAL reject the null hypothesis of homogeneous non-stationarity at the 1% level. However, INSTITUTIONS, EMPLOYMENT, LOG_LABOUR, and LOG_CONSUMPTION reject the null hypothesis of homogeneous non-stationarity at the first difference at 1%, 5%, 1%, 1% levels, respectively. Therefore, the order of integration of the variables is a mixture of I (0) and I (1).
The panel unit root test results for the variables INNOVATION ABILITY, RESEARCHERS, PCI, and INCOME CLASSIFICATION are shown in Table 9. According to the table, the LLC’s unit root hypotheses, which compare the null hypothesis of the panels containing a unit root to the alternative, whereby the panels are stationary, rejected the null hypothesis at the 10%, 10%, 1%, and 1% levels, indicating that the panels are stationary at those levels. Furthermore, the IPS test, which compares the null hypothesis of all panels containing unit roots against the alternative, whereby specific panels are stationary, rejected the null hypothesis at the 5%, 5%, 1%, and 1% levels, indicating that the panels are stationary at those levels. Hence, following the results reported in Table 4 and Table 5, all variables are stationary at those levels, implying that they are all integrated in the order of zero, i.e., I (0).
However, observing the Pesaran (2007) CIPS panel unit root test results, as well as the LLC and IPS panel unit root test results reported in Table 8 and Table 9, respectively, it is evident that the variables under study are a mixture of I(0) and I(1); hence, there is a need for cointegration in each of the four models in the study, since the variables that are I(1) appear in each of the models.
Table 10 displays the results of the Westerlund panel cointegration test with innovation ability, productivity, employment, and income classification as the dependent variables—thus, the four different models in the study. According to the table, in each of the four models, there is evidence of cointegration among the variables at the 5%, 5%, 10%, and 1% levels, respectively.
Table 11 shows the results of dynamic panel data estimation using the system GMM model. The findings show that the coefficient of the first lag of universities’ innovation ability ranking is positive and statistically significant at the 1% level, implying that the previous period value of universities’ innovation ability impacts universities’ innovation ability across the countries. The coefficient of the initial level of innovation ability of universities in the countries is negative and significant at the 1% level, indicating that the innovation ability of US universities is recording a slower growth rate, whereas that of Chinese universities is recording a higher growth rate, signifying that Chinese universities’ innovation ability is converging with that of US universities. Furthermore, R&D, RESEARCHERS, INSTITUTIONS, and PCI are positive and statistically significant at the 1%, 5%, 5%, and 1% levels, respectively, where a one unit increase in R&D, RESEARCHERS, INSTITUTIONS, and PCI will lead to the innovation ability ranking of universities rising by 3.54932 point rank, 0.0018602 point rank, 0.0004374 point rank, and 0.060568 point rank, respectively. This implies that these variables can be construed as influential factors that promote the innovation ability ranking of universities in the countries. However, the HDI is not significant—though positive—implying that it has negligible impact on the innovation ability of universities in the countries. However, when checking the statistical healthiness of the model, the Arellano–Bond tests based on AR (1) and AR (2) are insignificant according to the p-values of the tests’ statistics presented in parentheses; hence, there is no serial correlation. Moreover, the insignificance of the p-values of the Sargan and Hansen tests indicates the statistical validity of the instruments used in estimating the model.
Therefore, the finding implies that the increase in research and development funding of the countries as a percentage of GDP, the number of researchers engaged in research and development per million people, the number of colleges and universities, and per capita income annual growth influence the innovation ability of universities across the countries, while the human development index negligibly influences it. In addition, the innovation ability of Chinese universities is being converged with that of US universities; thus, the gap between the innovation ability of Chinese and US universities is being reduced.
From Table 12, the findings show that the coefficient of the first lag of PRODUCTIVITY is positive and statistically significant at the 1% level, implying that the previous period value of PRODUCTIVITY has an impact on PRODUCTIVITY across the countries. The findings also reveal that INNOVATION ABILITY is positive and significant at the 1% level, where a one unit increase in the universities’ innovation ability ranking will lead to a 0.11% increase in the growth rate of labor productivity. LOG_LABOUR is positive and significant at the 1% level, where a 1% increase in labor force will lead to a 37.56% increase in the growth rate of labor productivity. LOG_CAPITAL is positive and significant at the 1% level, where a 1% increase in capital will lead to a 0.1% increase in the growth rate of labor productivity. LOG_CONSUMPTION is positive and significant at the 1% level, where a 1% increase in consumption induces a 0.04% increase in the growth rate of labor productivity. However, the model has a good fit, as the Arellano–Bond tests, the Sargan test, and the Hansen test prove that the model is free from serial correlation, and the instruments used are statistically valid.
Therefore, the finding implies that an increase in universities’ innovation ability, labor force, capital, and consumption influence the level of labor productivity in the countries.
Following Table 13, the coefficient of the first lag of EMPLOYMENT is positive and statistically significant at the 1% level, implying that the previous period value of EMPLOYMENT has an impact on EMPLOYMENT across the countries. The findings also reveal that INNOVATION ABILITY is positive and significant at the 1% level, where a one unit increase in the universities’ innovation ability ranking will lead to a 0.45% increase in the rate of employment opportunities. LOG_LABOUR is negative and significant at the 1% level, where a 1% increase in labor force will lead to a 1.63% decrease in the rate of employment opportunities. LOG_CAPITAL is positive and significant at the 1% level, where a 1% increase in capital will lead to a 0.08% increase in the rate of employment opportunities. LOG_CONSUMPTION is positive and significant at the 1% level, where a 1% increase in consumption will lead to a 0.06% increase in the rate of employment opportunities. However, the model has a good fit, as the Arellano–Bond tests, the Sargan test, and the Hansen test prove that the model is free from serial correlation, and the instruments used are statistically valid.
Therefore, the finding specifies that an increase in universities’ innovation ability, capital, and consumption influence the rate of employment opportunities, while an increase in labor force retards it.
Following Table 14, the findings show that the coefficient of the first lag of INCOME CLASSIFICATION is positive and statistically significant at the 1% level, implying that the previous period value of INCOME CLASSIFICATION has an impact on the income classification of the countries. The findings also reveal that INNOVATION ABILITY is positive and significant at the 1% level, where a one unit increase in the universities’ innovation ability ranking will lead to a 0.00010% increase in income classification. LOG_LABOUR is negative and significant at the 1% level, where a 1% increase in labor force will lead to a 0.014% decrease in income classification. LOG_CAPITAL is positive and significant at the 5% level, where a 1% increase in capital will lead to a 0.0000084% increase in income classification. LOG_CONSUMPTION is positive and significant at the 1% level, where a 1% increase in capital will lead to a 0.00027% increase in income classification. However, the model has a good fit, as the Arellano–Bond tests, the Sargan test, and the Hansen test prove that the model is free from serial correlation, and the instruments used are statistically valid.
Thus, the finding demonstrates that an increase in universities’ innovation ability, capital, and consumption influence the income classification group of the countries, while an increase in labor force distracts it.
5. Discussion
The investigation of this paper regarding the innovation abilities of the US and Chinese universities reveals that the rise in research and development funding, the number of researchers engaged in research and development, and the number of colleges and universities are improving the growth of the innovation ability of universities across the countries. This is likely due to the fact that, in those countries, there is a high and efficient utilization of research and development funding and a massive expansion of the number of quality researchers and institutions. For example, according to the second report from Statista [39], the US and China are regarded as the first and second in the world in terms of countries with the highest spending on research and development. Additionally, according to the SCImago Institutions Ranking [37], the US is the best country in the world in terms of research, followed by China. Likewise, the countries have a large number of universities and colleges, where the US and China are, respectively, the second and fourth in the world [38]. Furthermore, the study finds that the innovation ability of Chinese universities is converging with that of US universities. Thus, the gap between the innovation ability of Chinese and US universities is being reduced. This is supported by the fact that China has improved across the board, and in certain areas, it even outperforms the United States. In fact, China has narrowed the deficit with the United States by a factor of 1.5 from the base year to the most recent year, based on an average of all indices [48].
On the other hand, the universities’ innovation ability is also paid back, for example, by increasing the quality of local labor by training graduates, encouraging local businesses to extend their operations, offering professional guidance to local development agencies and businesses, and improving the cultural and economic appeal of the area, among other things [49]. When this study examined the impact of universities’ innovation ability in relation to the level of labor productivity, employment opportunities, and income classification across the US and Chinese universities, the study found an increase in universities’ innovation ability to influence the growth of those variables in the countries. This ascertains the theoretical view that one of the most significant benefits of innovation is its contribution to economic growth. Innovation can lead to increased productivity, meaning that the same amount of input produces more output [20]. Moreover, it supports the notion that labor productivity is heavily influenced by capital investment, technology advancement, and human capital growth [50]. According to an estimate, innovation improvements have a beneficial impact on job growth, whereby innovation leads to additional jobs (and destroys less employment) [51].
However, based on empirical evidence, the findings of this study are commensurate with those of González et al. [22] that R&D is a key factor in explaining innovation performance; Hall et al. [23] that R&D is strongly associated with innovation; Huňady and Orviská [24] that there exists a positive effect of R&D expenditures on innovation performance; Savrul and Incekara [25] that research and development expenditure is a significant promoter of innovation performance; Pegkas et al. [26] that there exists a positive and significant effect of higher education R&D on innovation; Dong et al. [27] that the impact of R&D intensity on innovation performance is positive and significant; and Lv et al. [28] that R&D expenditure significantly promotes innovation.
6. Concluding Remarks
This study empirically examined the innovation ability of universities in the United States of America (US) and China from 1996 to 2021 using the system generalized method of moments (system GMM) technique. The study revealed that research and development funding, the number of researchers engaged in research and development, and the number of colleges and universities are influencing the innovation ability of universities across the countries, whereby a unit increase in research and development funding as a percentage of GDP, the number of researchers engaged in research and development per million people, and the number of colleges and universities improve the innovation performance ranking by 3.5, 0.0019, and 0.00044, respectively. Furthermore, the innovation ability of Chinese universities is converging with that of US universities; thus, the gap between the innovation ability of Chinese and US universities is being narrowed—hence, declining. Moreover, the innovation ability of Chinese and US universities improves the level of labor productivity, employment opportunities, and income classification group of the countries, whereby a unit increase in the rank of innovation ability improves the growth rate of the level of labor productivity, employment opportunities, and income classification group of the countries by 0.11%, 0.45%, and 0.00010 index, respectively.
Therefore, this study recommends that governments or responsible agencies in the countries should maintain the level of research and development funding through any possible reinforcement. Furthermore, they should put more effort into supervising the utilization of research and development funding in universities across the countries. Moreover, funding can be channeled by enabling significant progress in curriculum development and reform, educating students with disabilities, understanding individual differences and preferences, and adapting instructional methods to the need of individual students. Moreover, the countries should continue to increase the number of colleges and universities accordingly, as well as increase the number of researchers through commendations, recognitions, incentives, or any form of encouragement because any person, no matter how young or old, always needs a boost or congratulations or a word of encouragement that conveys or appreciates their value in performance.
Nonetheless, the universities’ innovation ability can be improved in a number of ways. First, a seed fund is essential to conduct research, regardless of the topic, even if one is working on something straightforward. Second, staff/students must be encouraged to think well or to be creative, for example, by designing a well-organized curriculum. Third, it is not necessary to have all the necessary equipment to conduct research; it can be achieved. It is critical to always strive to be resourceful rather than acquisitive, creating a platform for sharing resources and trying to carry out the work at a low cost. Fourth, always put something aside for the future. Create something for the twenty-first century, and do not work on anything that has been drained. Fifth, hire the best—and in this situation, the vice-chancellor, the pro-vice-chancellor for research, and the head of the recruiting department should establish and lead this process and be accessible to speak with possible employees directly. Do not just post an ad; consider who the ideal candidate might be. Human resources departments should play a more prominent role in acquiring (and retaining) top talent. Sixth, the universities should be aware of the talent list and congratulate individuals. It is unthinkable that a successful organization would be unaware of its most skilled employees. Therefore, who are your university’s researchers, professors, and administrators? Ensure that the vice-chancellor is informed any time someone does anything good on the ground. Then, send a word of congratulations. When it comes to rewarding your teachers, be generous. Make an effort to let individuals know that their efforts have not gone ignored. The life of an academic is lonesome, and loyalty is sometimes extended to the discipline, not the university. Researchers typically obtain positive feedback exclusively from their professional peers; peer evaluation leads to publication, advancement, and, eventually, money. Academics will remain loyal to a university if the institution does more than ask them to fill out paperwork. Likewise, ensure that recruiting and retaining great talent is a complex and expensive process.
Author Contributions
Conceptualization, B.N.A. and C.C.; Methodology, B.N.A. and A.S.; Software, B.N.A., A.S. and C.C.; Validation, A.S. and B.N.A.; Formal analysis, B.N.A.; Investigation, C.C.; Resources, A.S. and C.C.; Data curation, A.S. and C.C.; Writing—original draft preparation, B.N.A.; Writing—review and editing, B.N.A., C.C. and A.S.; Visualization, A.S.; Supervision, C.C. and B.N.A.; Project administration, B.N.A.; Funding acquisition, C.C. All authors have read and agreed to the published version of the manuscript.
Funding
Henan Province Educational Science Planning Major Bidding Project Research on the Construction of Henan University Innovation System under the Background of Science and Technology Self-reliance and Self-reliance 2022JKZB02.
Institutional Review Board Statement
Not applicable.
Informed Consent Statement
Not applicable.
Data Availability Statement
The data of this study are available upon request.
Acknowledgments
We thank the editor and anonymous reviewers for carefully reading our manuscript and for their many insightful comments and suggestions.
Conflicts of Interest
No potential conflict of interest was reported by the author(s).
References
- Buddlemeyer, H.; Jensen, P.H.; Webster, E. Innovation and the Determinants of Company Survival. Oxf. Econ. Pap. 2010, 62, 261–285. [Google Scholar] [CrossRef]
- Sonka, S.T.; Chicoine, D.L. Value and University Innovation. Am. J. Agric. Econ. 2004, 86, 1337–1344. [Google Scholar] [CrossRef]
- Blass, E.; Jasman, A.; Shelley, S. Postgraduate research students: You are the future of the Academy. Futures 2012, 44, 166–173. [Google Scholar] [CrossRef] [Green Version]
- Forbes. The Future of Higher Education Depends on Innovation. 2014. Available online: https://www.forbes.com/sites/henrydoss/2014/07/31/innovation-should-be-mandatory-in-higher-education/?sh=4a7b734b1b45 (accessed on 1 August 2022).
- Stephanie, L. Why Innovation Is Key to the University Experience of the Future. 2021. Available online: https://www.topuniversities.com/student-info/choosing-university/why-innovation-key-university-experience-future (accessed on 2 August 2022).
- UNESCO. Education for Sustainable Development. Learning & Training Tools, No. 4. 2012. Available online: https://unesdoc.unesco.org/ark:/48223/pf0000216383.locale=en (accessed on 20 October 2022).
- Jackson, S.A. Ahead of the curve: Future shifts in higher education. Educ. Rev 2004, 39, 10–18. [Google Scholar]
- Bajuri, M.R.; Abdul Rahim, S.S.; Mohd Shahali, E.H.; Maat, S.M. Influence of Spirituality in the Career and STEM-Based Research Approach of Scientists for Sustainable Development: A Study on the Perspective of Scientists from a Public Research University in Malaysia. Sustainability 2021, 13, 11161. [Google Scholar] [CrossRef]
- Li, Z.; Wan, T.; Lan, J. Substitution or Complementarity: Influence of Industry–University—Research-Institute Cooperation Governance Mechanism on Knowledge Transfer—An Empirical Analysis from China. Sustainability 2022, 14, 7606. [Google Scholar] [CrossRef]
- Bresnahan, T.; Gambardella, A. (Eds.) Building High-Tech Regions; Cambridge University Press: Cambridge, UK, 2004. [Google Scholar]
- Atkinson, R.D. Understanding the U.S. National Innovation System Information. Technology and Innovation Foundation. 2020. Available online: https://itif.org/publications/2020/11/02/understanding-us-national-innovation-system-2020 (accessed on 20 October 2022).
- Melaas, A.; Zhang, F. National Innovation Systems in the United States and China: A Brief Review of the Literature. Energy, Climate, and Innovation Program (ECI); Center for International Environment and Resource Policy (CIERP): Medford, MA, USA, 2016. [Google Scholar]
- Song, J. Awakening: Evolution of China’s science and technology policies. Technol. Soc. 2008, 30, 235–241. [Google Scholar] [CrossRef]
- Xue, L.; Forbes, N. Will China Become a Science and Technology Superpower by 2020? An Assessment based on a National Innovation System Framework. Innov. Technol. Gov. Glob. 2006, 1, 111–126. [Google Scholar]
- Gu, S. Institutional entrepreneurship and policy learning in China. J. Sci. Technol. Policy China 2013, 4, 36–54. [Google Scholar] [CrossRef]
- Cheng, Y. Rural & Development fund bolstered by private sector. China Daily, 28 October 2015. [Google Scholar]
- Aghion, P.; Howitt, P.W. Endogenous Growth Theory; MIT Press: Cambridge, MA, USA, 1998; Volume 32. [Google Scholar]
- Incekara, A.; Savrul, M. Impact of Globalization on Entrepreneurship in Developing Countries. In Proceedings of the International Conference on Eurasian Economies, St. Petersburg, Russia, 17–18 September 2013. [Google Scholar]
- Mathieu, A.; De La Potterie, B.V.P. A Note on the Drivers of R&D Intensity. Res. World Econ. 2010, 1, 56–65. [Google Scholar]
- European Central Bank. How Does Innovation Lead to Growth? 2017. Available online: https://www.ecb.europa.eu/ecb/educational/explainers/tell-me-more/html/growth.en.html (accessed on 21 October 2022).
- Woltjer, G.; Galen, M.V.; Logatcheva, K. Industrial Innovation, Labour Productivity, Sales and Employment. Int. J. Econ. Bus. 2021, 28, 89–113. [Google Scholar] [CrossRef] [Green Version]
- González, X.; Miles-Touya, D.; Pazó, C. R&D, Worker Training, and Innovation: Firm-level evidence. Ind. Innov. 2016, 23, 694–712. [Google Scholar]
- Hall, B.H.; Lotti, F.; Mairesse, J. Evidence on the Impact of R&D and ICT Investment on Innovation and Productivity in Italian Firms. 2012. Working Paper 18053. Available online: http://www.nber.org/papers/w18053 (accessed on 19 October 2022).
- Huňady, J.; Orviská, M. The Impact of Research and Development Expenditures on Innovation Performance and Economic Growth of the Country–The Empirical Evidence. In Proceedings of the CBU International Conference on Innovation, Technology Transfer and Education, Prague, Czech Republic, 3–5 February 2014. [Google Scholar]
- Savrul, M.; Incekara, A. The Effect of R&D Intensity on Innovation Performance: A Country Level Evaluation. Procedia Soc. Behav. Sci. 2015, 210, 388–396. [Google Scholar]
- Pegkas, P.; Staikouras, C.; Tsamadias, C. Does research and development expenditure impact innovation? Evidence from the European Union countries. J. Policy Model. 2019, 41, 1005–1025. [Google Scholar]
- Dong, Y.; Wei, Z.; Liu, T.; Xing, X. The Impact of R&D Intensity on the Innovation Performance of Artificial Intelligence Enterprises- Based on the Moderating Effect of Patent Portfolio. Sustainability 2020, 13, 328. [Google Scholar] [CrossRef]
- Lv, L.; Yin, Y.; Wang, Y. The Impact of R&D Input on Technological Innovation: Evidence from South Asian and Southeast Asian Countries. Hindawi Discret. Dyn. Nat. Soc. 2020, 2020, 6408654. [Google Scholar] [CrossRef]
- Ren, T. Research on the Influence of University Science and Technology Innovation on Enterprise Performance—Taking Universities and Enterprises in the Yangtze River Basin as an Example, Advances in Economics, Business and Management Research. In Proceedings of the 2021 International Conference on Transformations and Innovations in Business and Education (ICTIBE 2021), Nanjing, China, 19–20 June 2021; Volume 186. [Google Scholar]
- Wang, H.; Yang, C.; Meng, M.; Zeng, Y. Research on the Initiative Scientific Research and Innovation Behavior of Postgraduates: Based on the Theory of Planned Behavior. Front Psychol. 2022, 13, 839981. [Google Scholar] [CrossRef] [PubMed]
- Wang, T.; Shi-Cheng, P.; Xiang-Yan, Z.; Bin, L. Research on the Influence of Innovation Ability on the Level of University Scientific Research: A Case Study of the Nine-University Alliance in China, Emerging Markets Finance and Trade. Emerg. Mark. Finance Trade 2019, 58, 134–144. [Google Scholar] [CrossRef]
- Chen, A.; Li, L.; Li, X.; Zhang, J.; Dong, L. Study on Innovation Capability of College Students Based on Extenics and Theory of Creativity. Procedia Comput. Sci. 2013, 17, 1194–1201. [Google Scholar] [CrossRef] [Green Version]
- Yuan, N. Evaluating the efficiency of scientific research in higher educational institutions: Based on the lagged non-radial super-efficiency DEA model. Manag. Rev. 2016, 28, 86–96. [Google Scholar]
- Edgar, F.; Geare, A. Factors influencing university research performance. Stud. High. Educ. 2013, 38, 774–792. [Google Scholar] [CrossRef]
- Li, M.; Huang, H.; Huang, Y.; Hu, Y. An empirical study on the key elements of training process for postgraduates: Based on a satisfaction survey of postgraduates in China. J. Grad. Educ. 2021, 1, 7–14. [Google Scholar] [CrossRef]
- World Development Indicators. Statistical Bulletin. 2021. Available online: https://data.worldbank.org/ (accessed on 25 July 2022).
- Scimago Institutions Ranking. Best Countries in Research. Available online: https://www.scimagojr.com/countryrank.php (accessed on 25 July 2022).
- Statista. Number of Universities Worldwide by Country. 2021. Available online: https://0-www-statista-com.brum.beds.ac.uk/statistics/918403/number-of-universities-worldwide-by-country/ (accessed on 25 July 2022).
- Statista. Leading Countries by R&D Spending Worldwide. 2022. Available online: https://0-www-statista-com.brum.beds.ac.uk/statistics/732247/worldwide-research-and-development-gross-expenditure-top-countries/ (accessed on 25 July 2022).
- International Labour Organization Statistical Bulletin. Available online: https://labordoc.ilo.org/discovery/fulldisplay?docid=alma991910033402676&context=L&vid=41ILO_INST:41ILO_V1&lang=en&search_scope=MyInst_and_CI&adaptor=Local%20Search%20Engine&tab=Everything&query=sub,exact,Islas%20Salomo%3Fn,AND&mode=advanced (accessed on 25 July 2022).
- Pesaran, M.H. General Diagnostic Tests for Cross-Section Dependence in Panels; Scientific Research Publishing Inc.: Wuhan, China, 2004; p. 1240. [Google Scholar]
- Pesaran, M. A simple panel unit root test in the presence of cross-section dependence. J. Appl. Econom. 2007, 22, 265–312. [Google Scholar] [CrossRef] [Green Version]
- Levin, A.; Lin, C.F.; Chu, C.S.J. Unit root tests in panel data: Asymptotic and finite-sample properties. J. Econom. 2002, 108, 1–24. [Google Scholar] [CrossRef]
- Pradhan, R.P.; Arvin, B.M.; Norman, N.R.; Nishigaki, Y. Does banking sector development affect economic growth and inflation? A panel cointegration and causality approach. Appl. Financ. Econ. 2014, 24, 465–480. [Google Scholar] [CrossRef]
- Arellano, M.; Bond, S. Some test of specification for panel data: Monte Carlo evidence and an application to employment equations. Rev. Econ. Stud. 1991, 58, 277–297. [Google Scholar] [CrossRef] [Green Version]
- Arellano, M.; Bover, O. Another look at the instrumental variable estimation of error-components models. J. Econom. 1995, 68, 29–51. [Google Scholar] [CrossRef]
- Wintoki, M.B.; Linck, J.S.; Netter, J.M. Endogeneity and the dynamics of internal corporate governance. J. Financ. Econom. 2012, 105, 581–606. [Google Scholar] [CrossRef]
- Robert, D.A.; Foote, C. Is China Catching Up to the United States in Innovation? Information Technology and Innovation Foundation: Washington, DC, USA, 2019. [Google Scholar]
- Cai, L. The roles of universities in Chinese regional innovation system—A re-examination of the Triple Helix model: Shape and be Shaped. In Proceedings of the Future Dynamics of Regional Development. Regional Studies Association European Conference, University of Tampere, Tampere, Finland, 5–8 May 2013. [Google Scholar]
- Rasure, E.; Jasperson, H.D. Labour Productivity. Investopedia. 2020. Available online: https://www.investopedia.com/terms/l/labor-productivity.asp (accessed on 6 August 2022).
- Meriküll, J. The Impact of Innovation on Employment: Firm-and Industry-Level Evidence from a Catching-Up Economy. East. Eur. Econ. 2014, 48, 25–38. [Google Scholar] [CrossRef]
Figure 1.
Panel graphical representations of universities’ innovation ability ranking point, research and development funding, number of researchers engaged in research and development, number of colleges and universities, human development index, and per capita income are shown. Source: authors’ computation.

Figure 2.
Panel graphical representations of labor productivity, employment opportunities, income classification of the countries, labor force, capital, and consumption are shown. Source: authors’ computation.
Figure 2.
Panel graphical representations of labor productivity, employment opportunities, income classification of the countries, labor force, capital, and consumption are shown. Source: authors’ computation.


Table 1.
Descriptive statistics of universities’ innovation ability ranking point, research and development funding, number of researchers engaged in research and development, number of colleges and universities, human development index, and per capita income are shown.
Table 1.
Descriptive statistics of universities’ innovation ability ranking point, research and development funding, number of researchers engaged in research and development, number of colleges and universities, human development index, and per capita income are shown.
| INNOVATION ABILITY | R&D | RESEARCHERS | INSTITUTIONS | HDI | PCI | |
|---|---|---|---|---|---|---|
| Mean | 2.282609 | 2.037838 | 2359.022 | 3121.391 | 0.783000 | 7.519261 |
| Median | 1.500000 | 2.295295 | 2224.023 | 3188.500 | 0.819500 | 5.020000 |
| Maximum | 9.000000 | 2.832830 | 4860.880 | 5300.000 | 0.925000 | 28.74000 |
| Minimum | 1.000000 | 0.563240 | 381.6877 | 1014.000 | 0.554000 | 0.884000 |
| Std. Dev. | 2.051157 | 0.726176 | 1565.526 | 1325.697 | 0.132634 | 7.715424 |
| Skewness | 1.847067 | −0.665990 | 0.043755 | −0.205197 | −0.338659 | 1.220982 |
| Kurtosis | 5.400232 | 2.046409 | 1.200166 | 1.589076 | 1.512305 | 3.648011 |
| Jarque–Bera | 37.19817 | 5.143392 | 6.223535 | 4.138331 | 5.121323 | 12.23428 |
| Probability | 0.000000 | 0.076406 | 0.044522 | 0.126291 | 0.077254 | 0.002205 |
| Sum | 105.0000 | 93.74054 | 108515.0 | 143584.0 | 36.01800 | 345.8860 |
| Sum Sq. Dev. | 189.3261 | 23.72991 | 1.1 × 10⁸ | 79086247 | 0.791626 | 2678.750 |
| Observations | 52 | 52 | 52 | 52 | 52 | 52 |
Source: authors’ computation. Note: INNOVATION ABILITY stands for universities’ innovation ability ranking point, R&D stands for research and development funding (% of GDP), RESEARCHERS stand for the number of researchers engaged in research and development (per million people), INSTITUTIONS stand for the number of colleges and universities, HDI stands for human development index, and PCI stands for per capita income (GDP per capita growth, annual %).
Table 2.
Descriptive statistics of labor productivity, employment opportunities, income classification of the countries, labor force, capital, and consumption are shown.
Table 2.
Descriptive statistics of labor productivity, employment opportunities, income classification of the countries, labor force, capital, and consumption are shown.
| PRODUCTIVITY | EMPLOYMENT | INCOME CLASSIFICATION | LOG LABOUR | LOG CAPITAL | LOG CONSUMPTION | |
|---|---|---|---|---|---|---|
| Mean | 35.48753 | 65.08148 | 3.500000 | 19.65289 | 29.44624 | 30.40071 |
| Median | 31.34911 | 6414600 | 3.500000 | 19.64654 | 28.95607 | 30.26799 |
| Maximum | 73.86869 | 75.35500 | 4.000000 | 20.50015 | 31.42065 | 31.53288 |
| Minimum | 3.200347 | 55.97900 | 3.000000 | 18.74534 | 28.41008 | 29.50689 |
| Std. Dev. | 29.18536 | 5.555927 | 0.505076 | 0.810791 | 0.961637 | 0.512712 |
| Skewness | 0.075049 | 0.267926 | 1.17 × 10⁻¹⁶ | −0.002163 | 0.939339 | 0.767600 |
| Kurtosis | 1.136544 | 1.974885 | 1.000000 | 1.013243 | 2.281303 | 2.848558 |
| Jarque–Bera | 7.281247 | 2.787497 | 8.333333 | 8.223379 | 8.429075 | 4.957861 |
| Probability | 0.026236 | 0.248143 | 0.015504 | 0.016380 | 0.014779 | 0.083833 |
| Sum | 1774.377 | 3254.074 | 175.0000 | 982.6444 | 1472.312 | 1520.036 |
| Sum Sq. Dev. | 41737.49 | 1512.548 | 12.50000 | 32.21176 | 45.31254 | 12.88082 |
| Observations | 52 | 52 | 52 | 52 | 52 | 52 |
Source: authors’ computation. Note: PRODUCTIVITY (as the annual growth rate of labor productivity) stands for labor productivity, EMPLOYMENT (as employment rate) stands for employment opportunities, INCOME CLASSIFICATION stands for income classification of the countries, LOG_LABOUR stands for the log of labor force, LOG_CAPITAL stands for the log of capital, and LOG_CONSUMPTION stands for the log of consumption.
Table 3.
Correlation analysis with innovation ability as the dependent variable.
| Variable | Innovation Ability | R&D | Researchers | Institutions | HDI | PCI |
|---|---|---|---|---|---|---|
| INNOVATION ABILITY | 1.0000 | |||||
| R&D | 0.8846 | 1.0000 | ||||
| RESEARCHERS | 0.2012 | 0.2057 | 1.0000 | |||
| INSTITUTIONS | 0.7309 | 0.7437 | 0.0167 | 1.0000 | ||
| HDI | 0.7916 | 0.6648 | 0.1453 | 0.9081 | 1.0000 | |
| PCI | 0.2111 | 0.4473 | 0.2211 | 0.5304 | 0.4486 | 1.0000 |
Source: authors’ computation.
Table 4.
Correlation analysis with productivity as the dependent variable.
| Variable | Productivity | Innovation Ability | LOG LABOUR | LOG CAPITAL | LOG CONSUMPTION |
|---|---|---|---|---|---|
| PRODUCTIVITY | 1.0000 | ||||
| INNOVATION ABILITY | 0.7107 | 1.0000 | |||
| LOG_LABOUR | 0.8671 | 0.5301 | 1.0000 | ||
| LOG_CAPITAL | 0.5391 | 0.1288 | 0.6283 | 1.0000 | |
| LOG_CONSUMPTION | 0.1597 | 0.4406 | 0.4335 | 0.7916 | 1.0000 |
Source: authors’ computation.
Table 5.
Correlation analysis with employment as the dependent variable.
| Variable | Employment | Innovation Ability | LOG LABOUR | LOG CAPITAL | LOG CONSUMPTION |
|---|---|---|---|---|---|
| EMPLOYMENT | 1.0000 | ||||
| INNOVATION ABILITY | 0.7976 | 1.0000 | |||
| LOG_LABOUR | 0.8323 | 0.5501 | 1.0000 | ||
| LOG_CAPITAL | 0.2544 | −0.1188 | 0.6183 | 1.0000 | |
| LOG_CONSUMPTION | −0.2106 | −0.4306 | 0.3335 | 0.8916 | 1.0000 |
Source: authors’ computation.
Table 6.
Correlation analysis with income classification as the dependent variable.
| Variable | Income Classification | INNOVATION ABILITY | LOG LABOUR | LOG CAPITAL | LOG CONSUMPTION |
|---|---|---|---|---|---|
| INCOME_CLASSIFICATION | 1.0000 | ||||
| INNOVATION ABILITY | 0.8144 | 1.0000 | |||
| LOG_LABOUR | −0.8003 | 0.5201 | 1.0000 | ||
| LOG_CAPITAL | 0.5766 | 0.2188 | 0.7183 | 1.0000 | |
| LOG_CONSUMPTION | 0.3838 | 0.5306 | 0.4335 | 0.8714 | 1.0000 |
Source: authors’ computation.
Table 7.
Pesaran (2004) test for cross-sectional dependence results.
| Panels | Statistic | d.f | Prob. |
|---|---|---|---|
| INNOVATION ABILITY | −1.534 | 1 | 0.125 |
| R&D | 3.62 | 1 | 0.000 * |
| RESEARCHERS | 0.111 | 1 | 0.912 |
| INSTITUTIONS | 4.059 | 1 | 0.000 * |
| HDI | 5.041 | 1 | 0.000 * |
| PCI | 0.649 | 1 | 0.516 |
| PRODUCTIVITY | 4.893 | 1 | 0.000 * |
| EMPLOYMENT | 4.502 | 1 | 0.000 * |
| INCOME CLASSIFICATION | 0.126 | 1 | 0.333 |
| LOG_LABOUR | 4.593 | 1 | 0.000 * |
| LOG_CAPITAL | 4.250 | 1 | 0.000 * |
| LOG_CONSUMPTION | 4.879 | 1 | 0.000 * |
Source: authors’ computation. Notes: The symbol * denotes significance at the 1% level.
Table 8.
Pesaran (2007) CIPS panel unit root test results.
| Panels | CIPS | Lags | Decision |
|---|---|---|---|
| R&D | −3.789 * | 1 | I (0) |
| INSTITUTIONS | −3.855 * | 1 | I (1) |
| HDI | −1.985 * | 1 | I (0) |
| PRODUCTIVITY | 2.864 * | 1 | I (0) |
| EMPLOYMENT | 2.404 ** | 1 | I (1) |
| LOG_LABOUR | −2.038 * | 1 | I (1) |
| LOG_CAPITAL | −3.244 * | 1 | I (0) |
| LOG_CONSUMPTION | −4.081 * | 1 | I (1) |
Source: authors’ computation. Notes: The symbols *, ** indicate significance at the 1%, 5% levels, respectively.
Table 9.
LLC and IPS panel unit root test results.
| Variable | LLC | IPS | Decision | ||
|---|---|---|---|---|---|
| At Level | At First Difference | At Level | At First Difference | ||
| INNOVATION ABILITY | −1.50742 *** | – | −2.4217 ** | – | I (0) |
| RESEARCHERS | −1.35304 *** | – | −3.3633 ** | – | I (0) |
| PCI | 5.39803 * | – | 281.12 * | – | I (0) |
| INCOME CLASSIFICATION | −0.38991 * | – | 1.12613 * | – | I (0) |
Source: authors’ computation. The symbols *, **, and *** indicate significance at the 1%, 5%, and 10% levels, respectively.
Table 10.
Results of Westerlund panel cointegration test.
| With innovation ability as the dependent variable | ||
| Statistic | p-value | |
| Variance ratio | 2.1791 | 0.0147 ** |
| With productivity as the dependent variable | ||
| Statistic | p-value | |
| Variance ratio | 2.0506 | 0.0291 ** |
| With employment as the dependent variable | ||
| Statistic | p-value | |
| Variance ratio | 1.5457 | 0.0611 *** |
| With income classification as the dependent variable | ||
| Statistic | p-value | |
| Variance ratio | 42.9539 | 0.0000 *** |
Source: researchers’ computation. The symbols ** and *** denote significance at the 5%, and 10% levels, respectively. All the models display a trend, except with income classification as the dependent variable.
Table 11.
Dynamic panel data estimation, system GMM model.
| Dependent Variable: Innovation Ability | Coefficient | Std. Err. | Z | p > z | [95% Conf. | Interval] |
|---|---|---|---|---|---|---|
| INNOVATION ABILITYt−1 | 0.4035603 | 0.0298611 | 13.51 | 0.000 * | 0.3450337 | 00.462087 |
| INITIAL INNOVATION ABILITY | −0.232276 | 0.0371445 | −6.25 | 0.000 * | −0.3050778 | −0.1594743 |
| R&D | 3.54932 | 1.587973 | 2.24 | 0.025 ** | 0.4369507 | 6.661689 |
| RESEARCHERS | 0.0018602 | 0.0007383 | 2.52 | 0.012 ** | 0.0004132 | 0.0033072 |
| INSTITUTIONS | 0.0004374 | 0.0001728 | 2.53 | 0.011 ** | 0.0000987 | 0.0007762 |
| HDI | 41.33029 | 34.51451 | 1.20 | 0.231 | −26.31691 | 108.9775 |
| PCI | 0.060568 | 0.0197396 | 3.07 | 0.002 * | 0.0218791 | 0.0992569 |
| AR (1) | −1.24 (0.216) | |||||
| AR (2) | −0.85 (0.397) | |||||
| Sargan test | 45.68 (0.301) | |||||
| Hansen test | 0.00 (0.999) | |||||
Source: authors’ computation. Note: * and ** stand for 1% and 10% levels of significance, respectively. The model is estimated at lag 3.
Table 12.
Dynamic panel data estimation, system GMM model.
| Dependent Variable: Productivity | Coefficient | Std. Err. | z | p > z | [95% Conf. | Interval] |
|---|---|---|---|---|---|---|
| PRODUCTIVITYt−1 | 1.006108 | 0.0709418 | 14.18 | 0.000 * | 0.8670649 | 1.145152 |
| INNOVATION ABILITY | 0.1147107 | 0.0044231 | 25.93 | 0.000 * | 0.1060415 | 0.1233799 |
| LOG_LABOUR | 37.55832 | 0.0628997 | 597.11 | 0.000 * | 37.43504 | 37.6816 |
| LOG_CAPITAL | 0.1007316 | 0.0031791 | 31.69 | 0.000 * | 0.0945007 | 0.1069626 |
| LOG_CONSUMPTION | 0.0431349 | 0.0029495 | 14.62 | 0.000 * | 0.037354 | 0.0489158 |
| AR (1) | −1.29 (0.199) | |||||
| AR (2) | −1.04 (0.300) | |||||
| Sargan test | 45.17 (0.610) | |||||
| Hansen test | 0.00 (0.999) | |||||
Source: authors’ computation. Note: * stands for the 1% level of significance. The model is estimated at lag 2.
Table 13.
Dynamic panel data estimation, system GMM model.
| Dependent Variable: Employment | Coefficient | Std. Err. | z | p > z | [95% Conf. | Interval] |
|---|---|---|---|---|---|---|
| EMPLOYMENTt−1 | 1.13727 | 0.1169305 | 9.73 | 0.000 * | 0.9080904 | 1.36645 |
| INNOVATION ABILITY | 0.4544363 | 0.0154325 | 29.45 | 0.000 * | 0.4241892 | 0.4846834 |
| LOG_LABOUR | −1.638663 | 3.521945 | −46.53 | 0.000 * | −170.7692 | −156.9634 |
| LOG_CAPITAL | 0.0762664 | 0.005853 | 13.03 | 0.000 * | 0.0647947 | 0.0877382 |
| LOG_CONSUMPTION | 0.0554833 | 0.0074854 | 7.41 | 0.000 * | 0.0408122 | 0.0701545 |
| AR (1) | −1.25 (0.211) | |||||
| AR (2) | −1.09 (0.274) | |||||
| Sargan test | 47.89 (0.131) | |||||
| Hansen test | 0.00 (0.999) | |||||
Source: authors’ computation. Note: * stands for the 1% level of significance. The model is estimated at lag 2.
Table 14.
Dynamic panel data estimation, system GMM model.
| Dependent Variable: Income Classification | Coefficient | Std. Err. | z | p > z | [95% Conf. | Interval] |
|---|---|---|---|---|---|---|
| INCOME CLASSIFICATIONt−1 | 0.9779625 | 0.00171 | 571.91 | 0.000 * | 0.974611 | 0.9813141 |
| INNOVATION ABILITY | 0.0001036 | 0.000028 | 3.71 | 0.000 * | 0.0000488 | 0.0001584 |
| LOG_LABOUR | −0.0141461 | 0.0010668 | −13.26 | 0.000 * | −0.016237 | −0.0120552 |
| LOG_CAPITAL | 0.0000084 | 3.5 × 10⁻⁶ | 2.41 | 0.016 ** | 1.58 × 10⁻⁶ | 0.0000153 |
| LOG_CONSUMPTION | 0.0000269 | 6.37 × 10⁻⁶ | 4.22 | 0.000 * | 0.0000144 | 0.0000394 |
| AR (1) | −1.09 (0.289) | |||||
| AR (2) | −0.07 (0.943) | |||||
| Sargan test | 5.59 (0.133) | |||||
| Hansen test | 0.02 (0.899) | |||||
Source: authors’ computation. Note: * and ** stand for 1% and 10% levels of significance. The model is estimated at lag 2.
Publisher’s Note: MDPI stays neutral with regard to jurisdictional claims in published maps and institutional affiliations. |
© 2022 by the authors. Licensee MDPI, Basel, Switzerland. This article is an open access article distributed under the terms and conditions of the Creative Commons Attribution (CC BY) license (https://creativecommons.org/licenses/by/4.0/).
Share and Cite
MDPI and ACS Style
Chen, C.; Abbasi, B.N.; Sohail, A. Scientific Research of Innovation Ability of Universities in the United States of America and China. Sustainability 2022, 14, 14586. https://0-doi-org.brum.beds.ac.uk/10.3390/su142114586
AMA Style
Chen C, Abbasi BN, Sohail A. Scientific Research of Innovation Ability of Universities in the United States of America and China. Sustainability. 2022; 14(21):14586. https://0-doi-org.brum.beds.ac.uk/10.3390/su142114586
Chicago/Turabian StyleChen, Chunlian, Babar Nawaz Abbasi, and Ali Sohail. 2022. "Scientific Research of Innovation Ability of Universities in the United States of America and China" Sustainability 14, no. 21: 14586. https://0-doi-org.brum.beds.ac.uk/10.3390/su142114586
Note that from the first issue of 2016, this journal uses article numbers instead of page numbers. See further details here.