
Methodology for Improving the Sustainability of Industrial Buildings via Matrix of Combinations Water and Carbon Footprint Assessment


Abstract
:1. Introduction
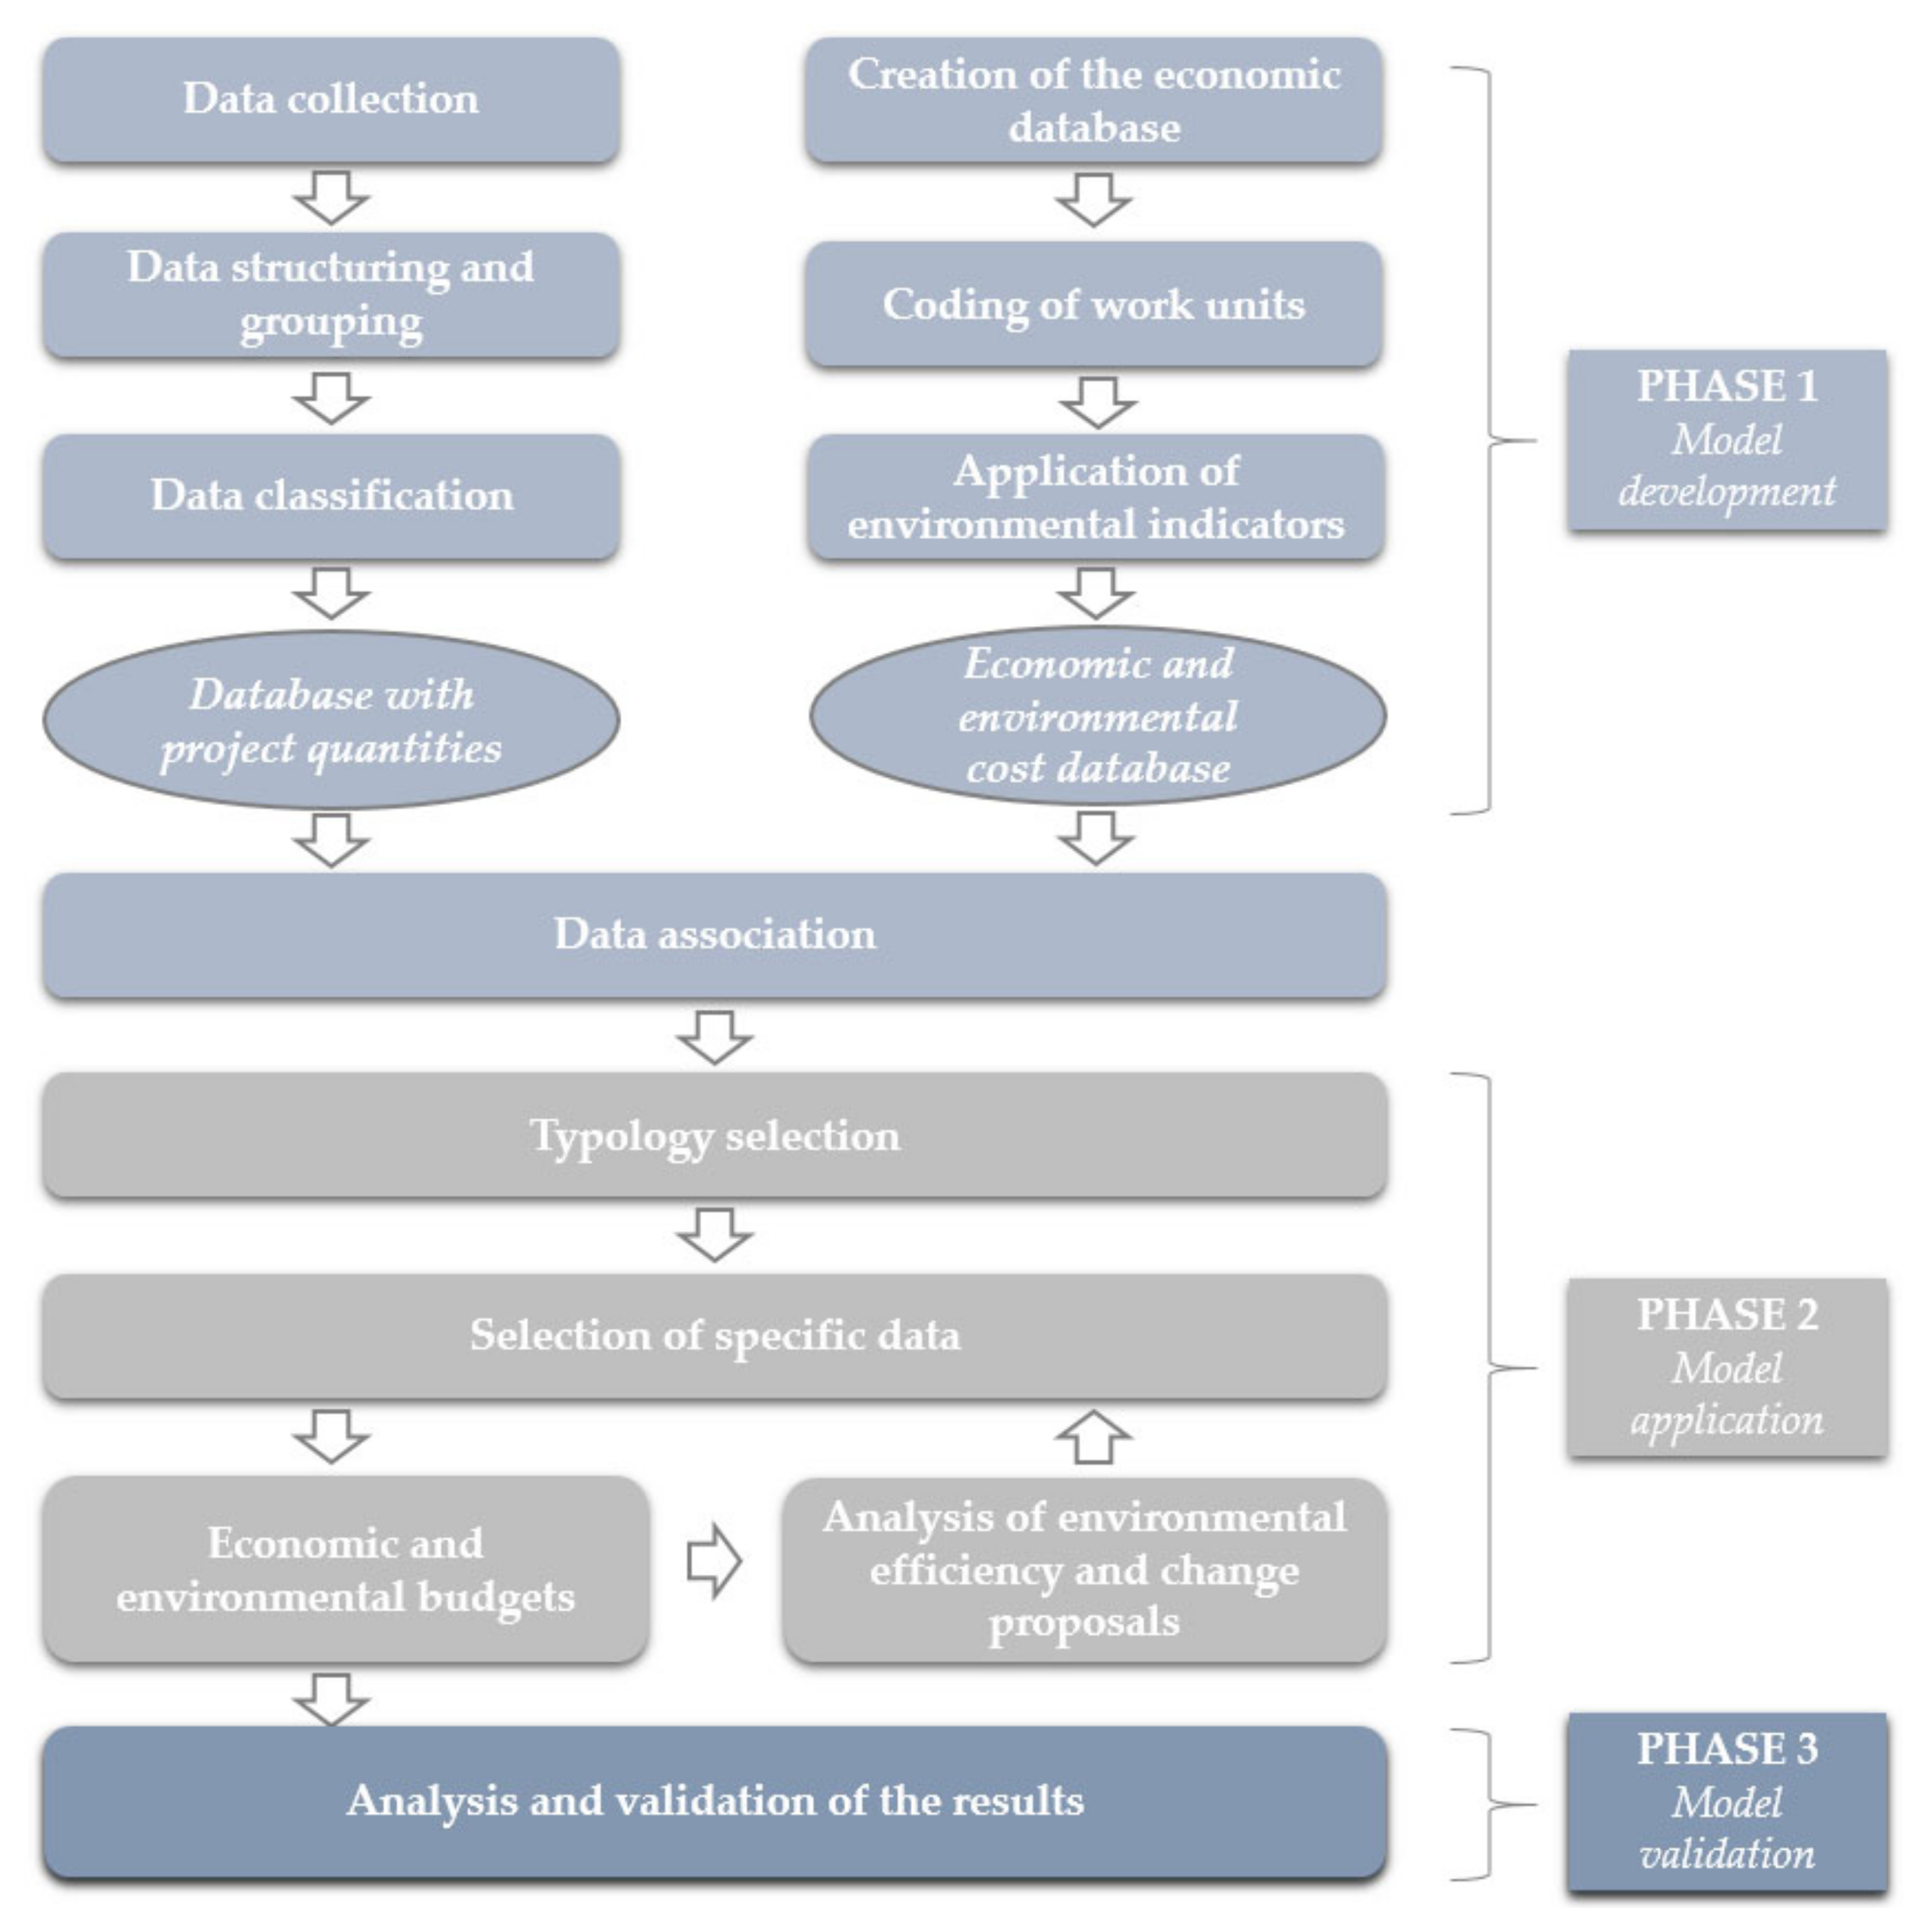
2. Research Methodology
2.1. Model Development
2.1.1. Project Quantities Database
2.1.2. Economic and Environmental Cost Database
- IMAT = environmental impact of building material (kgCO2eq/kg, m3water/kg)
- UMAT = unit impact of manufacture per kg of material (kgCO2eq/kg, m3water/kg)
- UTRAN = unit impact of transport per kg of material (kgCO2eq/kg, m3water/kg)
- Ci = consumption of building material i (kg).
2.1.3. Data Association
2.2. Model Application—Case Studies
- Land conditioning: land transport, maximum distance 5 km, loading with mechanical means
- Foundations: wooden formwork
- Sanitation: buried collector with polyethylene pipe 200 mm
- Structures: prestressed beams, ceramic vault
- Façade: masonry with prefabricated alveolar panels of prestressed concrete and walls of reinforced concrete blocks, 50 × 20 × 25 cm. Interior partitions of double hollow brick 9 cm thick
- Roofs: cement tiles
- Installations: VRF inverter unit with roof terminal, black steel pipes of diameter 3/8”, PE-X water pipes with diameter 25 mm and 2.5 mm thick, bathroom appliances: stainless steel sink with drainer, vitrified porcelain toilet, and pedestal sink 0.60 m × 0.50 m
- Insulation: acoustic 40 mm rigid fiberglass panel partitions, 40 mm fiberglass-insulated floors, 30 mm projected polyurethane thermal insulation façade, and floors with 20 mm rigid panels of expanded polystyrene
- Finishes: cementitious paint on exterior, synthetic enamel paint in interior. Industrial flooring with high mechanical and chemical resistance and flooring in small areas with 30 × 30 cm ceramic tiles. Ceilings with plaster plates, with a removable system and exposed lattice. Ceramic tile sill of 14 × 28 cm. Other finishes with 14 × 28 cm ceramic tiles;
- Carpentry and security: sliding stainless-steel windows (1.50–3 m2). Galvanized steel folding doors (1.50–3 m2);
- Glazing: glazing double-panel and low-emissivity windows of 4 mm and 6 mm thickness
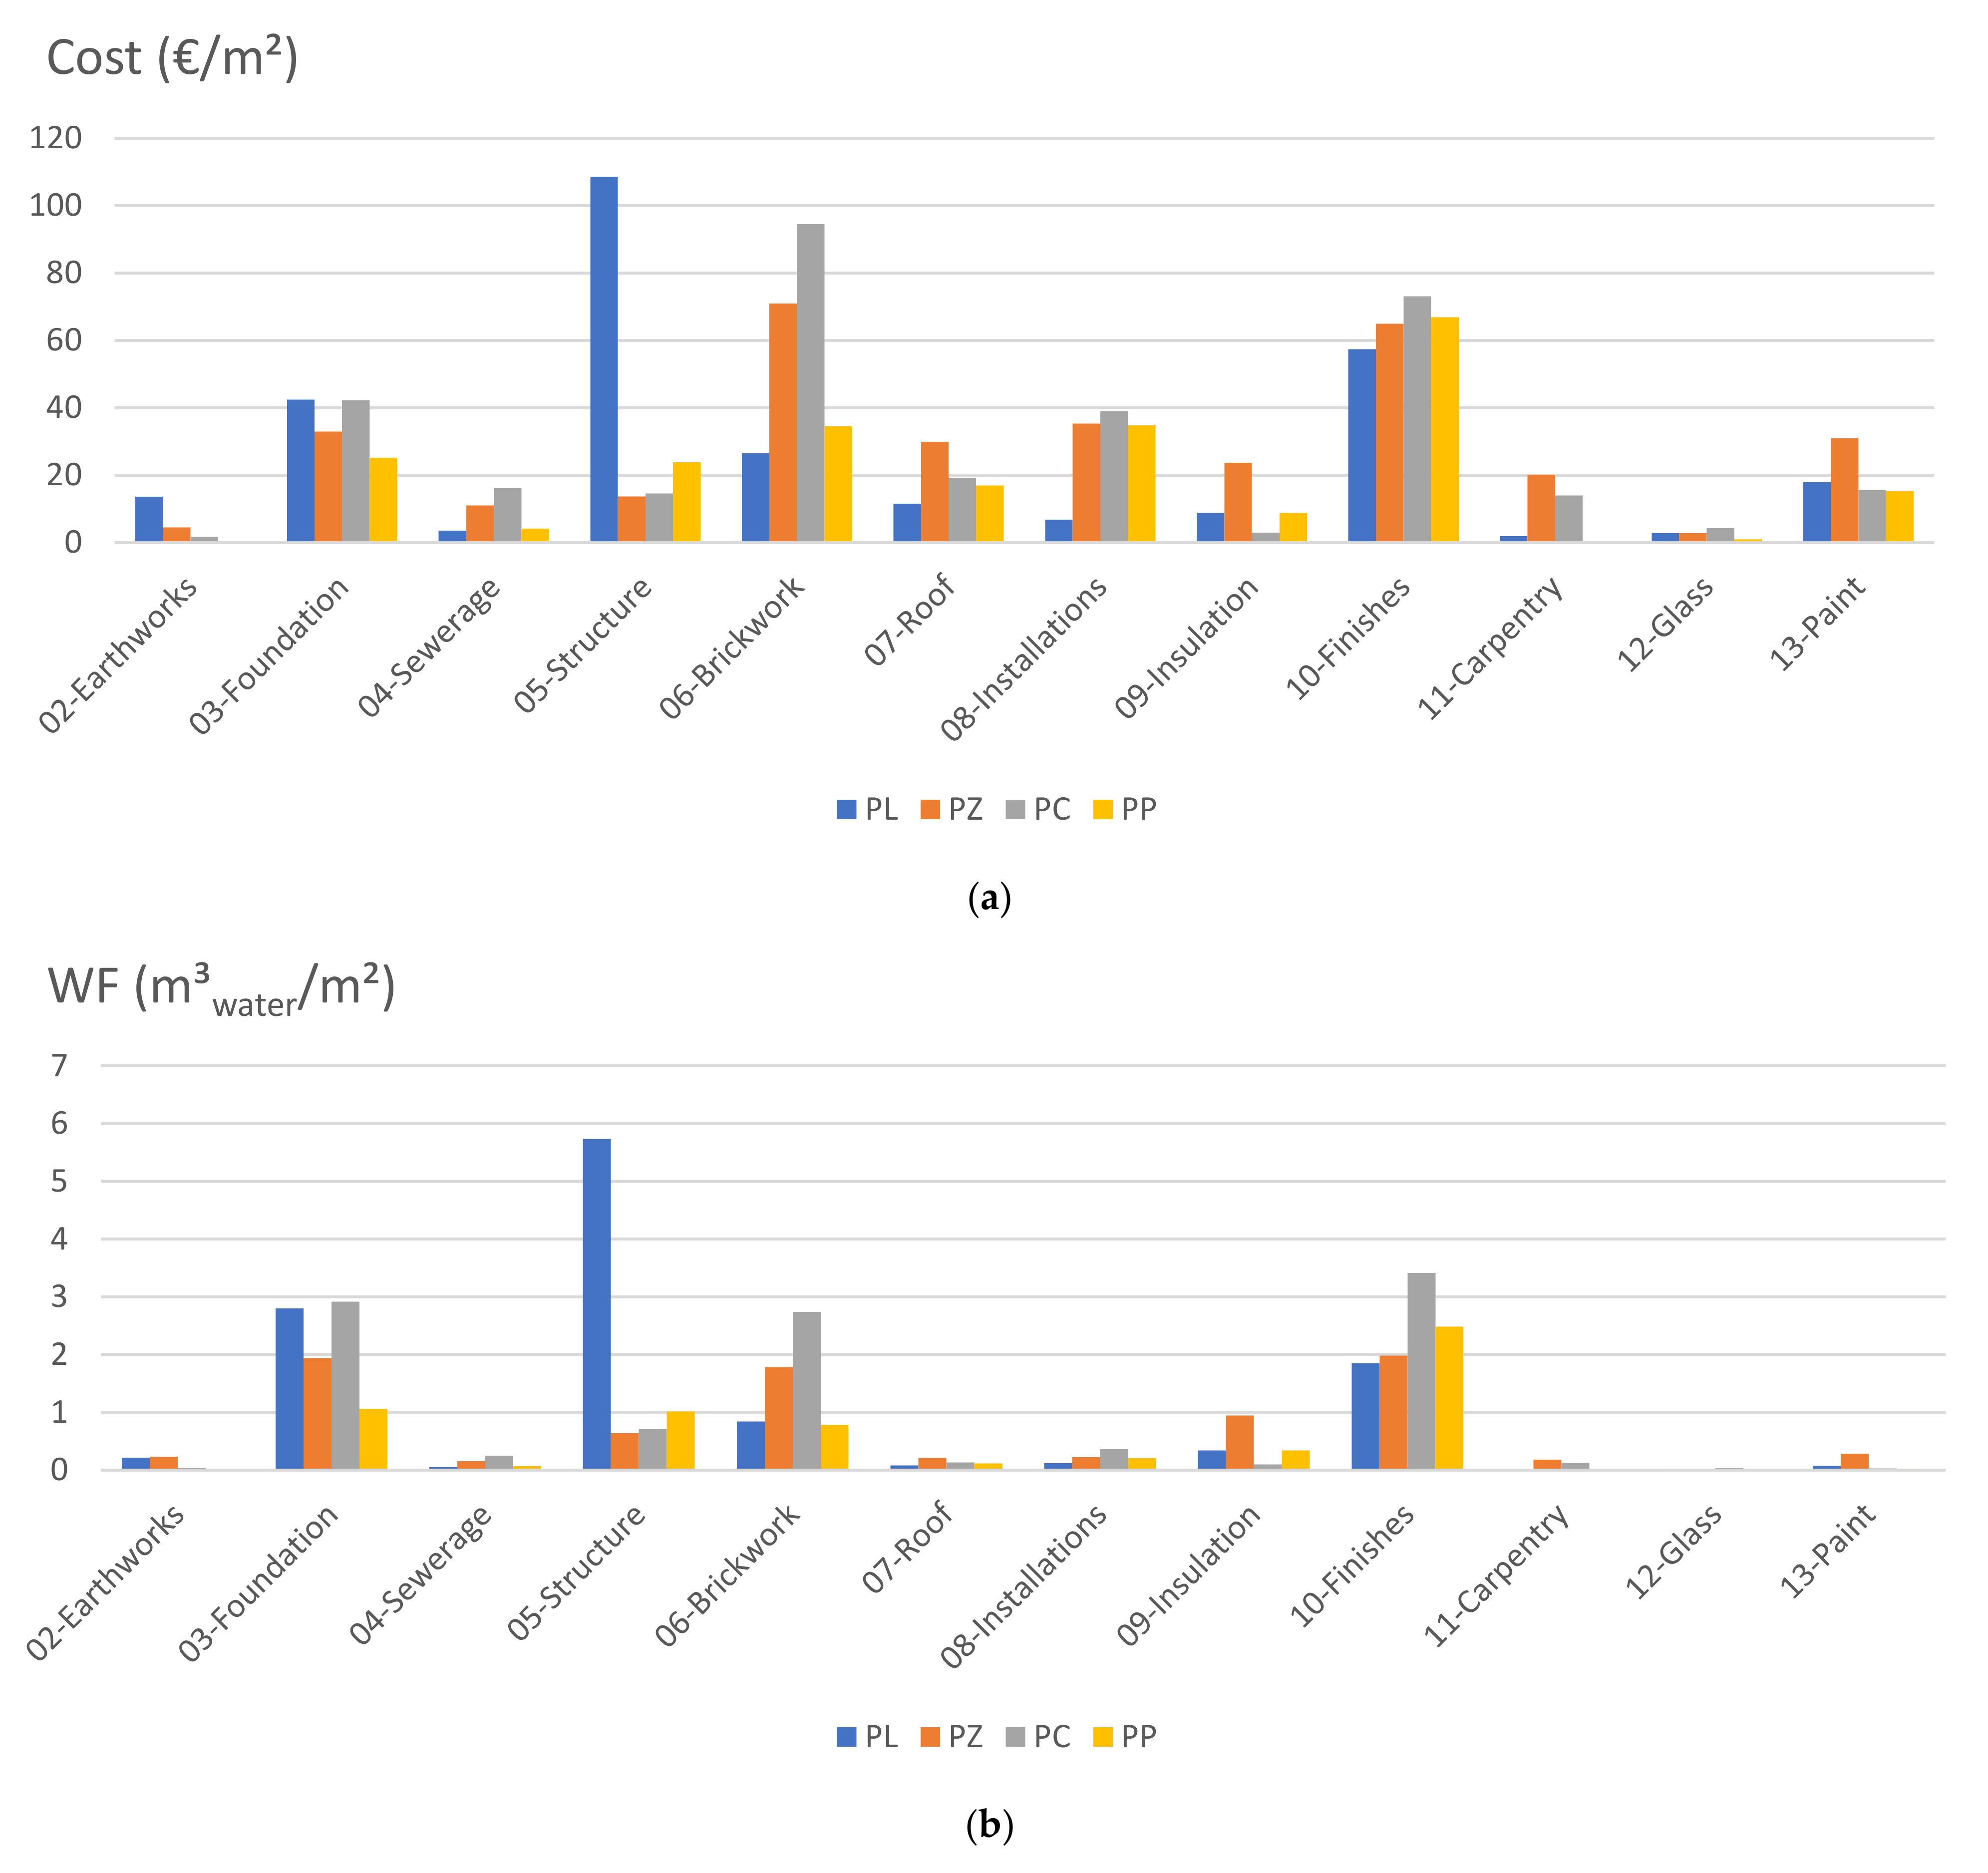
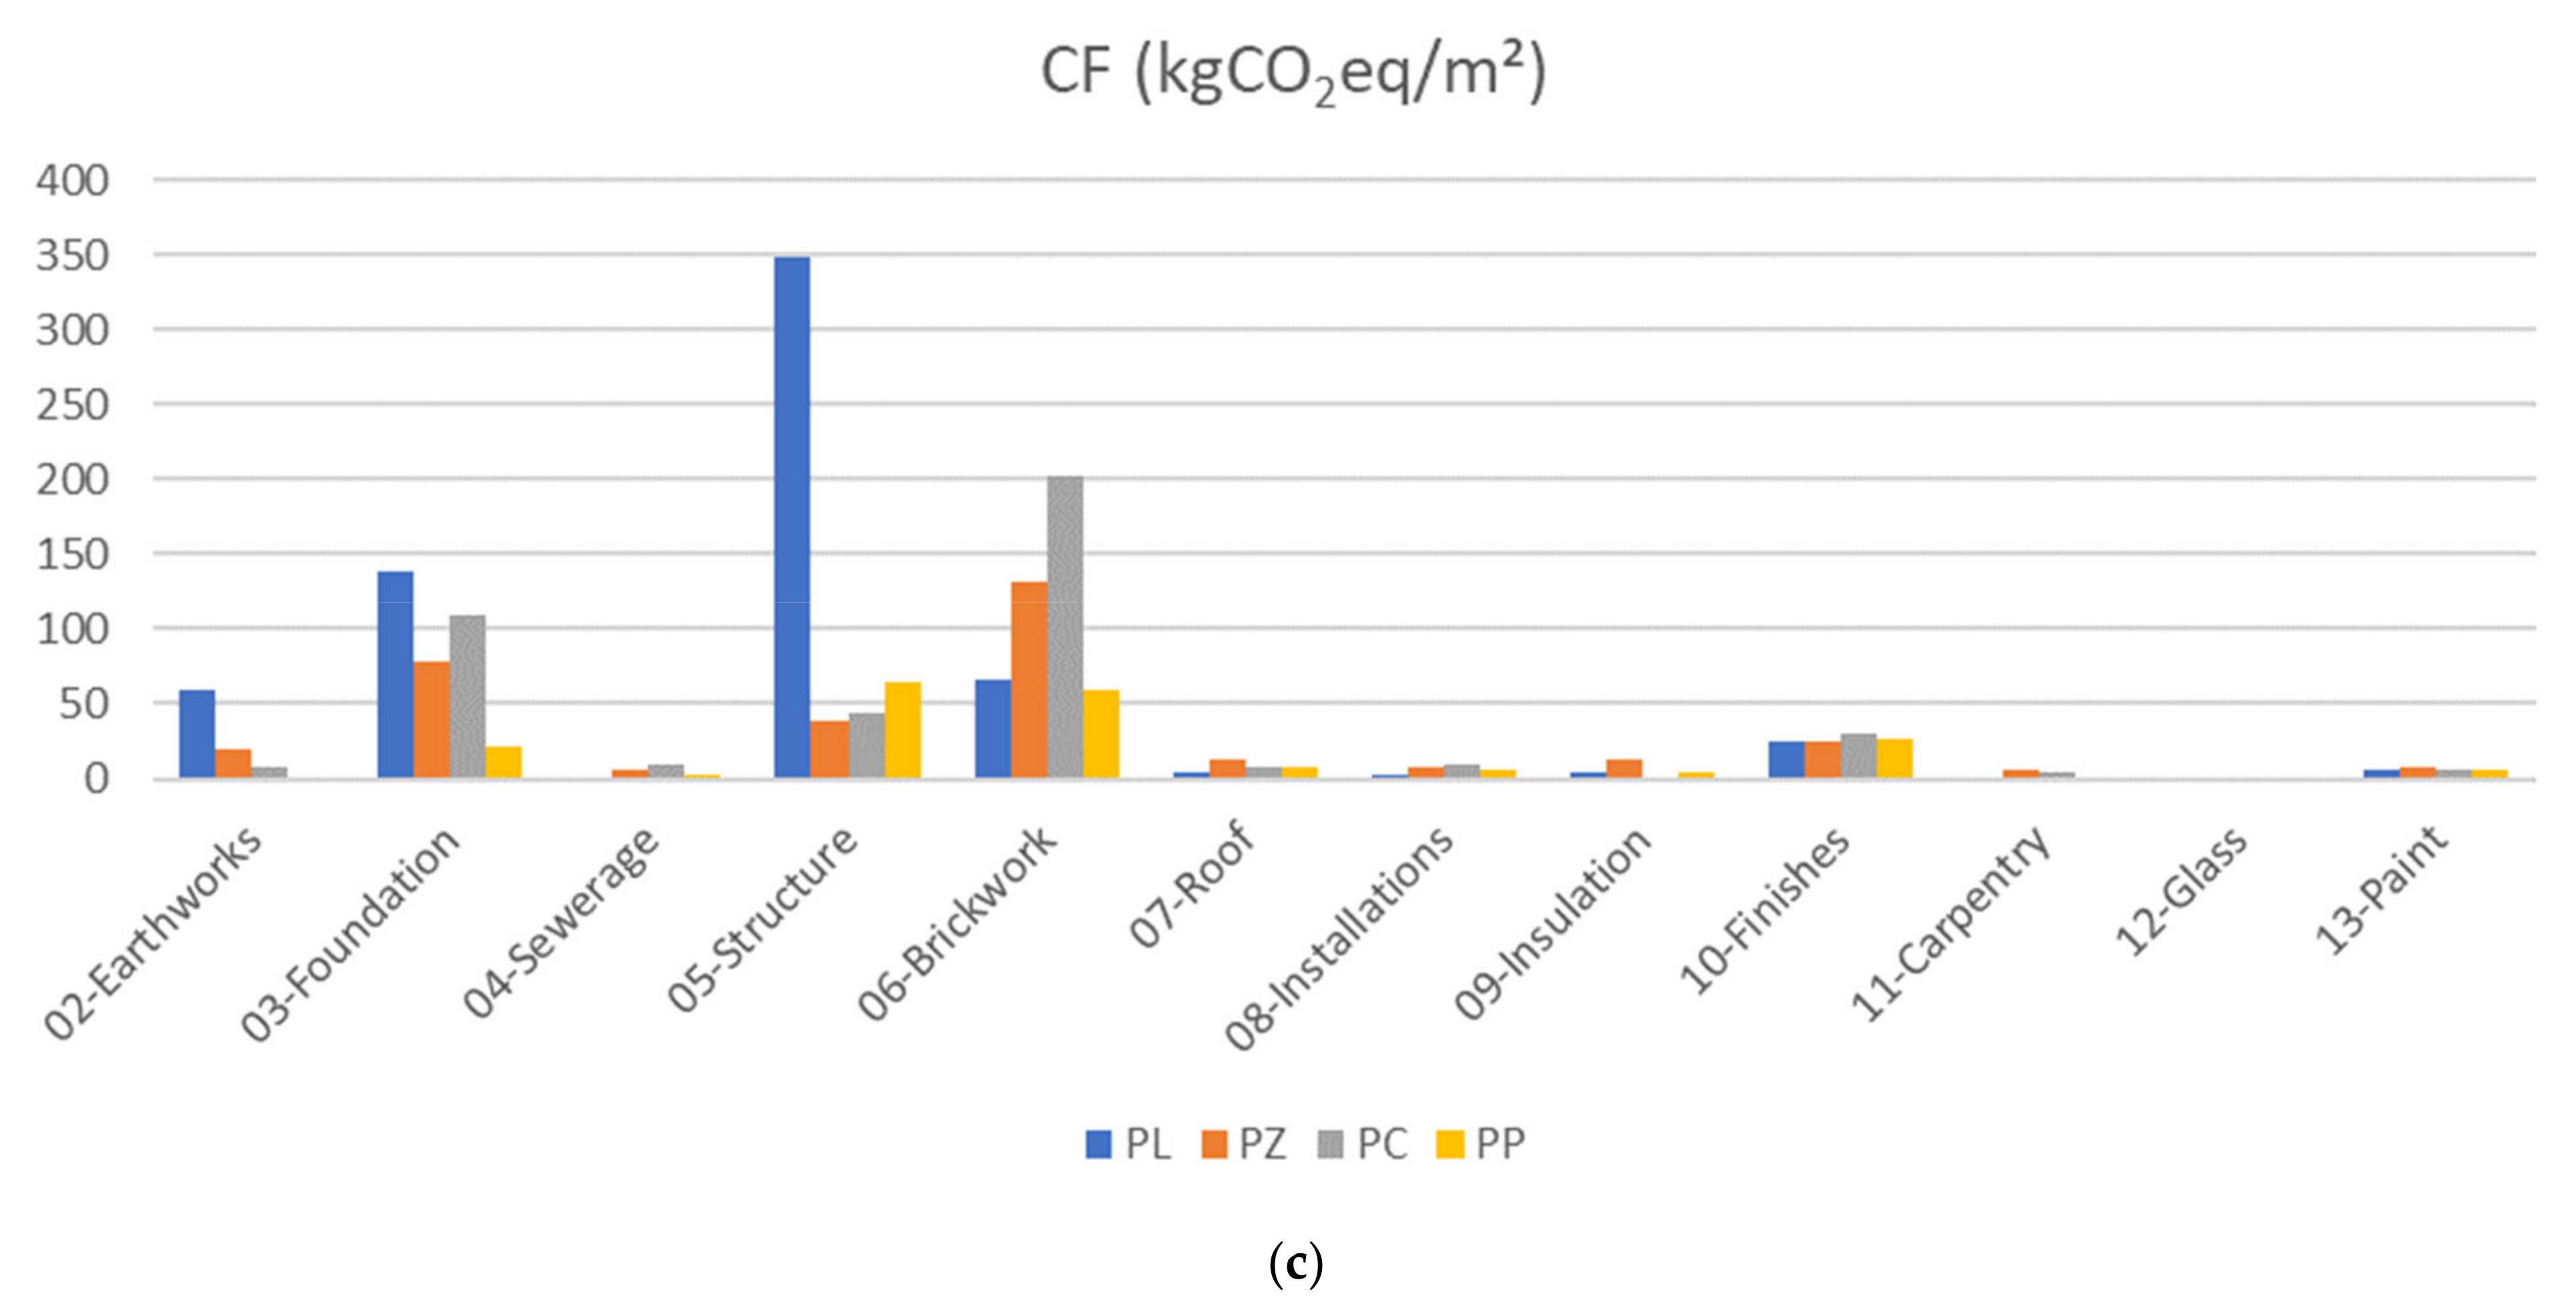
3. Results and Discussions
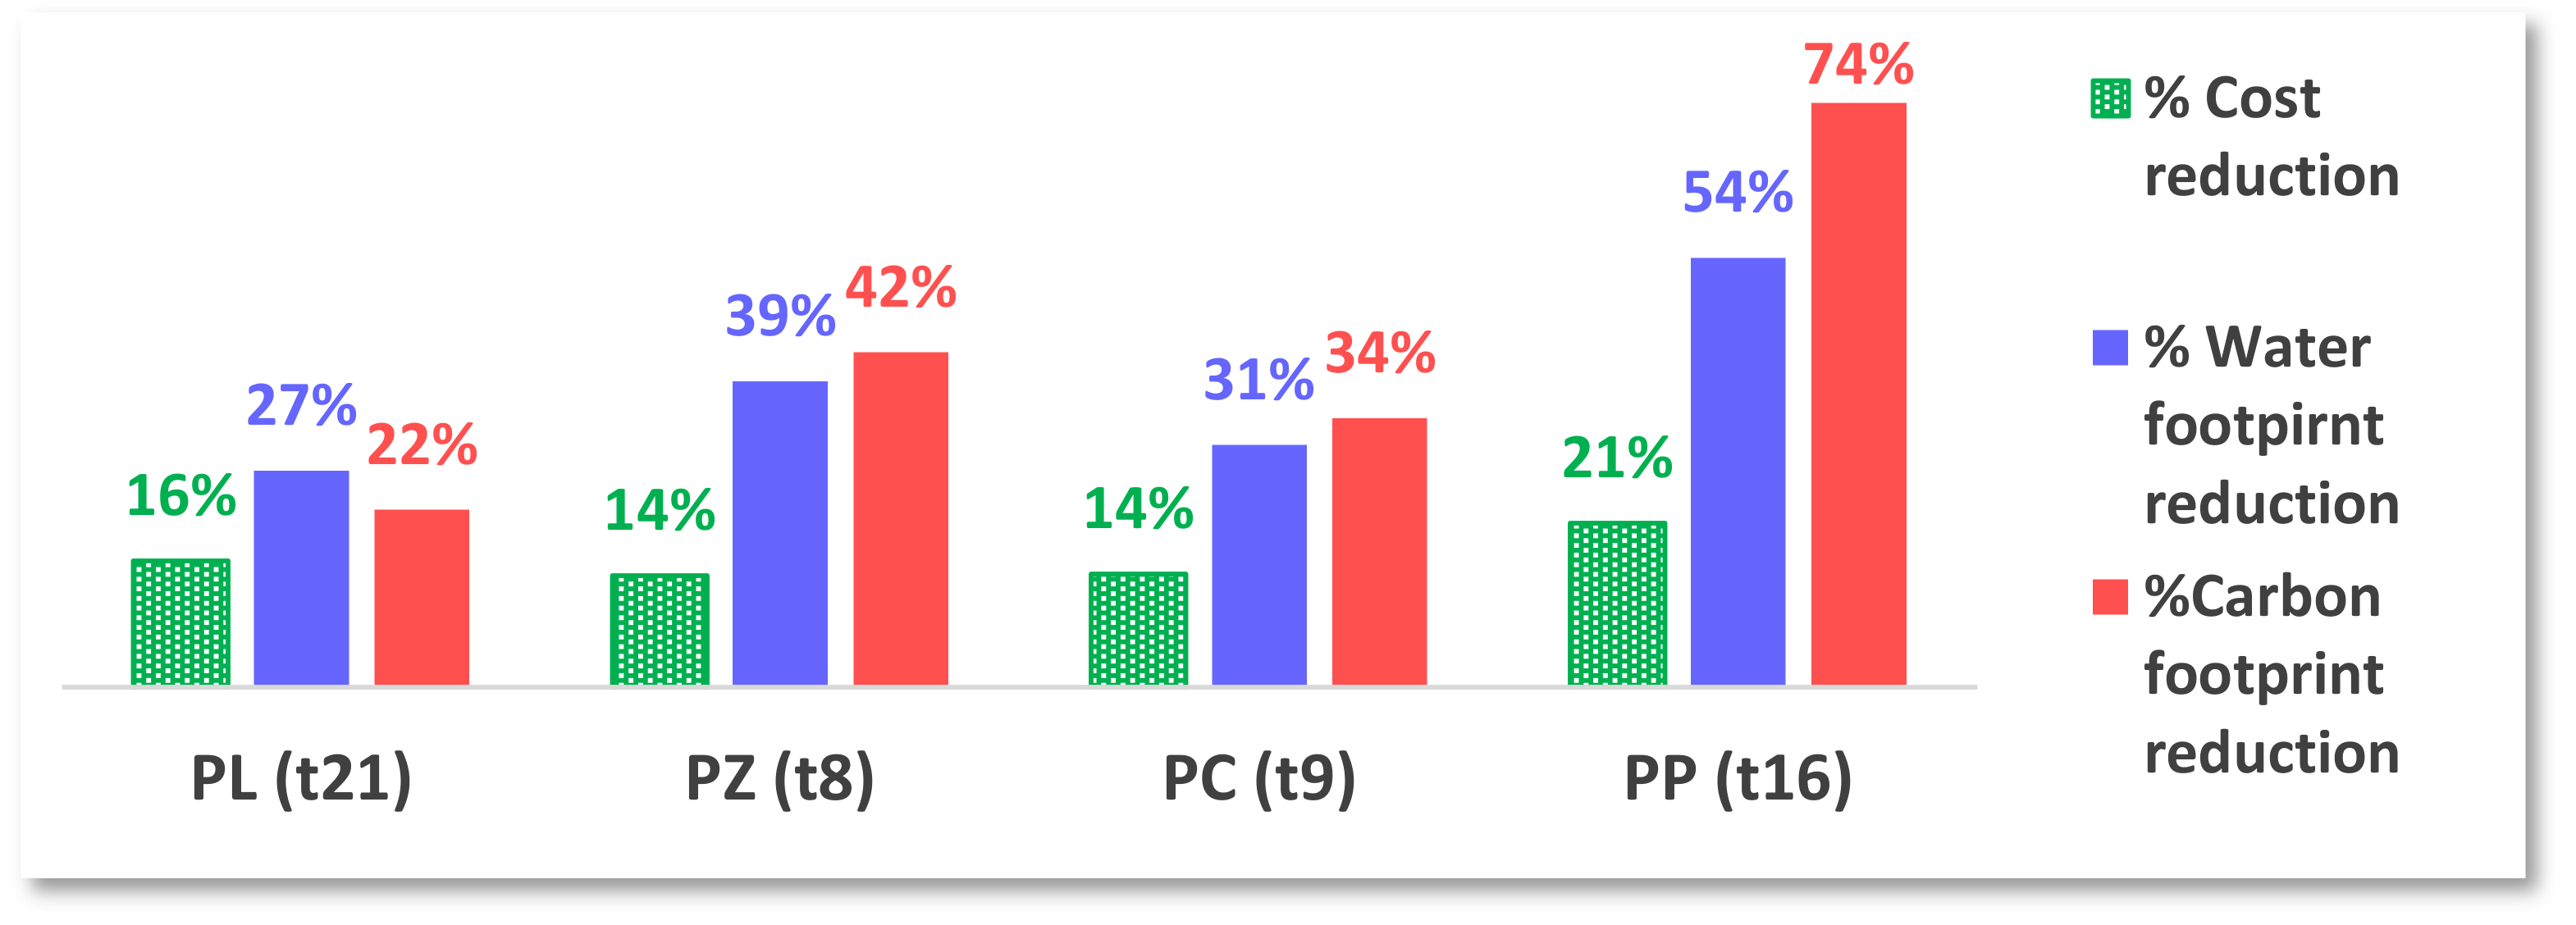
- The project with pile foundation (typology 16) had the lowest environmental and financial impacts due to its type of foundation, which had less reinforcement and concrete.
- The foundation projects of isolated footings (typology 8) and trenches (typology 9) had the highest costs per constructed area. However, this was not due to their foundation, but because their walls were made of concrete blocks requiring high labor consumption. As for WF, the biggest impact was from ceramics, sills, and flooring. The total CF was focused on elements that carry concrete and steel, especially in the foundation with reinforced concrete.
- The slab-type foundation project (typology 21) had reinforced concretes in the foundation and structure, in addition to hot-rolled steel elements. These elements were responsible for generating the highest environmental impact in both WF and CF among the four projects studied. As for the economic aspect, this project had the second lowest cost per m2, because of little brick/block work in the walls.
4. Conclusions
Author Contributions
Funding
Institutional Review Board Statement
Informed Consent Statement
Conflicts of Interest
Appendix A. Matrix of Carbon Footprint per Budget Classification, Dark Colors Represent Higher Impacts
| Chapter | Work Unit/Project | 1 | 2 | 3 | 4 | 5 | 6 | 7 | 8 | 9 | 10 | 11 | 12 | 13 | 14 | 15 | 16 | 17 | 18 | 19 | 20 | 21 | 22 | Average |
| 02-Earthworks | Excavations | 0.972 | ||||||||||||||||||||||
| Filled | 0.381 | |||||||||||||||||||||||
| Transport | 7.936 | |||||||||||||||||||||||
| 03-Foundations | Rebar | 5.365 | ||||||||||||||||||||||
| Piles | 1.173 | |||||||||||||||||||||||
| Formwork | –1.167 | |||||||||||||||||||||||
| Reinforced concrete | 111.782 | |||||||||||||||||||||||
| Concrete | 23.221 | |||||||||||||||||||||||
| 04-Sewerage | Manholes and wells | 3.924 | ||||||||||||||||||||||
| Collectors | 1.354 | |||||||||||||||||||||||
| Downspouts | 0.351 | |||||||||||||||||||||||
| 05-Structures | Hot-rolled steel | 52.840 | ||||||||||||||||||||||
| Cold rolled steel | 1.233 | |||||||||||||||||||||||
| Forged steel | 15.676 | |||||||||||||||||||||||
| Steel Rebar | 0.584 | |||||||||||||||||||||||
| Formwork | –0.053 | |||||||||||||||||||||||
| Reinforced concrete | 250.261 | |||||||||||||||||||||||
| Structural wood | –0.010 | |||||||||||||||||||||||
| 06-Brick work | Walls Blocks | 32.405 | ||||||||||||||||||||||
| Partition (chamber) | 0.064 | |||||||||||||||||||||||
| Partition (walls) | 0.499 | |||||||||||||||||||||||
| Int. Brick work | 3.503 | |||||||||||||||||||||||
| Precast concrete | 92.186 | |||||||||||||||||||||||
| 07-Roofs | Pitched roof | 10.023 | ||||||||||||||||||||||
| 08-Installations | A/C and DHW | 1.655 | ||||||||||||||||||||||
| A/C ducts | 0.103 | |||||||||||||||||||||||
| Circuits | 0.214 | |||||||||||||||||||||||
| Derivations | 0.090 | |||||||||||||||||||||||
| Points of light | 0.104 | |||||||||||||||||||||||
| Power outlets | 0.250 | |||||||||||||||||||||||
| Grounding conductor | 0.305 | |||||||||||||||||||||||
| Water pipes | 0.183 | |||||||||||||||||||||||
| Sanitary appliances | 3.496 | |||||||||||||||||||||||
| 09-Insulation | Acoustic insulation | 0.338 | ||||||||||||||||||||||
| Thermal Insulation | 4.906 | |||||||||||||||||||||||
| 10-Finishes | Plastered | 0.184 | ||||||||||||||||||||||
| Ceramic flooring | 2.444 | |||||||||||||||||||||||
| Light screeds | 19.053 | |||||||||||||||||||||||
| Ceilings | 0.500 | |||||||||||||||||||||||
| Windowsills | 2.458 | |||||||||||||||||||||||
| 11-Carpentry and security | Steel bar | 3.852 | ||||||||||||||||||||||
| 12-Glass | Glazing | 0.752 | ||||||||||||||||||||||
| 13-Paints | Exterior | 4.657 | ||||||||||||||||||||||
| Interior | 3.212 |
Appendix B. Matrix of Water Footprint per Budget Classification, Dark Colors Represent Higher Impacts
| Chapter | Work Unit/Project | 1 | 2 | 3 | 4 | 5 | 6 | 7 | 8 | 9 | 10 | 11 | 12 | 13 | 14 | 15 | 16 | 17 | 18 | 19 | 20 | 21 | 22 | Average |
| 02-Earthworks | Excavations | 3.51 × 10⁻³ | ||||||||||||||||||||||
| Filled | 3.27 × 10⁻² | |||||||||||||||||||||||
| Transport | 2.87 × 10⁻² | |||||||||||||||||||||||
| 03-Foundations | Rebar | 9.95 × 10⁻² | ||||||||||||||||||||||
| Piles | 1.93 × 10⁻² | |||||||||||||||||||||||
| Formwork | 7.10 × 10⁻¹ | |||||||||||||||||||||||
| Reinforced concrete | 1.71 | |||||||||||||||||||||||
| Concrete | 3.47 × 10⁻¹ | |||||||||||||||||||||||
| 04-Sewerage | Manholes and wells | 3.61 × 10⁻² | ||||||||||||||||||||||
| Collectors | 6.64 × 10⁻² | |||||||||||||||||||||||
| Downspouts | 6.10 × 10⁻² | |||||||||||||||||||||||
| 05-Structures | Hot-rolled steel | 1.50 | ||||||||||||||||||||||
| Cold rolled steel | 3.50 × 10⁻² | |||||||||||||||||||||||
| Forged steel | 2.57 × 10⁻¹ | |||||||||||||||||||||||
| Steel Rebar | 1.08 × 10⁻² | |||||||||||||||||||||||
| Formwork | 2.89 × 10⁻² | |||||||||||||||||||||||
| Reinforced concrete | 3.74 | |||||||||||||||||||||||
| Structural wood | 5.84 × 10⁻³ | |||||||||||||||||||||||
| 06-Brick work | Walls Blocks | 4.41 × 10⁻¹ | ||||||||||||||||||||||
| Partition (chamber) | 3.96 × 10⁻⁴ | |||||||||||||||||||||||
| Partition (walls) | 3.23 × 10⁻³ | |||||||||||||||||||||||
| Int. Brick work | 2.17 × 10⁻² | |||||||||||||||||||||||
| Precast concrete | 1.27 | |||||||||||||||||||||||
| 07-Roofs | Pitched roof | 1.56 × 10⁻¹ | ||||||||||||||||||||||
| 08-Installations | A/C and DHW | 4.41 × 10⁻² | ||||||||||||||||||||||
| A/C ducts | 3.72 × 10⁻³ | |||||||||||||||||||||||
| Circuits | 3.29 × 10⁻² | |||||||||||||||||||||||
| Derivations | 1.40 × 10⁻² | |||||||||||||||||||||||
| Points of light | 1.46 × 10⁻² | |||||||||||||||||||||||
| Power outlets | 3.64 × 10⁻² | |||||||||||||||||||||||
| Grounding conductor | 2.77 × 10⁻² | |||||||||||||||||||||||
| Water pipes | 4.68 × 10⁻³ | |||||||||||||||||||||||
| Sanitary appliances | 8.75 × 10⁻² | |||||||||||||||||||||||
| 09-Insulation | Acoustic insulation | 8.93 × 10⁻³ | ||||||||||||||||||||||
| Thermal Insulation | 3.44 × 10⁻¹ | |||||||||||||||||||||||
| 10-Finishes | Plastered | 3.30 × 10⁻³ | ||||||||||||||||||||||
| Ceramic flooring | 7.73 × 10⁻² | |||||||||||||||||||||||
| Light screeds | 1.13 | |||||||||||||||||||||||
| Ceilings | 8.00 × 10⁻³ | |||||||||||||||||||||||
| Windowsills | 7.63 × 10⁻¹ | |||||||||||||||||||||||
| 11-Carpentry and security | Steel bar | 1.10 × 10⁻¹ | ||||||||||||||||||||||
| 12-Glass | Glazing | 3.13 × 10⁻² | ||||||||||||||||||||||
| 13-Paints | Exterior | 1.81 × 10⁻² | ||||||||||||||||||||||
| Interior | 3.49 × 10⁻¹ |
Appendix C. Matrix of Cost Impact per Budget Classification, Dark Colors Represent Higher Impacts
| Chapter | Work Unit/Project | 1 | 2 | 3 | 4 | 5 | 6 | 7 | 8 | 9 | 10 | 11 | 12 | 13 | 14 | 15 | 16 | 17 | 18 | 19 | 20 | 21 | 22 | Average |
| 02-Earthworks | Excavations | 0.37 | ||||||||||||||||||||||
| Filled | 0.08 | |||||||||||||||||||||||
| Transport | 1.68 | |||||||||||||||||||||||
| 03-Foundations | Rebar | 4.37 | ||||||||||||||||||||||
| Piles | 1.18 | |||||||||||||||||||||||
| Formwork | 4.58 | |||||||||||||||||||||||
| Reinforced concrete | 30.12 | |||||||||||||||||||||||
| Concrete | 6.32 | |||||||||||||||||||||||
| 04-Sewerage | Manholes and wells | 4.85 | ||||||||||||||||||||||
| Collectors | 3.82 | |||||||||||||||||||||||
| Downspouts | 1.62 | |||||||||||||||||||||||
| 05-Structures | Hot-rolled steel | 40.92 | ||||||||||||||||||||||
| Cold rolled steel | 1.49 | |||||||||||||||||||||||
| Forged steel | 7.00 | |||||||||||||||||||||||
| Steel Rebar | 0.48 | |||||||||||||||||||||||
| Formwork | 0.09 | |||||||||||||||||||||||
| Reinforced concrete | 58.58 | |||||||||||||||||||||||
| Structural wood | 0.05 | |||||||||||||||||||||||
| 06-Brick work | Walls Blocks | 33.22 | ||||||||||||||||||||||
| Partition (chamber) | 0.03 | |||||||||||||||||||||||
| Partition (walls) | 0.39 | |||||||||||||||||||||||
| Int. Brick work | 1.59 | |||||||||||||||||||||||
| Precast concrete | 30.88 | |||||||||||||||||||||||
| 07-Roofs | Pitched roof | 22.49 | ||||||||||||||||||||||
| 08-Installations | A/C and DHW | 24.72 | ||||||||||||||||||||||
| A/C ducts | 0.49 | |||||||||||||||||||||||
| Circuits | 0.77 | |||||||||||||||||||||||
| Derivations | 0.25 | |||||||||||||||||||||||
| Points of light | 0.39 | |||||||||||||||||||||||
| Power outlets | 1.15 | |||||||||||||||||||||||
| Grounding conductor | 2.32 | |||||||||||||||||||||||
| Water pipes | 0.69 | |||||||||||||||||||||||
| Sanitary appliances | 2.68 | |||||||||||||||||||||||
| 09-Insulation | Acoustic insulation | 0.70 | ||||||||||||||||||||||
| Thermal Insulation | 8.42 | |||||||||||||||||||||||
| 10-Finishes | Plastered | 0.43 | ||||||||||||||||||||||
| Ceramic flooring | 1.82 | |||||||||||||||||||||||
| Light screeds | 56.65 | |||||||||||||||||||||||
| Ceilings | 1.20 | |||||||||||||||||||||||
| Windowsills | 2.95 | |||||||||||||||||||||||
| 11-Carpentry and security | Steel bar | 12.28 | ||||||||||||||||||||||
| 12-Glass | Glazing | 3.98 | ||||||||||||||||||||||
| 13-Paints | Exterior | 12.32 | ||||||||||||||||||||||
| Interior | 21.42 |
Appendix D. Quantities of Work Units in the Four Typologies. U Refers to the Unit of Measurement of the Basic Element
| Code | Concept | Unit | PL | PZ | PC | PP |
| 02EX | Excavations | m3 | 2.9621 | 0.8927 | 0.3736 | 0.0700 |
| 02RR | Filled | m3 | 0.0000 | 0.4750 | 0.0386 | 0.0100 |
| 02TX | Transport | m3 | 7.4052 | 2.2318 | 0.9340 | 0.0638 |
| 03AX | Rebar | kg | 4.2974 | 6.4032 | 6.6761 | 0.1500 |
| 03CP | Piles | m | 0.1085 | 0.1085 | 0.1085 | 0.2400 |
| 03EX | Formwork | m2 | 0.2854 | 0.2854 | 0.9682 | 0.2854 |
| 03HA | Reinforced concrete | m3 | 0.8542 | 0.2956 | 0.2498 | 0.0902 |
| 03HM | Concrete in mass | m3 | 0.0255 | 0.0274 | 0.0193 | 0.0100 |
| 04EA | Manholes and wells | or | 0.0039 | 0.0169 | 0.0385 | 0.0100 |
| 04EC | Collectors | m | 0.1898 | 0.5212 | 0.3758 | 0.0800 |
| 04VB | Downspouts | m | 0.0000 | 0.0000 | 0.1155 | 0.0400 |
| 05AC | Hot-rolled steel | kg | 16.8300 | 1.4283 | 1.3716 | 0.0000 |
| 05AF | Cold rolled steel | kg | 0.0000 | 0.0000 | 0.0000 | 0.0000 |
| 05FX | Forged | m2 | 1.1686 | 0.2191 | 0.4212 | 0.6600 |
| 05HA | Steel rebar | m2 | 0.0000 | 0.0000 | 0.0000 | 4.7800 |
| 05HE | Formwork | m2 | 0.0000 | 0.0000 | 0.0000 | 0.0000 |
| 05WF | Reinforced concrete | m3 | 0.3886 | 0.0620 | 0.0770 | 0.1000 |
| 05MX | Structural wood | m3 | 0.0000 | 0.0000 | 0.0000 | 0.0000 |
| 06BZ | Walls blocks | m2 | 0.2178 | 0.8125 | 0.8125 | 0.4454 |
| 06DX | Partition (chamber) | m2 | 0.0000 | 0.0000 | 0.0000 | 0.0000 |
| 06DY | Partition (walls) | m2 | 0.0414 | 0.0280 | 0.1033 | 0.0000 |
| 06LX | Ext. brick work | m2 | 0.2178 | 0.2994 | 0.2994 | 0.2994 |
| 06LY | Int. brick work | m2 | 0.4512 | 0.1129 | 0.1392 | 0.1129 |
| 06LZ | Brick walls | m2 | 0.9877 | 0.9877 | 0.9877 | 0.9877 |
| 06PA | Prefabricated metal | m2 | 0.6070 | 0.8238 | 0.6070 | 1.2000 |
| 06PH | Prefabricated concrete | m2 | 1.6124 | 2.7474 | 4.8602 | 1.0600 |
| 07HX | Horizontal covers | m2 | 0.0905 | 0.0905 | 0.1424 | 0.0905 |
| 07IX | Sloping roofs | m2 | 0.9934 | 2.5710 | 1.6400 | 1.4600 |
| 08CA | A/C and DHW | unit | 0.0001 | 0.0021 | 0.0021 | 0.0021 |
| 08CC | A/C ducts | m | 0.0416 | 0.0416 | 0.0416 | 0.0416 |
| 08EC | Circuits | m | 0.0000 | 0.0000 | 0.2792 | 0.0000 |
| 08ED | Derivations | m | 0.0000 | 0.0000 | 0.0000 | 0.0000 |
| 08EL | Points of light | unit | 0.0000 | 0.0000 | 0.0513 | 0.0000 |
| 08ET | Power outlets | unit | 0.0286 | 0.0286 | 0.0256 | 0.0286 |
| 08EP | Grounding conductor | m | 0.1021 | 0.1021 | 0.1021 | 0.1021 |
| 08FF | Water piles | m | 0.0777 | 0.0777 | 0.1604 | 0.0777 |
| 08FS | Sanitary appliances | unit | 0.0104 | 0.0208 | 0.0320 | 0.0088 |
| 09AX | Acoustic insulation | m2 | 0.0740 | 0.0740 | 0.0740 | 0.0740 |
| 09TX | Thermal insulation | m2 | 0.6441 | 3.6304 | 0.3592 | 0.6441 |
| 10AA | Tiled | m2 | 0.1132 | 0.0962 | 0.2280 | 0.0962 |
| 10AC | Plated | m2 | 0.1260 | 0.5399 | 0.3462 | 0.5399 |
| 10CE | Plastered | m2 | 0.6510 | 1.3421 | 1.3421 | 1.3421 |
| 10CG | Trim | m2 | 0.0000 | 0.0000 | 0.0691 | 0.0000 |
| 10SC | Ceramic flooring | m2 | 0.3894 | 0.1148 | 0.1148 | 0.1148 |
| 10SN | Natural stone flooring | m2 | 0.1182 | 0.1182 | 0.4100 | 0.1182 |
| 10SX | Light screeds | m2 | 0.8623 | 0.8623 | 0.8623 | 0.8623 |
| 10SY | Light heavy rigs | m2 | 0.9358 | 2.8566 | 0.9358 | 1.3400 |
| 10SZ | Heavy screeds | m2 | 1.6268 | 0.9790 | 2.0600 | 0.9790 |
| 10TX | False ceilings | m2 | 0.3042 | 0.0778 | 0.0382 | 0.0778 |
| 10RX | Finishes | m | 0.0768 | 0.0768 | 0.4520 | 0.1312 |
| 11AX | Carpentry steel | m2 | 0.0242 | 0.2488 | 0.1734 | 0.0036 |
| 11LX | Aluminium carpentry | m2 | 0.0424 | 0.0330 | 0.1436 | 0.0800 |
| 11MX | Wood carpentry | m2 | 0.0160 | 0.0128 | 0.0128 | 0.0128 |
| 12XX | Glazing | m2 | 0.0567 | 0.0567 | 0.1738 | 0.0400 |
| 13EX | Exterior paintings | m2 | 0.8193 | 0.8193 | 0.8193 | 0.8193 |
| 13IX | Interior paintings | m2 | 0.7844 | 2.1344 | 0.1382 | 0.0383 |
References
- Architecture 2030. Roadmap to Zero Emissions. 2014. Available online: https://architecture2030.org/wp-content/uploads/2018/12/Roadmap-to-Zero-Emissions.pdf (accessed on 20 August 2022).
- UN Environment Programme. Global Status Report 2018. 2018. Available online: https://www.unep.org/resources/report/global-status-report-2018 (accessed on 24 September 2022).
- Pasanen, P.; Sipari, A.; Terranova, E.; Castro, R.; Bruce-Hyrkas, T. The Embodied Carbon Review—Embodied Carbon Reduction 100+ Regulations and Rating Systems Globally; Bionova Ltd.: Hertfordshire, UK, 2018. [Google Scholar]
- European Parliament and of the Council. Regulation (EU) 2018/841 of the European Parliament and of the Council of 30 May 2018 on the Inclusion of Greenhouse Gas Emissions and Removals from Land Use, Land Use Change and Forestry in the 2030 Climate and Energy Framework, and Amending Regulation (EU) No 525/2013 and Decision No 529/2013/EU; European Parliament and of the Council: Brussels, Belgium, 2018. [Google Scholar]
- Statista. Porcentaje de Participación en el Producto Interior Bruto (PIB) de los Sectores Económicos de España de 2008 a 2020. 2021. Available online: https://es.statista.com/estadisticas/501643/distribucion-del-producto-interior-bruto-pib-de-espana-por-sectores-economicos/ (accessed on 20 August 2022).
- Marrero, M.; Rivero-Camacho, C.; Martínez-Rocamora, A.; Alba-Rodríguez, M.D.; Solís-Guzmán, J. Life Cycle Assessment of Industrial Building Construction and Recovery Potential. Case Studies in Seville. Processes 2022, 10, 76. [Google Scholar] [CrossRef]
- San-José Lombera, J.T.; Cuadrado Rojo, J. Industrial building design stage based on a system approach to their environmental sustainability. Constr. Build. Mater. 2010, 24, 438–447. [Google Scholar] [CrossRef]
- Bonamente, E.; Cotana, F. Carbon and energy footprints of prefabricated industrial buildings: A systematic life cycle assessment analysis. Energies 2015, 8, 12685–12701. [Google Scholar] [CrossRef] [Green Version]
- Heravi, G.; Fathi, M.; Faeghi, S. Evaluation of sustainability indicators of industrial buildings focused on petrochemical projects. J. Clean. Prod. 2015, 109, 92–107. [Google Scholar] [CrossRef]
- Opher, T.; Duhamel, M.; Posen, I.D.; Panesar, D.K.; Brugmann, R.; Roy, A.; Zizzo, R.; Sequeira, L.; Anvari, A.; MacLean, H.L. Life cycle GHG assessment of a building restoration: Case study of a heritage industrial building in Toronto, Canada. J. Clean. Prod. 2021, 279, 123819. [Google Scholar] [CrossRef]
- Kovacic, I.; Waltenbereger, L.; Gourlis, G. Tool for life cycle analysis of facade-systems for industrial buildings. J. Clean. Prod. 2016, 130, 260–272. [Google Scholar] [CrossRef]
- Ruiz-Pérez, M.R.; Alba-Rodríguez, M.D.; Rivero-Camacho, C.; Solís-Guzmán, J.; Marrero, M. The budget as a basis for ecological management of urbanization projects. Case study in Seville, Spain. Sustainability 2021, 13, 4078. [Google Scholar] [CrossRef]
- Bare, J.C.; Hofstetter, P.; Pennington, D.W.; Udo de Haes, H.A. Midpoints versus endpoints: The sacrifices and benefits. Int. J. Life Cycle Assess. 2000, 5, 319–326. [Google Scholar] [CrossRef] [Green Version]
- Weidema, B.P.; Thrane, M.; Christensen, P.; Schmidt, J.; Løkke, S. Carbon Footprint. J. Ind. Ecol. 2008, 12, 3–6. [Google Scholar] [CrossRef]
- Geng, R.; Mansouri, S.; Aktas, E. The relationship between green supply chain management and performance: A meta-analysis of empirical evidences in Asian emerging economies. Int. J. Prod. Econ. 2017, 183, 245–258. [Google Scholar] [CrossRef]
- Dossche, C.; Boel, V.; de Corte, W. Use of life cycle assessments in the construction sector: Critical review. Procedia Eng. 2017, 171, 302–311. [Google Scholar] [CrossRef]
- Chastas, P.; Theodosiou, T.; Kontoleon, K.J.; Bikas, D. Normalising and assessing carbon emissions in the building sector: A review on the embodied CO2 emissions of residential buildings. Build. Environ. 2018, 130, 212–226. [Google Scholar] [CrossRef]
- Hoekstra, A.Y.; Chapagain, A.K.; Aldaya, M.M.; Mekonnen, M.M. Water Footprint Manual: State of the Art 2009. 2009. Available online: researchgate.net (accessed on 2 August 2022).
- WFN Organization. Water Footprint Network [WWW Document]. 2020. Available online: https://waterfootprint.org/en/ (accessed on 19 June 2022).
- ISO/TC 207/SC 5; ISO 14046:2014 Specifies Principles, Requirements and Guidelines Related to Water Footprint Assessment of Products, Processes and Organizations Based on Life Cycle Assessment (LCA). ISO Publishing: Geneve, Switzerland, 2014.
- UNEP United Nations Environment Programme. UNEP 2006 Annual Report; UNEP: Athens, Greece, 2006. [Google Scholar]
- Beltran, M.J.; Velazquez, E. The Political Ecology of Virtual Water and Water Footprint. Reflections on the Need for a Critical Analysis of the Indicators of Virtual Water Flows in the Economy. Int. J. Urban Reg. Res. 2015, 39, 1020–1036. [Google Scholar] [CrossRef]
- Velázquez, E.; Madrid, C.; Beltrán, M.J. Rethinking Concepts of Virtual Water and Water Footprint in Relation to the Production–Consumption Binomial and the Water–Energy Nexus. Water Resour. Manag. 2011, 25, 743–761. [Google Scholar] [CrossRef]
- Crawford, R.; Pullen, S. Life Cycle Water Analysis of a Residential Building and Its Occupants. Build. Res. Inf. 2011, 39, 589–602. [Google Scholar] [CrossRef]
- Bardhan, S. Assessment of Water Resource Consumption in Building Construction in India. Ecosyst. Sustain. Dev. 2011, 144, 1743–3541. [Google Scholar] [CrossRef] [Green Version]
- Han, M.Y.; Chen, G.Q.; Meng, J.; Wu, X.D.; Alsaedi, A.; Ahmad, B. Virtual Water Accounting for a Building Construction Engineering Project with Nine Sub-Projects: A Case in E-Town, Beijing. J. Clean. Prod. 2016, 112, 4691–4700. [Google Scholar] [CrossRef]
- Heravi, G.; Abdolvand, M.M. Assessment of Water Consumption during Production of Material and Construction Phases of Residential Building Projects. Sustain. Cities Soc. 2019, 51, 101785. [Google Scholar] [CrossRef]
- Chang, Y.; Huang, Z.; Ries, R.J.; Masanet, E. The embodied air pollutant emissions and water footprints of buildings in China: A quantification using disaggregated input-output life cycle inventory model. J. Clean. Prod. 2016, 113, 274–284. [Google Scholar] [CrossRef]
- Ruiz Pérez, M.R.; Alba Rodríguez, M.D.; Marrero Meléndez, M. The water footprint of city naturalisation. Evaluation of the water balance of city gardens. Ecol. Model. 2020, 424, 109031. [Google Scholar] [CrossRef]
- Abanda, F.H.; Oti, A.H.; Tah, J.H.M. Integrating BIM and new rules of measurement for embodied energy and CO2 assessment. J. Build. Eng. 2017, 12, 288–305. [Google Scholar] [CrossRef] [Green Version]
- Freire-Guerrero, A.; Alba-Rodríguez, M.D.; Marrero, M. A budget for the ecological footprint of buildings is possible: A case study using the dwelling construction cost database of Andalusia. Sustain. Cities Soc. 2019, 51, 101737. [Google Scholar] [CrossRef]
- Rivero-Camacho, C.; Martín-Del-Río, J.J.; Solís-Guzmán, J.; Marrero, M. Ecological Footprint of the Life Cycle of Buildings. In Environmental Footprints and Eco-Design of Products and Processes; Springer: Berlin/Heidelberg, Germany, 2021; pp. 1–39. [Google Scholar] [CrossRef]
- CYPE Ingenieros, S.A. Construction Cost Generator. Spain. 2022. Available online: http://www.generadordeprecios.info/#gsc.tab=0 (accessed on 24 September 2022).
- Orden PCI/86/2019, de 31 de Enero, por la que se Publica el Acuerdo del Consejo de Ministros de 7 de Diciembre de 2018, por el que se Aprueba el Plan de Contratación Pública Ecológica de la Administración General del Estado, sus Organismos Autónomos y las Entidades Gestoras de la Seguridad Social (2018–2025). Ministerio de la Presidencia, Relaciones con las Cortes e Igualdad, Madrid. 2019. Available online: https://www.boe.es/boe/dias/2019/02/04/pdfs/BOE-A-2019-1394.pdf (accessed on 24 September 2022).
- BCCA. Consejería de Fomento y Vivienda/Vivienda y Rehabilitación/Base de Costes de la Construcción de Andalucía (BCCA). 2021. Available online: https://www.juntadeandalucia.es/organismos/fomentoarticulaciondelterritorioyvivienda/areas/vivienda-rehabilitacion/planes-instrumentos/paginas/bcca-dic-2021.html (accessed on 24 September 2022).
- BEDEC. 2019. Available online: https://itec.es/servicios/bedec/?gclid=EAIaIQobChMI_uimlvyv-wIVxOR3Ch0RKw1_EAAYASAAEgKp1_D_BwE (accessed on 24 September 2022).
- Marrero, M.; Ramirez-de-Arellano, A. The building cost system in Andalusia: Application to construction and demolition waste management. Constr. Manag. Econ. 2010, 28, 495–507. [Google Scholar] [CrossRef]
- Real Decreto 1098/2001. Reglamento de la Ley de Contratos del Sector Público. s.l.:s.n. 2001. Available online: https://www.boe.es/eli/es/rd/2001/10/12/1098 (accessed on 24 September 2022).
- Instituto Eduardo Torroja de ciencias de la construcción (IETcc). Catálogo de Elementos Constructivos del CTE. 2010. Available online: https://itec.cat/cec/ (accessed on 11 August 2022).
- Pre Sustainability. SimaPro 8. 2016. Available online: https://pre-sustainability.com/legacy/download/SimaPro8Introduction-ToLCA.pdf (accessed on 11 August 2022).
- Frischknecht, R.; Jungbluth, N.; Althaus, H.-J.; Doka, G.; Dones, R.; Heck, T.; Hellweg, S.; Hischier, R.; Nemecek, T.; Rebitzer, G. The ecoinvent database: Overview and methodological framework (7 pp). Int. J. Life Cycle Assess. 2005, 10, 3–9. [Google Scholar] [CrossRef]
- Freire Guerrero, A.; Marrero, M. Evaluation of the embodied energy of a construction project using the budget. Habitat SustenTable 2015, 5, 54–63. [Google Scholar]
- Freire-Guerrero, A.; Marrero-Meléndez, M. Ecological Footprint in Indirect Costs of Construction. In Proceedings of the II International Congress on Sustainable Construction and Eco-Efficient Solutions, Seville, Spain, 25–27 May 2015; pp. 969–980. [Google Scholar]
- REE. El sistema eléctrico español/The Spanish electric system. 2014. Available online: https://www.ree.es/sites/default/files/downloadable/inf_sis_elec_ree_2014.pdf (accessed on 10 August 2022).
- De Wolf, C. Material Quantities in Building Structures and their Environmental Impact. Master’s Thesis, Massachusetts Institute of Technology, Boston, MA, USA, 2014. [Google Scholar]
- Solís-Guzmán, J.; Rivero-Camacho, C.; Alba-Rodríguez, D.; Martínez-Rocamora, A. Carbon Footprint Estimation Tool for Residential Buildings for Non-Specialized Users: OERCO2 Project. Sustainability 2018, 10, 1359. [Google Scholar] [CrossRef] [Green Version]
- Martínez-Rocamora, A.; Rivera-Gómez, C.; Galán-Marín, C.; Marrero, M. Environmental benchmarking of building typologies through BIM-based combinatorial case studies. Autom. Constr. 2021, 132, 103980. [Google Scholar] [CrossRef]
- Ruiz-Pérez, M.R.; Alba-Rodríguez, M.D.; Marrero, M. Evaluation of water footprint of urban renewal projects. Case study in Seville, Andalusia. Water Res. 2022, 221, 118715. [Google Scholar] [CrossRef]
- Meng, J.; Chen, G.Q.; Shao, L.; Li, J.S.; Tang, H.S.; Hayat, T.; Alsaedi, A.; Alsaadi, F. Virtual water accounting for building: Case study for E-town, Beijing. J. Clean Prod. 2014, 68, 7–15. [Google Scholar] [CrossRef]
- Rivero-Camacho, C.; Marrero, M. Water Footprint of the Life Cycle of Buildings: Case Study in Andalusia, Spain. Green Energy Technol. 2022, 135–165. [Google Scholar] [CrossRef]


| Type | Samples | Height (m) | Plants | Additional Floor | Foundation Type | Structure Type | Roof Type |
|---|---|---|---|---|---|---|---|
| 1 | 4 | 5–7.5 | 1 | Trenches | Metallic | Sloped | |
| 2 | 1 | 7.5–10 | 1 | Trenches | Metallic | Sloped | |
| 3 | 12 | 7.5–10 | 1 | Isolated footings | Metallic | Sloped | |
| 4 | 3 | 3.5–5 | 1 | Isolated footings | Metallic | Sloped | |
| 5 | 43 | 5–7.5 | 1 | Isolated footings | Metallic | Sloped | |
| 6 | 1 | >10 | 1 | Isolated footings | Metallic | Sloped | |
| 7 | 1 | 7.5–10 | 1 | Mezzanine | Isolated footings | Metallic | Sloped |
| 8 | 1 | >10 | 2 | Isolated footings | Metallic | Sloped and horizontal | |
| 9 | 1 | 7.5–10 | 2 | Trenches | Concrete | Sloped and horizontal | |
| 10 | 1 | 5–7.5 | 1 | Piles | Mixed | Sloped | |
| 11 | 1 | 7.5–10 | 1 | Running ditches | Concrete | Sloped | |
| 12 | 2 | 7.5–10 | 1 | Isolated footings | Concrete | Sloped | |
| 13 | 1 | 7.5–10 | 1 | Basement + Mezzanine | Isolated footings | Metallic | Sloped |
| 14 | 4 | 5–7.5 | 1 | Mezzanine | Isolated footings | Metallic | Sloped |
| 15 | 1 | 5–7.5 | 1 | Mezzanine | Isolated footings—Trenches | Mixed | Sloped |
| 16 | 2 | >10 | 2 | Piles | Concrete | Sloped | |
| 17 | 1 | >10 | 2 | Isolated footings | Metallic | Sloped | |
| 18 | 1 | 5–7.5 | 2 | Isolated footings | Metallic | Sloped | |
| 19 | 3 | 7.5–10 | 2 | Isolated footings | Metallic | Sloped | |
| 20 | 1 | 7.5–10 | 1 | Mezzanine | Isolated footings | Metallic | Sloped and horizontal |
| 21 | 1 | 7.5–10 | 2 | Basement | Slabs | Metallic | Sloped |
| 22 | 1 | 7.5–10 | 3 | Isolated footings | Metallic | Sloped |
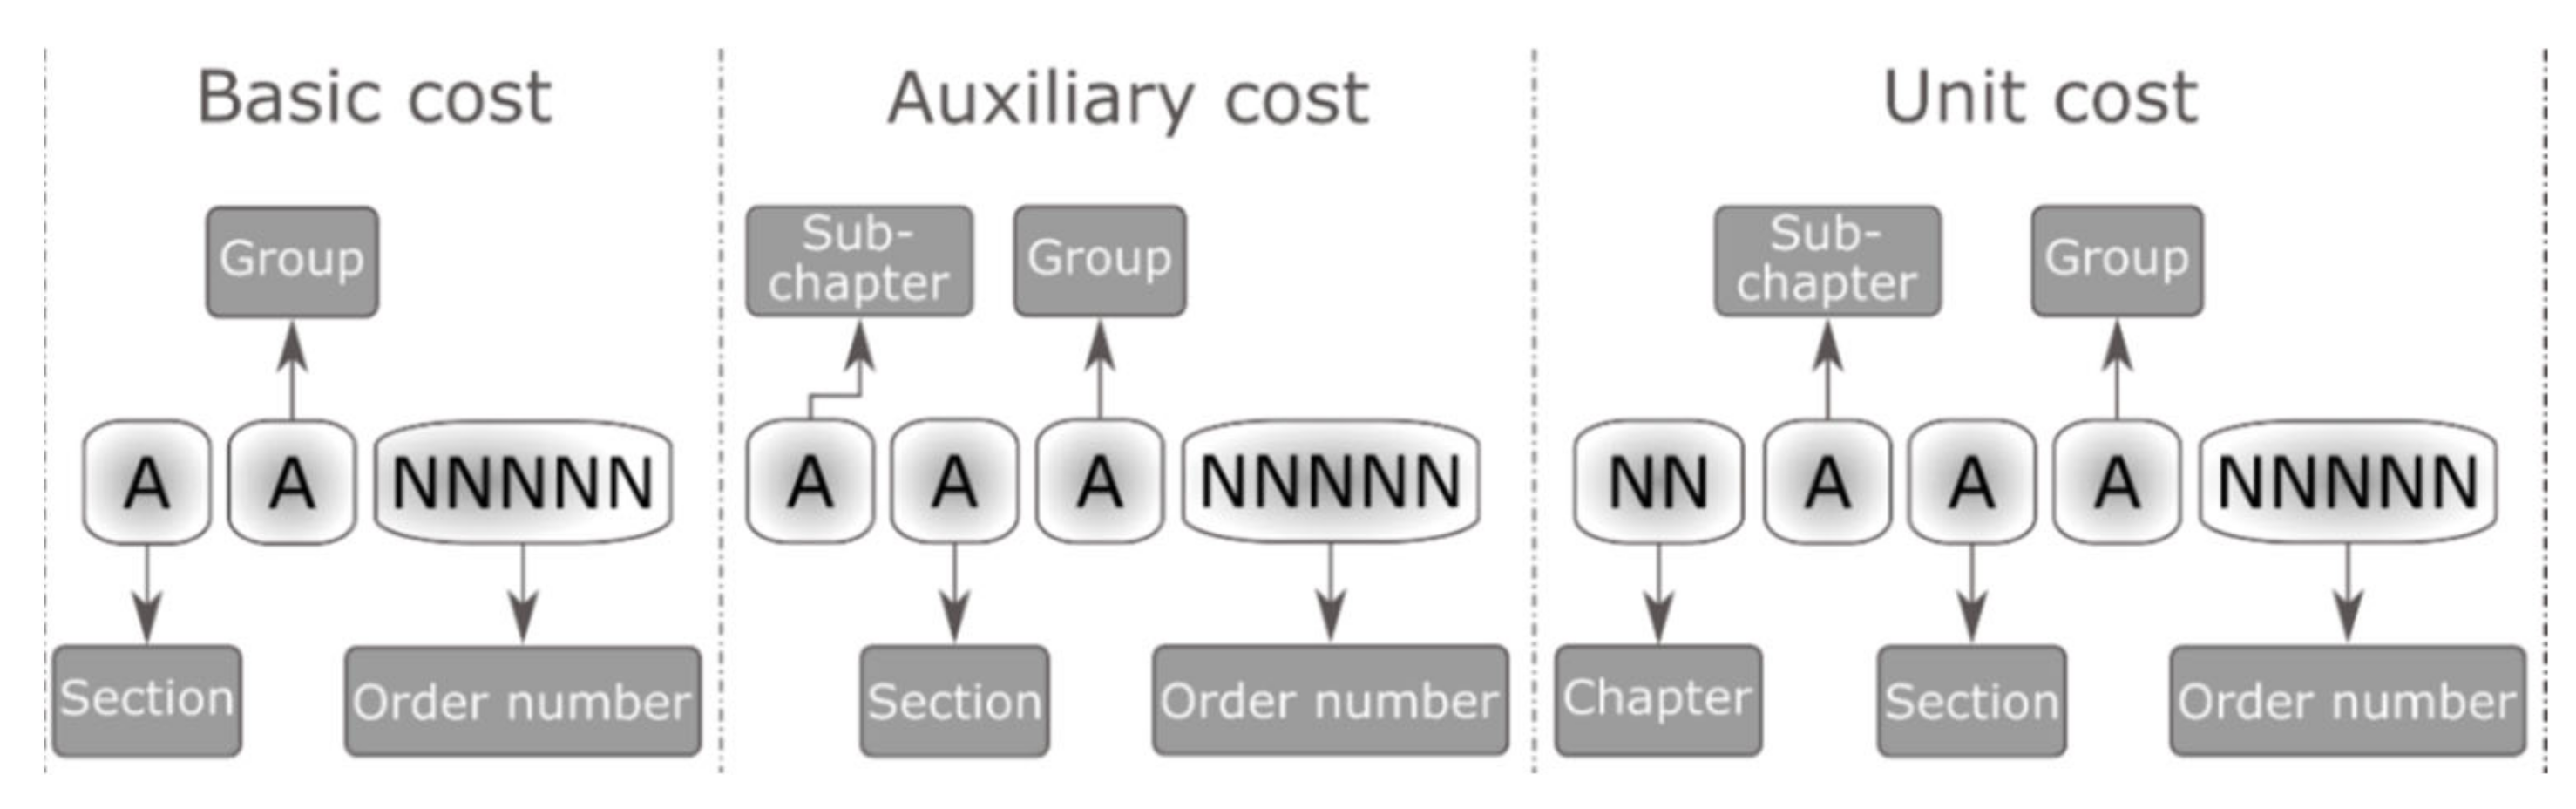
| Class Levels | Definitions |
|---|---|
| L1. Construction site | All the construction elements on a construction site |
| L2. Chapter | Main stages of a dwelling construction project. e.g.,: 03. Foundations. |
| L3. Sub-Chapter | Chapter division. e.g.,: 03C. Foundations. |
| L4. Section | Sub-Chapter division. e.g.,: 03CP. Foundation pile. |
| L5. Group | Section division. e.g.,: 03CPS. Foundation pile in-situ. |
| L6. Unit Cost | Group division into unitary elements. e.g.,: 03CPS00007 m Concrete pile in situ with 65 cm diameter. |
| ACCD Code | Concept |
|---|---|
| 02EX | Excavations |
| 02RR | Filled |
| 03AX | Rebar |
| 03HM | Concrete in mass |
| 04EA | Manholes and wells |
| 04VB | Downspouts |
| 05AC | Hot-rolled steel |
| 05AF | Cold rolled steel |
| 05HA | Steel rebar |
| 05HE | Formwork |
| 05MX | Structural wood |
| 06DX | Interior brickwork |
| 06DY | Interior partition (distribution) |
| 08EC | Circuits |
| 08ED | Derivations |
| 08EL | Points of light |
| 08EP | Grounding conductor |
| 10CG | Plaster |
| ACCD Code | Concept | Quantity | Construction Elements |
|---|---|---|---|
| 10AA | Tiled | 5 | Façade Finishes |
| 10AC | Plated | 3 | Façade Finishes |
| 13EX | Exterior paintings | 4 | Façade Finishes |
| 13IX | Interior paintings | 4 | Interior Finishes |
| 12XX | Glazing | 4 | Glazing |
| 09AX | Acoustic insulation | 3 | Acoustic Insulation—Walls and Acoustic Insulation—Floors |
| 09TX | Thermal insulation | 6 | Thermal Insulation—Walls and Thermal Insulation—Floors |
| 06LX | Exterior brick work | 4 | Masonry Façade |
| 06PA | Prefabricated metal | 1 | Masonry Façade |
| 06PH | Prefabricated concrete | 3 | Masonry Façade |
| 10RX | Finishes and windowsills | 7 | Windowsill |
| 10RX | Finishes and windowsills | 8 | Finishes |
| 08CA | Air conditioning and hot water appliances | 8 | Air Conditioning Devices and Terminal Units |
| 08FS | Sanitary appliances | 4 | Sanitary Appliances |
| 08FF | Water piping | 4 | Water Pipes |
| 08CC | Air conditioning ducts | 4 | Pipes |
| 04EC | Collectors | 2 | Collectors |
| 07HX | Horizontal covers | 6 | Horizontal Covers |
| 07IX | Sloping roofs | 8 | Sloping Roofs |
| 03EX | Formwork | 2 | Formwork |
| 10CE | Plastered | 2 | Plastered—Façade and Plastered—Partitions |
| 05WF | Reinforced concrete (structure) | 2 | Structure |
| 10TX | Ceilings | 5 | False Ceilings |
| 05FX | Forged | 2 | Forged |
| 06BZ | Walls of concrete blocks | 1 | Walls |
| 06LZ | Ceramic brick walls | 1 | Walls |
| 03CP | Piles | 1 | Reinforced Concrete (Foundation) |
| 03HA | Reinforced concrete | 4 | Reinforced Concrete (Foundation) |
| 06LY | Interior brickwork | 5 | Partitions |
| 11AX | Carpentry steel | 3 | Doors and Windows |
| 11LX | Aluminium carpentry | 4 | Doors and Windows |
| 11MX | Wood carpentry | 3 | Doors and Windows |
| 10SC | Ceramic flooring | 9 | Floors in Small Areas |
| 10SN | Natural stone flooring | 4 | Floors in Small Areas |
| 10SX | Low density continuous flooring | 1 | Floors in Big Areas |
| 10SY | Medium density continuous flooring | 1 | Floors in Big Areas |
| 10SZ | High density continuous flooring | 1 | Floors in Big Areas |
| 08ET | Power outlets | 3 | Power Outlets |
| 02TX | Transport | 2 | Transport (Elevators) |
| Type | ACCD Code Basic Cost | Quantity | Unit | Name | Basic Cost (€) | Cost in Unit (€/m) | WF in Basic (m3water/unit) | WF in Unit (m3water/m) | CF in Basic (kgCO2 eq/unit) | CF in Unit (kgCO2 eq/m) |
|---|---|---|---|---|---|---|---|---|---|---|
| MAT | CA00320 | 10.47 | kg | Rebar steel b 500 s | 0.81 | 8.48 | 0.027 | 0.283 | 1.457 | 15.251 |
| MAT | CH80150 | 0.43 | m3 | Concrete 30 Mpa resistance | 64.61 | 27.59 | 5.144 | 2.196 | 344.353 | 147.039 |
| MAQ | MC00100 | 0.03 | h | Hammer compressor | 6.35 | 0.19 | 0.236 | 0.007 | 4.960 | 0.149 |
| MAT | MP00210 | 0.434 | m | Pile perforation equipment (rent) | 225.53 | 97.88 | 0.011 | 0.005 | 3.125 | 1.356 |
| MAT | MP00600 | 1 | u | Hammer repercussion tool | 6.45 | 6.45 | 0.212 | 0.212 | 0.523 | 0.523 |
| TOTAL | 2.703 | TOTAL | 164.318 |
| Features/Projects | PL | PZ | PC | PP |
|---|---|---|---|---|
| Floor area (m2) | 1535 | 12838 | 312 | 8896 |
| Typology | 21 | 8 | 9 | 16 |
| Height from floor to ceiling (m) | 7.5–10 | >10 | 7.5–10 | >10 |
| Number of floors | 2 | 2 | 2 | 2 |
| Additional floor | Basement | - | - | - |
| Foundation type | Concrete slab | Isolated footing | Trenches | Piles |
| Structure type | Metallic | Metallic | Concrete | Concrete |
| Project | PL | PZ | PC | PP |
|---|---|---|---|---|
| Project cost (€/m2) | 301.88 | 340.83 | 337.19 | 232.00 |
| Water footprint (m3water/m2) | 12.15 | 8.60 | 10.85 | 6.12 |
| Total carbon footprint (kgCO2eq/m2) | 657.86 | 348.34 | 433.61 | 199.68 |
| Hours of labor (h/m2) | 1.12 | 0.56 | 0.40 | 0.26 |
| Operator hours of machines (h/m2) | 5.06 | 5.26 | 4.89 | 3.87 |
| Cost (€/m2) | Water Footprint (m3water/m2) | Carbon Footprint (kgCO2eq/m2) | |||||||||||
|---|---|---|---|---|---|---|---|---|---|---|---|---|---|
| Chapter | ELEMENT/TYPOLOGY | PL | PZ | PC | PP | PL | PZ | PC | PP | PL | PZ | PC | PP |
| 03-FOUNDATIONS | Rebar | 5.56 | 8.28 | 8.63 | 0.19 | 0.13 | 0.19 | 0.20 | 0.00 | 6.83 | 10.17 | 10.61 | 0.24 |
| Piles | 0.00 | 0.00 | 0.00 | 19.79 | 0.00 | 0.00 | 0.00 | 0.32 | 0.00 | 0.00 | 0.00 | 19.72 | |
| Formwork | 4.47 | 4.47 | 7.59 | 4.47 | 0.69 | 0.69 | 1.18 | 0.69 | −1.14 | −1.14 | −1.93 | −1.14 | |
| Reinforced concrete (foundation) | 1.72 | 1.85 | 1.30 | 0.68 | 0.09 | 0.10 | 0.07 | 0.04 | 6.32 | 6.79 | 4.79 | 2.48 | |
| Bulk concrete | 27.50 | 2.33 | 2.24 | 0.00 | 1.01 | 0.09 | 0.08 | 0.00 | 35.51 | 3.01 | 2.89 | 0.00 | |
| 05-STRUCTURES | Hot-rolled steel | 16.53 | 6.20 | 5.96 | 9.34 | 0.61 | 0.23 | 0.22 | 0.34 | 37.02 | 13.88 | 13.34 | 20.91 |
| Forged steel | 0.00 | 0.00 | 0.00 | 6.18 | 0.00 | 0.00 | 0.00 | 0.14 | 0.00 | 0.00 | 0.00 | 7.59 | |
| Rebar | 64.54 | 5.15 | 6.39 | 8.30 | 4.12 | 0.33 | 0.41 | 0.53 | 275.72 | 22.00 | 27.32 | 35.48 | |
| Reinforced concrete (structure) | 5.20 | 38.78 | 38.78 | 21.26 | 0.07 | 0.51 | 0.51 | 0.28 | 5.07 | 37.83 | 37.83 | 20.74 | |
| 06-MASONRY | Walls of concrete blocks | 0.44 | 0.30 | 1.10 | 0.00 | 0.00 | 0.00 | 0.01 | 0.00 | 0.56 | 0.38 | 1.41 | 0.00 |
| Partition walls | 3.06 | 1.53 | 0.94 | 1.53 | 0.04 | 0.02 | 0.01 | 0.02 | 6.74 | 3.37 | 2.08 | 3.37 | |
| Interior brickwork | 17.81 | 30.35 | 53.69 | 11.71 | 0.73 | 1.24 | 2.20 | 0.48 | 53.17 | 90.60 | 160.27 | 34.95 | |
| Precast concrete | 0.00 | 0.00 | 0.56 | 0.00 | 0.00 | 0.00 | 0.00 | 0.00 | 0.00 | 0.00 | 0.24 | 0.00 | |
| 10-COATINGS | Finishes | 3.46 | 2.04 | 2.04 | 2.04 | 0.15 | 0.09 | 0.09 | 0.09 | 4.64 | 2.73 | 2.73 | 2.73 |
| Floors | 52.58 | 61.16 | 64.24 | 61.16 | 1.13 | 1.27 | 1.33 | 1.27 | 21.16 | 22.62 | 23.66 | 22.62 | |
| Ceilings | 2.09 | 1.07 | 0.26 | 1.07 | 0.01 | 0.01 | 0.00 | 0.01 | 0.87 | 0.45 | 0.11 | 0.45 | |
| Finishes and windowsills | 2.73 | 2.73 | 8.03 | 4.66 | 0.71 | 0.71 | 2.08 | 1.21 | 2.27 | 2.27 | 6.69 | 3.88 | |
| % TOTAL | 77.8% | 53.6% | 66.5% | 78.9% | 92.5% | 73.9% | 90.1% | 95.4% | 87.6% | 78.7% | 89.0% | 97.0% | |
| Category | New/Original Solution | Difference | ||
|---|---|---|---|---|
| WF (m3water/m2) | CF (kgCO2eq/m2) | Cost (€/m2) | ||
| Partitions | Brick partition with mortar/9-cm-thick double hollow brick partition | −0.096 | −16.24 | −2.91 |
| Masonry façade | 9-cm-thick double hollow brick partition/precast concrete | −0.72 | −36.07 | −8.55 |
| Thermal insulation—walls | Walls insulation of semi-rigid panel fibreglass, 60 mm thick/Walls insulation of projected polyurethane, 30 mm thick | −0.354 | −3.047 | 2.08 |
| Floors in small sup. | Continuous 7-mm-thick pavement with mortar/30 × 30 cm porcelain floor tiles with adhesive | −0.709 | −19.43 | 1.01 |
| Main floors | Continuous 7-mm-thick pavement with mortar/highly resistant ceramic pavement | −1.165 | −15.92 | −41.64 |
| Doors | Metallic door with frame of 70 mm × 40 mm/galvanized steel door | 0 | −23.76 | 40.03 |
| Windows | Wood pine window (width: 1.50 to 3 m2)/aluminum window | −0.187 | −26.94 | −26.10 |
| Façade finishes | Anti-corrosive, antioxidant paint/cementitious paint for exterior | 0 | −6.092 | −11.48 |
| Interior finishes | Anti-corrosive, antioxidant paint/synthetic paint for metallic surfaces | −0.094 | −0.304 | −0.67 |
Publisher’s Note: MDPI stays neutral with regard to jurisdictional claims in published maps and institutional affiliations. |
© 2022 by the authors. Licensee MDPI, Basel, Switzerland. This article is an open access article distributed under the terms and conditions of the Creative Commons Attribution (CC BY) license (https://creativecommons.org/licenses/by/4.0/).
Share and Cite
Lopes R. Silva, D.; Rivero-Camacho, C.; Rusu, D.; Marrero, M. Methodology for Improving the Sustainability of Industrial Buildings via Matrix of Combinations Water and Carbon Footprint Assessment. Sustainability 2022, 14, 15297. https://0-doi-org.brum.beds.ac.uk/10.3390/su142215297
Lopes R. Silva D, Rivero-Camacho C, Rusu D, Marrero M. Methodology for Improving the Sustainability of Industrial Buildings via Matrix of Combinations Water and Carbon Footprint Assessment. Sustainability. 2022; 14(22):15297. https://0-doi-org.brum.beds.ac.uk/10.3390/su142215297
Chicago/Turabian StyleLopes R. Silva, Débora, Cristina Rivero-Camacho, Diana Rusu, and Madelyn Marrero. 2022. "Methodology for Improving the Sustainability of Industrial Buildings via Matrix of Combinations Water and Carbon Footprint Assessment" Sustainability 14, no. 22: 15297. https://0-doi-org.brum.beds.ac.uk/10.3390/su142215297