
Strip Intercrop of Barley, Wheat, Triticale, Oat, Pea and Yellow Lupine—A Meta-Analysis

 , , , and
Abstract
:1. Introduction
- -
- -
- -
- -
- -
- -
- -
- -
- -
- -
- Pro-ecological food production [30].
2. Materials and Methods
2.1. Experiment Site
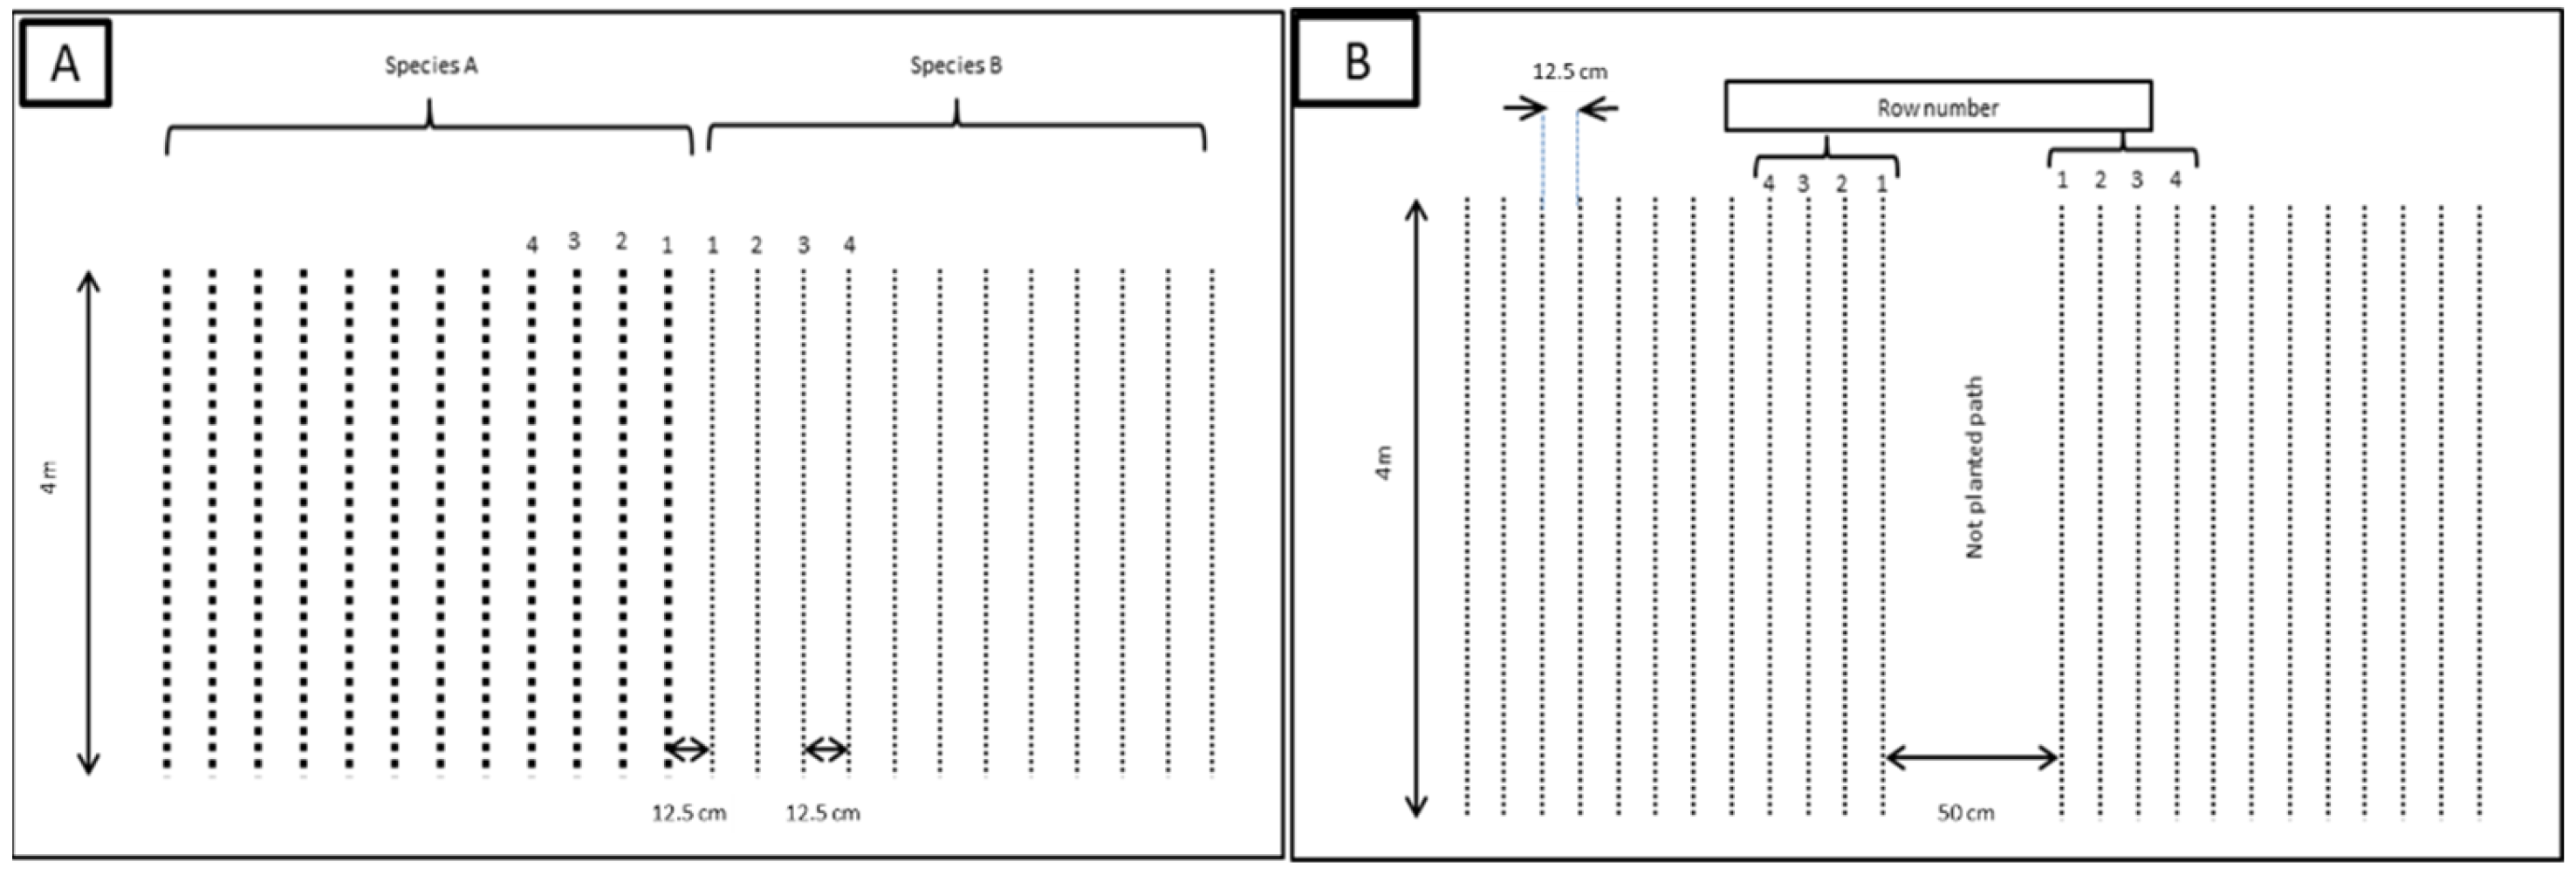
2.2. Experiment Design
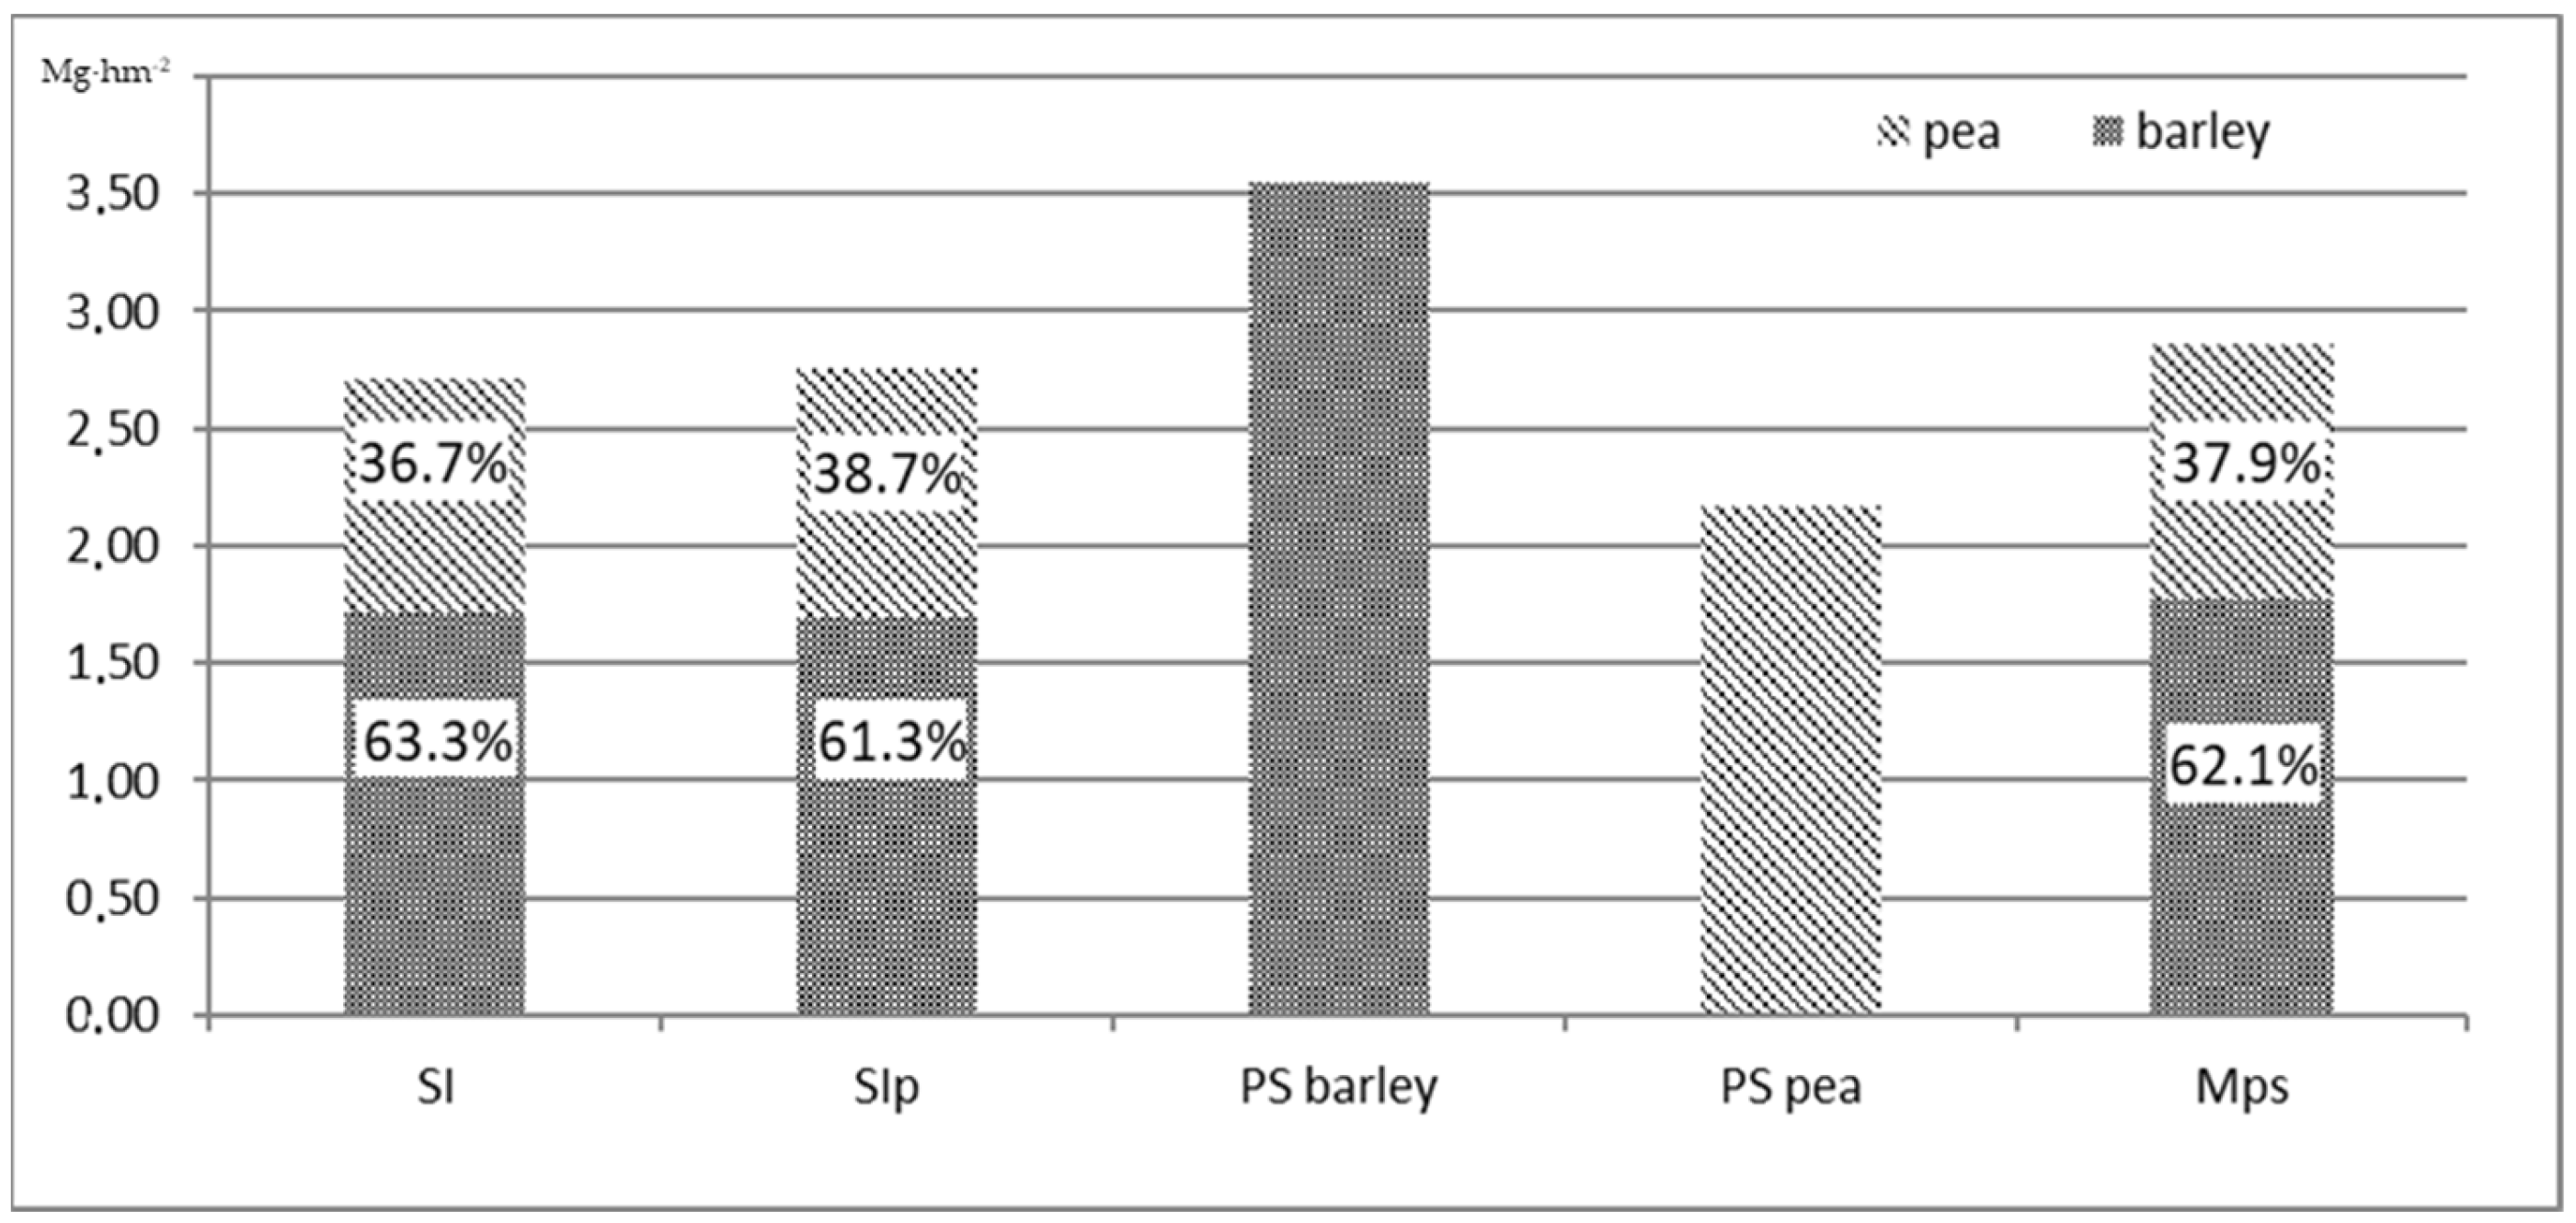
- SI—strip intercrop with immediate proximity of the strips (Figure 2A);
- SIp—strip intercrop with strips separated by a path (Figure 2B);
- PSx—pure sowing, the ‘x’ in subscript represents the species;
- Mps—the averaged total yield of pure sowing of each species for an area of 1ha (yield PSx Mg·hm−2·0.5 + yield PSy Mg·hm−2·0.5).
2.3. Elements of Agrotechnical Practises
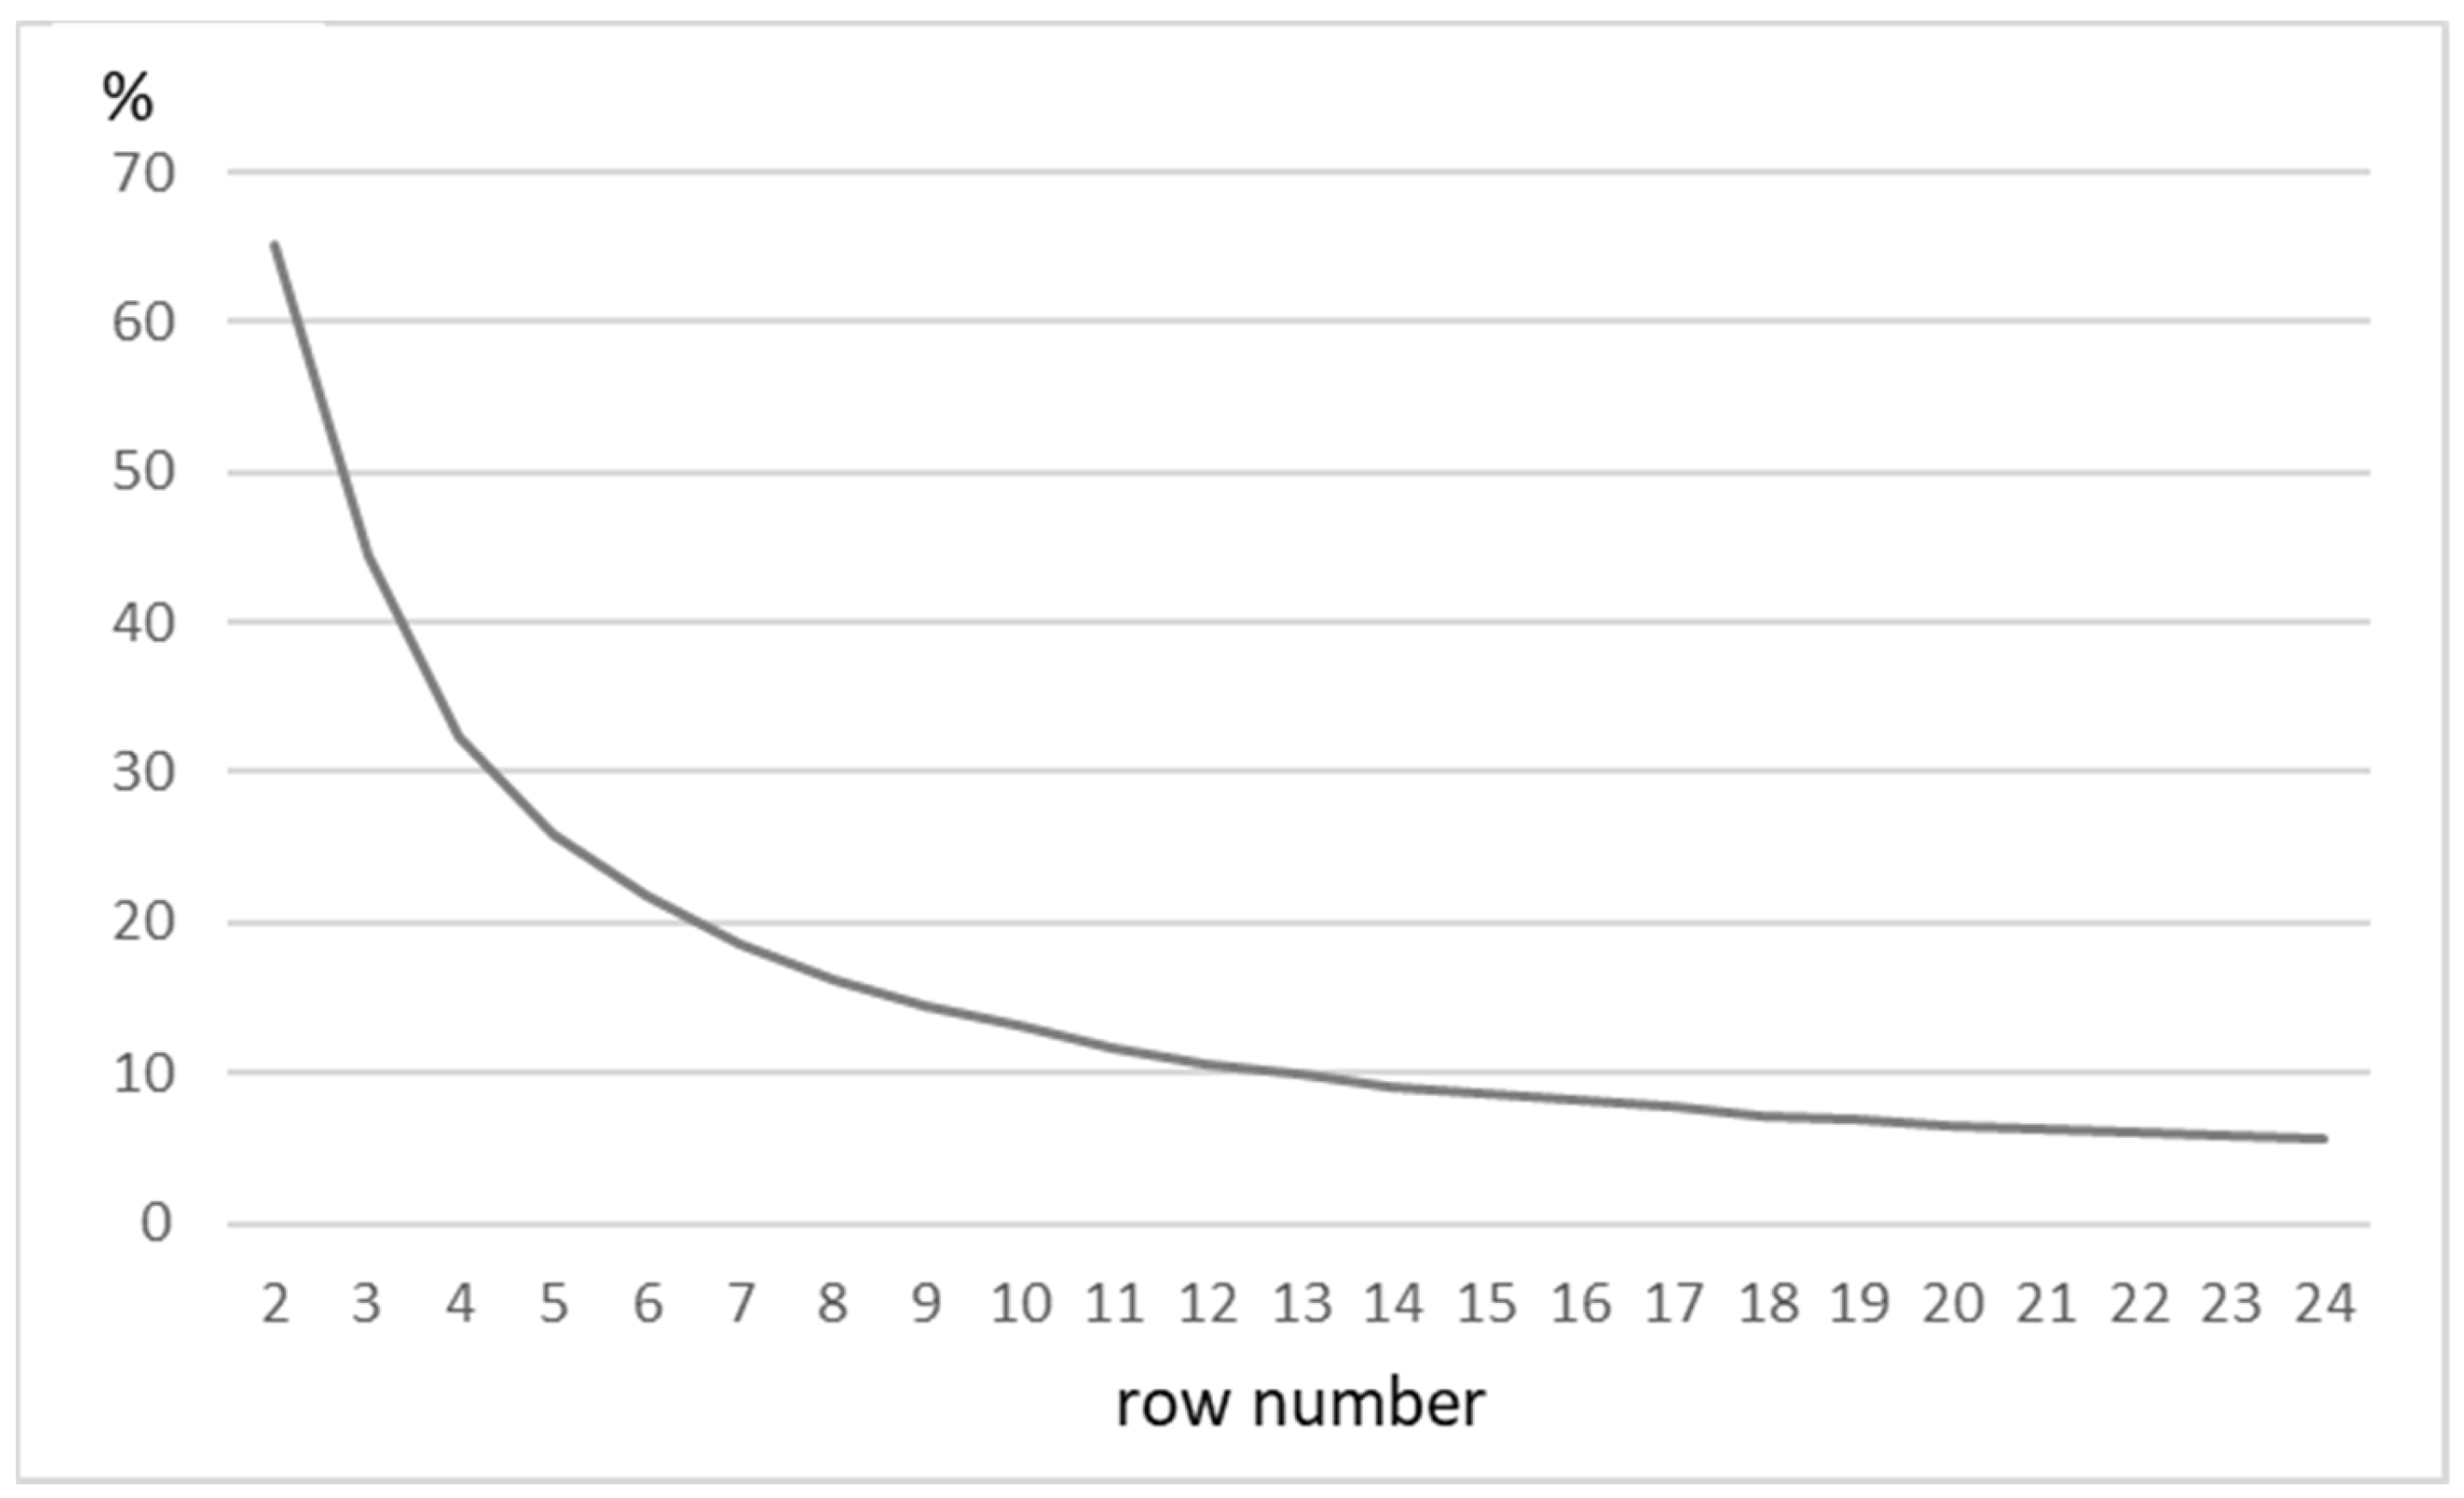
2.4. Data Analysis
- N—number of rows in the strip;
- Y—conversion factor from g·mb−1 (gram per 1 running meter of a row) to the surface Mg·ha−2·0.5.
3. Results and Discussion
3.1. Cereal/Pea
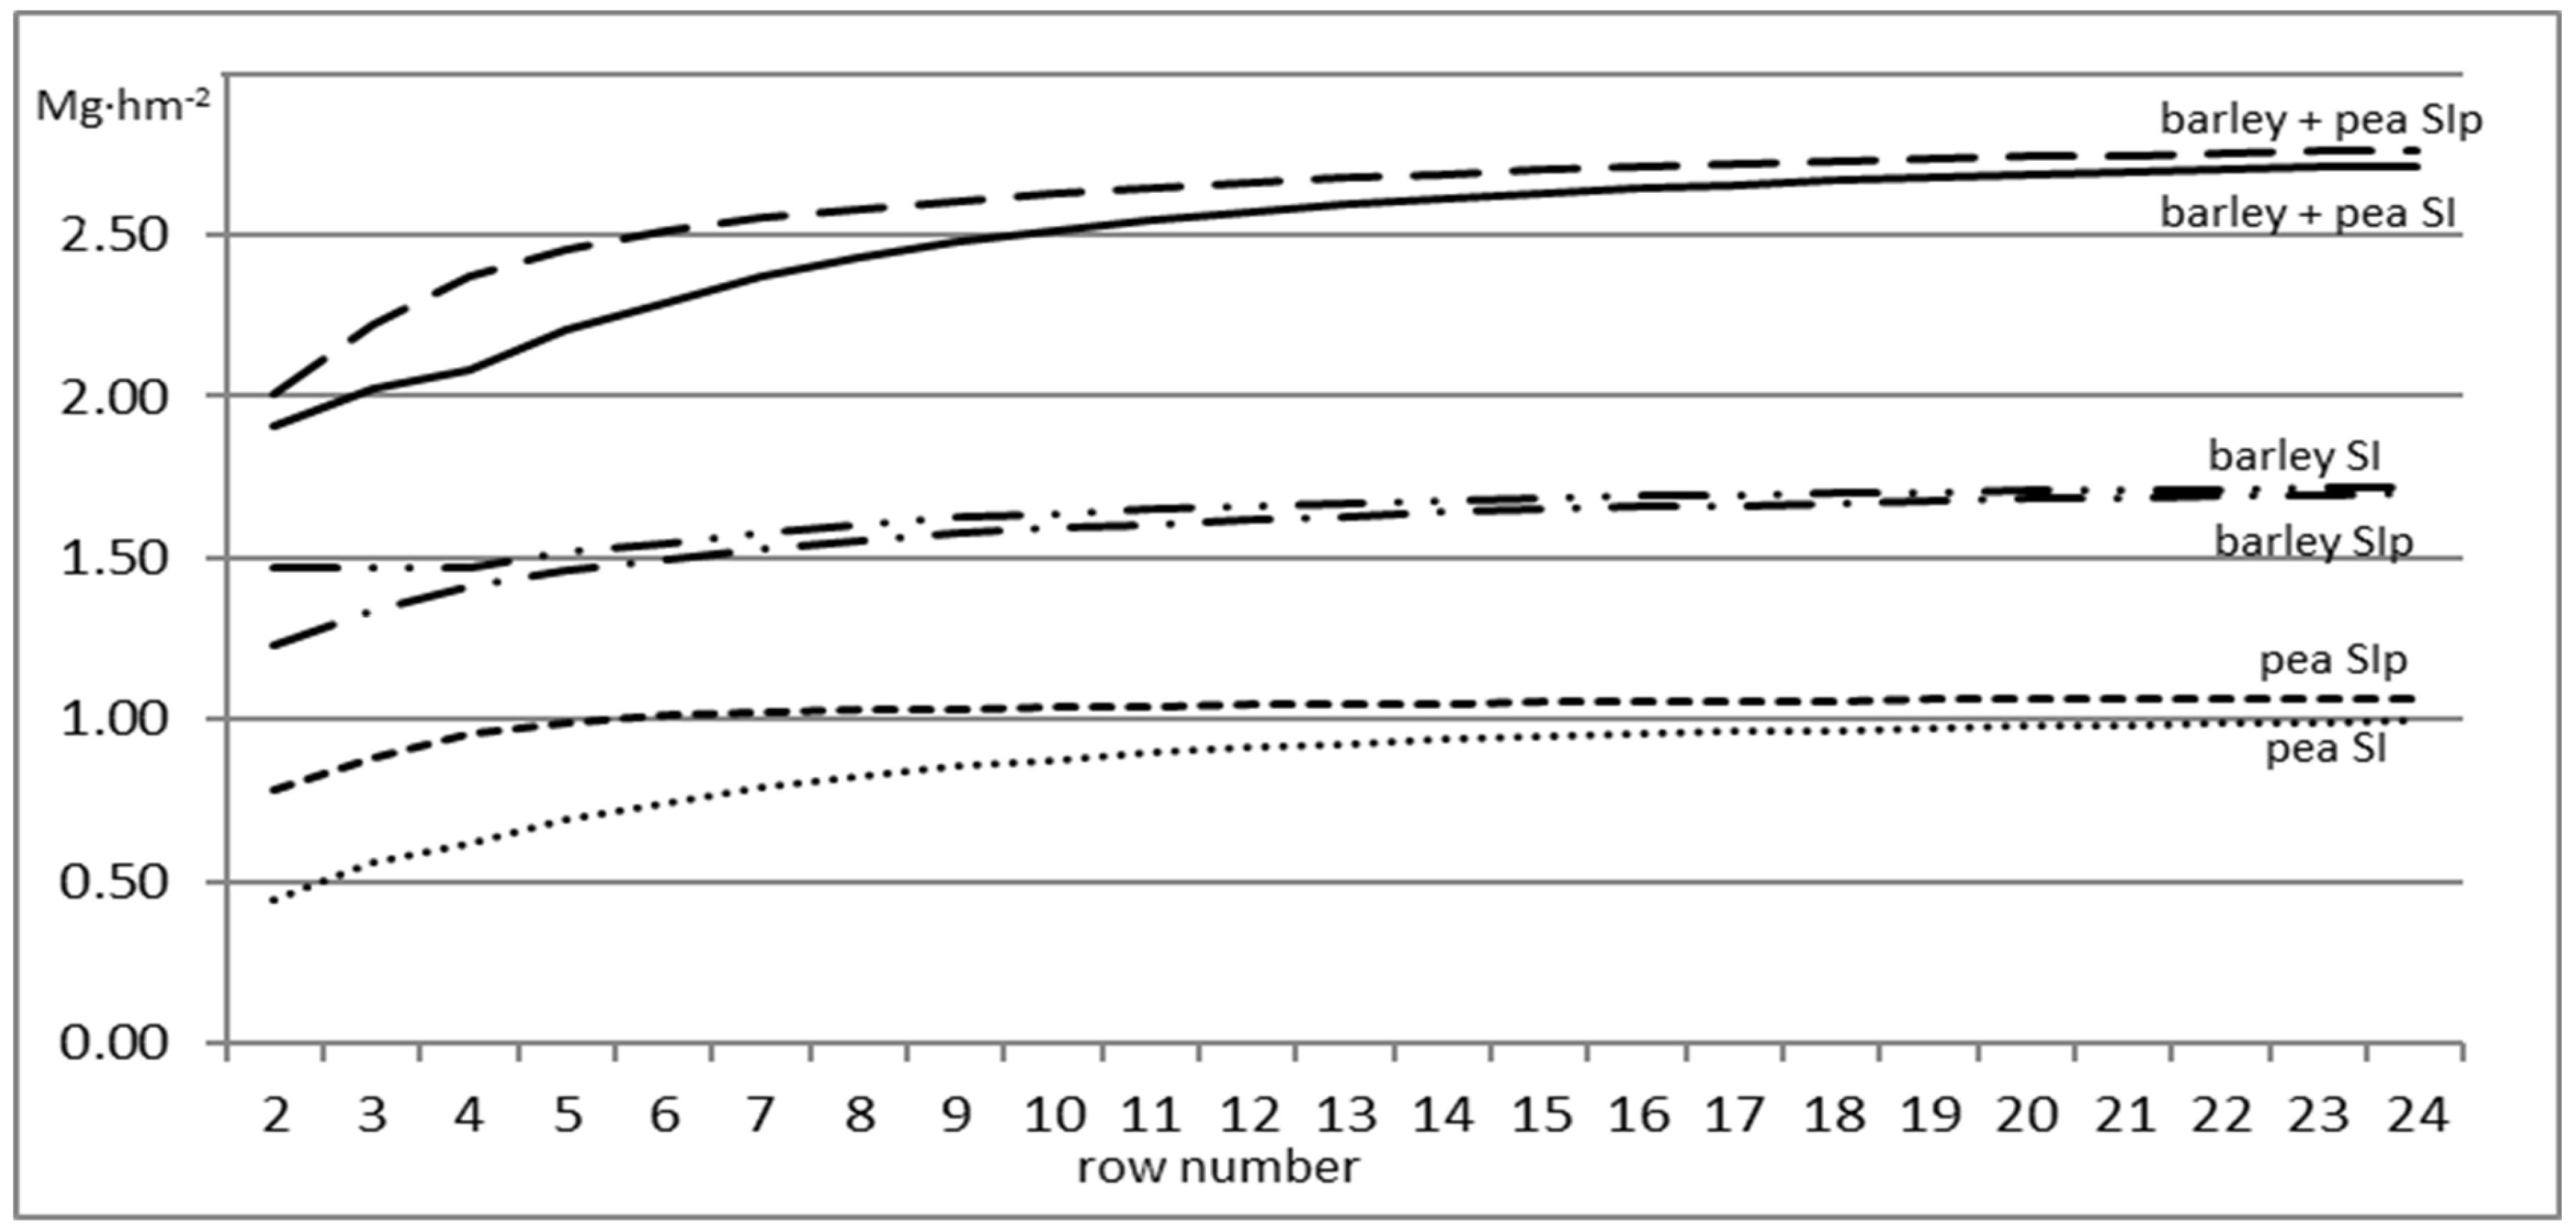
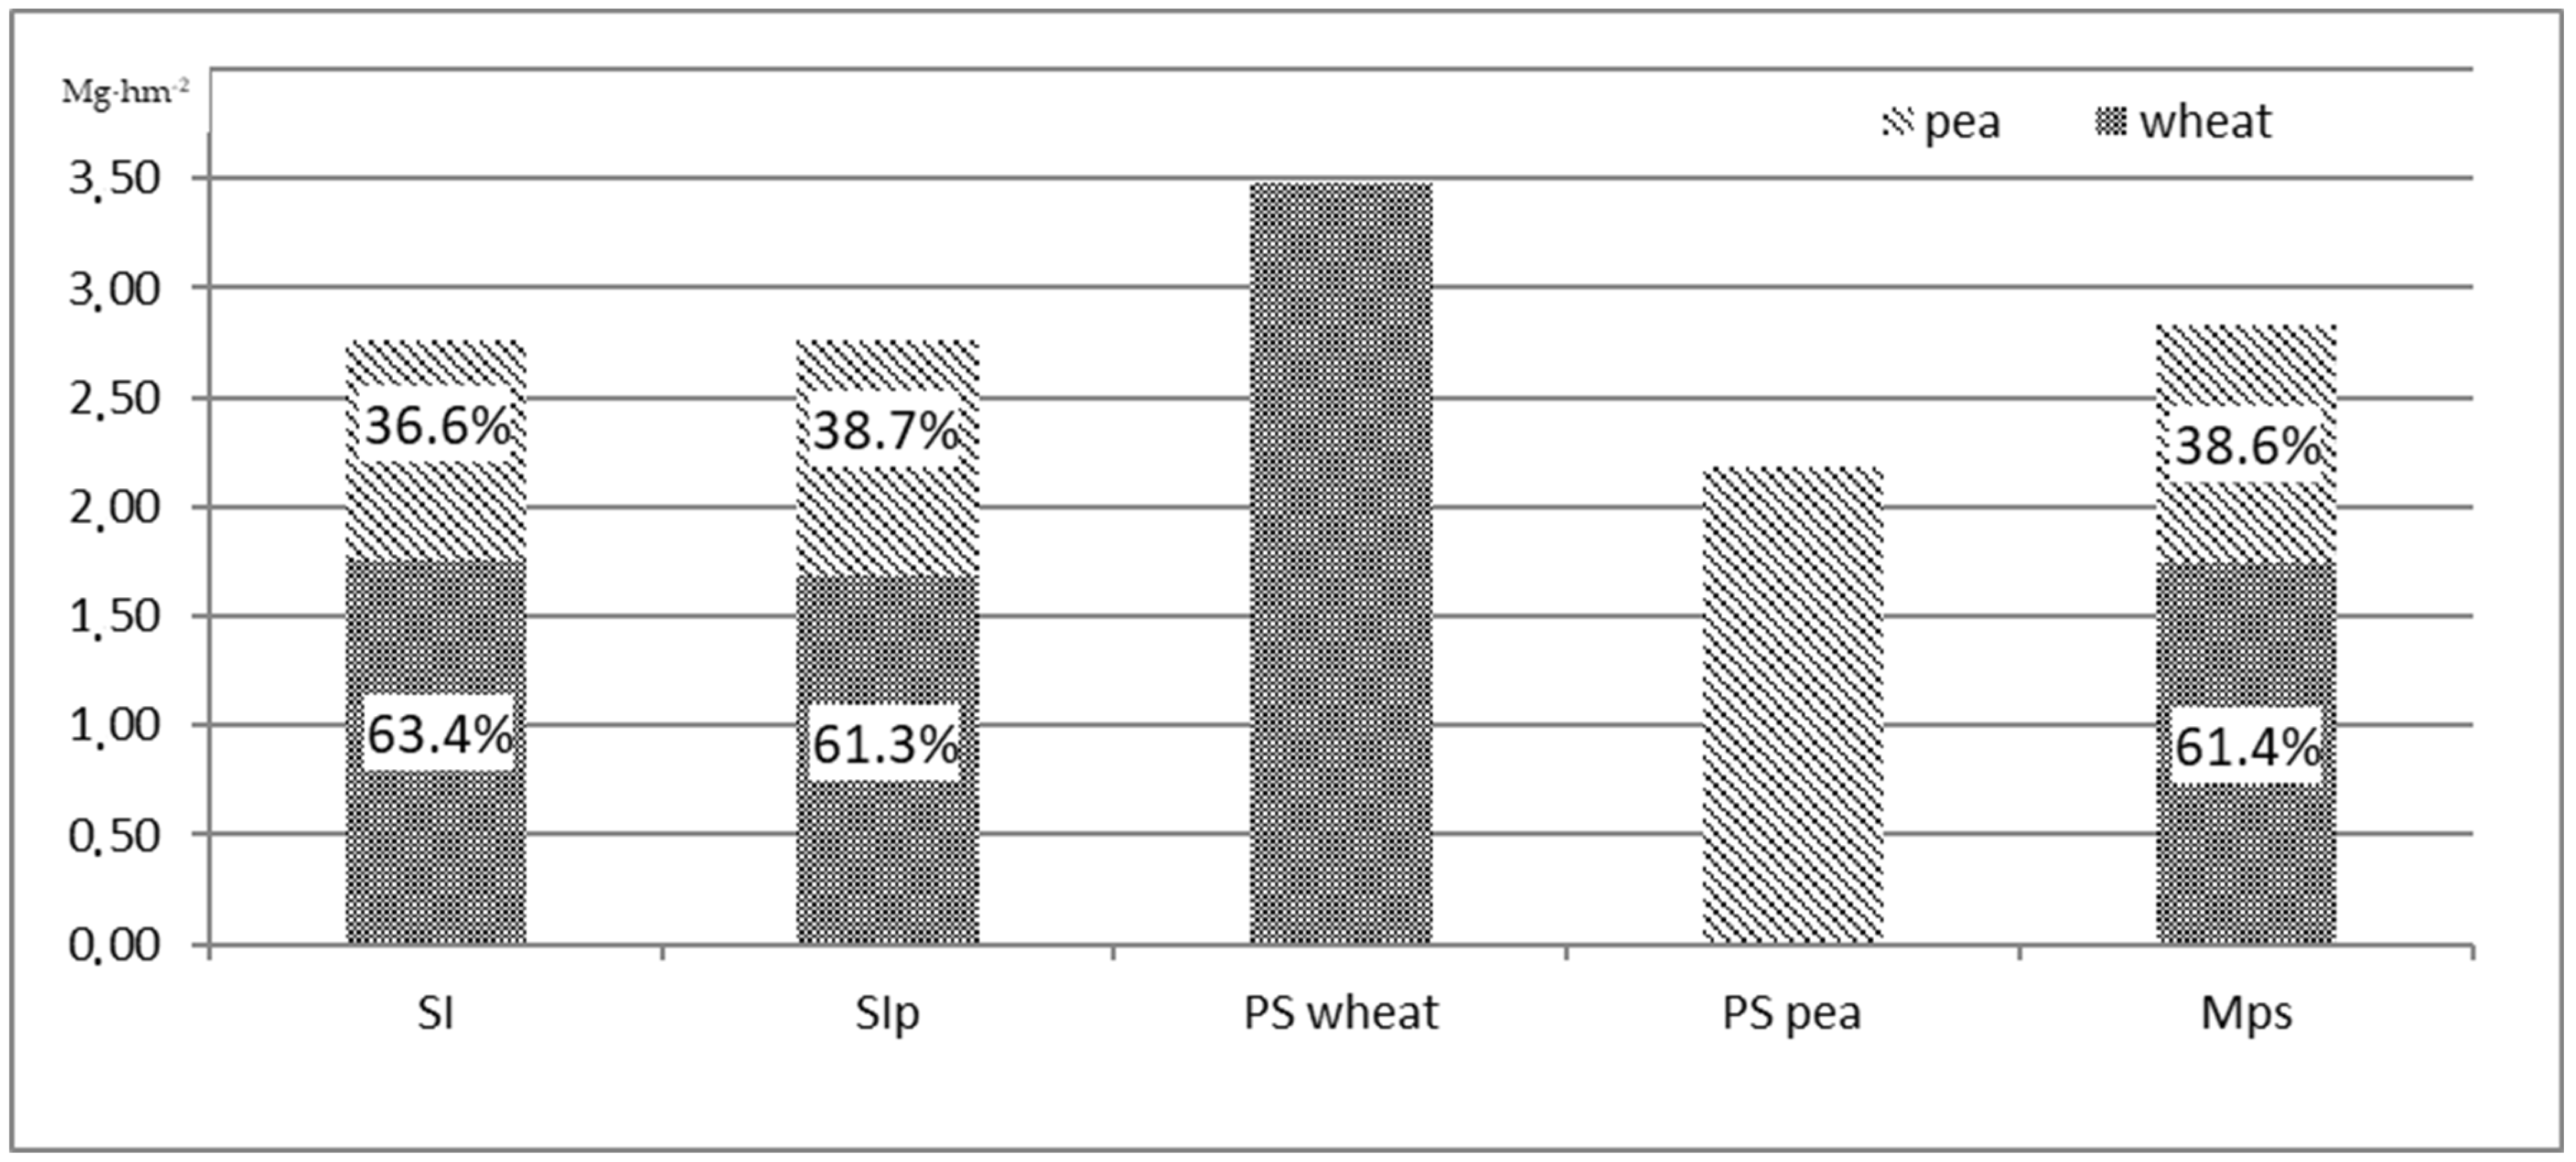
3.1.1. Barley/Pea
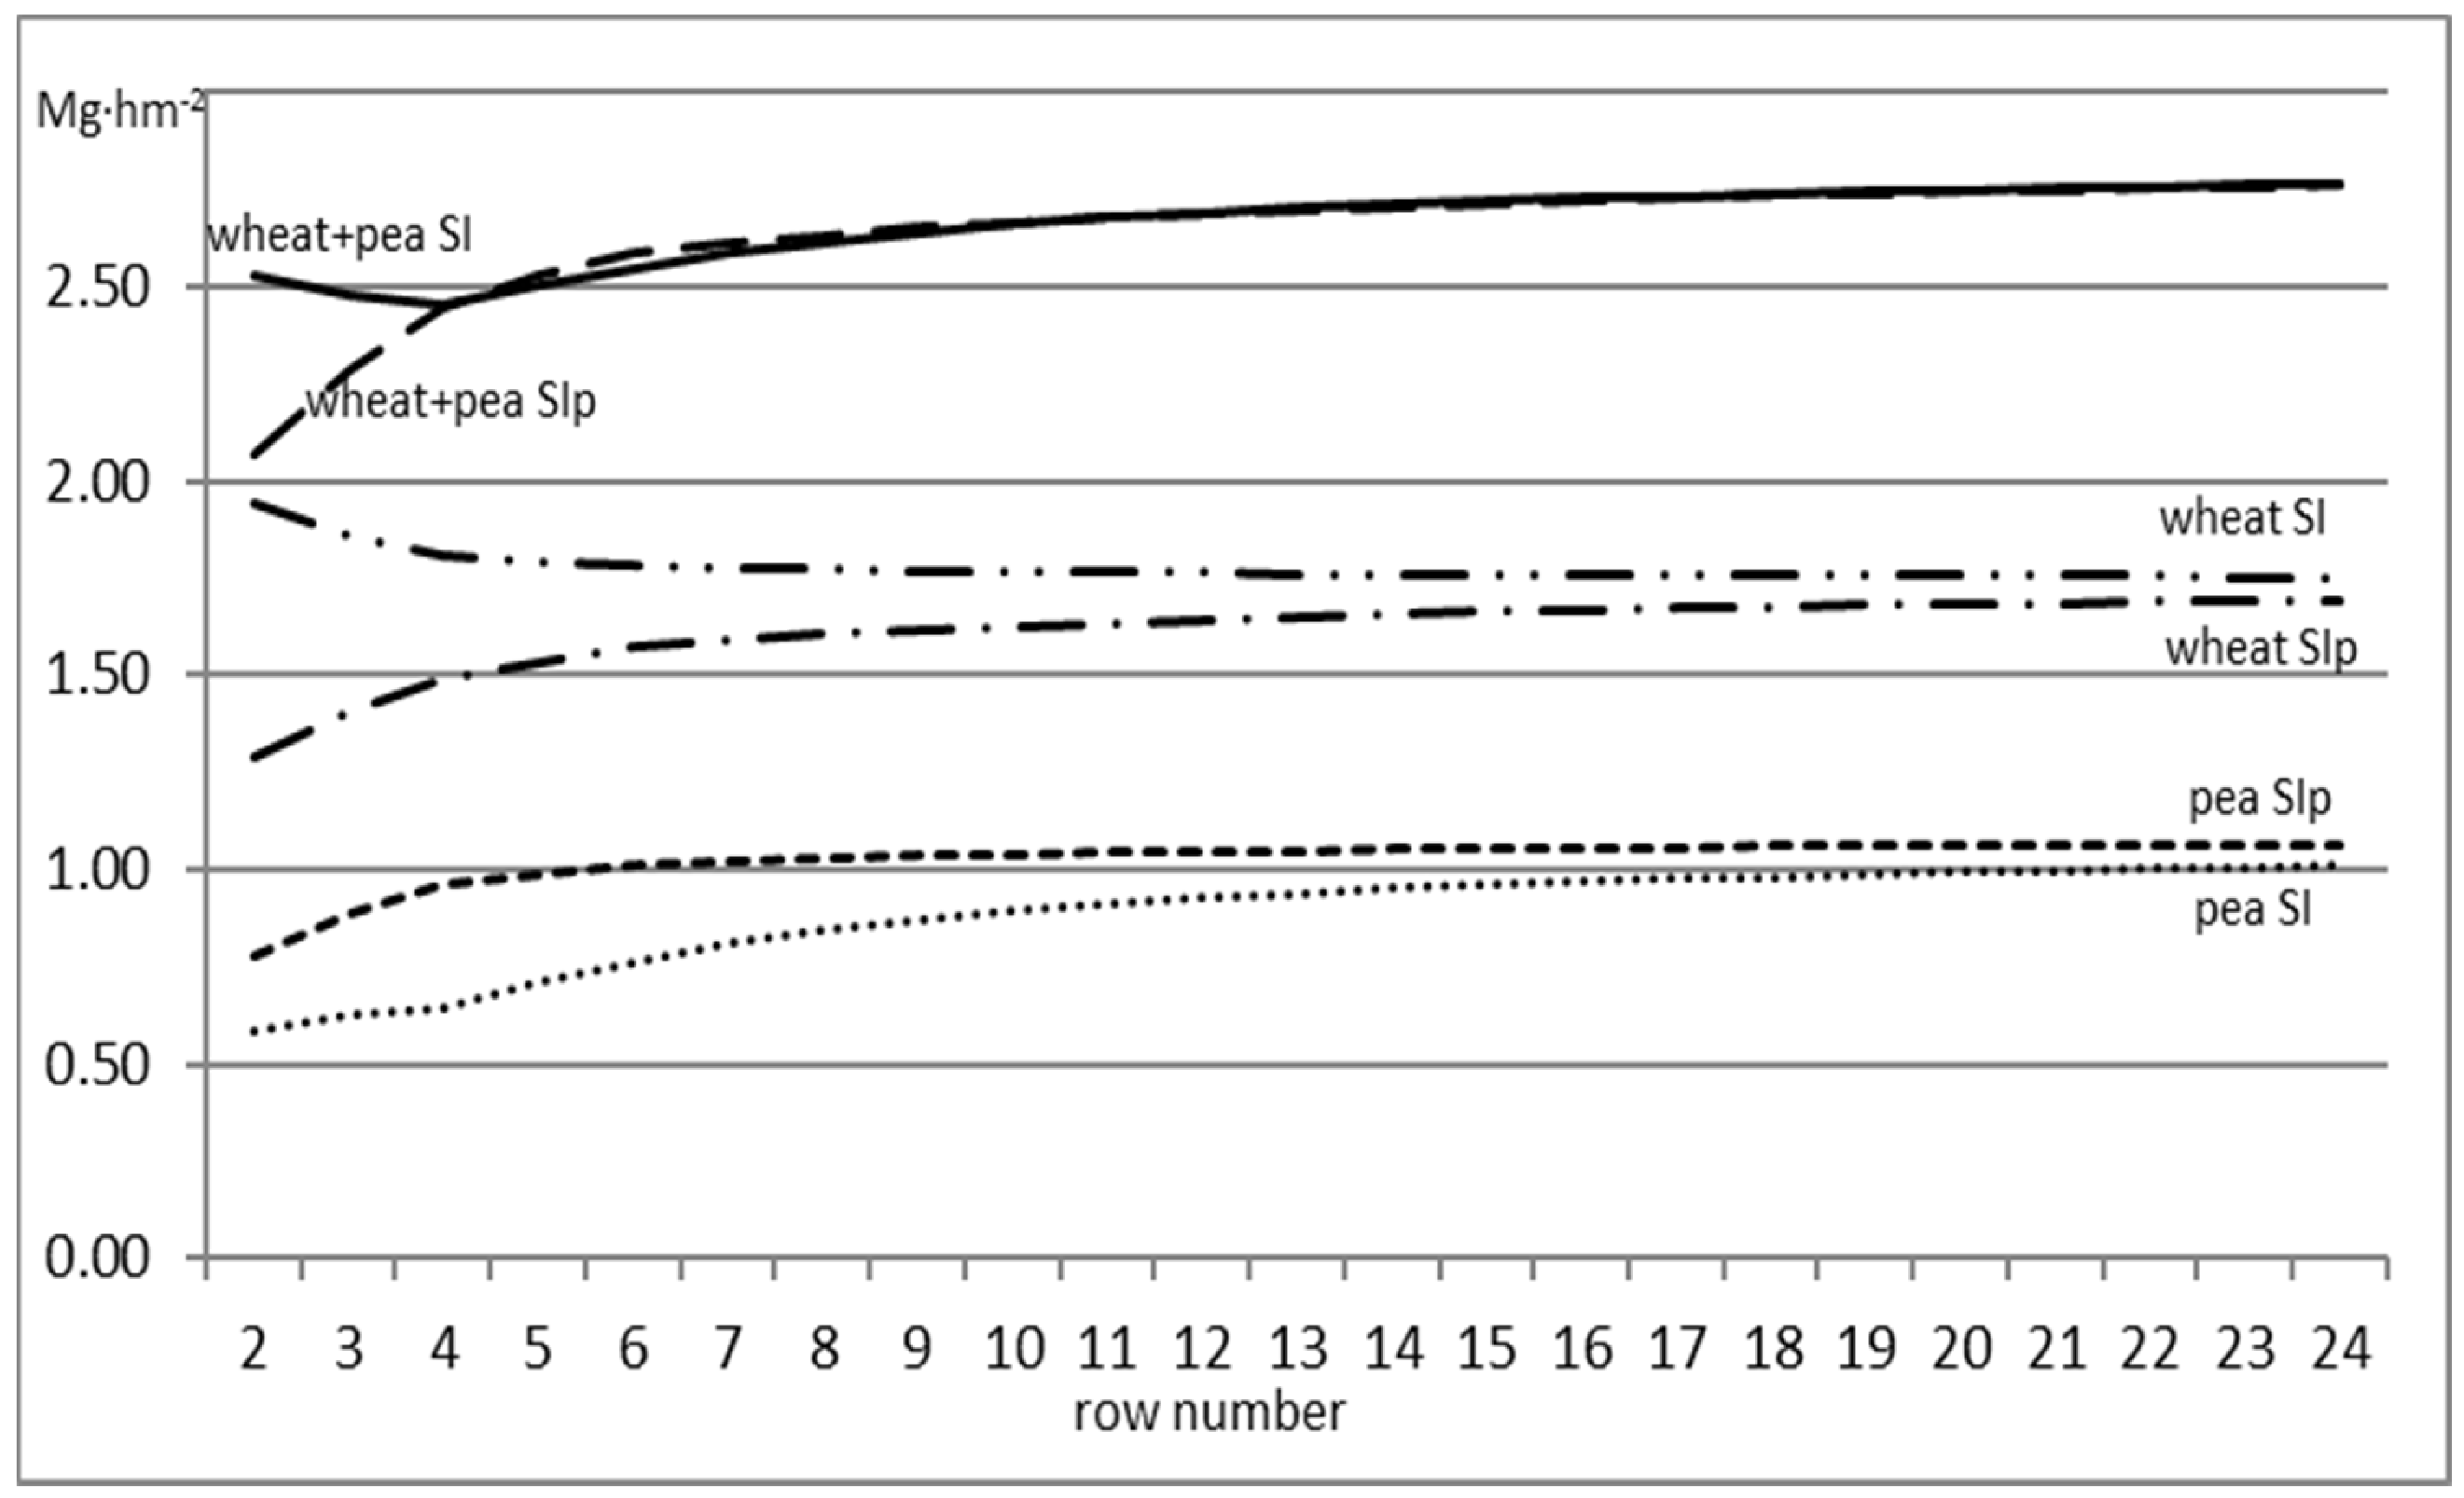
3.1.2. Wheat/Pea
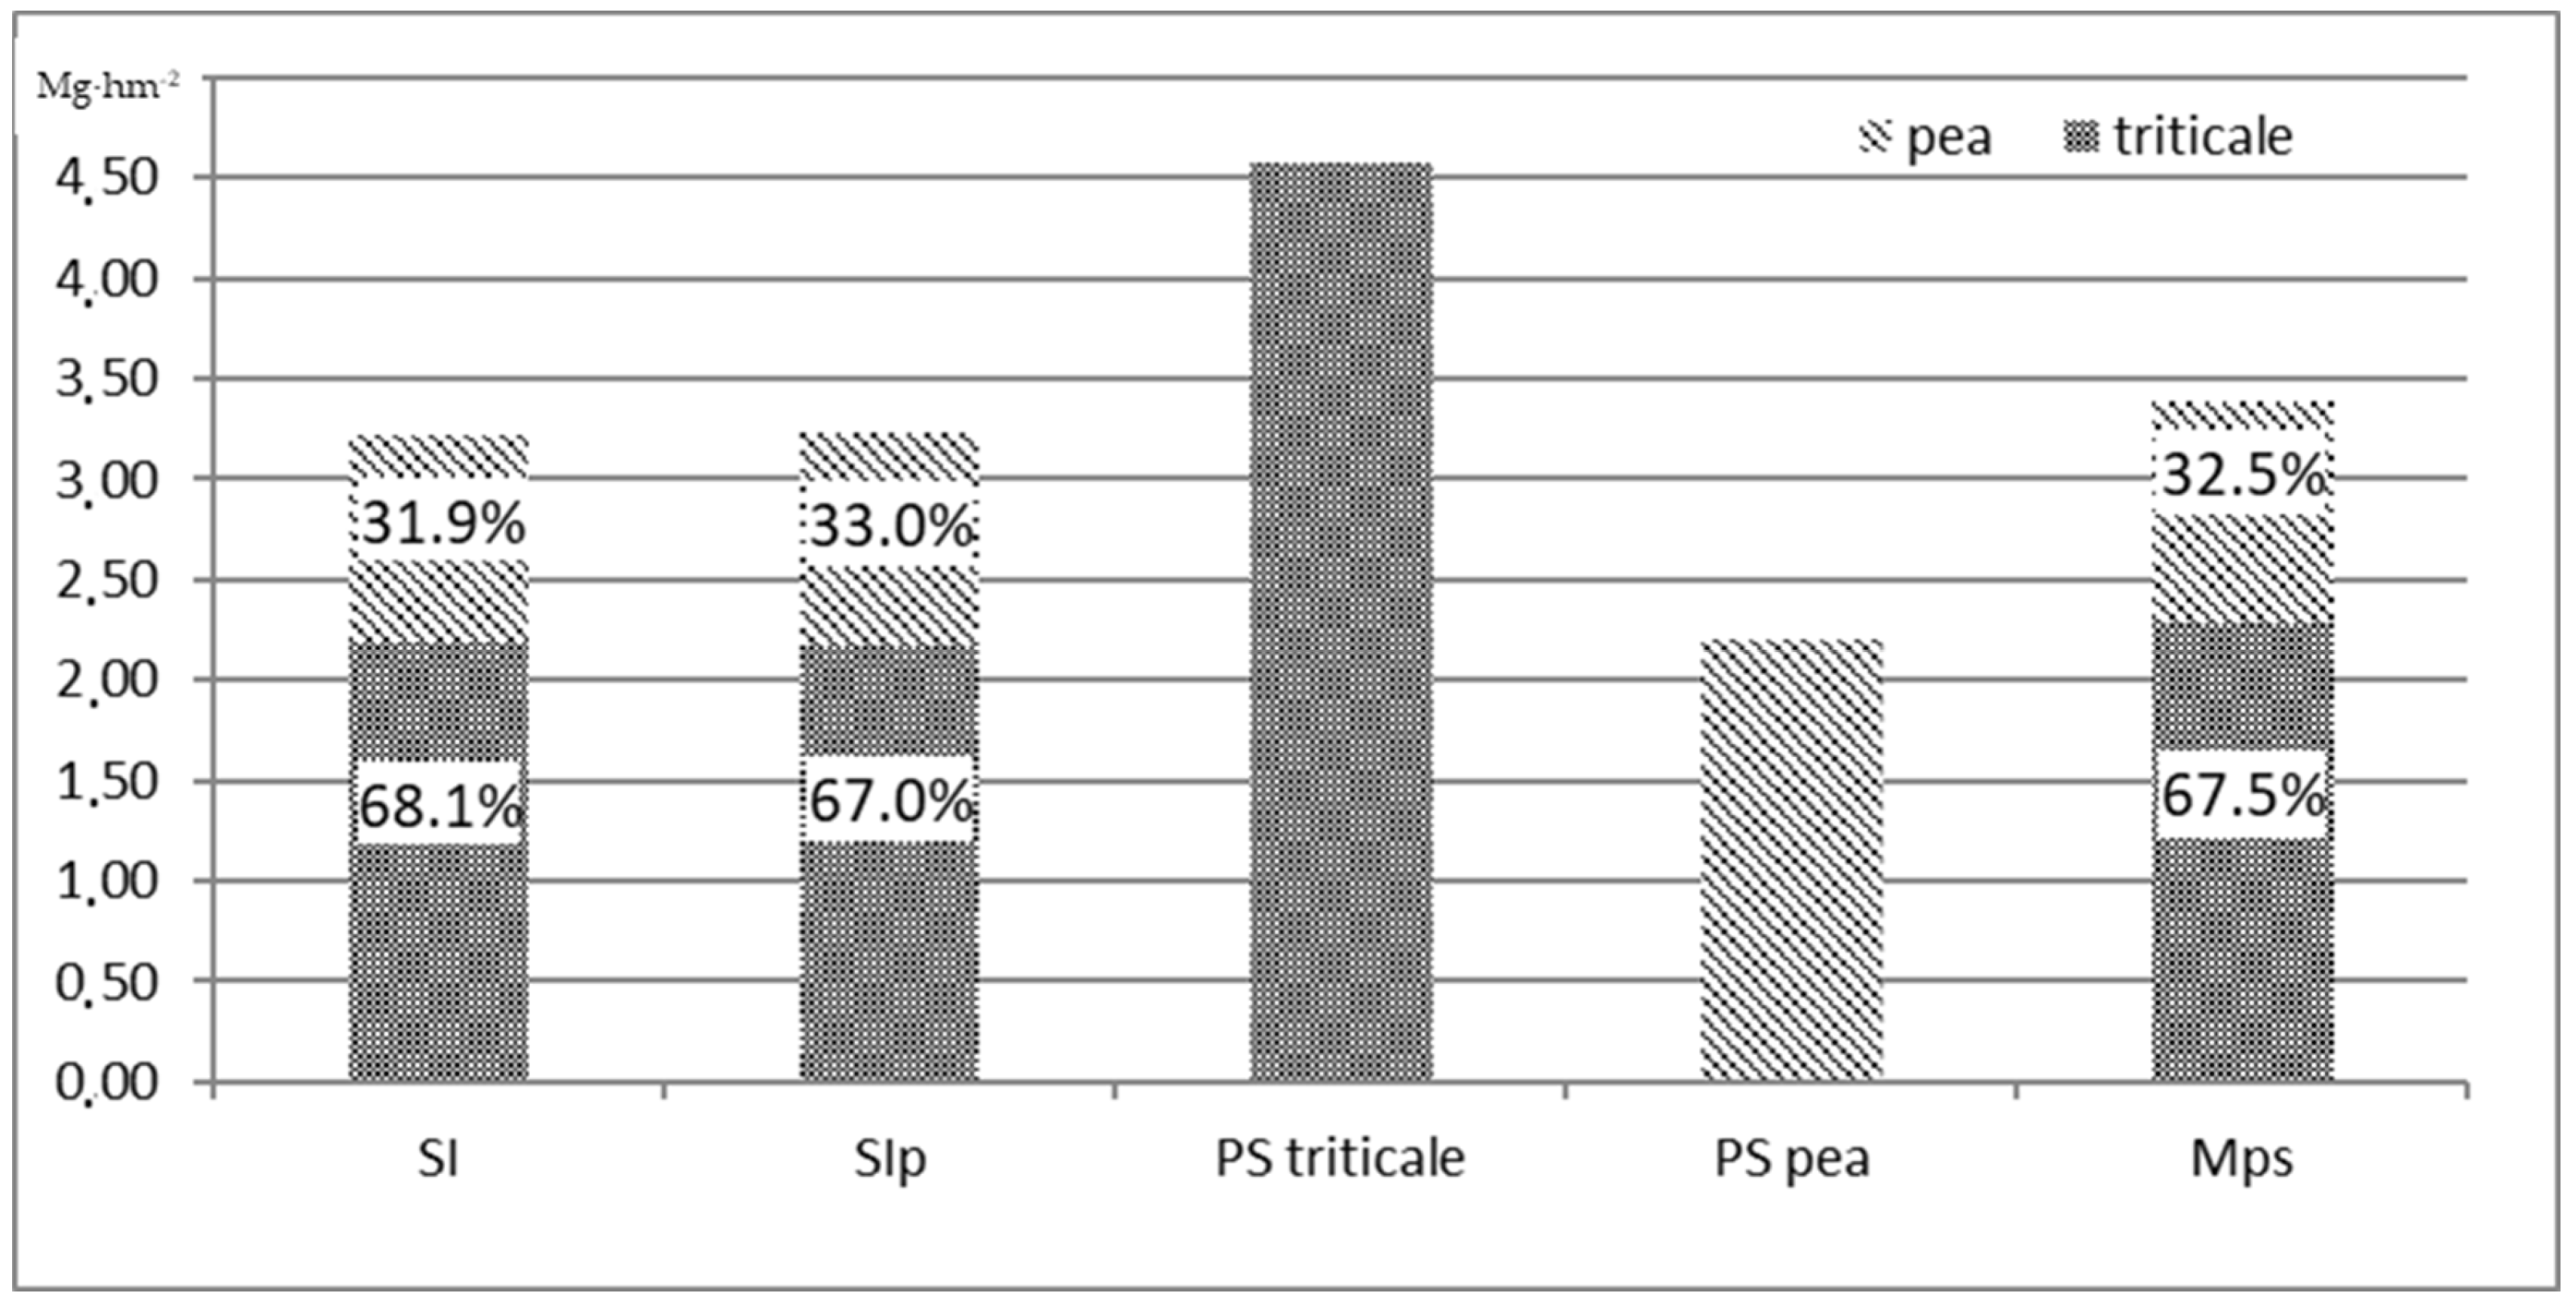
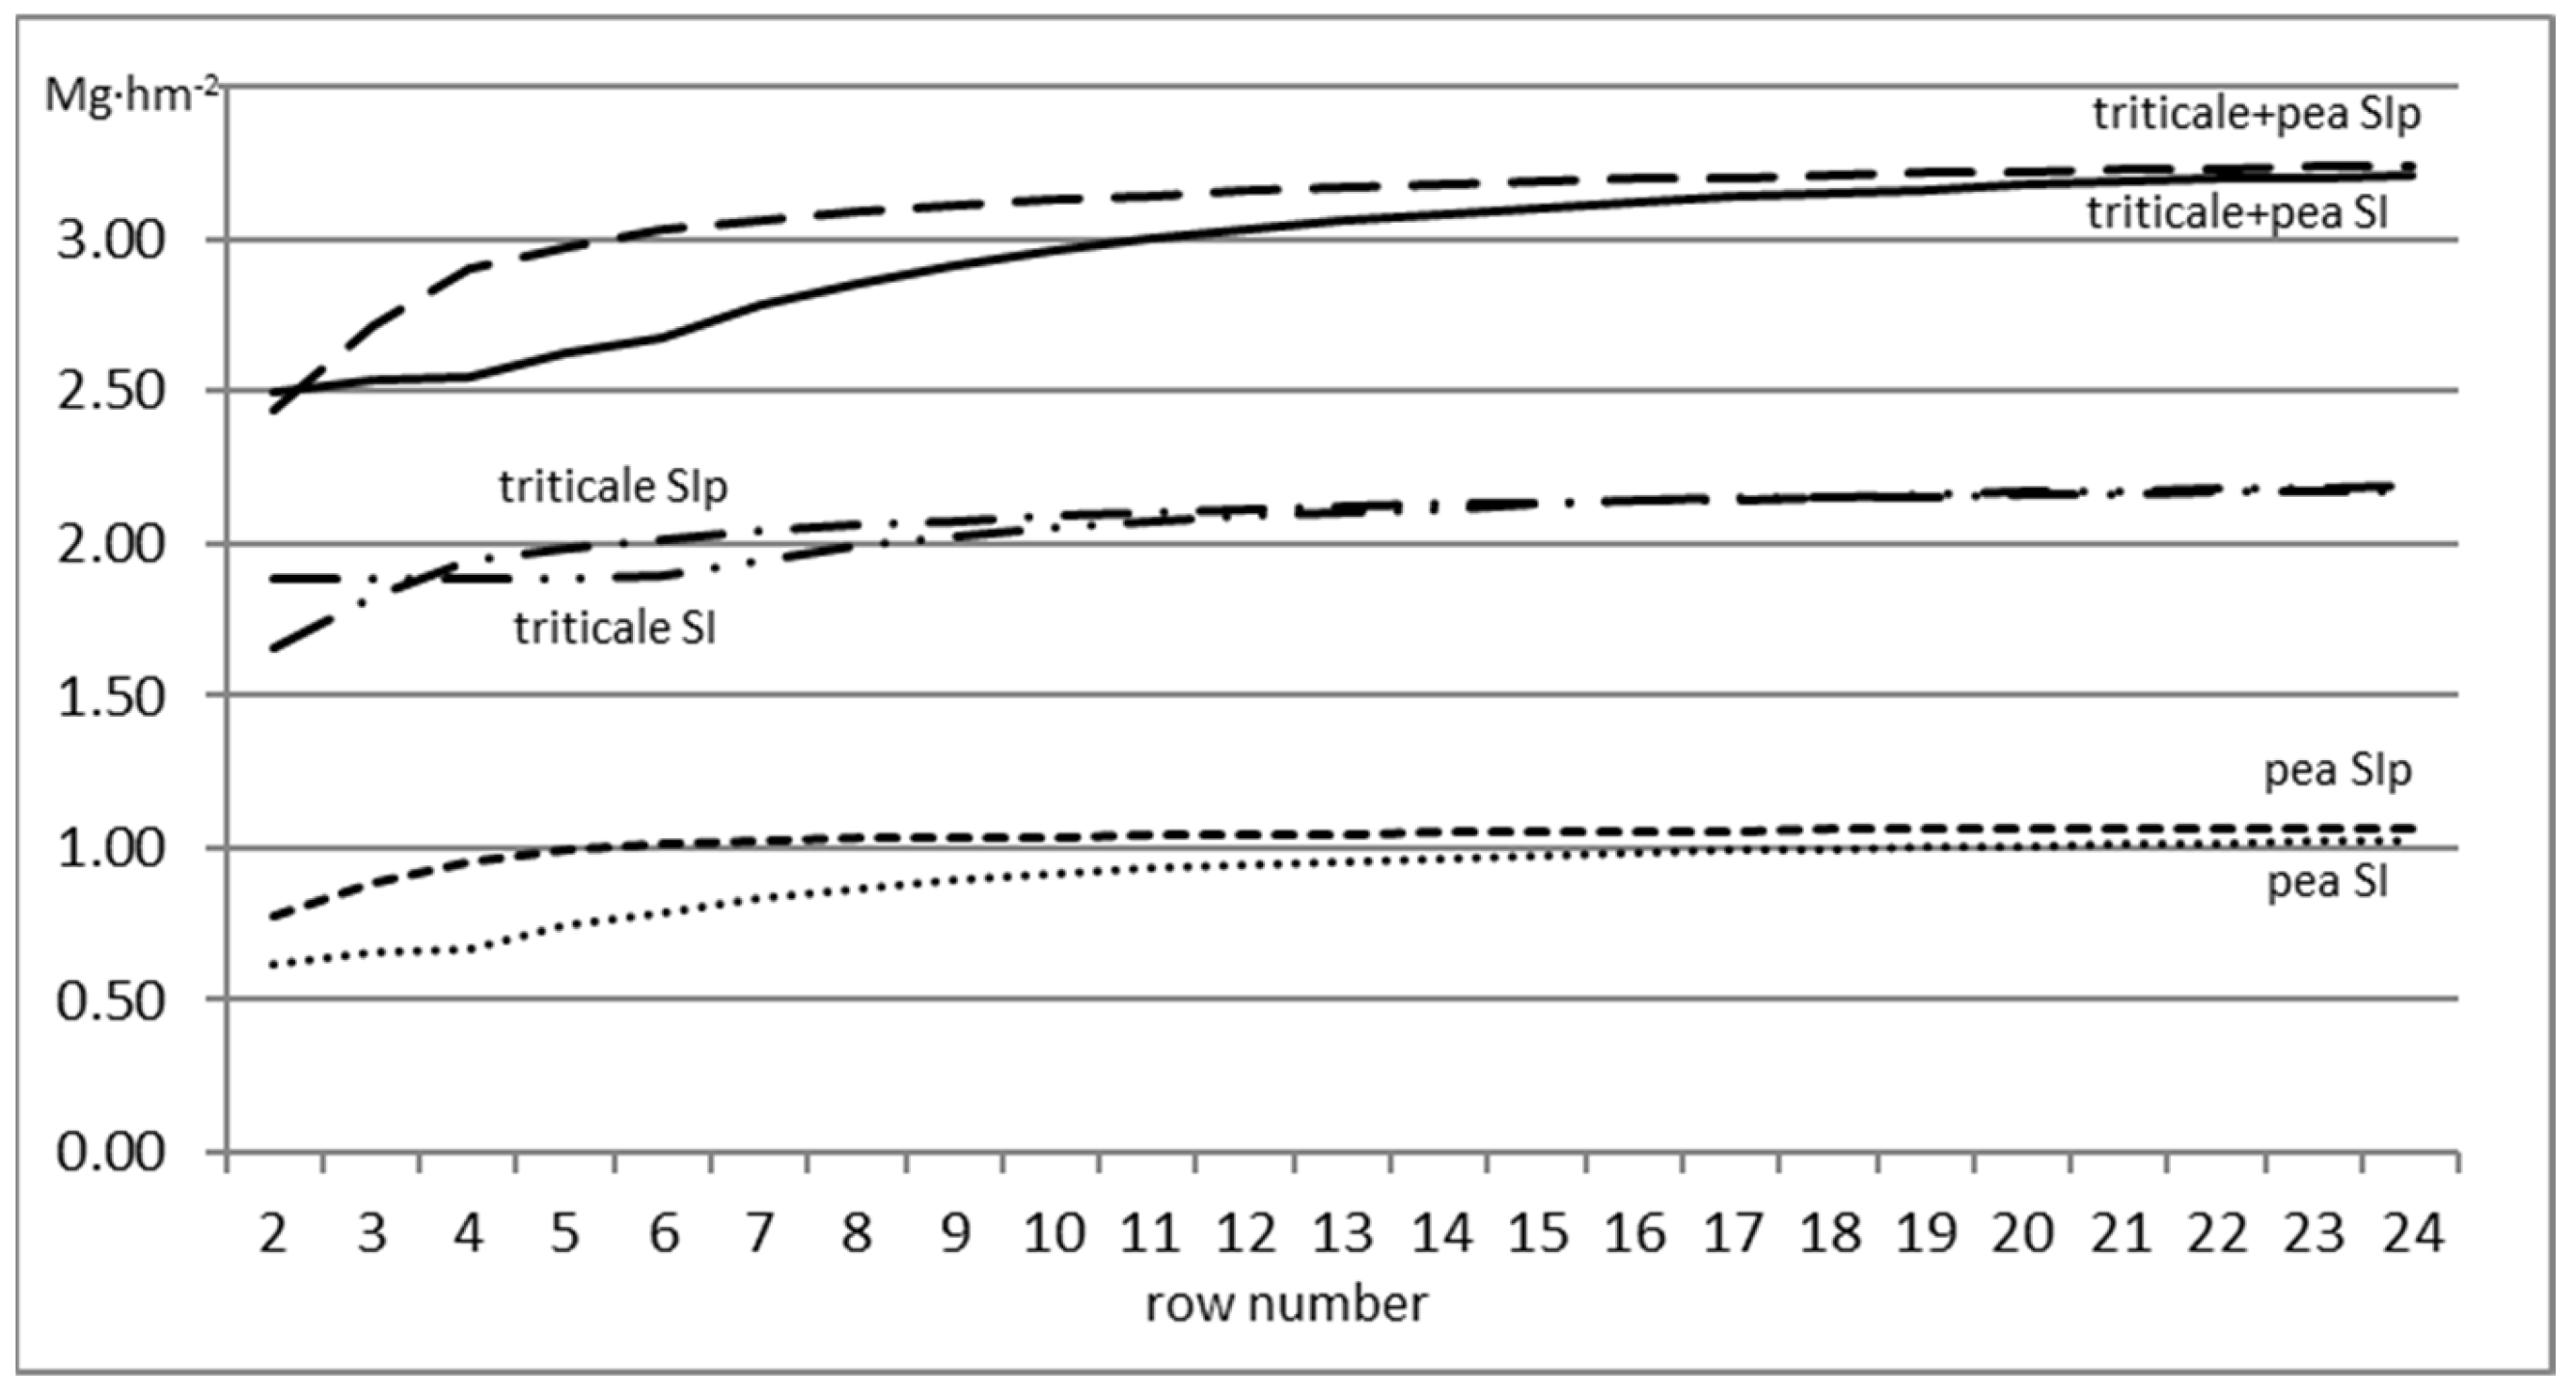
3.1.3. Triticale/Pea
3.2. Cereal/Cereal
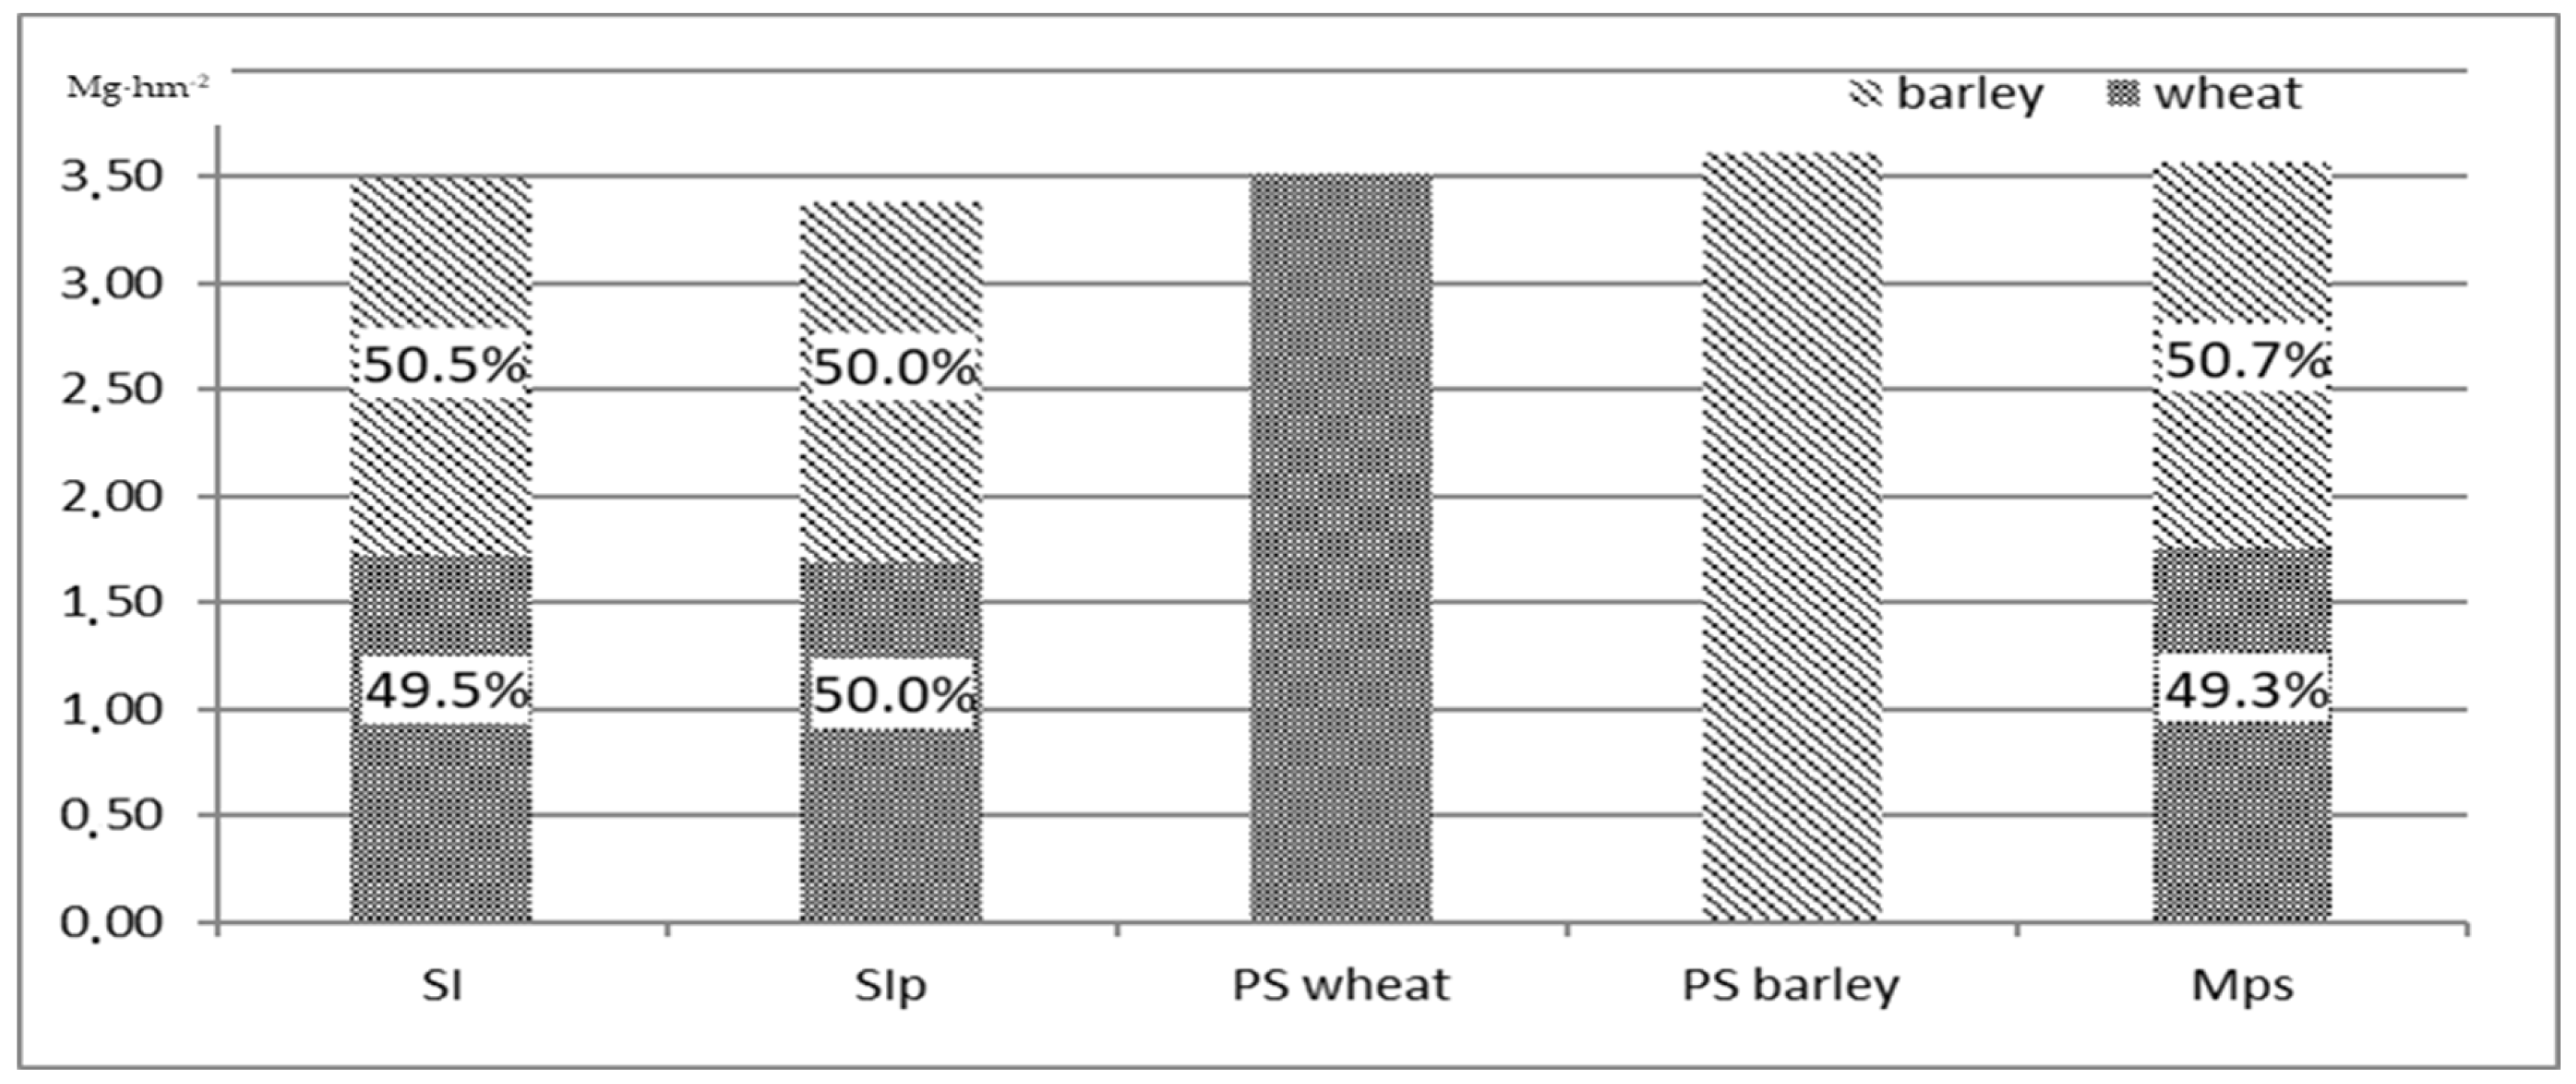
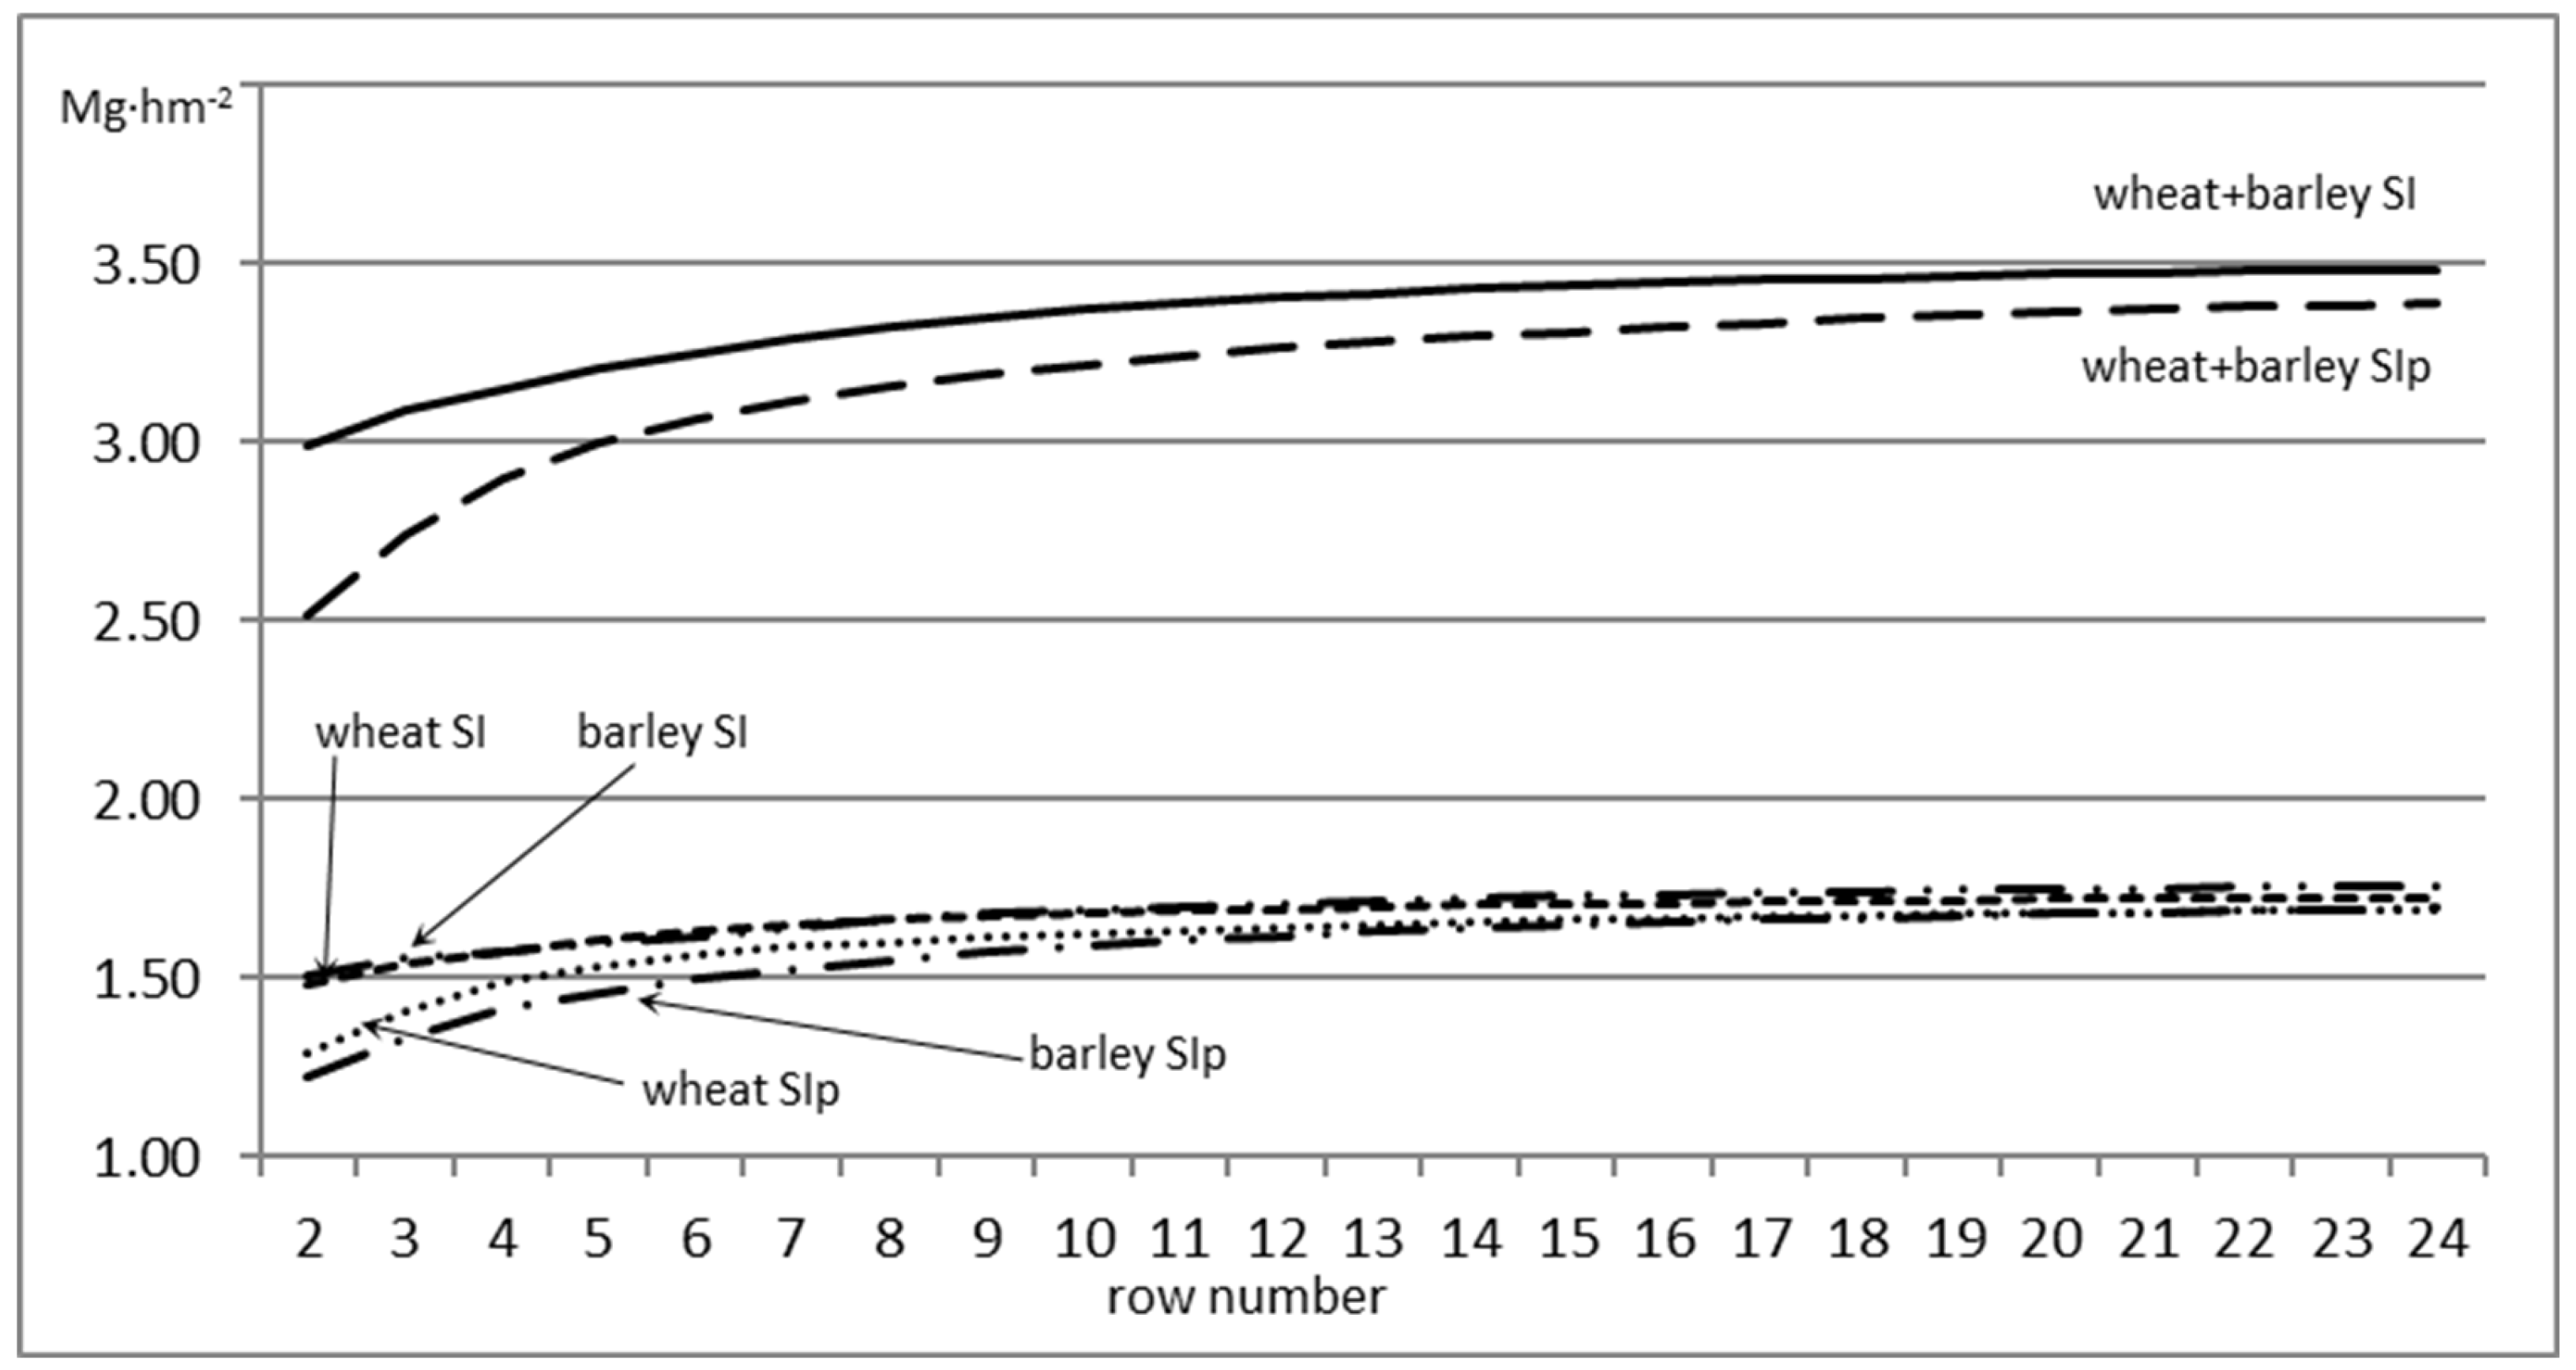
3.2.1. Wheat/Barley
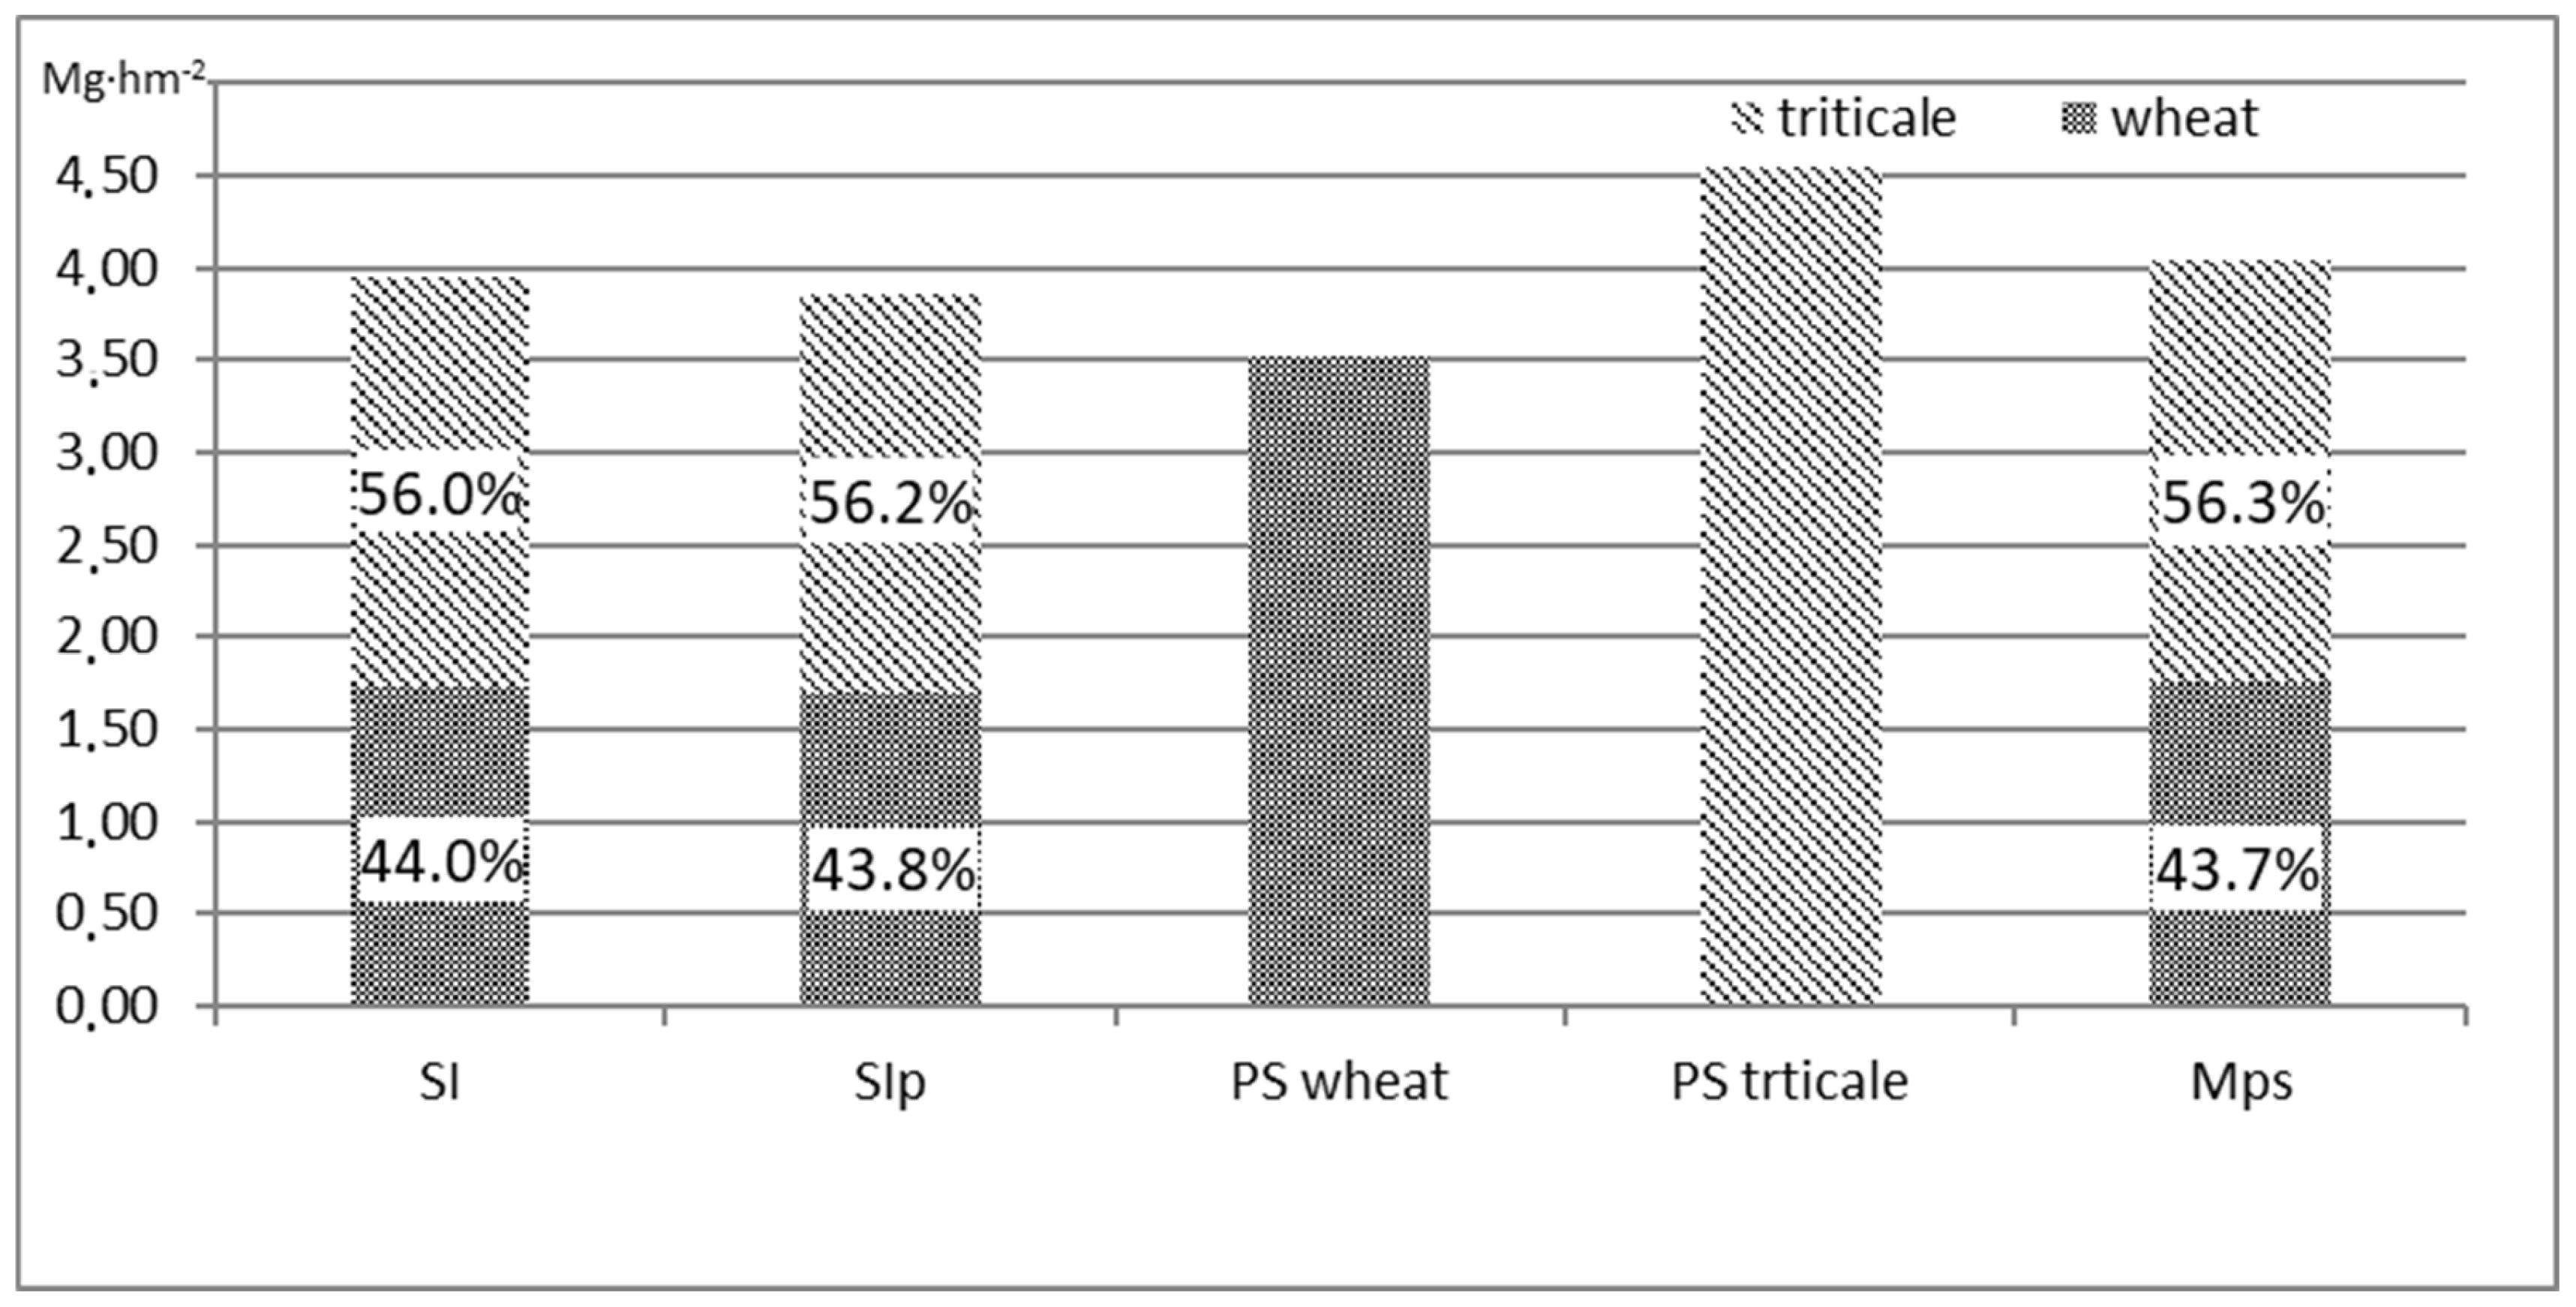
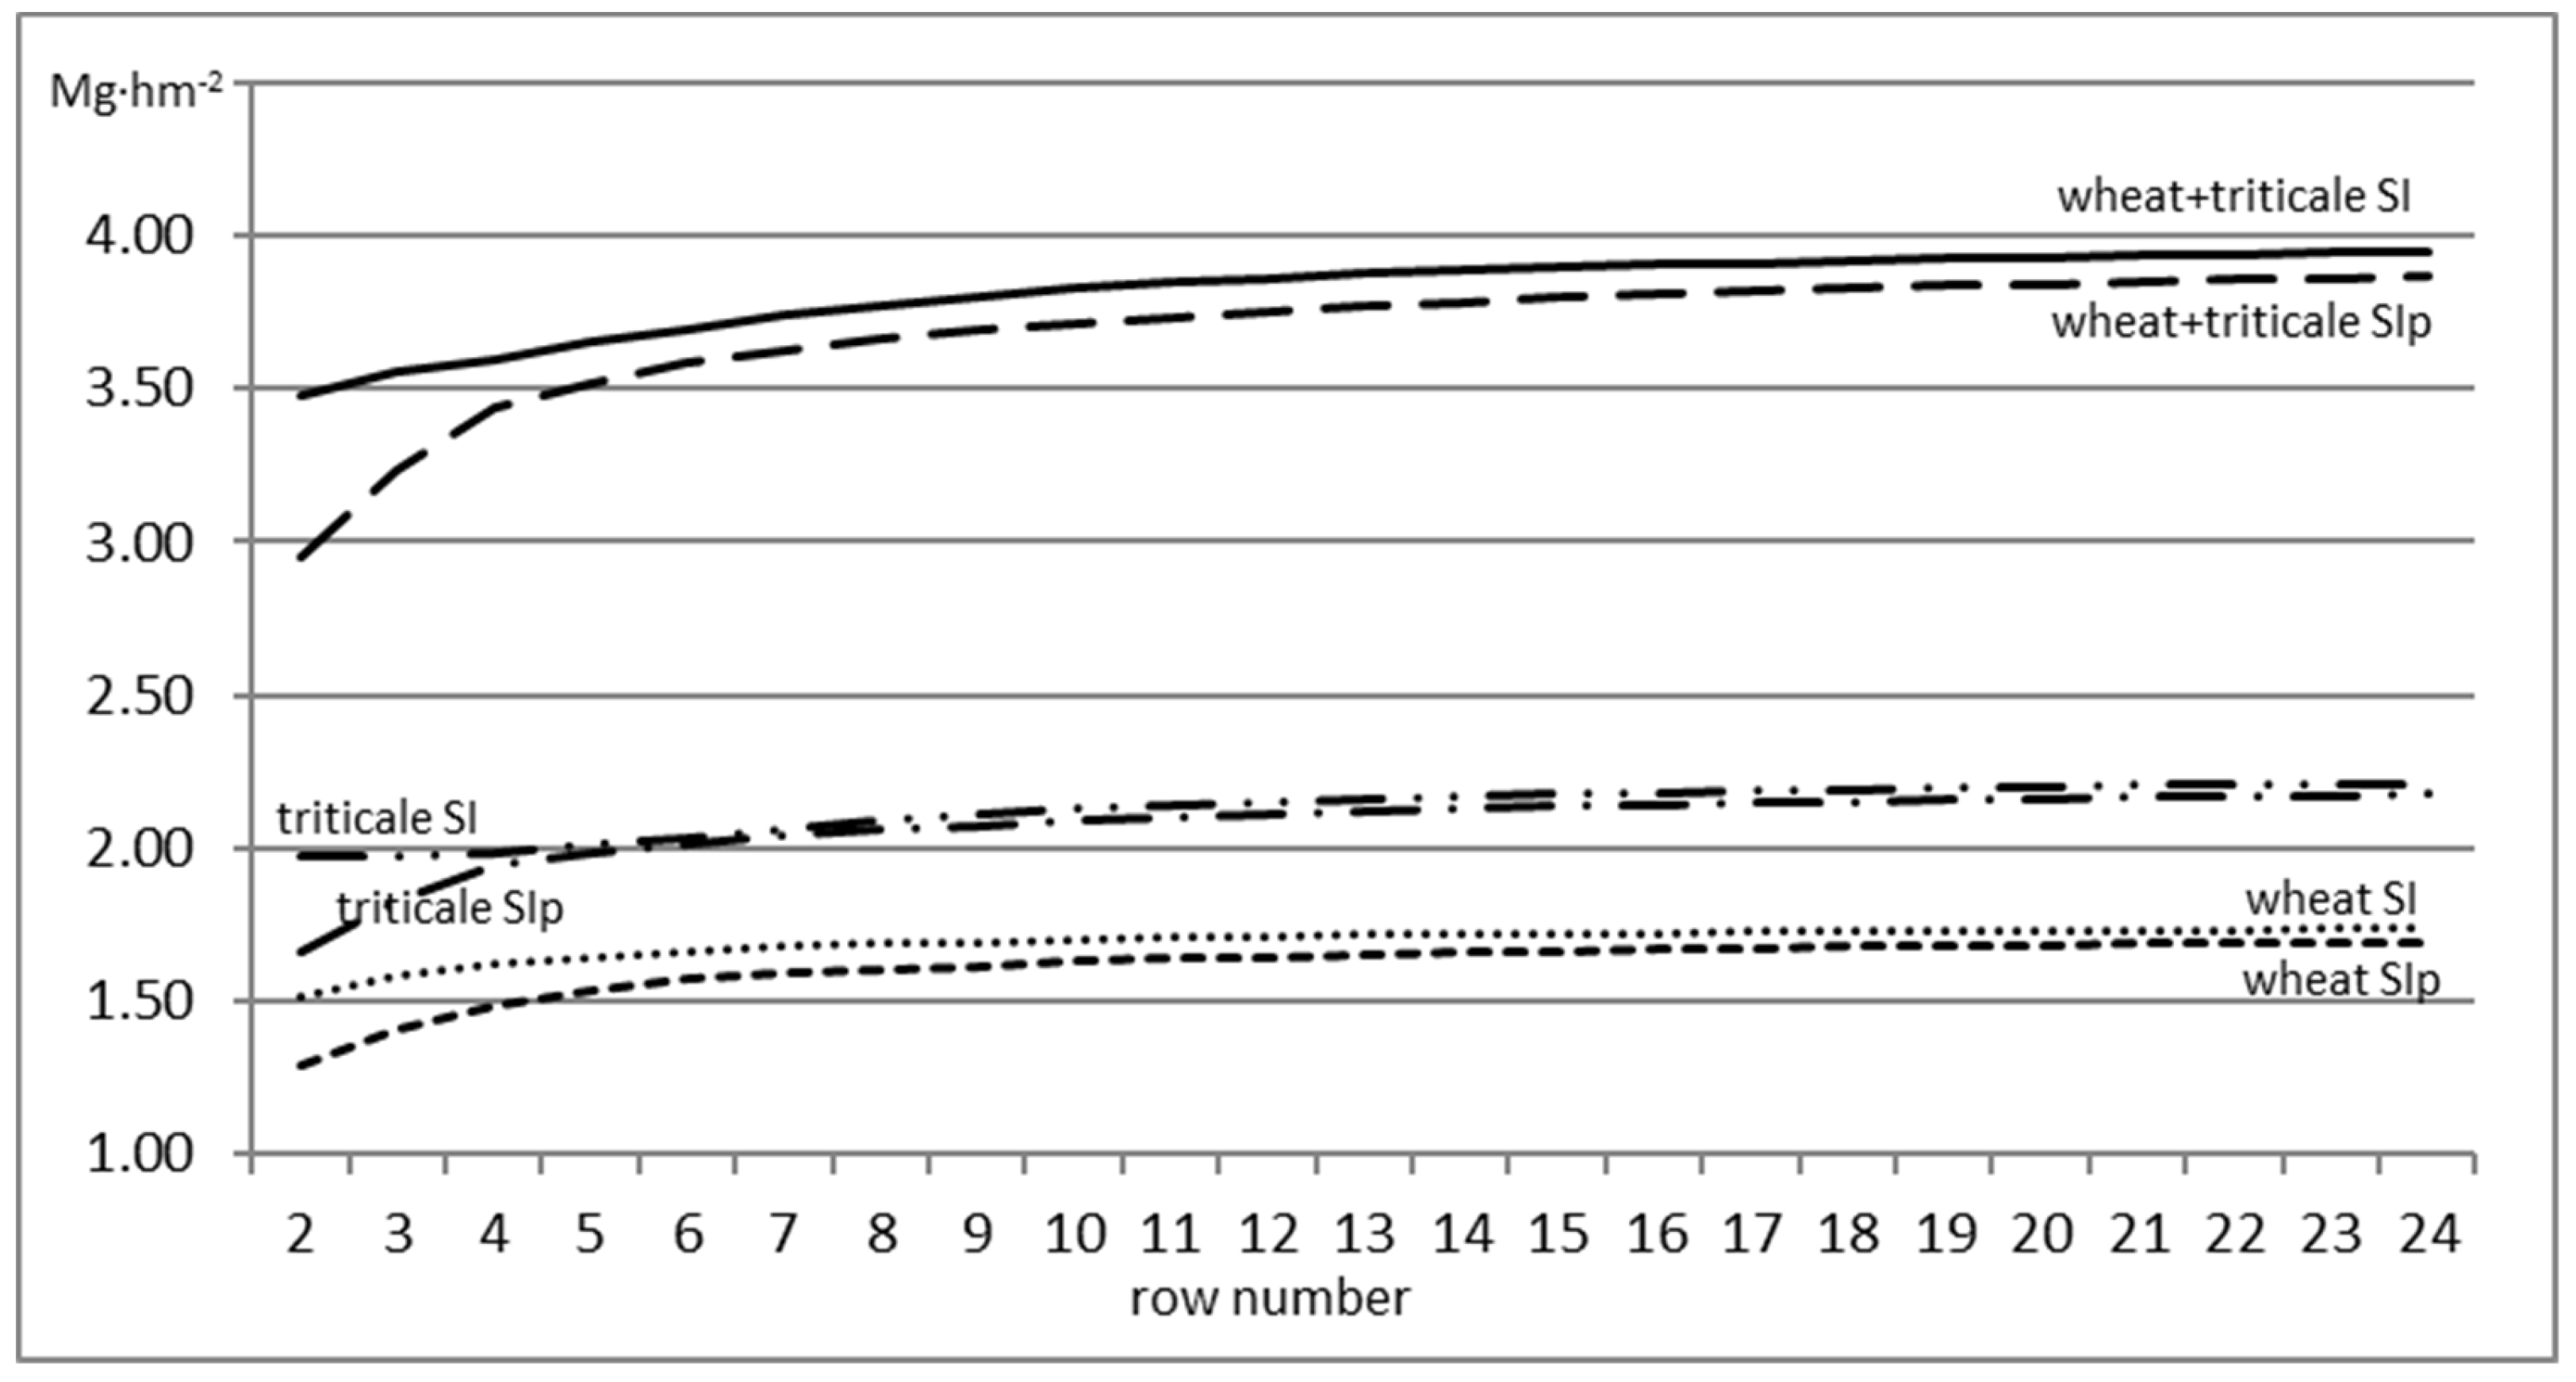
3.2.2. Wheat/Triticale
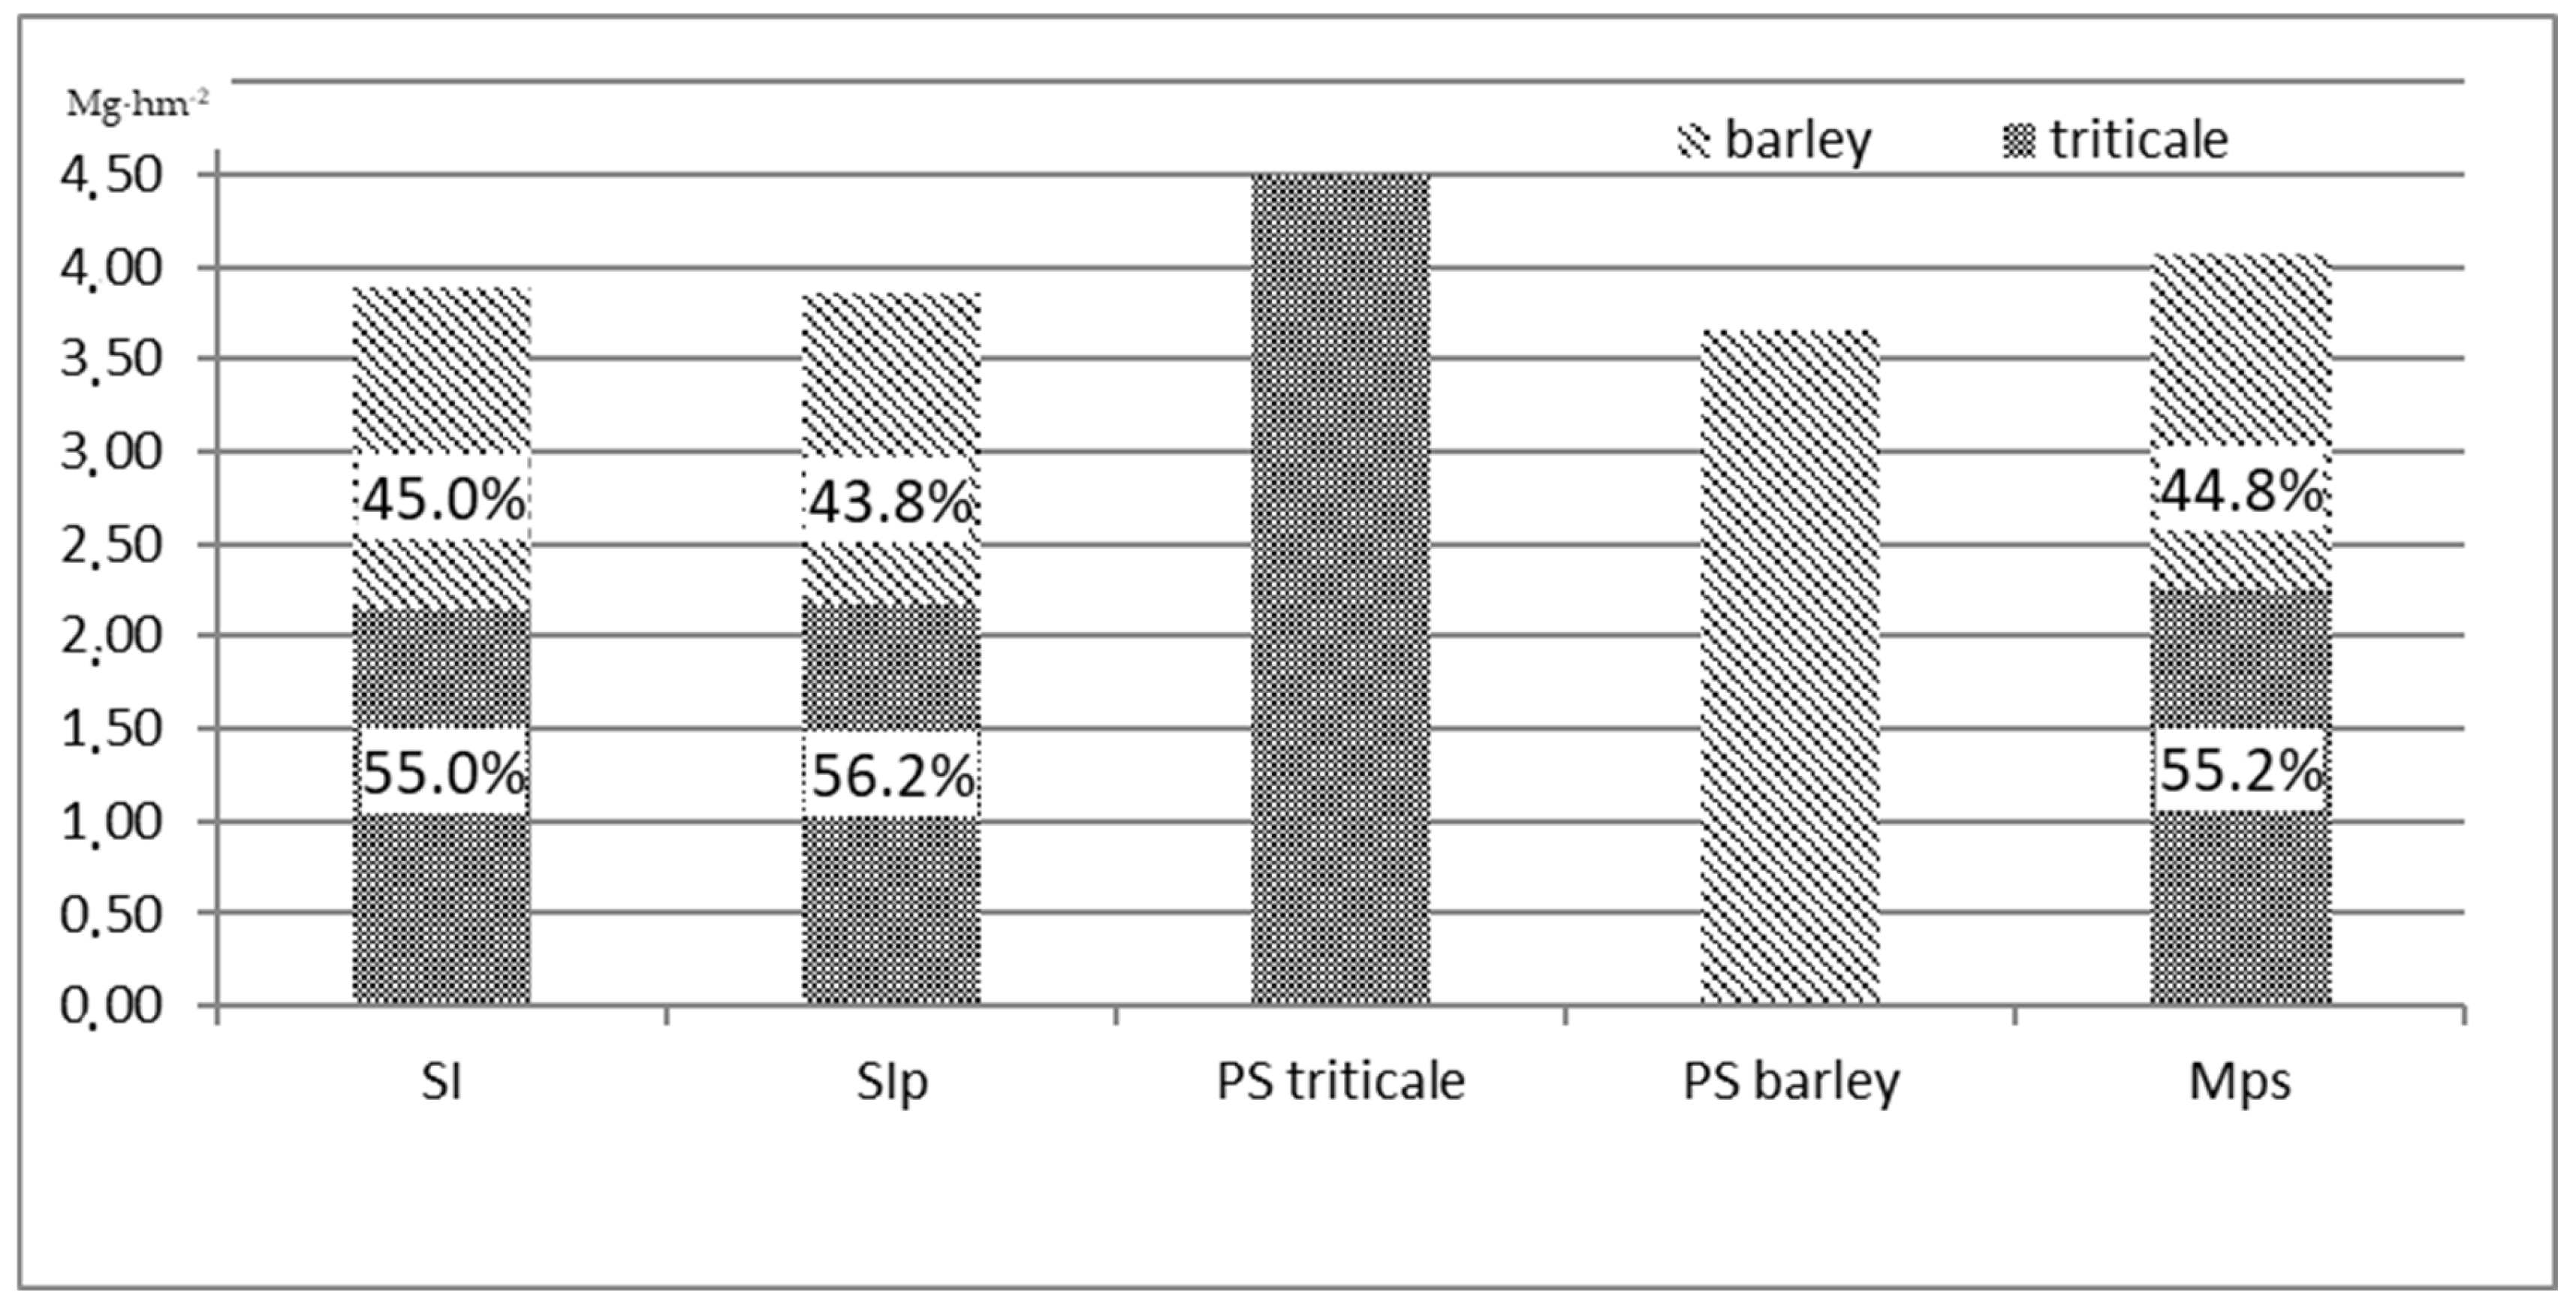
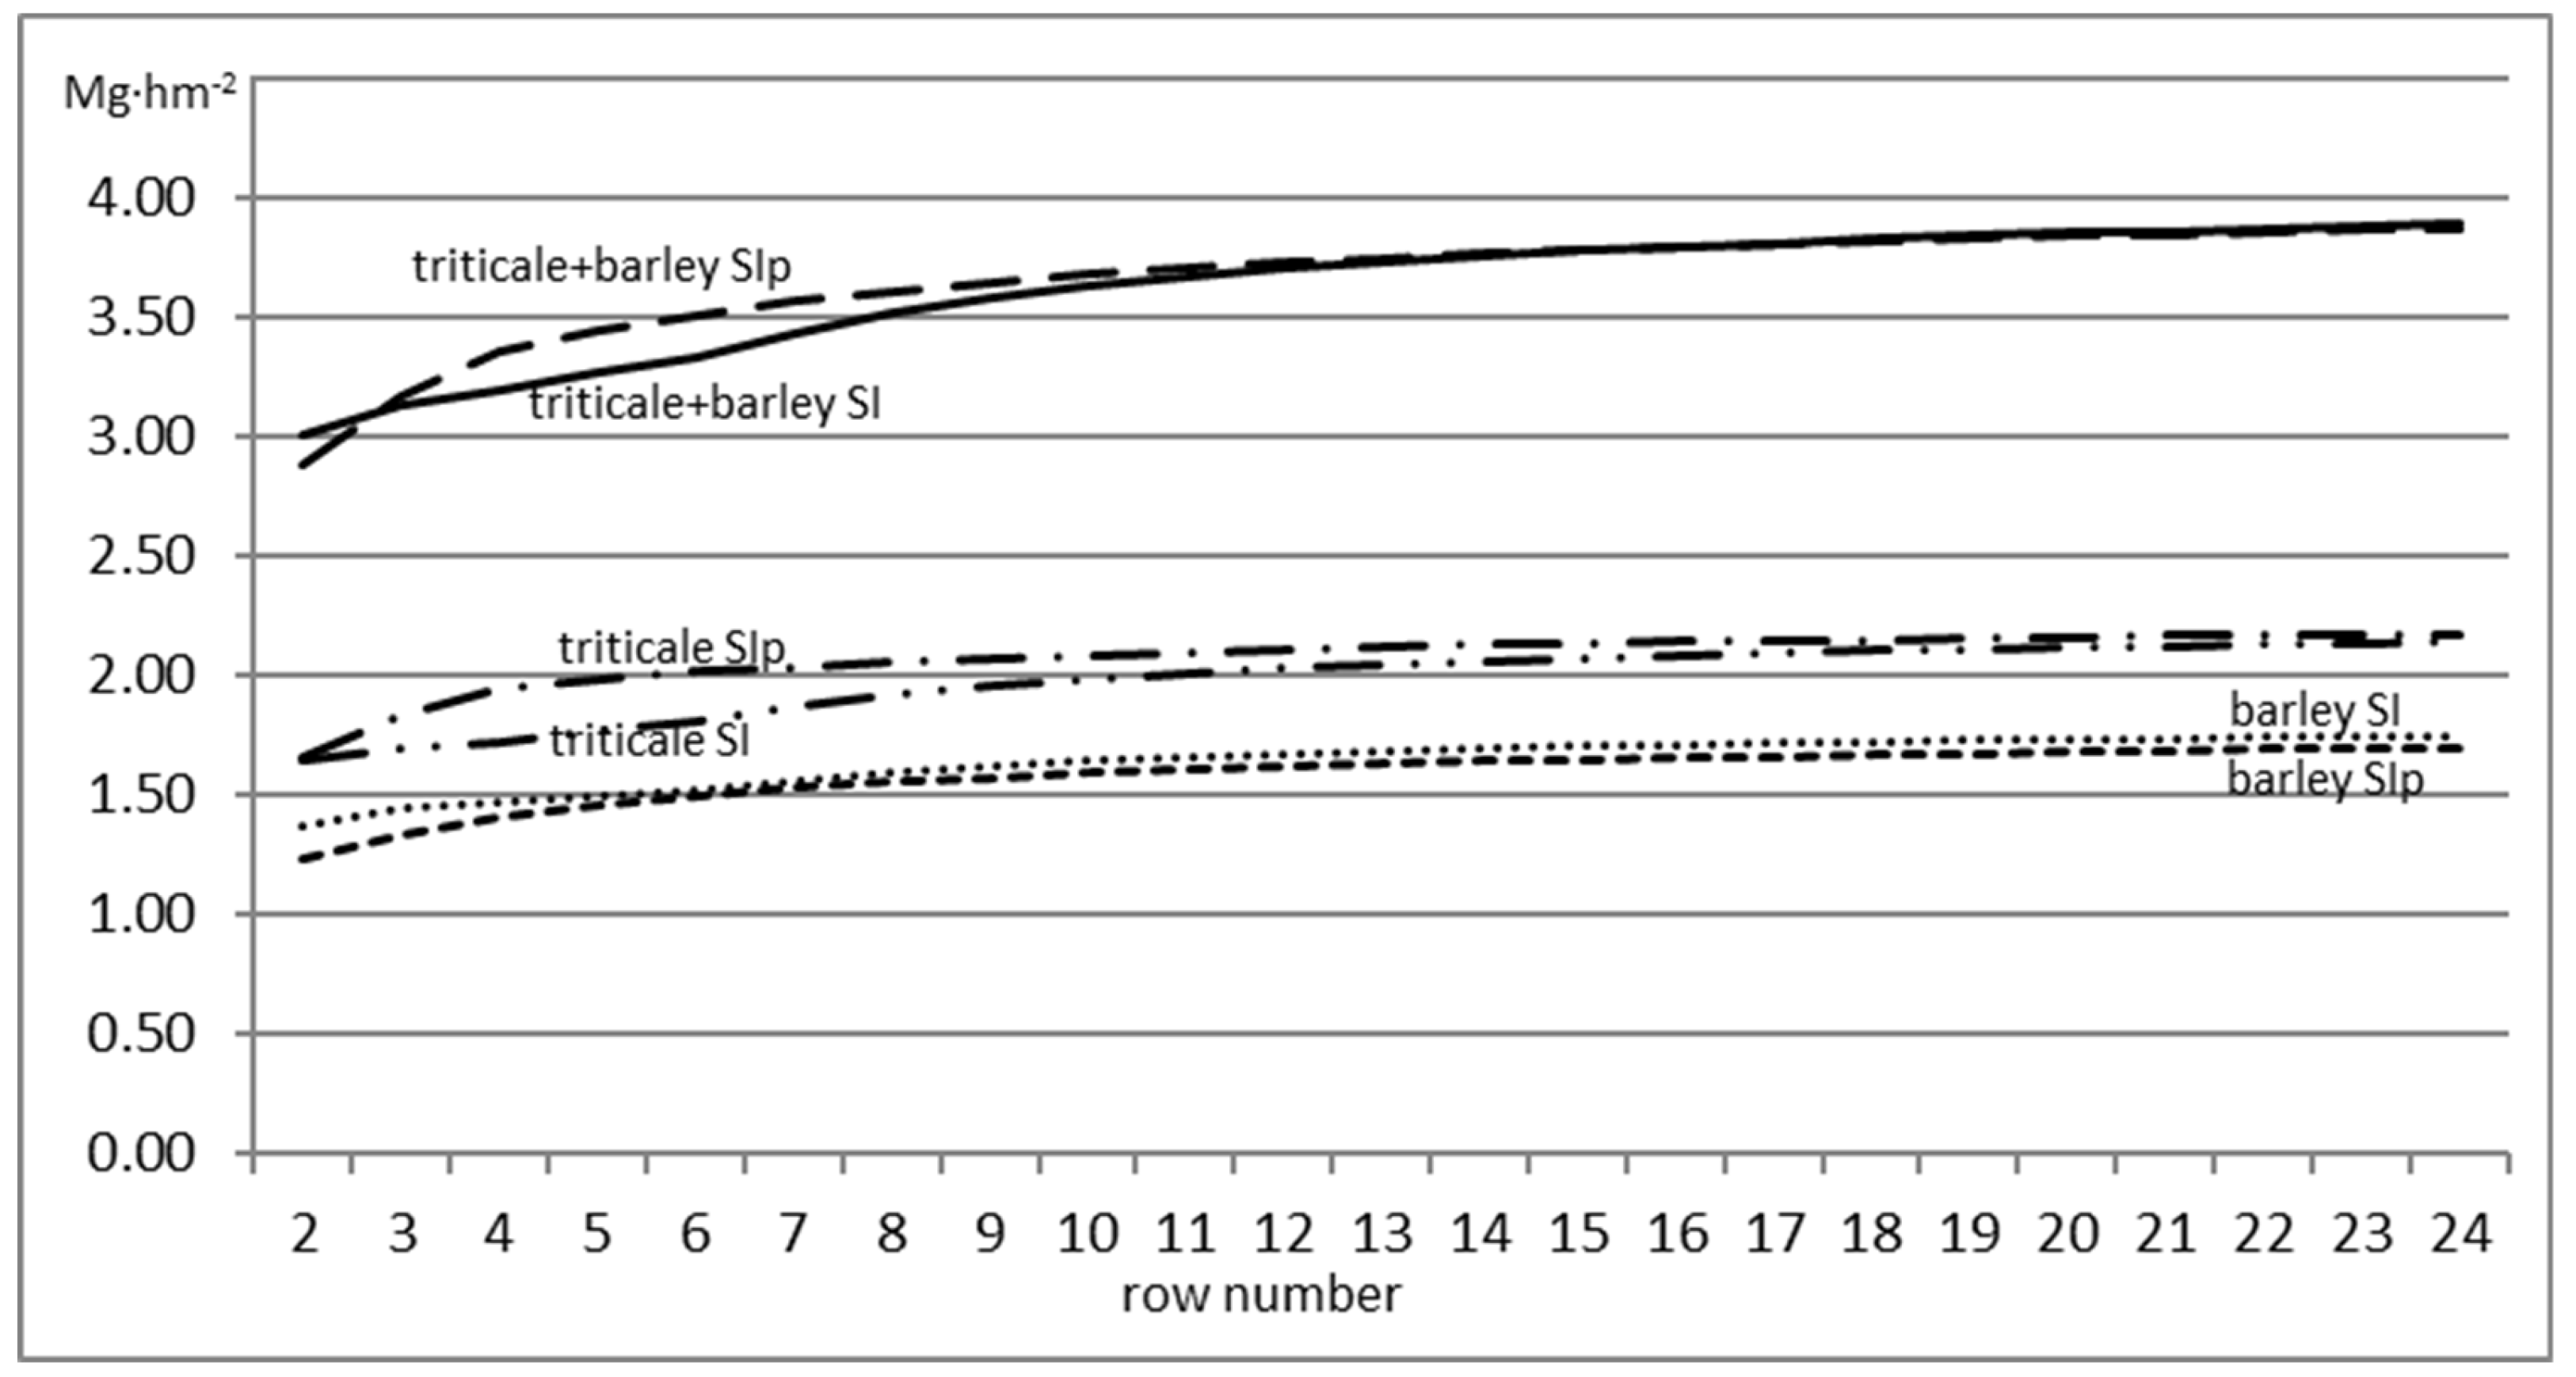
3.2.3. Triticale/Barley
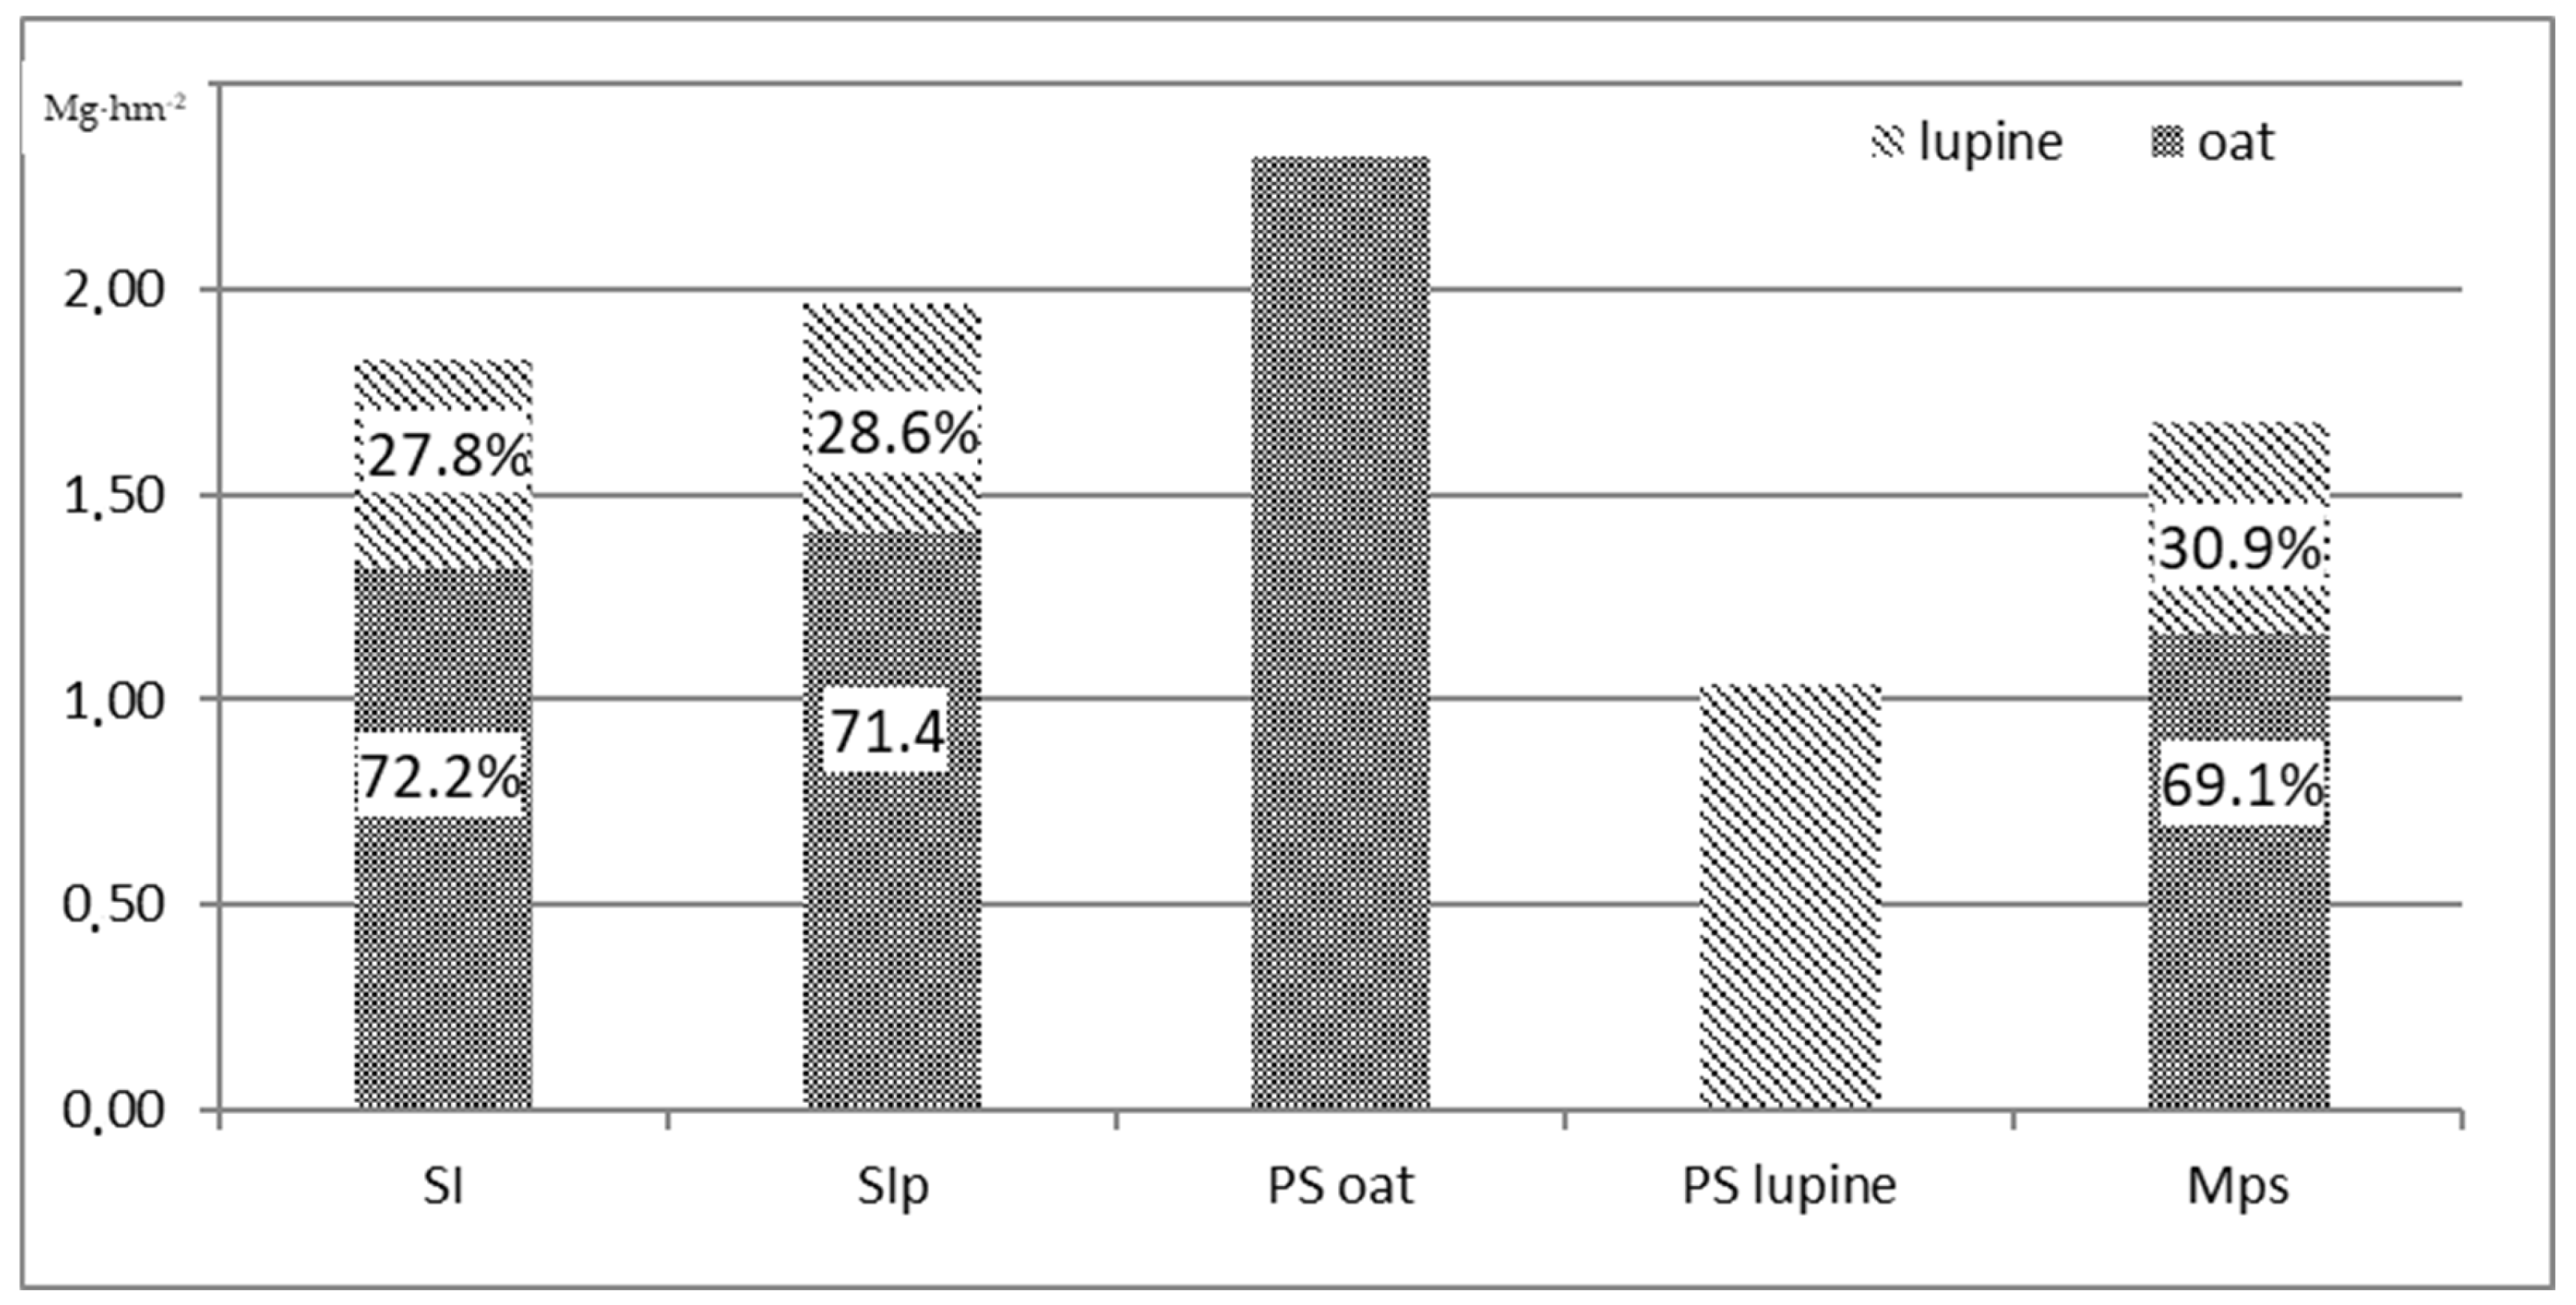
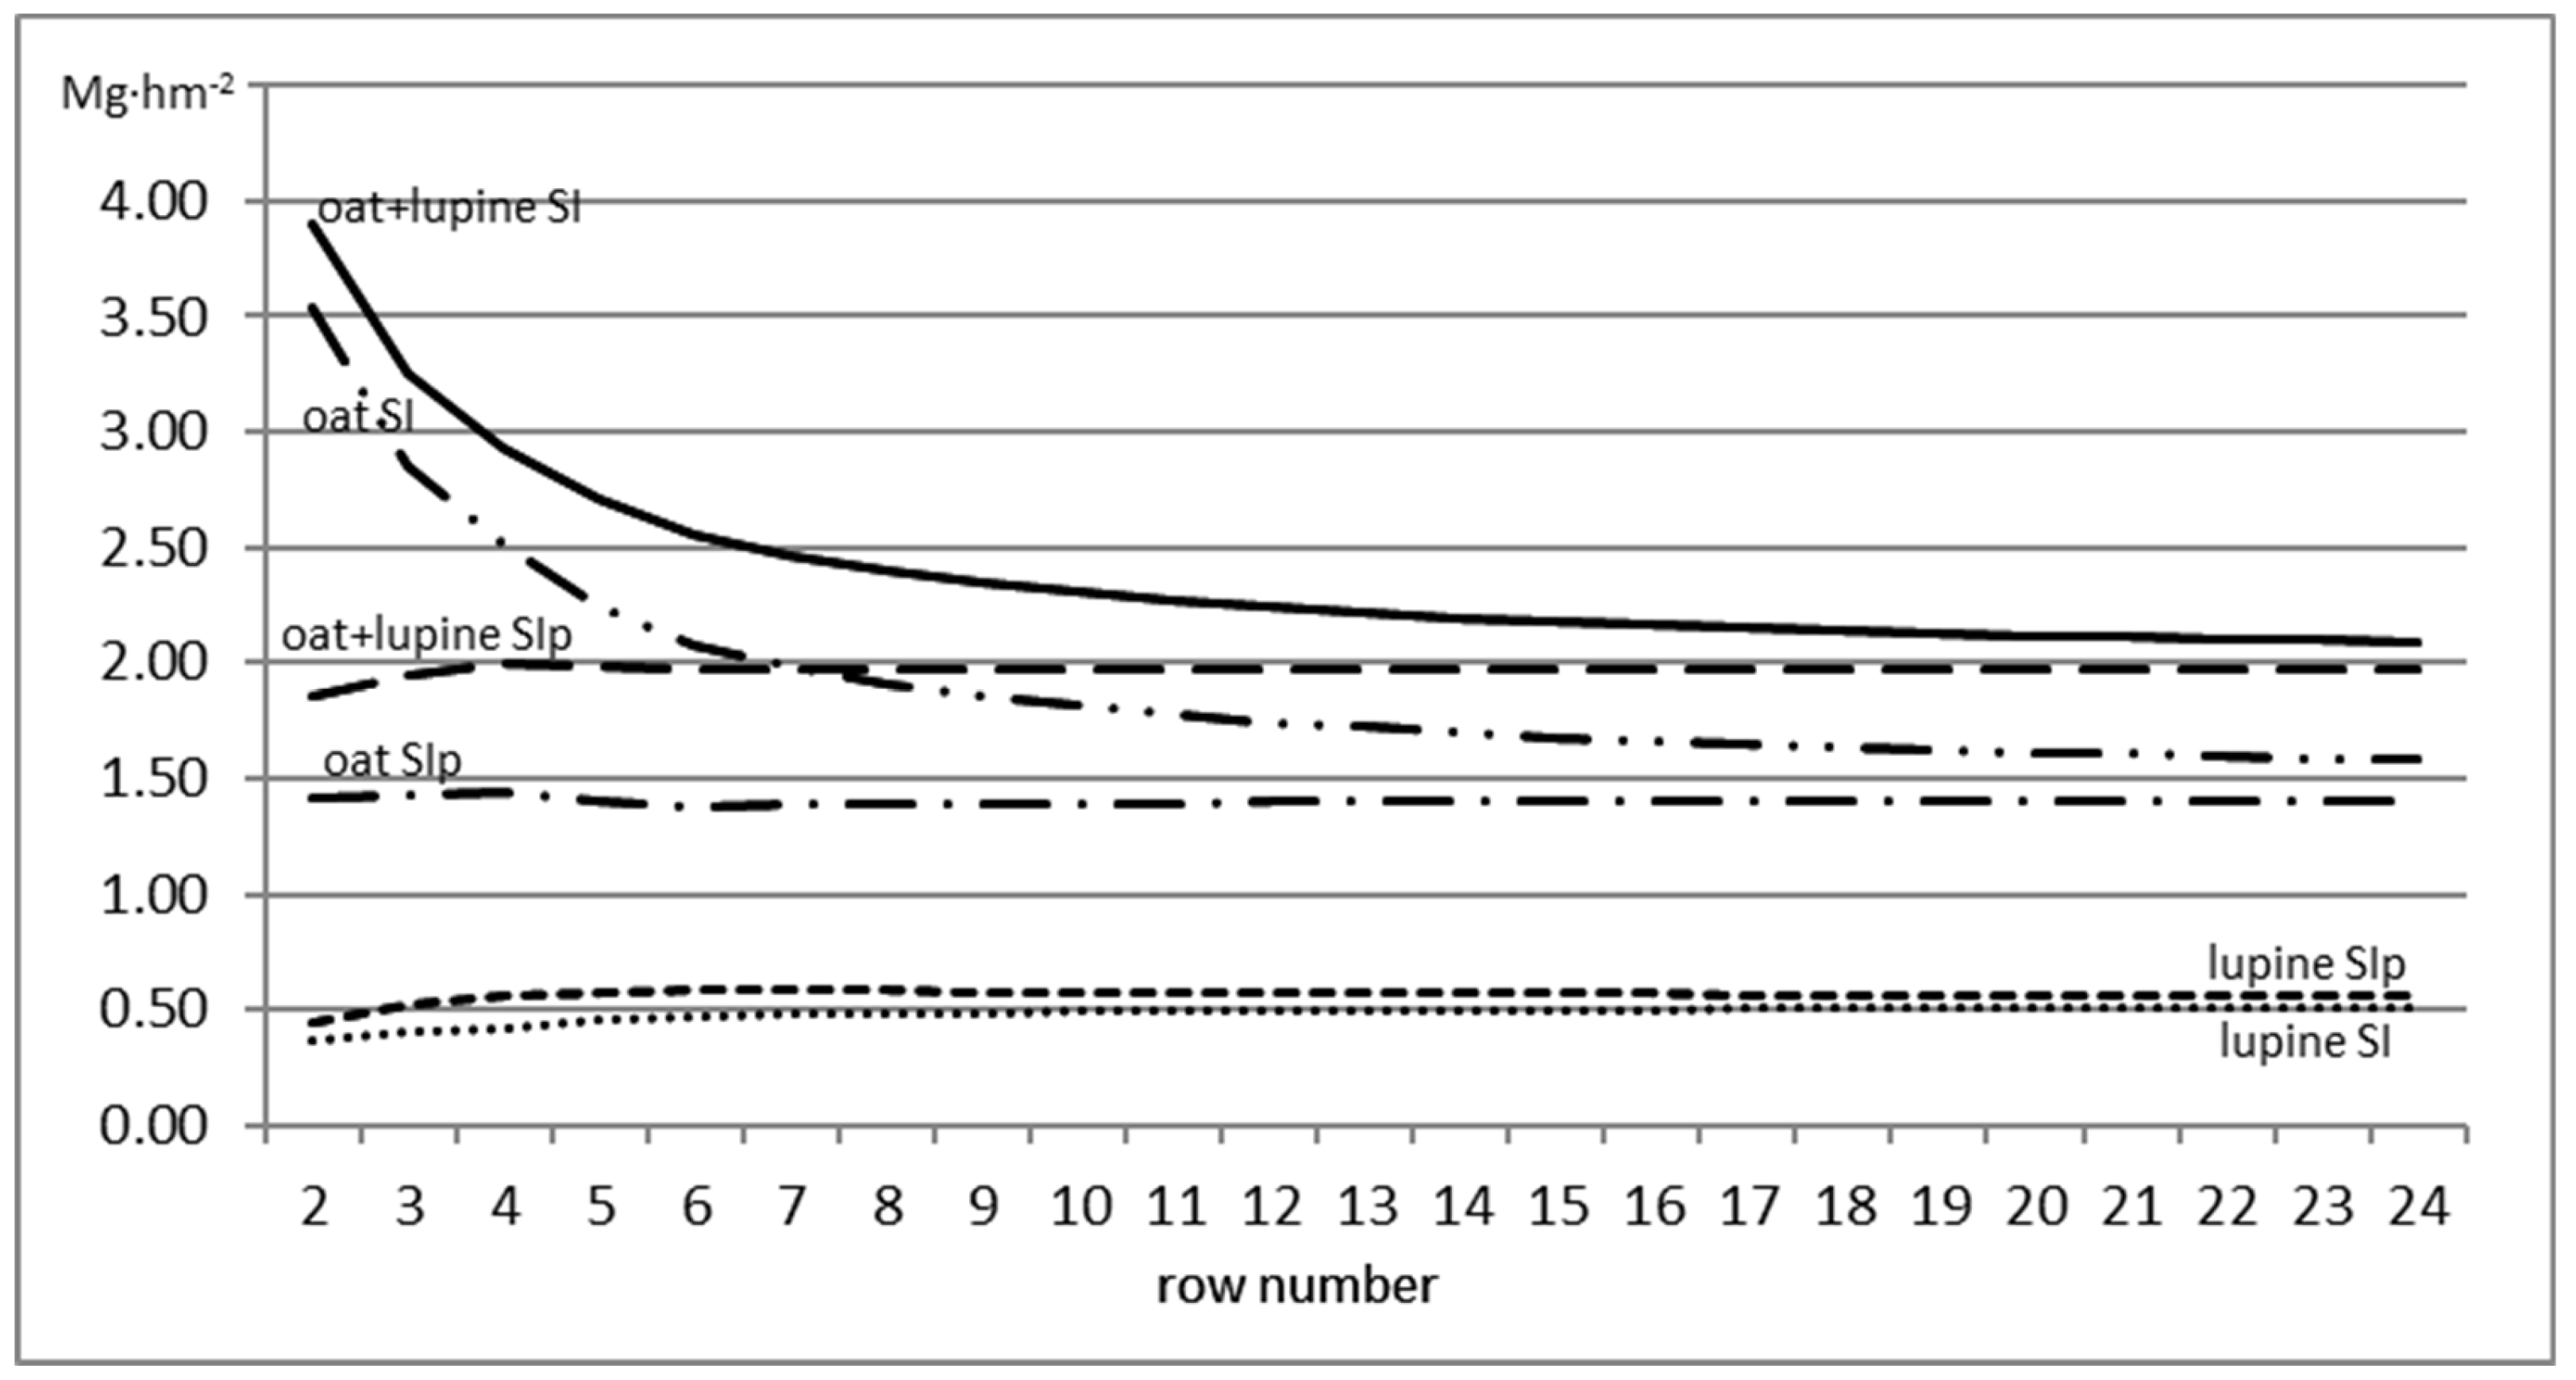
3.3. Oat/Lupine
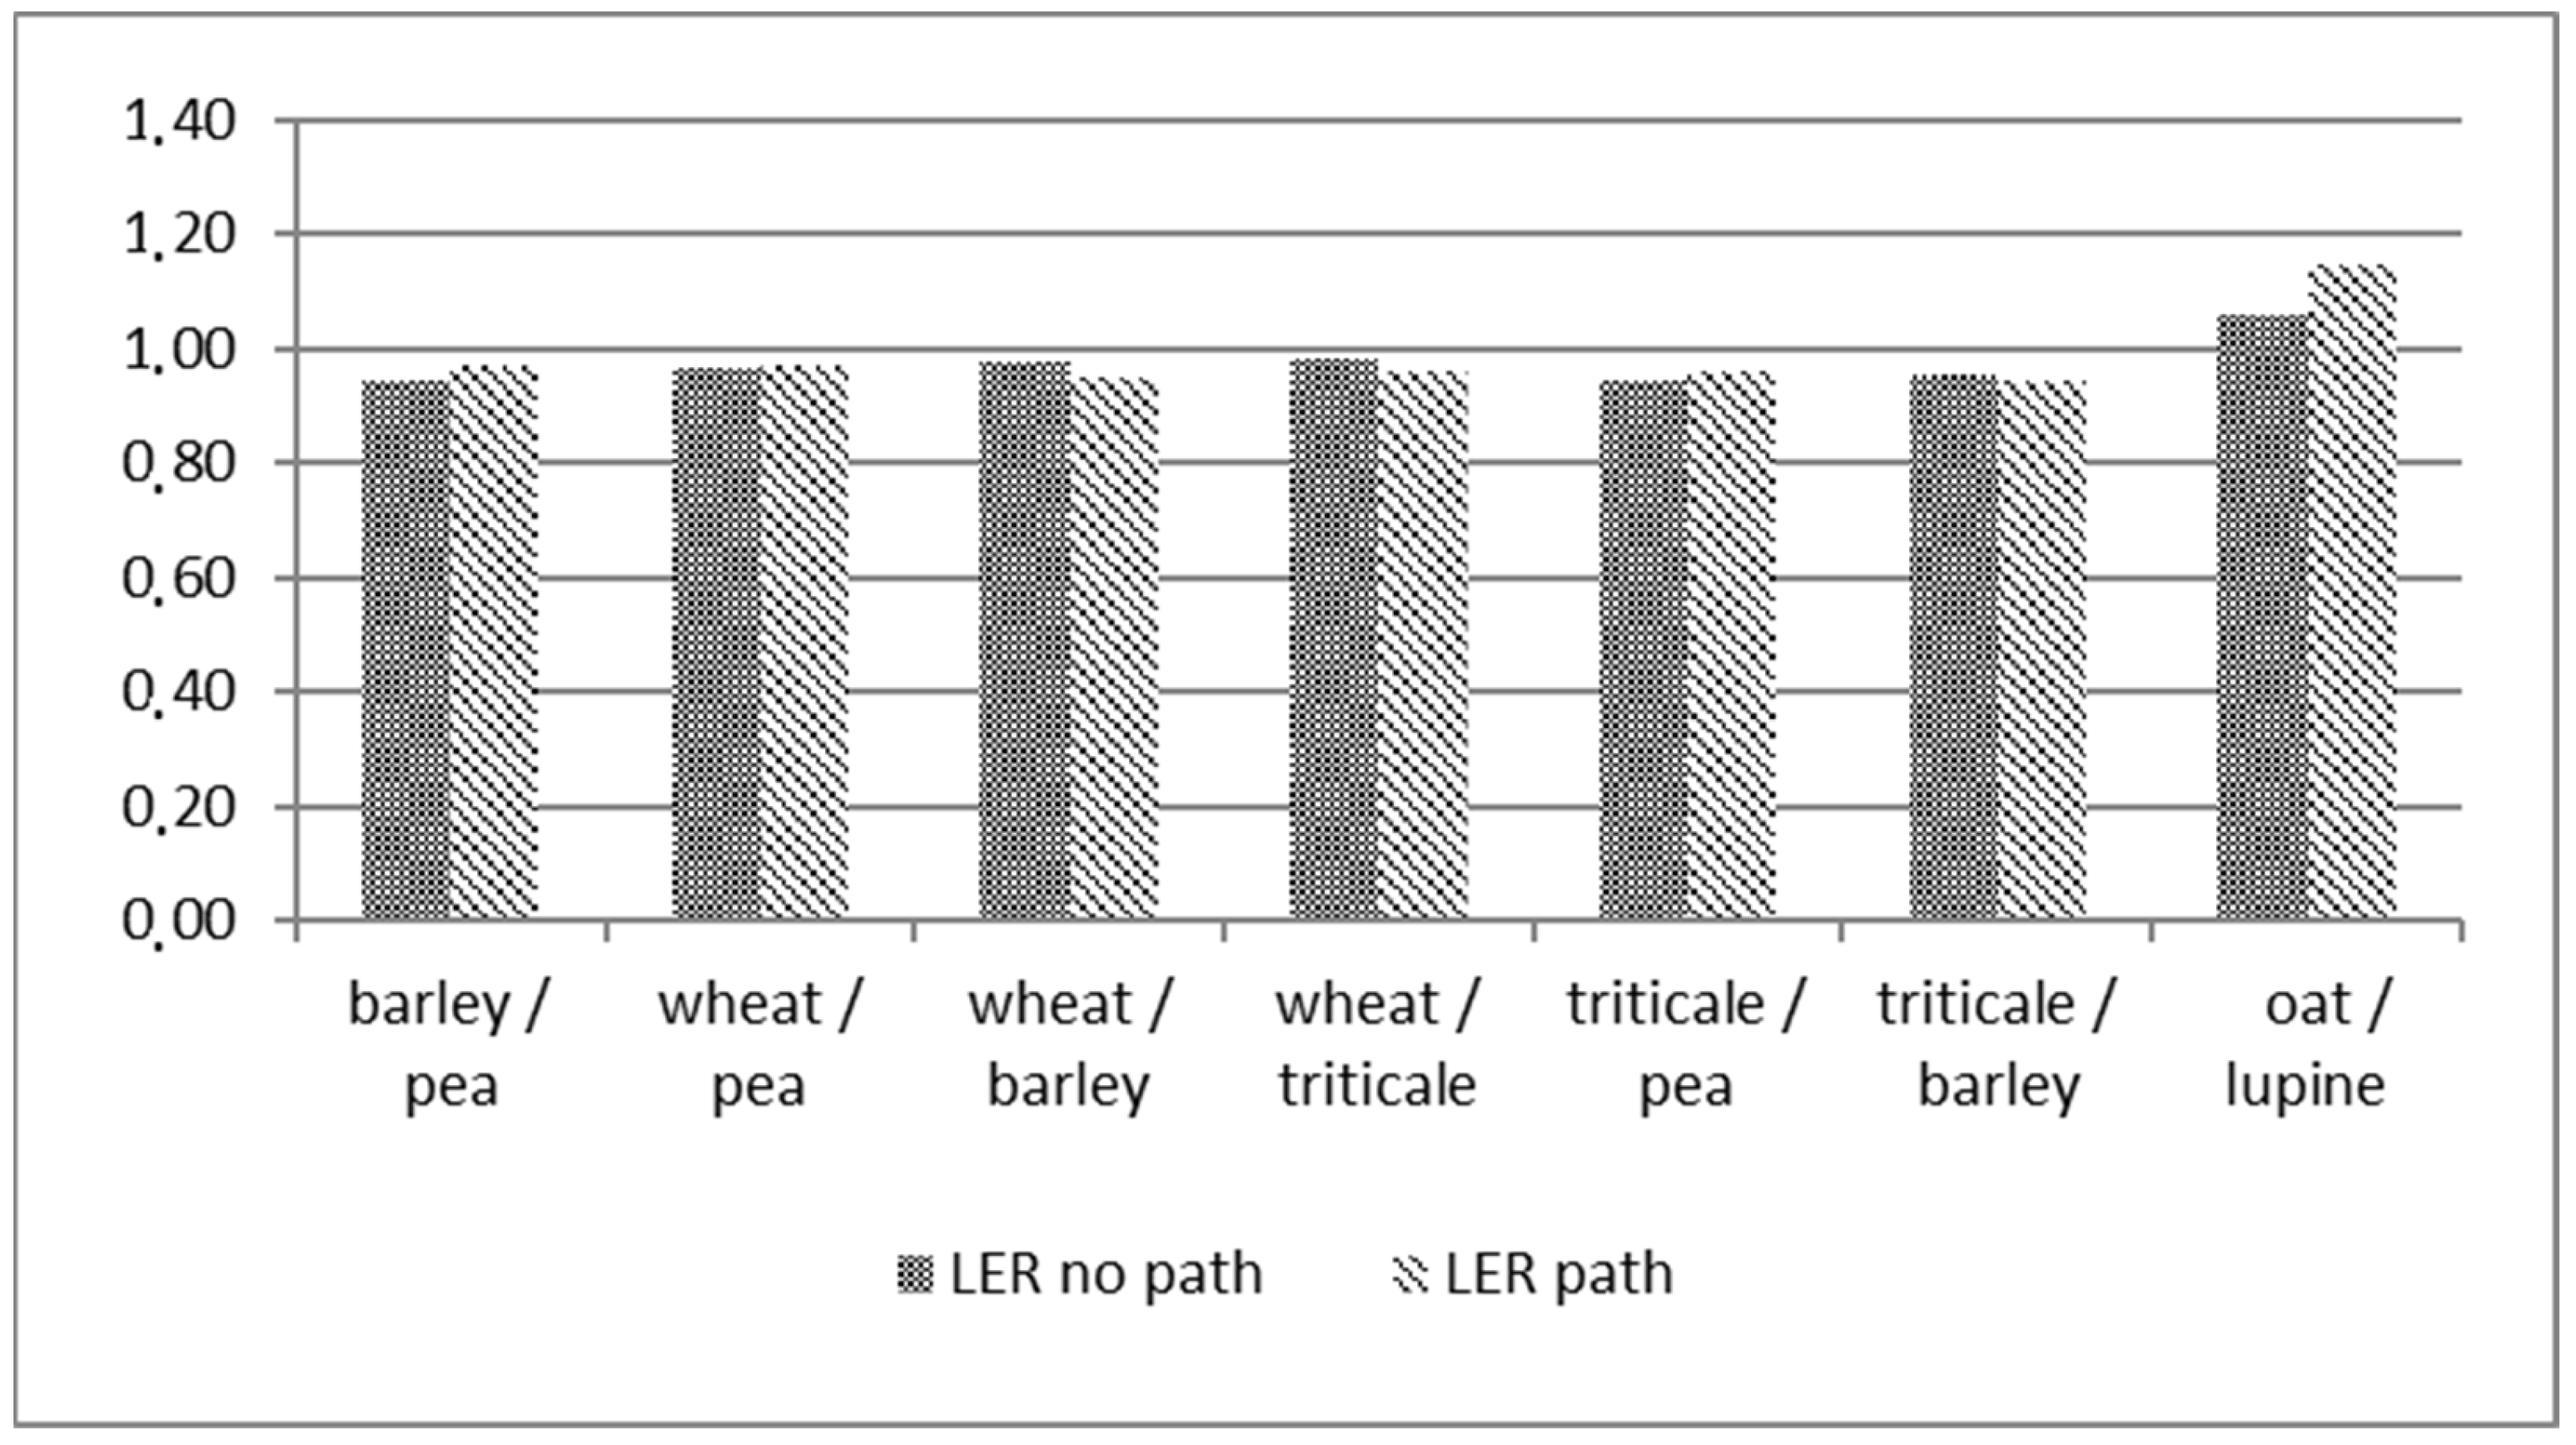
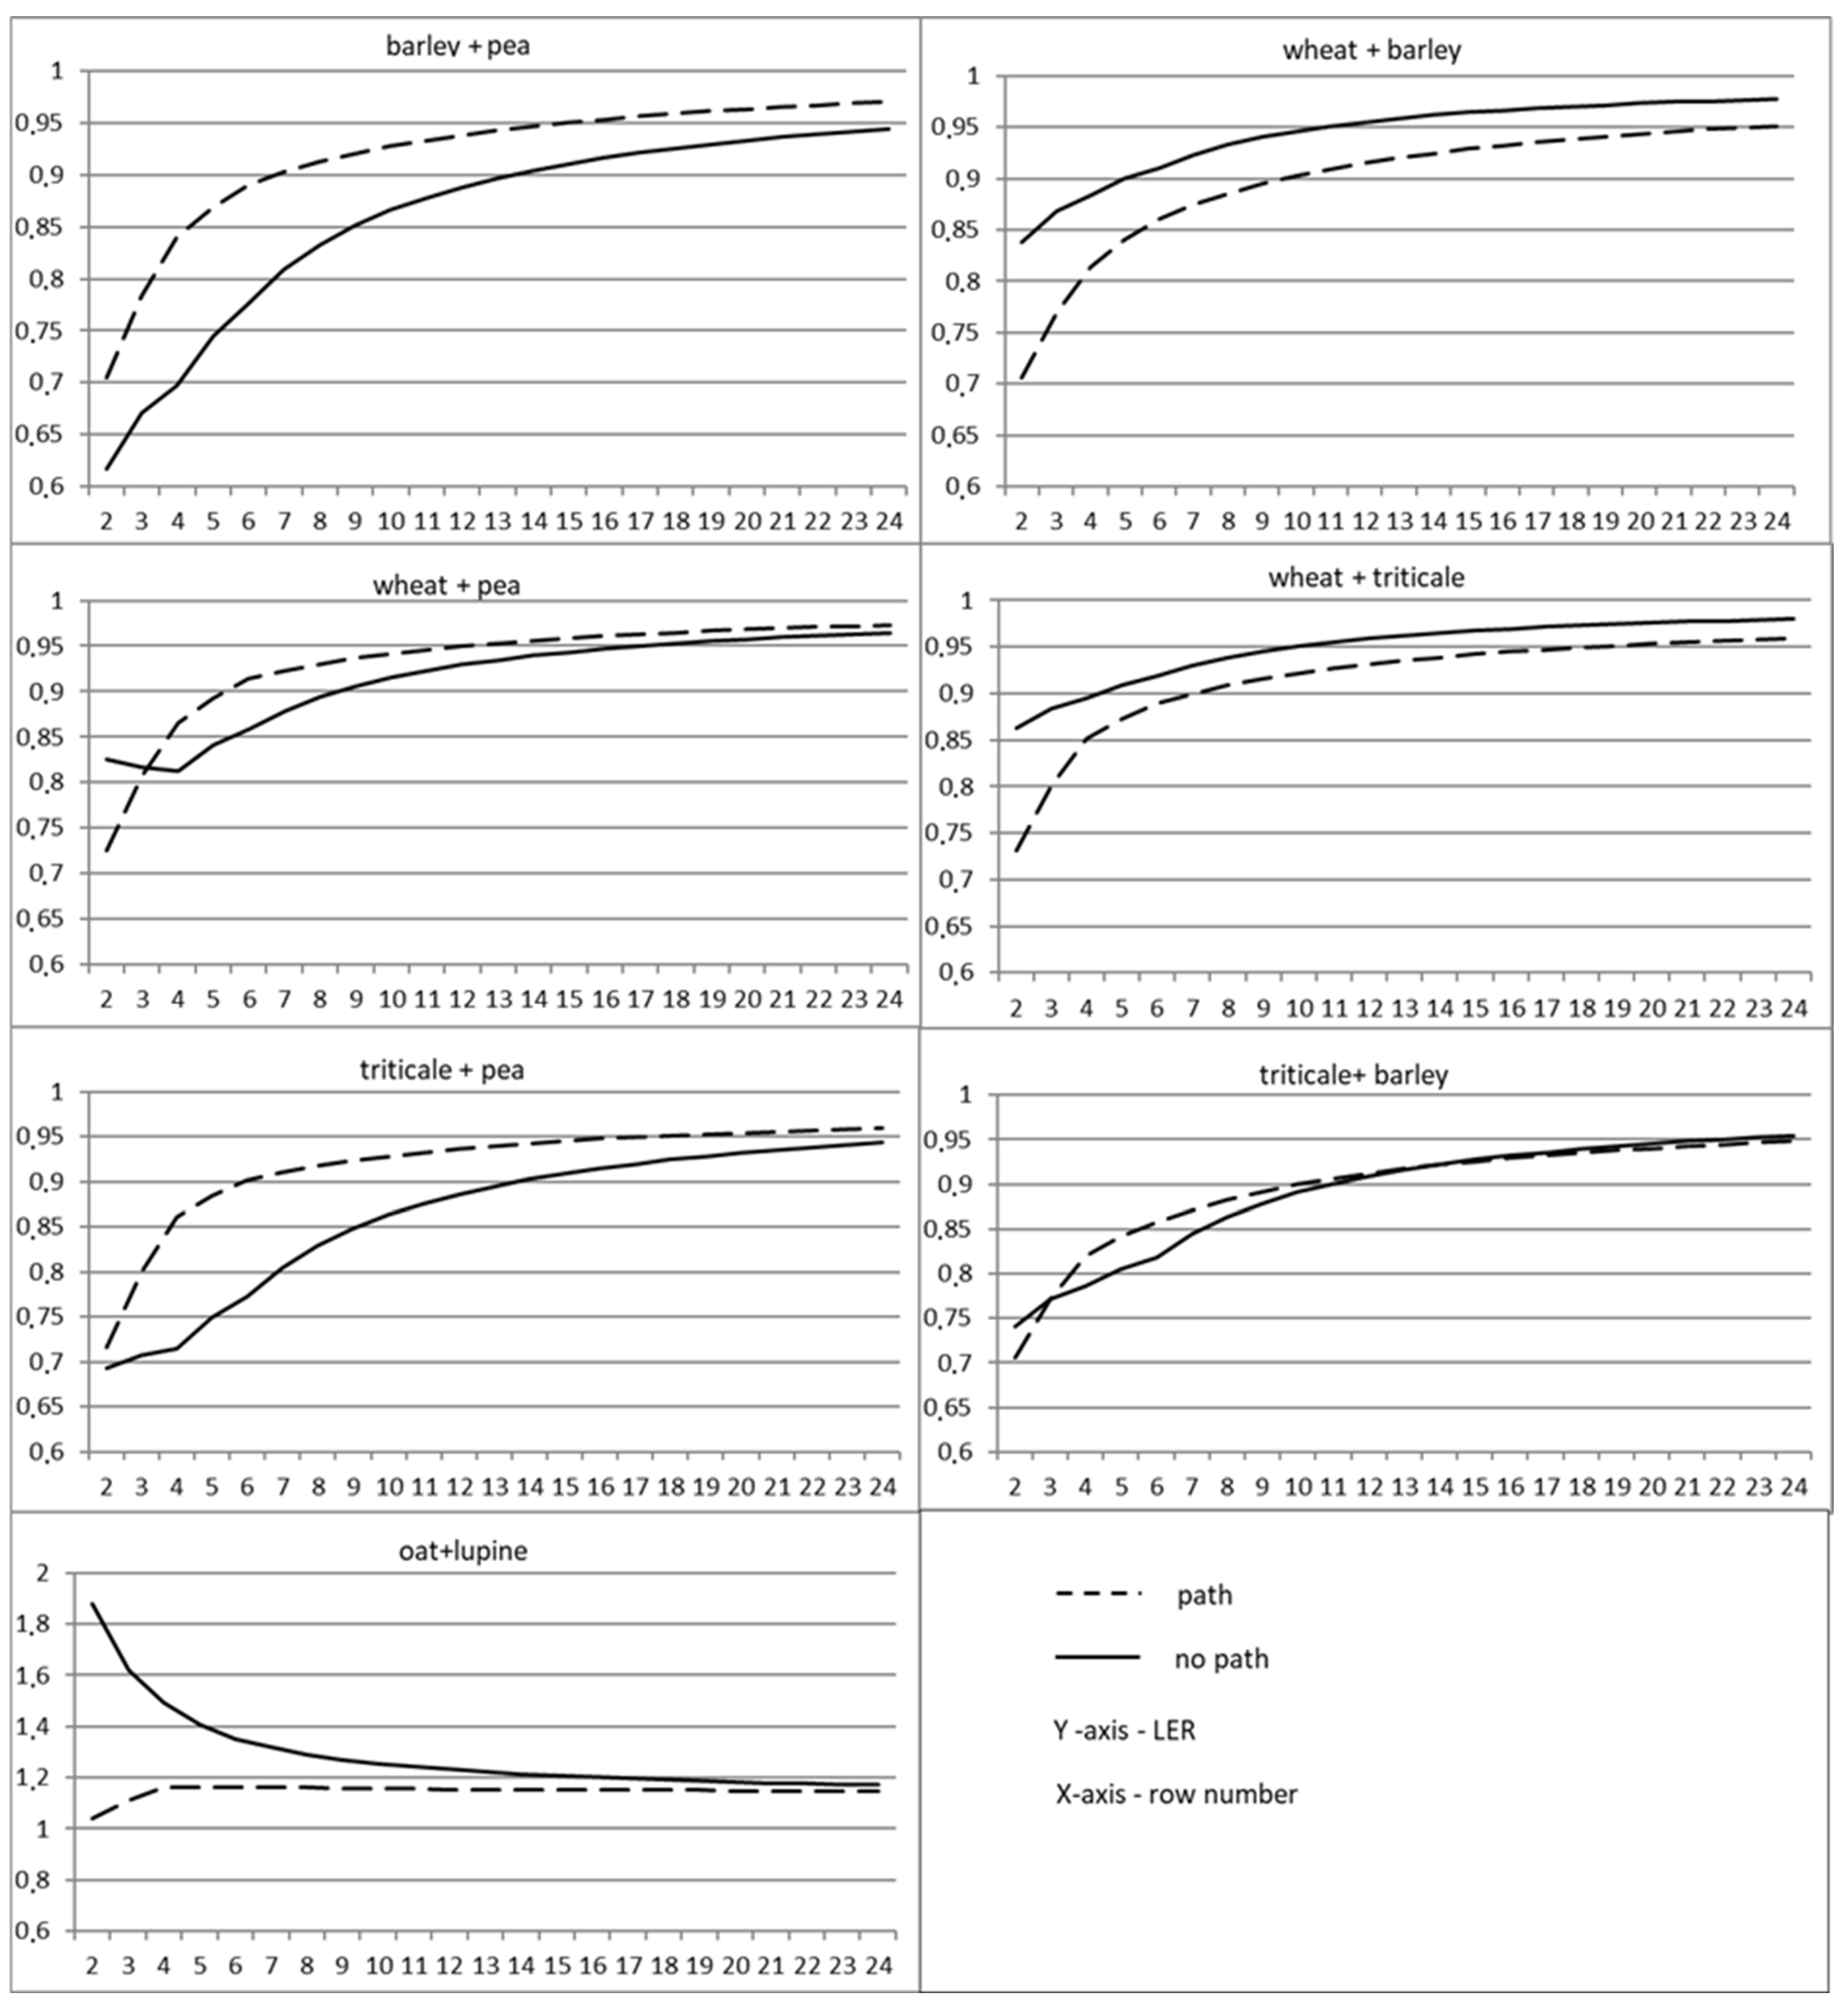
3.4. Land Equivalent Ratio (LER)
4. Conclusions
Author Contributions
Funding
Institutional Review Board Statement
Informed Consent Statement
Data Availability Statement
Conflicts of Interest
References
- Li, C.; Hoffland, E.; Kuype, T.W.; Yu, Y.; Zhang, C.; Li, H.; Zhang, F.; Werf, W. Syndromes of production in intercropping impact yield gains. Nat. Plants 2020, 6, 653–660. [Google Scholar] [CrossRef] [PubMed]
- Htet, M.S.; Hai, J.B.; Bo, P.T.; Gong, X.W.; Liu, C.J.; Dang, K.; Tian, L.X.; Soomro, R.N.; Aung, K.L.; Feng, B.L. Evaluation of nutritive values through comparison of forage yield and silage quality of mono-cropped and intercropped maize-soybean harvested at two maturity stages. Agriculture 2021, 11, 452. [Google Scholar] [CrossRef]
- Weih, M.; Karley, A.J.; Newton, A.C.; Kiær, L.P.; Scherber, C.; Rubiales, D.; Adam, E.; Ajal, J.; Brandmeier, J.; Pappagallo, S.; et al. Grain yield stability of cereal-legume intercrops is greater than sole crops in more productive conditions. Agriculture 2021, 11, 255. [Google Scholar] [CrossRef]
- Biszczak, W.; Różyło, K.; Kraska, P. Yielding parameters, nutritional value of soybean seed and weed infestation in relay-strip intercropping system with buckwheat. Acta Agric. Scand. Sect. B—Soil Plant Sci. 2020, 70, 640–647. [Google Scholar] [CrossRef]
- Johnston, G.; Vaupel, S.; Kegel, F.; Cadet, M. Crop and farm diversification provide social benefits. Calif. Agric. 1995, 49, 10–16. [Google Scholar] [CrossRef] [Green Version]
- Njeru, E.M. Crop diversification: A potential strategy to mitigate food insecurity by smallholders in sub-Saharan Africa. J. Agric. Food Syst. Community Dev. 2013, 3, 63–69. [Google Scholar] [CrossRef] [Green Version]
- Corre-Hellou, G.; Brisson, N.; Launay, M.; Fustec, J.; Crozat, Y. Effect of root depth penetration on soil nitrogen competitive interactions and dry matter production in pea–barley intercrops given different soil nitrogen supplies. Field Crop. Res. 2007, 103, 76–85. [Google Scholar] [CrossRef]
- Hauggaard-Nielsen, H.; Ambus, P.; Jensen, E.S. The comparison of nitrogen use and leaching in sole cropped versus intercropped pea and barley. Nutr. Cycl. Agroecosyst. 2003, 65, 289–300. [Google Scholar] [CrossRef]
- Jensen, E.S.; Carlsson, G.; Hauggaard-Nielsen, H. Intercropping of grain legumes and cereals improves the use of soil N resources and reduces the requirement for synthetic fertilizer N: A global-scale analysis. Agron. Sustain. Dev. 2020, 40, 5. [Google Scholar] [CrossRef] [Green Version]
- Rodriguez, C.; Carlsson, G.; Englund, J.E.; Flöhr, A.; Pelzer, E.; Jeuffroy, M.H.; Makowski, D.; Jensen, E.S. Grain legume-cereal intercropping enhances the use of soil-derived and biologically fixed nitrogen in temperate agroecosystems. A meta-analysis. Eur. J. Agron. 2020, 118, 126077. [Google Scholar] [CrossRef]
- Ren, Y.Y.; Wang, X.L.; Zhang, S.Q.; Palta, J.A.; Chen, Y.L. Influence of spatial arrangement in maize-soybean intercropping on root growth and water use efficiency. Plant Soil 2017, 415, 131–144. [Google Scholar] [CrossRef]
- Ren, J.; Zhang, L.; Duan, Y.; Zhang, J.; Evers, J.B.; Zhang, Y.; Su, Z.; Van der Werf, W. Intercropping potato (Solanum tuberosum L.) with hairy vetch (Vicia villosa) increases water use efficiency in dry conditions. Field Crop. Res. 2019, 240, 168–176. [Google Scholar] [CrossRef]
- Hinsinger, P.; Betencourt, E.; Bernard, L.; Brauman, A.; Plassard, C.; Shen, J.; Tang, X.; Zhang, F. P for two, sharing a scarce resource: Soil phosphorus acquisition in the rhizosphere of intercropped species. Plant Physiol. 2011, 156, 1078–1086. [Google Scholar] [CrossRef] [Green Version]
- Telkar, S.G.; Singh, A.K. Productivity, profitability and soil biochemical properties in maize (Zea mays) and soybean (Glycine max) intercropping as influenced by population proportion of component crops. Indian J. Agric. Sci. 2018, 88, 458–462. [Google Scholar]
- Altieri, M.A. Ethnoscience and biodiversity: Key elements in the design of sustainable pest management systems for small farmers in developing countries. Agric. Ecosyst. Environ. 1993, 46, 257–272. [Google Scholar] [CrossRef]
- Malézieux, E.; Crozat, Y.; Dupraz, C.; Laurans, M.; Makowski, D.; Ozier-Lafontaine, H.; Rapidel, B.; De Tourdonnet, S.; Valantin-Morison, M. Mixing plant species in cropping systems: Concepts, tools and models: A review. In Sustainable Agriculture; Springer: Berlin/Heidelberg, Germany, 2009; pp. 329–353. [Google Scholar] [CrossRef] [Green Version]
- Nyawade, S.O.; Karanja, N.N.; Gachene, C.K.; Gitari, H.I.; Schulte-Geldermann, E.; Parker, M.L. Short-term dynamics of soil organic matter fractions and microbial activity in smallholder potato-legume intercropping systems. Appl. Soil Ecol. 2019, 142, 123–135. [Google Scholar] [CrossRef]
- Schmidt, O.; Clements, R.; Donaldson, G. Why do cereal–legume intercrops support large earthworm populations? Appl. Soil Ecol. 2003, 22, 181–190. [Google Scholar] [CrossRef]
- Tang, X.; Zhang, Y.; Jiang, J.; Meng, X.; Huang, Z.; Wu, H.; He, L.; Xiong, F.; Liu, J.; Zhong, R.; et al. Sugarcane/peanut intercropping system improves physicochemical properties by changing N and P cycling and organic matter turnover in root zone soil. PeerJ 2021, 9, e10880. [Google Scholar] [CrossRef]
- Cong, W.F.; Hoffland, E.; Li, L.; Six, J.; Sun, J.H.; Bao, X.G.; Zhang, F.S.; Van Der Werf, W. Intercropping enhances soil carbon and nitrogen. Glob. Chang. Biol. 2015, 21, 1715–1726. [Google Scholar] [CrossRef]
- Podleśny, J.; Podleśna, A. The after-effect of blue lupine mixtures with barley on yielding of winter wheat. J. Res. Appl. Agric. Eng. 2017, 62, 94–98. [Google Scholar]
- Buraczyńska, D.; Ceglarek, F. Yield of winter wheat cultivated after various forecrops. Acta Sci. Pol. Agric. 2008, 7, 27–37. [Google Scholar]
- Zhang, C.; Dong, Y.; Tan, L.; Zheng, Y.; Makowski, D.; Yu, Y.; Zhang, F.; Van der Werf, W. Intercropping cereals with faba bean reduces plant disease incidence regardless of fertilizer input; a meta-analysis. Eur. J. Plant Pathol. 2019, 154, 931–942. [Google Scholar] [CrossRef]
- Fernández-Aparicio, M.; Amri, M.; Kharrat, M.; Rubiales, D. Intercropping reduces mycosphaerella pinodes severity and delays upward progress on the pea plant. Crop Prot. 2010, 29, 744–750. [Google Scholar] [CrossRef]
- Mollaei, M.; Fathi, S.A.A.; Nouri-Ganbalani, G.; Hassanpour, M.; Golizadeh, A. Effects of strip intercropping of canola with faba bean, field pea, garlic, or wheat on control of cabbage aphid and crop yield. Plant Prot. Sci. 2021, 57, 59–65. [Google Scholar] [CrossRef]
- Verret, V.; Gardarin, A.; Pelzer, E.; Médiène, S.; Makowski, D.; Valantin-Morison, M. Can legume companion plants control weeds without decreasing crop yield? A meta-analysis. Field Crop. Res. 2017, 204, 158–168. [Google Scholar] [CrossRef]
- Stefan, L.; Engbersen, N.; Schöb, C. Crop–weed relationships are context-dependent and cannot fully explain the positive effects of intercropping on yield. Ecol. Appl. 2021, 31, e02311. [Google Scholar] [CrossRef]
- Cheriere, T.; Lorin, M.; Corre-Hellou, G. Species choice and spatial arrangement in soybean-based intercropping: Levers that drive yield and weed control. Field Crop. Res. 2020, 256, 107923. [Google Scholar] [CrossRef]
- Carton, N.; Naudin, C.; Piva, G.; Corre-Hellou, G. Intercropping winter lupin and triticale increases weed suppression and total yield. Agriculture 2020, 10, 316. [Google Scholar] [CrossRef]
- Bedoussac, L.; Journet, E.P.; Hauggaard-Nielsen, H.; Naudin, C.; Corre-Hellou, G.; Jensen, E.S.; Prieur, L.; Justes, E. Ecological principles underlying the increase of productivity achieved by cereal-grain legume intercrops in organic farming. A review. Agron. Sustain. Dev. 2015, 35, 911–935. [Google Scholar] [CrossRef]
- Khanal, U.; Stott, K.J.; Armstrong, R.; Nuttall, J.G.; Henry, F.; Christu, B.P.; Mitchell, M.; Riffkin, P.A.; Wallace, A.J.; McCaskill, M.; et al. Intercropping—Evaluating the advantages to broadacre systems. Agriculture 2021, 11, 453. [Google Scholar] [CrossRef]
- Lithourgidis, A.S.; Dordas, C.A.; Damalas, C.A.; Vlachostergios, D.N. Annual intercrops: An alternative pathway for sustainable agriculture. Aust. J. Crop Sci. 2011, 5, 396–410. [Google Scholar]
- Mamie, F.; Farès, M. Barriers and levers to developing wheat–pea intercropping in Europe: A review. Sustainability 2020, 12, 6962. [Google Scholar] [CrossRef]
- Louran, G.; Bedoussac, L.; Gaudio, N.; Journet, E.P.; Moreau, D.; Jensen, E.S.; Justes, E. Plant nitrogen nutrition status in intercrops—A review of concepts and methods. Eur. J. Agron. 2021, 124, 126229. [Google Scholar] [CrossRef]
- Baulcombe, D.; Crute, I.; Davies, B.; Dunwell, J.; Gale, M.; Jones, J.; Pretty, J.; Sutherland, W.; Toulmin, C. Reaping the Benefits: Science and the Sustainable Intensification of Global Agriculture; The Royal Society: London, UK, 2009. [Google Scholar]
- Murawska, A.; Prus, P. The progress of sustainable management of ammonia emissions from agriculture in European Union States including Poland—Variation, trends, and economic conditions. Sustainability 2021, 13, 1035. [Google Scholar] [CrossRef]
- Antle, J.M.; Ray, S. Sustainable agricultural development: An economic perspective. In Palgrave Studies in Agricultural Economics and Food Policy; Christopher, B., Ed.; Cornell University: Ithaca, NY, USA, 2020; Available online: https://0-link-springer-com.brum.beds.ac.uk/book/10.1007%2F978-3-030-34599-0 (accessed on 12 October 2022).
- Theunissen, J. Application of intercropping in organic agriculture. Biol. Agric. Hortic. 1997, 15, 250–259. [Google Scholar] [CrossRef]
- Vandemeer, J. The Ecology of Intercropping; Cambridge University Press: Cambridge, UK, 1989. [Google Scholar] [CrossRef]
- Schierholt, A.; Holzenkamp, K.; Hartwig, H.; Gertz, A.; Becker, H. Winter oilseed rape semi-dwarf hybrids are not discriminated by front-border effects in yield trials. Crop Sci. 2020, 60, 1789–1797. [Google Scholar] [CrossRef]
- Wang, K.; Zhou, H.; Wang, B.; Jian, Z.P.; Wang, F.; Huang, J.L.; Nie, L.X.; Cui, K.H.; Peng, S.B. Quantification of border effect on grain yield measurement of hybrid rice. Field Crop. Res. 2013, 141, 47–54. [Google Scholar] [CrossRef]
- Romani, M.; Borghi, B.; Alberici, R.; Delogu, G.; Hesselbach, J.; Salamini, F. Intergenotypic competition and border effect in bread wheat and barley. Euphytica 1993, 69, 19–31. [Google Scholar] [CrossRef]
- Gałęzewski, L.; Piekarczyk, M.; Jaskulska, I.; Wasilewski, P. Border effects in the growth of chosen cultivated plant species. Acta Sci. Pol. Agric. 2013, 12, 3–12. [Google Scholar]
- Gałęzewski, L.; Jaskulska, I.; Piekarczyk, M. Strip intercropping of yellow lupine with oats and spring triticale: Proximity effect. Acta Sci. Pol. Agric. 2017, 16, 67–75. [Google Scholar] [CrossRef]
- Gałęzewski, L.; Jaskulska, I.; Piekarczyk, M. Proximity effect of spring cereals and legumes in strip intercropping. Part I. Response of wheat to the proximity of triticale, barley, pea, and yellow lupine. Acta Sci. Pol. Agric. 2018, 17, 23–32. [Google Scholar] [CrossRef]
- Gałezewski, L.; Jaskulska, I.; Piekarczyk, M. Proximity effect of spring cereals and legumes in strip intercropping. Part II. Response of pea to the proximity of wheat, triticale, barley, and yellow lupine. Acta Sci. Pol. Agric. 2018, 17, 81–89. [Google Scholar] [CrossRef]
- Gałęzewski, L.; Jaskulski, D.; Kotwica, K.; Wasilewski, P. Proximity effect of spring cereals and legumes in strip intercropping. Part III. Response of barley to the proximity of wheat, triticale, pea and yellow lupine. Acta Sci. Pol. Agric. 2018, 17, 195–204. [Google Scholar] [CrossRef]
- Gałęzewski, L. Proximity effect of spring cereals and legumes in strip intercropping. Part IV. Response of triticale to the proximity of wheat, barley, pea and yellow lupine. Acta Sci. Pol. Agric. 2020, 19, 55–67. [Google Scholar] [CrossRef]
- Gałęzewski, L.; Jaskulska, I.; Wilczewski, E.; Wenda-Piesik, A. Response of yellow lupine to the proximity of other plants and unplanted path in strip intercropping. Agriculture 2020, 10, 285. [Google Scholar] [CrossRef]
- Riseh, R.S.; Skorik, Y.A.; Thakur, V.K.; Pour, M.M.; Tamanadar, E.; Noghabi, S.S. Encapsulation of Plant Biocontrol Bacteria with Alginate as a Main Polymer Material. Int. J. Mol. Sci. 2021, 22, 11165. [Google Scholar] [CrossRef]
- Gebska, M.; Grontkowska, A.; Swiderek, W.; Golebiewska, B. Farmer awareness and implementation of sustainable agriculture practices in different types of farms in Poland. Sustainability 2020, 12, 8022. [Google Scholar] [CrossRef]
- Willey, R.W.; Osiru, D.S.O. Studies on mixtures of maize and beans (Phaseolus vulgaris) with special reference to plant population. J. Agric. Sci. 1972, 79, 519–529. [Google Scholar] [CrossRef]
- Iqbal, N.; Hussain, S.; Ahmed, Z.; Yang, F.; Wang, X.; Liu, W.; Yong, T.; Du, J.; Shu, K.; Yang, W.; et al. Comparative analysis of maize-soybean strip intercropping systems: A review. Plant Prod. Sci. 2019, 22, 131–142. [Google Scholar] [CrossRef] [Green Version]
- Zhang, W.P.; Liu, G.C.; Sun, J.H.; Zhang, L.Z.; Weiner, J.; Li, L. Growth trajectories and interspecific competitive dynamics in wheat/maize and barley/maize intercropping. Plant Soil 2015, 397, 227–238. [Google Scholar] [CrossRef]
- Li, Q.Z.; Sun, J.H.; Wei, X.J.; Christie, P.; Zhang, F.S.; Li, L. Overyielding and interspecific interactions mediated by nitrogen fertilization in strip intercropping of maize with faba bean, wheat and barley. Plant Soil 2011, 339, 147–161. [Google Scholar] [CrossRef] [Green Version]
- Chen, C.; Westcott, M.; Neill, K.; Wichman, D.; Knox, M. Row configuration and nitrogen application for barley–pea intercropping in Montana. Agron. J. 2004, 96, 1730–1738. [Google Scholar] [CrossRef] [Green Version]
- Chapko, L.B.; Brinkman, M.A.; Albrecht, K.A. Oat, oat-pea, barley, and barley-pea for forage yield, forage quality, and alfalfa establishment. J. Prod. Agric. 1991, 4, 486–491. [Google Scholar] [CrossRef]
- Kwabiah, A.B. Biological efficiency and economic benefits of pea-barley and pea-oat intercrops. J. Sustain. Agric. 2005, 25, 117–128. [Google Scholar] [CrossRef]
- Strydhorst, S.M.; King, J.R.; Lopetinsky, K.J.; Harker, K.N. Forage potential of intercropping barley with faba bean, lupin, or field pea. Agron. J. 2008, 100, 182–190. [Google Scholar] [CrossRef]
- Rudnicki, F.; Wenda-Piesik, A. Usefulness of pea cultivars for mixtures with spring cereals cultivated on wheat soil complex Part I. Usefulness of pea cultivars for mixtures with spring barley. Biul. IHAR 2002, 221, 189–197. [Google Scholar]
- Podgórska-Lesiak, M.; Sobkowicz, P. Prevention of pea lodging by intercropping barley with peas at different nitrogen fertilization levels. Field Crop. Res. 2013, 149, 95–104. [Google Scholar] [CrossRef]
- Staniak, M.; Ksiezak, J.; Bojarszczuk, J. Estimation of productivity and nutritive value of pea-barley mixtures in organic farming. J. Food Agric. Environ. 2012, 10, 318–323. [Google Scholar]
- Jaskulska, I.; Jaskulski, D.; Gałęzewski, L. Peas and barley grown in the Strip-Till one pass technology as row intercropping components in sustainable crop production. Agriculture 2022, 12, 229. [Google Scholar] [CrossRef]
- Carr, P.M.; Martin, G.B.; Caton, J.S.; Poland, W.W. Forage and nitrogen yield of barley—Pea and oat—Pea intercrops. Agron. J. 1998, 90, 79–84. [Google Scholar] [CrossRef]
- Dordas, C.A.; Vlachostergios, D.N.; Lithourgidis, A.S. Growth dynamics and agronomic-economic benefits of pea–oat and pea–barley intercrops. Crop Pasture Sci. 2012, 63, 45–52. [Google Scholar] [CrossRef]
- Van Oort, P.A.J.; Gou, H.; Stpmph, T.J.; Van der Werf, E. Effects of strip width on yields in relay-strip intercropping: A simulation study. Eur. J. Agron. 2020, 112, 125936. [Google Scholar] [CrossRef]
- Sirami, C.; Gross, N.; Baillod, A.B.; Bertrandi, C.; Romain Carrié, R.; Hass, A.; Henckel, L.; Miguet, P.; Vuillot, C.; Alignier, A.; et al. Increasing crop heterogeneity enhances multitrophic diversity across agricultural regions. Proc. Natl. Acad. Sci. USA 2019, 116, 16442–16447. [Google Scholar] [CrossRef] [Green Version]
- Czyżewski, A.S.; Smędzik-Ambroży, K. Specialization and diversification of agricultural production in the light of sustainable development. J. Int. Stud. 2015, 8, 63–73. [Google Scholar] [CrossRef]
- Leszczyńska, D. Actual state and conditions of cultivation of grain crops mixtures in Poland. J. Res. Appl. Agric. Eng. 2010, 55, 7–11. [Google Scholar]
- Woldeamlaka, A.; Grando, S.; Maatougui, M.; Ceccarelli, S. Hanfets, a barley and wheat mixture in Eritrea: Yield, stability and farmer preferences. Field Crop. Res. 2008, 109, 50–56. [Google Scholar] [CrossRef]
- Yadav, R.S.; Tarafdar, J.C. Influence of organic and inorganic phosphorus supply on the maximum secretion of acid phosphatase by plants. Biol. Fertil. Soils 2001, 34, 140–143. [Google Scholar] [CrossRef]
- McAlvay, A.C.; Anna DiPaola, A.; D’Andrea, A.C.; Ruelle, M.L.; Mosulishvili, M.; Halstead, P.; Power, A.G. Cereal species mixtures: An ancient practice with potential for climate resilience. A review. Agron. Sustain. Dev. 2022, 42, 100. [Google Scholar] [CrossRef]
- Musa, M.; Leitch, M.H.; Iqbal, M.; Sahi, F. Spatial arrangement affects growth characteristics of barley-pea intercrops. Int. J. Agric. Biol. 2010, 12, 685–690. [Google Scholar]
- Bacchi, M.; Monti, M.; Calvi, A.; Presti, E.; Pellicano, A.; Preiti, G. Forage potential of cereal/legume intercrops: Agronomic performances, yield, quality forage and LER in two harvesting times in a mediterranean environment. Agronomy 2021, 11, 121. [Google Scholar] [CrossRef]
- Pötzsch, F.; Lux, G.; Lewandowska, S.; Bellingrath-Kimurac, S.D.; Schmidtke, K. Optimizing relative seed frequency of intercropped pea and spring barley. Eur. J. Agron. 2019, 105, 32–40. [Google Scholar] [CrossRef]
- Ghaley, B.B.; Hauggaard-Nielsen, H.; Høgh-Jensen, H.; Jensen, E.S. Intercropping of wheat and pea as influenced by nitrogen fertilization. Nutr. Cycl. Agroecosystems 2005, 73, 201–212. [Google Scholar] [CrossRef]


Publisher’s Note: MDPI stays neutral with regard to jurisdictional claims in published maps and institutional affiliations. |
© 2022 by the authors. Licensee MDPI, Basel, Switzerland. This article is an open access article distributed under the terms and conditions of the Creative Commons Attribution (CC BY) license (https://creativecommons.org/licenses/by/4.0/).
Share and Cite
Gałęzewski, L.; Jaskulska, I.; Jaskulski, D.; Wilczewski, E.; Kościński, M. Strip Intercrop of Barley, Wheat, Triticale, Oat, Pea and Yellow Lupine—A Meta-Analysis. Sustainability 2022, 14, 15651. https://0-doi-org.brum.beds.ac.uk/10.3390/su142315651
Gałęzewski L, Jaskulska I, Jaskulski D, Wilczewski E, Kościński M. Strip Intercrop of Barley, Wheat, Triticale, Oat, Pea and Yellow Lupine—A Meta-Analysis. Sustainability. 2022; 14(23):15651. https://0-doi-org.brum.beds.ac.uk/10.3390/su142315651
Chicago/Turabian StyleGałęzewski, Lech, Iwona Jaskulska, Dariusz Jaskulski, Edward Wilczewski, and Marek Kościński. 2022. "Strip Intercrop of Barley, Wheat, Triticale, Oat, Pea and Yellow Lupine—A Meta-Analysis" Sustainability 14, no. 23: 15651. https://0-doi-org.brum.beds.ac.uk/10.3390/su142315651