
Systematic Modeling and Policy Analysis on the Urban Water–Energy Nexus for Sustainable Resources Management

1
School of Humanities and Social Sciences, Jiangsu University of Science and Technology, Zhenjiang 212100, China
2
College of Economics and Management, Heilongjiang Bayi Agricultural University, Daqing 163000, China
3
New Huadu Business School, Minjiang University, Fuzhou 350108, China
*
Author to whom correspondence should be addressed.
Sustainability 2022, 14(23), 15724; https://0-doi-org.brum.beds.ac.uk/10.3390/su142315724
Submission received: 17 September 2022
/
Revised: 9 November 2022
/
Accepted: 18 November 2022
/
Published: 25 November 2022
(This article belongs to the Special Issue Water Management and Efficiency for Sustainable Development Strategies)
Abstract
:Urbanization in developing countries has imposed great pressure on the availability of water and energy (WE) resources, while single-sector strategies may cause several unanticipated consequences. To find sustainable solutions for resource management, this study develops an integrated approach to assess urban WE from a nexus perspective. With the city Shenzhen as a case study, the existing WE nexus on the supply and demand sides of urban areas is first quantified. Subsequently, a system dynamics model (SDM) is constructed to reveal the complex interactions in the urban nexus, and the trends of WE supply and demand by 2035 are simulated. To narrow the potential resources gap, a policy analysis considering the interest and influence of various stakeholders is conducted to formulate policy scenarios. As revealed from the results, the resources gap will expand continuously by 2035, especially for water resources. Compared to the demand side, the policies implemented on the supply side exhibit a better performance, and the scenario of import expansion could independently achieve the desirable result. Moreover, as the demand side displayed more complexities, the implementation of future policies should rigorously weigh the priorities and difficulties of a range of stakeholders’ involvements.
1. Introduction
Water and energy (WE) are the basic resources for human survival and regional sustainable development. The demand of these two resources is estimated to increase by 40% globally by 2030 as a consequence of climate change, population expansion, and economic growth [1,2]. This will pose a huge pressure on existing WE resources, which have already been constrained due to the strong competition for WE from different sectors in many parts of the world [3]. Maybe most notably, the rapid urbanization in developing countries will cause the supply to fall short of demand and thus increase the scarcity and vulnerability of necessary resources [4]. Therefore, WE security issues are of great importance in the context of developing urban areas.
Water and energy provisions are also interdependent and mutually reinforcing. For example, water extraction, treatment, and redistribution require energy, while mineral extraction, fuel production, and electricity generation need water [5]. As a result of their interlinkages, managing water and energy should be seen as part of an integrated system that fully considers the various kinds of interconnections and feedbacks [6]. However, in many cases, policies of regional resources management focus merely on one resource, ignoring the synergies and co-benefits among different sectors. The lack of consideration of the underlying interdependence between WE resources has resulted in a crisis shifting from one sector to another and a sectoral imbalance in terms of supply and demand. To better understand the challenges of WE sectoral coordination, nexus-thinking that holistically weighs different objectives has gained significant attention in recent times [7,8].
Aa a promising conceptual framework, the water–energy nexus (also called the WE nexus) provides opportunities for greater resource coordination, sustainable management, and policy convergence across sectors. It has shown great advantages in reducing unintended consequences of single sectoral policy and practice, as well as improving synergies and tradeoffs between different social aspects. In addition, this nexus approach is particularly applicable to expanding urban areas where resource consumption has ongoing intensification. However, most of the current studies on the WE nexus have been partial as they primarily adopted a water-centric perspective, such as the energy intensity in urban water cycles, the water supply system, water end-uses, and wastewater treatment [9,10,11,12], whereas very little research treated the water and energy equally in urban metabolism. Besides, the WE nexus at an urban scale presents more complexities than other spatial areas because the involved stakeholders are highly diverse and full of competition. The responsibilities and engagements of different stakeholders should be systematically analyzed in the process of institutional arrangements and policy implementation. Related studies on the urban WE nexus are usually confined to specific scopes, i.e., either the supply side or demand side of WE resources, while rarely considering providers, consumers, and other critical participants simultaneously.
In this paper, we seek to establish a nexus framework in which water and energy are emphasized equally and to further incorporate the stakeholders from different aspects to achieve cross-sectoral policy coordination. The major contribution of our research is to integrate the WE nexus quantification with the identification of stakeholders under an urban context. The WE nexus system is first set as two subsystems, and then the contents of nexus are clarified from both the supply and demand sides. Moreover, a system dynamics model (SDM) is constructed to integrate various nexus relations and further simulate the WE gaps in the future. To address the potential crisis, some scenarios based on the stakeholder analysis are proposed to find optimal solutions for the sustainable management of resources.
The remainder of the paper is structured as follows: In Section 2, we review the methodologies related to the WE nexus studies and address the necessity of the combination of integrated quantitative method and policy analysis. Section 3 refers to the development of research methodologies, including the SDM development, nexus quantification, and the procedure of policy analysis. Section 4 shows the results of our research. We take the city Shenzhen in southern China as a case to illustrate the interdependence between water and energy over time. The results of the SDM simulation and scenarios for policy optimization are also discussed. In the final part, we put forward some conclusions and limitations for sustainable urban resources management.
2. Literature Review
Research on the WE nexus in a holistic framework is still in the initial stages while most scholars primarily focus on specific resources. For instance, WEAP (Water Evaluation and Planning), developed by Stockholm Environment Institute, was mainly used to guide the comprehensive water evaluation [13], and LEAP (the Long-range Energy Alternatives Planning System) is an integrated tool used to track energy consumption, production, and resource extraction in all sectors of an economy [14]. Until rather recently, some modeling tools tried to integrate the water and energy into a wider nexus framework, such as WEAP–LEAP, CLEWs (climate, land-use, energy, and water strategies), and MuSIASEM (Multi-Scale Integrated Analysis of Societal and Ecosystem Metabolism) [15]. For example, Mounir et al. applied the WEAP–LEAP model to simulate water allocations and energy dispatch in the metropolitan region of Phoenix, Arizona [16]. Taghdisian et al. dealt with water–energy nexus challenges in agricultural production systems in an agricultural transboundary river basin by using MuSIASEM [17]. These specific tools achieved the integration of resource assessments and sustainable policymaking to some extent, but with little consensus on the general applicability across different regions.
There are also some common methods that are capable of analyzing the urban WE nexus in two ways, i.e., water for energy or energy for water. Friedrich et al. developed a life cycle assessment (LCA) for assessing the environmental impacts of different systems alternatives in the urban building stock [18]. Wang et al. used the ecological network analysis (ENA) to analyze the properties and connection of an energy-related water network and a water-related energy network [19]. Liu et al. developed an extended multiregional input–output analysis (MRIOA) to identify the key regions and sectors for water and energy saving in the Beijing–Tianjin–Hebei urban agglomeration [20]. Based on ENA and MRIOA, Wang and Chen further developed the multiregional nexus network (MRNN) to describe the WE flow network across sectors and regions for managing an urban agglomeration nexus [21]. In the latest period, the SDM was regarded as a powerful platform for modeling dynamic, coupled, and complex systems beyond traditional system boundaries. Wen et al. described the water–energy–food system from both the supply and demand sides and further explored the impacts of real policies designed by various government sectors in resource-based cities [22]. Gozini et al. developed the SD–WE model to simulate the effectiveness of water- and energy-saving policies for strengthening resource security in central Iran [23]. Huang and Chang demonstrated how local weather affects water and energy utilization to grow vegetables in rooftop farming, which is regarded as a promising solution of sustainable urban agriculture [24].
Apart from the quantitative methods, some scholars gradually noticed the importance of qualitative analysis in solving nexus issues. One of the most remarkable approaches is policy analysis that takes various stakeholders into consideration. Policy analysis in the WE nexus aims to identify strategic opportunities for linking decision-making processes and ultimately realizing higher resource-use efficiencies [25]. Individual perceptions, awareness, habits, and supports toward WE policies [26,27]; policymakers’ response to public opinions [28]; and the participation of industrial sector [29] are all critical to managing WE resources in a more efficient and equitable manner. Due to quantitative methods that take resources interlinkages at an urban scale as a basis to identify strategic organizational linkages are largely absent in existing literature. In this way, evaluating the policy preferences or supports of stakeholders is becoming important in institutional arrangements for bridging WE gaps. Especially if supplemented with qualitative information, the model results can assist researchers, regulators, consultants, and NGOs in identifying strengths, weaknesses, opportunities, and threats within the interdependent sectors [30].
In brief, there are three approaches to understanding the WE nexus: specific tools, common methods, and policy analysis. Despite the fact that specific tools like WEAP and LEAP hold advantages in modeling framework and data adaptability, they exhibit relatively poor performance in identifying the nexus complexities compared with common methods. Meanwhile, most of the common methods cannot clearly reflect the dynamics and feedback between different components within the nexus [31,32]. Hence, the SDM can be considered as a well-suited modeling approach to exploratory insights of complex WE nexus systems. Moreover, the graphical development interface in the SDM makes it an ideal tool to use with stakeholder participation [33]. However, current studies that employed the SDM in the WE nexus still have some limitations. On the one hand, scholars are inclined to observe the nexus from either the supply side or demand/end-use side [34,35] and seldom integrate these two sides together at urban scale. On the other hand, though the policy scenarios are generally embedded in SDM simulation, they largely ignore the process of policymaking that various stakeholders are involved in. Therefore, this study deepens the existing research on WE nexus assessments by combining the SDM with stakeholder inclusive policy analysis and providing implications for urban sectoral coordination of water and energy sustainable management.
3. Methodologies
3.1. SDM Development
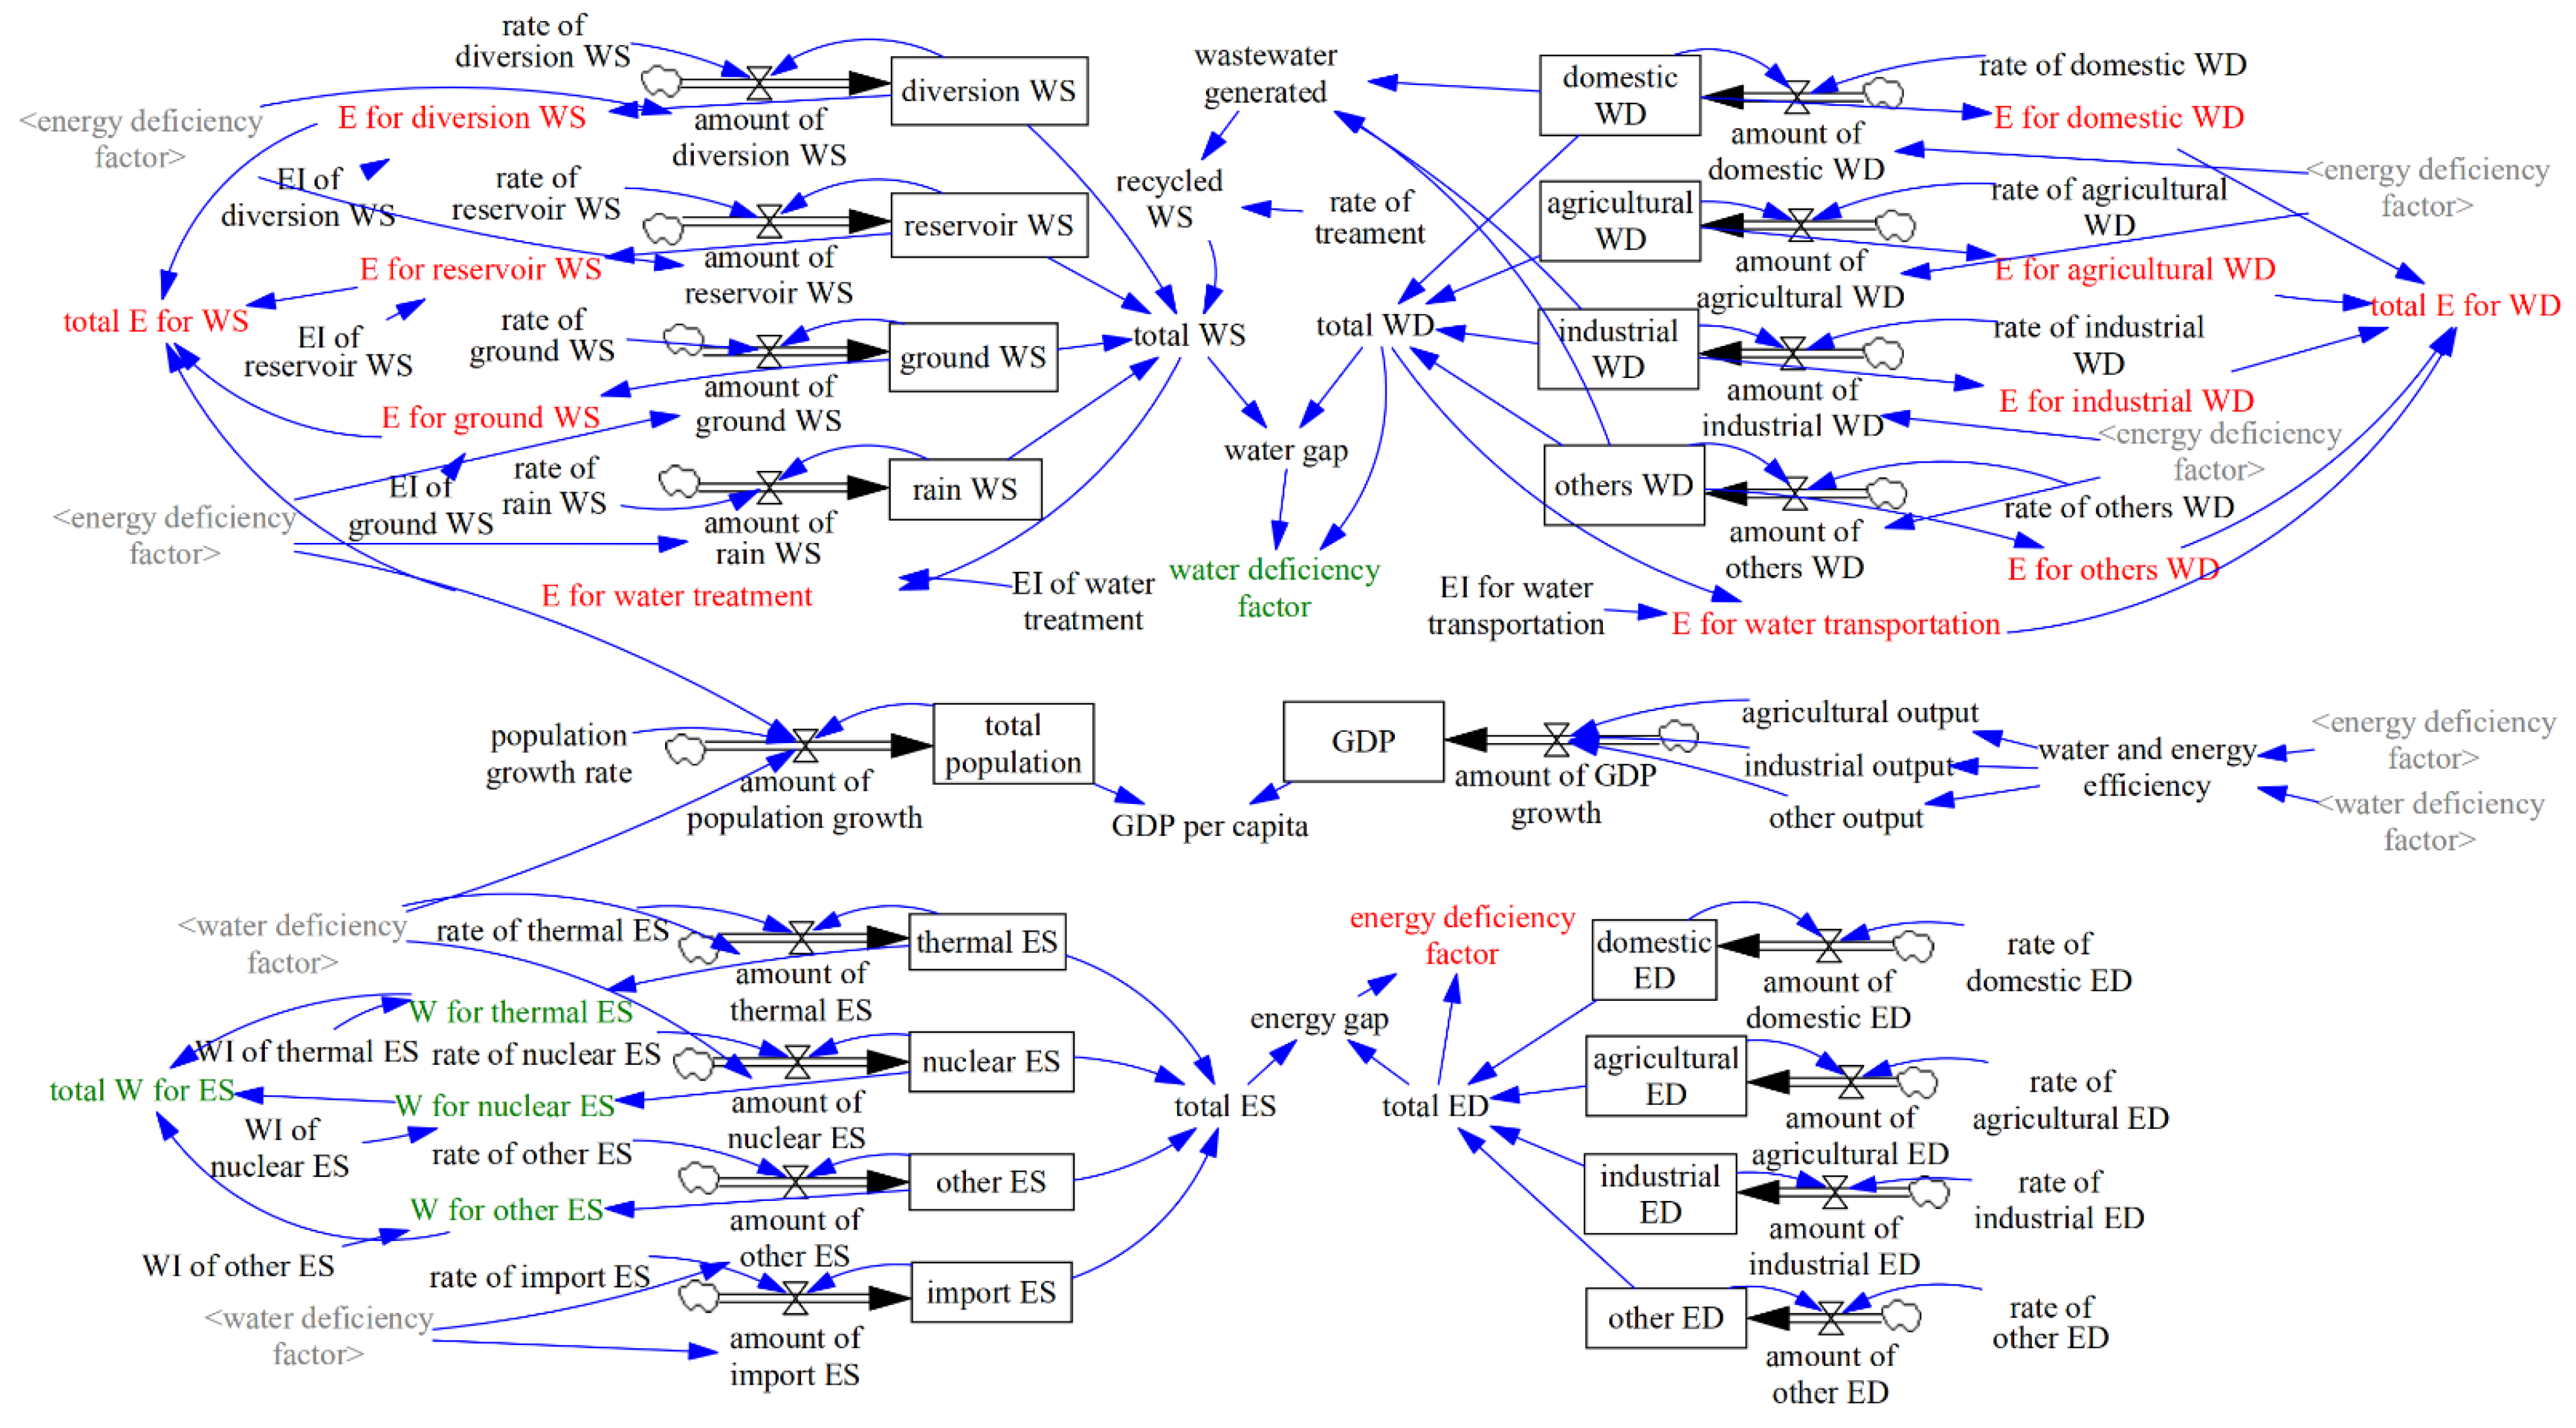
This study focuses on the nexus of water and energy in Shenzhen and clarifies their connections on both the supply and demand sides. Following Sun et al. [36] and Cai et al. [37] and considering the availability of data, we selected three subsystems in the SDM, namely water, energy, and socio-economic factors. Factors that have an indirect impact on the nexus were excluded from the model, such as land use, labor force, water quality, and carbon emissions. The aims of this model were to reveal the extent of water and energy interdependence and how their potential gaps influence the sustainability management of urban resources. The flow diagram of WE nexus is shown in Figure 1.
3.1.1. Water Subsystem
This subsystem is composed of two parts: total water supply (WS) and total water demand (WD). More specifically, total WS contains the water from various sources, including diversion outside the city boundary, local reservoirs, ground water, and rainwater collection. Total WD contains the water consumed by different users, including residential, agricultural, industrial, and others (commercial and public services). Moreover, a certain amount of wastewater is usually generated during the process of water consumption, part of which is treated and reused as the source of WS. All of the above water activities are accompanied by energy involvements. The increase of WD and WS can lead to the increase of energy inputs for the water sector, and the imbalance between WD and WS may cause the water gap.
3.1.2. Energy Subsystem
This subsystem includes total energy supply (ES) and total energy demand (ED). The total ES can be further divided into thermal, nuclear, and others (solar and wind power), as well as imports. Total ED is similar to the total WD with the same users from four sectors. As for the nexus, water resources are involved in most energy activities in the supply side for processing and cooling. However, in the demand side, as they are consumed by the same users, the amount of water for energy is equal to the energy-related water consumption in most cases. Likewise, the increase of ED and ES can result in the increase of water inputs for the energy sector, and the imbalance between ED and ES may cause the energy gap.
3.1.3. Socio-Economic Subsystem
The content of a socio-economic subsystem has two main components: population and Gross Domestic Product (GDP). In the past several years, more and more people have been moving to Shenzhen, which puts great pressure on the urban resources and the environmental carrying capacity. Population and industrial aggregation directly increase the demand of water and energy, so resource deficiencies may occur. The deficiency factors would ultimately affect the local GDP through different production sectors.
3.2. The Transformation of the WE Nexus in Shenzhen City
This part aims to quantify the transformations between water and energy at different stages in urban supply and demand. The raw data of water and energy are derived from the Shenzhen Water Resources Bulletin and Shenzhen Statistical Yearbook from 2007 to 2018.
3.2.1. Energy for Water
Energy is needed in the whole process of urban water flow, including extraction, convey, recycling, and treatment. Surface and ground water are the main sources for water extraction, with a small proportion of rainwater. Surface water almost entirely comes from local reservoirs and water division projects (Dongjiang–Shenzhen Water Supply Project, DSWSP; Dongjiang Water Source Project, DWSP), accounting for 10.3% and 83.9% of the total WS, respectively. Shenzhen had 189 reservoirs with 188.4 million cubic meters (m3) of water storage by the end of 2018. Based on the relevant studies conducted in other Chinese cities, the amount of energy consumed by extracting reservoir water commonly ranges from 0.19 kWh/m3 to 0.29 kWh/m3 [38,39,40]. To reduce the discrepancies of data from different studies, the mean value of the energy intensity data was adopted here. According to Basic Water Statistical Data of Shenzhen in 2018, the length of DSWSP water conveyance line is 68 km and the annual WS allocated to Shenzhen is 873 million m3; the length of DWSP water conveyance line is 106 km with an annual WS capacity of 720 million m3. Liu et al. estimated that the energy intensity for water conveying is 0.0045 kWh/(m3·km) and for water lifting is 0.0027 kWh/(m3·km) [41].
Ground water extraction is mostly for the purpose of residential drinking, industrial utilization, and agricultural irrigation. Because food provision in Shenzhen heavily relies on imports and water consumption by the agricultural sector, it is not considered in our model. Energy demand during the process of ground water extraction for residential and industrial users requires a pumping station to lift water, which requires about 30% more electricity than surface water on a unit basis. The lift height acts as a determinant factor to energy intensity of groundwater pumping [42]. Wang et al. reported an energy intensity of 0.40 kWh/m3 for ground water pumping in China [43]. Rainwater collected for urban usage only occupies around 0.9% of the total WS. The data of energy for rainwater gathering and treatment are not available, so our study only takes the energy used in rainwater transportation into account.
When water is extracted and transported into waterworks, some treatment procedures need to be conducted to make the water qualified for drinking and other purposes. After treatment, the water is transported to various kinds of water-use terminals, such as households, industries, commerce, and public services. According to the China City Water Supply Statistical Yearbook in 2018, the energy intensity for water treatment and transport to end-use terminals in Shenzhen is 0.195 kWh/m3 and 0.347 kWh/m3, respectively. The related total energy consumption is more than 119.7 million kWh, with the domestic taking the largest share of over 37%, followed by commercial and public sectors (29%) and industrial use (24%); the remains are the agricultural demands.
The water consumed by different sectors generates the wastewater that also needs energy for recycling and treating. Liu et al. used the Beijing as a case study and concluded that the energy intensity of recycled water treatment was 0.82 kWh/m3 [41]. Since Shenzhen and Beijing are both developed megacities in China that have similar wastewater treatment process and effluent discharge standards, we estimate that Shenzhen has the same energy intensity as Beijing in recycled water treatment. Moreover, according to the China Statistical Yearbook of Urban Water Drainage in 2016, the average energy intensity of 31 wastewater treatment plants in Shenzhen was 0.233 kWh/m3 and the total energy consumption was up to 367.8 million kWh.
3.2.2. Water for Energy
Water for energy ranges from water consumption for primary energy production (e.g., coal, oil, and natural gas) and electricity generation [44], as well as for various sectors involved in energy production, supply, and consumption. The primary energy in Shenzhen is highly dependent on imports; therefore, this part will be ignored in this paper. Chinese coal power plants for electricity generation use volumes of water with a range between 0.23 and 3.75 m3/MWh. The cooling technology adopted in Shenzhen is mainly open-loop or air-cooled technology that is more water-saving than traditional closed loop cooling. The water intensity for generating electricity reached 0.98 m3/MWh in 2018, with water consumption nearly 18.2 million m3 that accounted for approximately 0.9% of the total water usage of the city. The sectors including domestic, agriculture, industries, commerce, and public services also need water when they consume energy. Lacking the actual water intensity data but referring to the nexus intensity (i.e., water consumption per unit of energy-induced emissions) of Beijing [45], we calculated the energy-related water consumption of each sector by Equation (1). In 2018, the amount of water used for energy activities in the above four sectors were 149.2, 13.9, 226.6, and 191.3 million m3, respectively, which occupied the 28.6% share of total urban water usage.
where SCE is 10,000 tons of standard coal and 2.6 is the carbon emission conversion coefficient of standard coal.
3.3. Policy Analysis (PA) on Stakeholders in the Nexus
Policy analysis that incorporates stakeholders has become popular in natural resource management partly because of the recognition of the extent to which stakeholders can and/or should influence environmental decision-making [46]. In this study, we are aiming to apply PA to understand urban WE nexus systems by identifying stakeholders and their stakes; differentiating between and categorizing stakeholders; and prioritizing stakeholders for involvement in decision-making [47]. Due to the fact that three subsystems in the nexus have been defined in the SDM, the initial step that stakeholders should be involved in identifying issues is solved. From the constructed SDM, the stakeholders embedded in the supply and demand sides of urban WE must be the main elements of our analysis. Moreover, stakeholders from outside of nexus system can also indirectly affect the operation of the SDM, such as urban managers, research institutions, and NGOs; however, who is included and who is eventually omitted should depend on the purpose of research and the differentiation between stakeholders.
The method of interest and influence is most frequently used to categorize the stakeholders into key players, context setters, subjects, and crowd [48]. Here, the stakeholders who are directly related to WE resources are the key players because they are assumed to have high interest in and influence on urban resource balance. The urban managers are the context setters with high influence, the institution researchers and NGOs are the subjects with high interest but low influence, while the crowd has little interest in or influence over desired outcomes. In the SDM, we mainly concentrate on the policy intervention of the key players, but other kinds of stakeholders should also be considered behind these policies in negotiation and implementation stages.
Based on the above, numerous stakeholders in the urban WE nexus are determined in this study. On the supply side, four types of suppliers and four types of demanders of water and energy are considered as the key players. In this condition, policy scenarios were set by altering the value of their corresponding variables in the SDM. The stakeholders prioritized to involve in the future policy arrangement are dependent on the results of scenario simulations.
4. Results
Shenzhen (22°27′ N–22°52′ N, 113°46′ E–114°37′ E) is located in the Pearl River Delta and situated immediately north of Hong Kong. Due to its geographic advantage and its reform and opening policy, Shenzhen developed from a small fish village into a highly modern international city within 40 years. Shenzhen covers an area of 2050 km2 and had a total population of about 13 million in 2018. It is the first and the most successful special economic zone in China and now can be also considered one of the fastest-growing cities in the world.
4.1. Status of WE Nexus
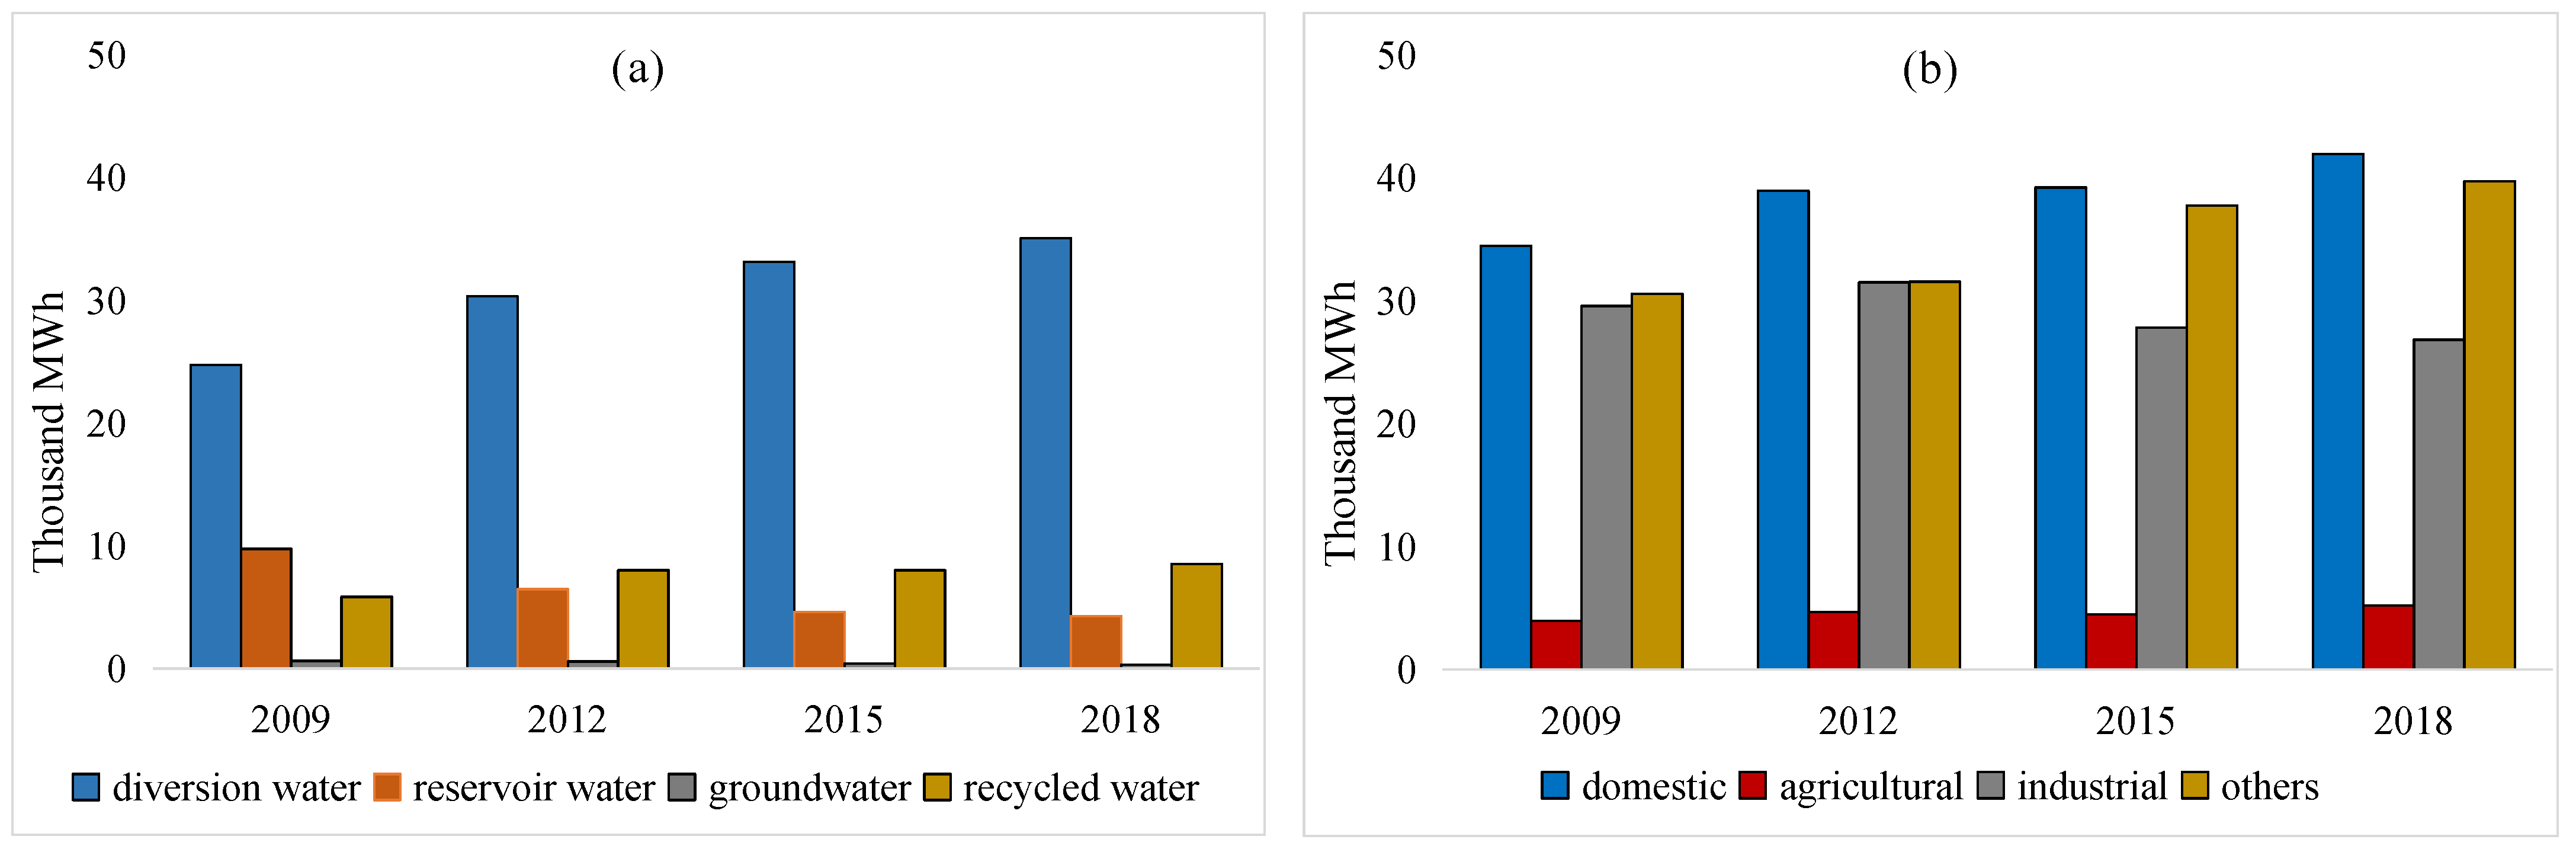
4.1.1. Energy Consumption in the Process of Urban Water Supply and Demand
Water and energy are involved in the whole process of their supply and demand to each other. Figure 2 presents the amount of energy required for various water supplies and end-use demands over time. Over the past few years, the total amount of energy specified for water has risen constantly with the expansion of urban water consumption. On the supply side, diversion water took up the largest share of energy consumption, which increased from 60.4% to 72.8% between the year of 2009 and 2018. This was primarily because over 70% of the urban water supply in Shenzhen was transferred from the Dongjiang river, which requires much energy for long distance diversion. The energy consumption by reservoir water was ranked second in 2009, but it has been overtaken by recycled water since 2012. The reason for such a change is the water stored in local reservoirs has dropped while the treated wastewater has increased steadily. Since the groundwater just took up a small proportion in the total water supply, the related energy demand was less than 1% in 2018. On the demand side, the domestic water use took up the largest portion of energy consumption with 37% followed by commercial and public services (35%) and the industrial sector (24%). As the industrial activities in Shenzhen move toward more efficiency, it is expected to consume less water and corresponding energy in the production. The residual water-related energy consumption originated from the agricultural sector where irrigation areas covered merely 6% of urban lands.
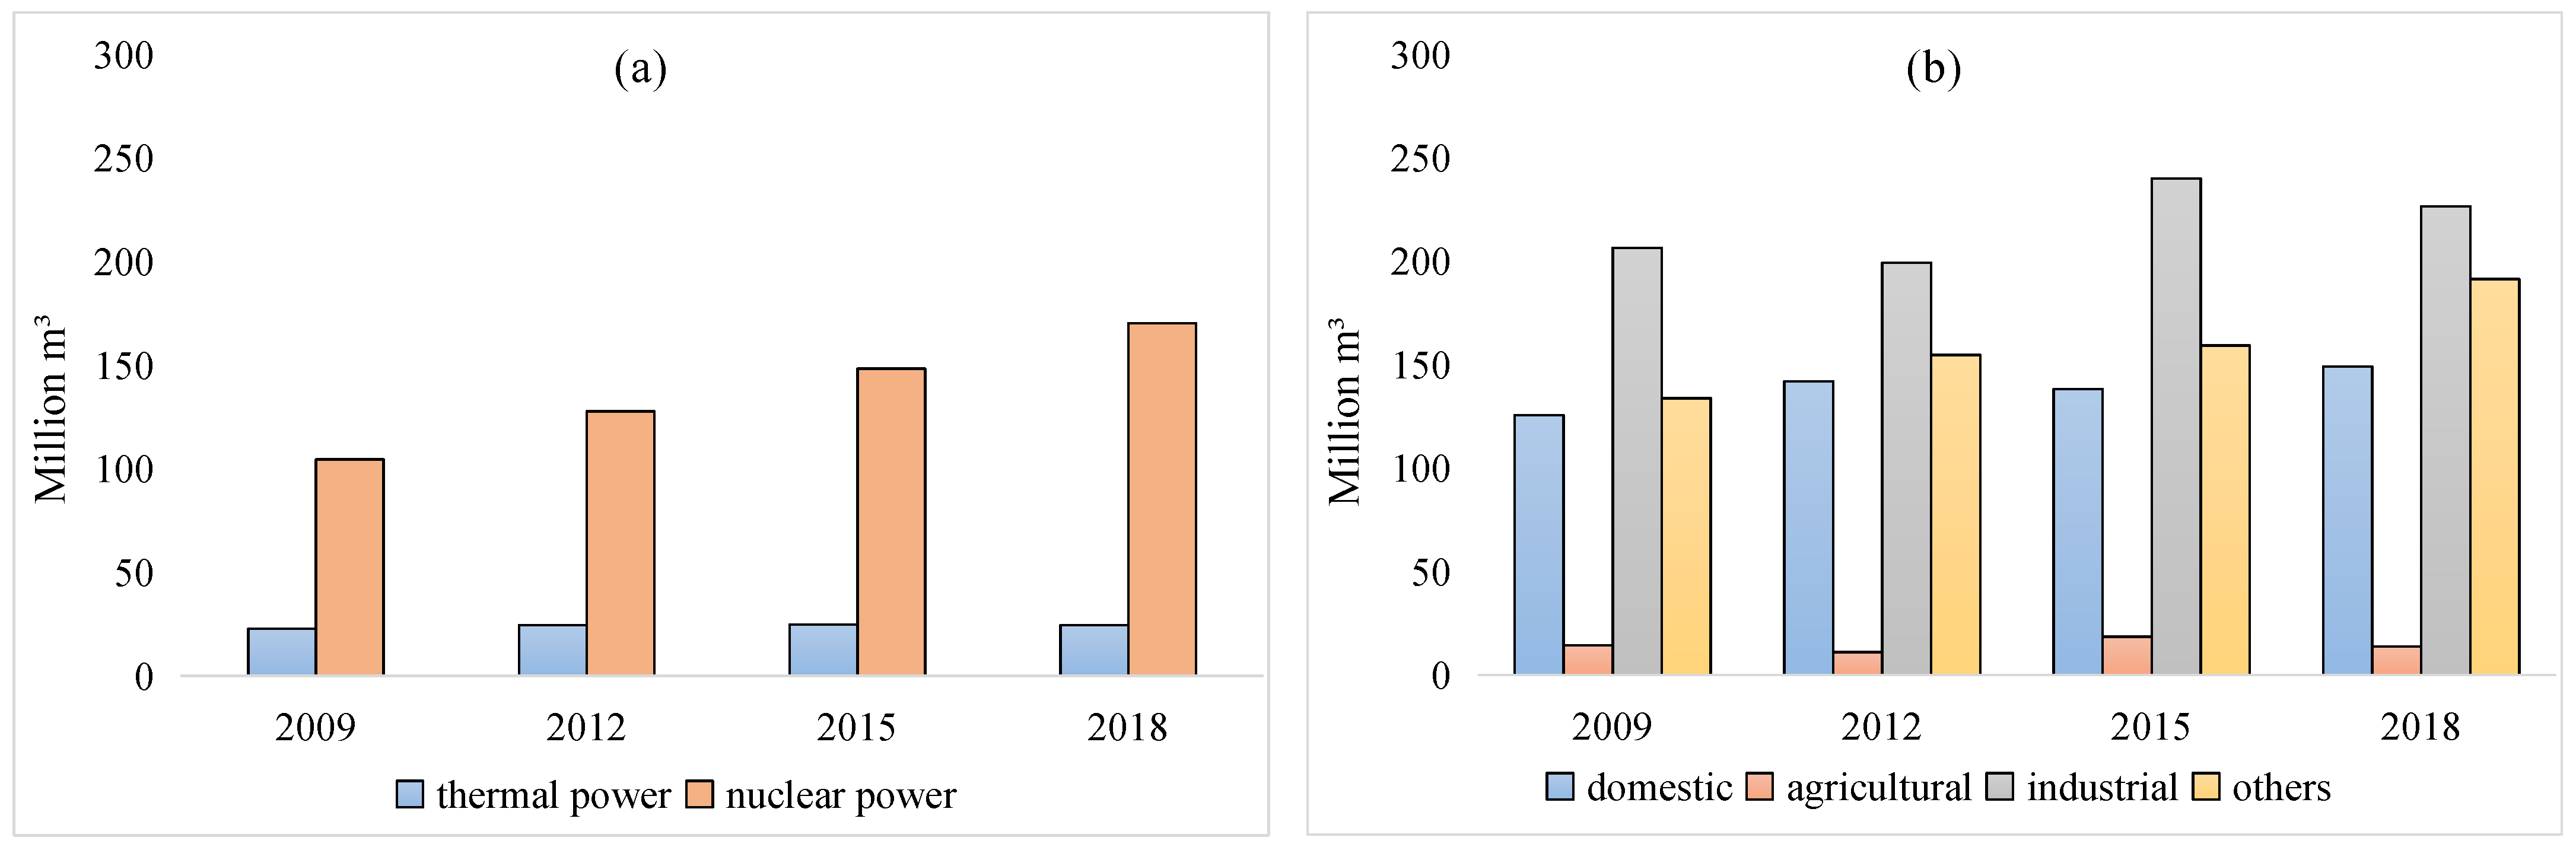
4.1.2. Water Consumption in the Process of Urban Energy Production and Demand
With regard to the water for energy, Figure 3 shows the amount of water required for energy production and various end-use demands over time. On the energy production side, the water consumption mainly originates from nuclear and thermal power generators that evaporate vast quantities of water for cooling. Recently, the proportion of nuclear power in the total energy supply has been more than 80%, while thermal (e.g., coal, gas, and oil) power merely around 15%, and the rest are renewable energies (e.g., solar and wind power) [49]. Moreover, for the difference of water footprints between various energy production methods, the amount of water consumed by nuclear power generation was seven times greater than thermal power in 2018. From 2009 to 2018, the water demand from nuclear and thermal power increased by 63% and 8.2%, respectively, which was approximately 10.7% of total urban water consumption. Moreover, the energy introduced from outside the city reached 6.6 million tons of standard coal that accounted for 20% of total energy supply. On the energy demand side, the domestic sector also consumed more energy-related water than the other three sectors, but the amount declined in 2018. The changes in water used for energy activities for the industrial sector showed fluctuation and consumed considerably more water than the other three sectors. The domestic consumption fluctuated as well, while commercial and public service increased noticeably by 28% to 33% in the observation period. Lastly, the water used for energy in the agricultural sector only occupied 2% in whole nexus.
4.2. Water and Energy Gap Simulations
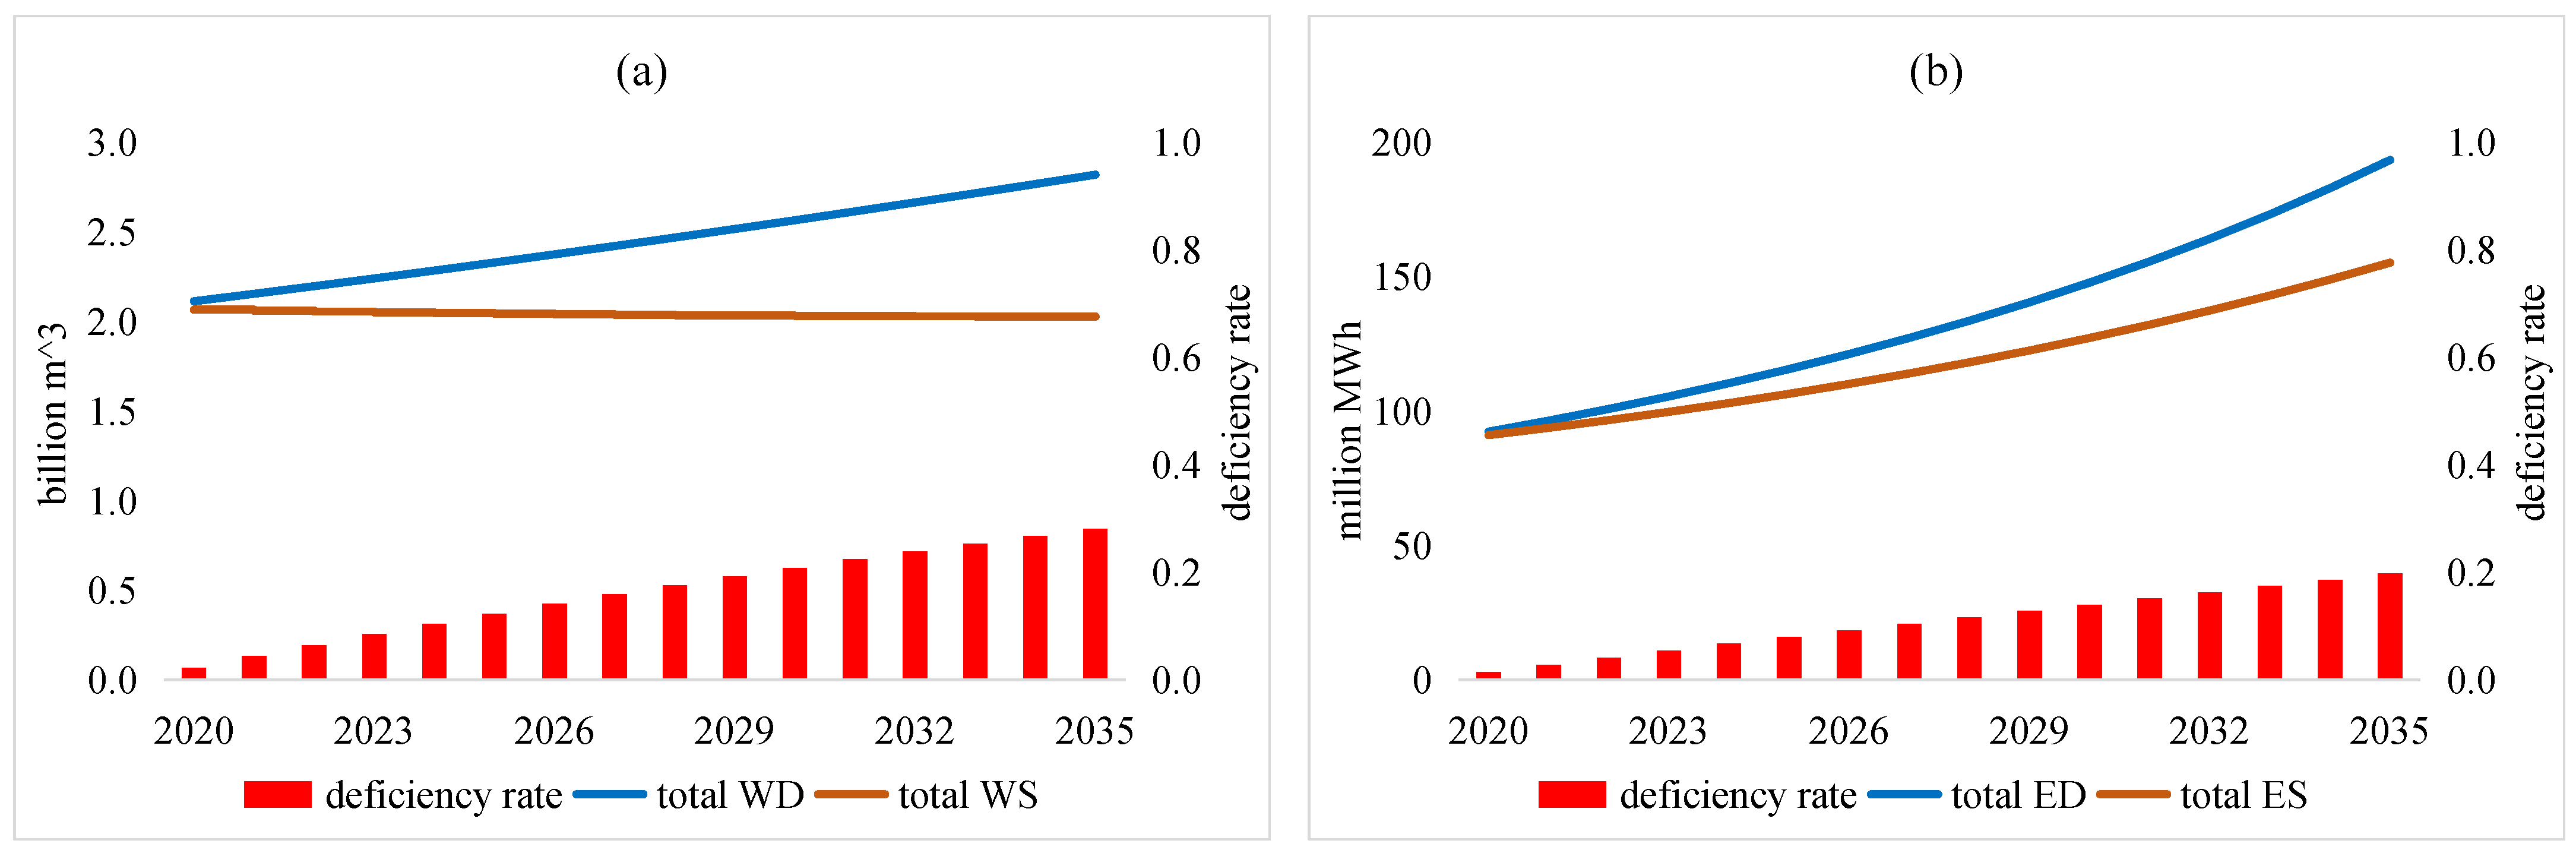
In this section, we will use the base run to estimate the WE supply and demand from 2020 to 2035 and try to assess the dynamics of WE vulnerability in Shenzhen when no governance policies are implemented. The base run simulation assumed that the existing trends of all variables will stay at the same levels in the future. The simulation results show that the gap between supply and demand of the two resources grows larger from 2020 to 2035, especially for water resources (Figure 4).
For water balance, the demand side keeps rising all the time while the supply side displays a slow decline, so the deficiency rate grows to 0.28 by 2035. The demand growth is driven by the expansion of the domestic, agricultural, and commercial and service sectors, except for the industrial sector. The supply decline is primarily attributed to the decreasing trend of reservoir water storage. Even if more rainwater will be harvested to use, it is still hard to alleviate water scarcity.
For energy balance, both the supply and demand sides show rapid growth trends, whereas the supply changes relatively slowly, so the deficiency rate grows to almost 0.2 by 2030. The demand expansion mainly originates from the domestic sector with an annual growth rate of over 10% historically. However, it is not easy for local energy production, either thermal or nuclear power, to reach such a high speed in short period. Facing the resource crisis in the near future, finding effective solutions to narrow these gaps has become urgent and imperative.
4.3. Policy Scenarios Design
In order to successfully optimize the WE nexus that is subject to numerous changes, responses, and feedbacks from various urban sectors, more flexible strategies are needed for sustainable resource management. According to the PA in Section 3.3, the key players who have high interests and influence on policymaking were identified. In policy scenario design, we give priorities to these key players by altering their corresponding variables in the SDM while other variables remain the same (Table 1). Three scenarios are included on the supply side that consider the policy effects by expanding the WE external import, internal supply, and their combination. Five scenarios are considered on the demand side from the perspective of residential, agricultural, industrial, and commercial and public services sectors, and their effects in combination.
4.4. Policy Simulations
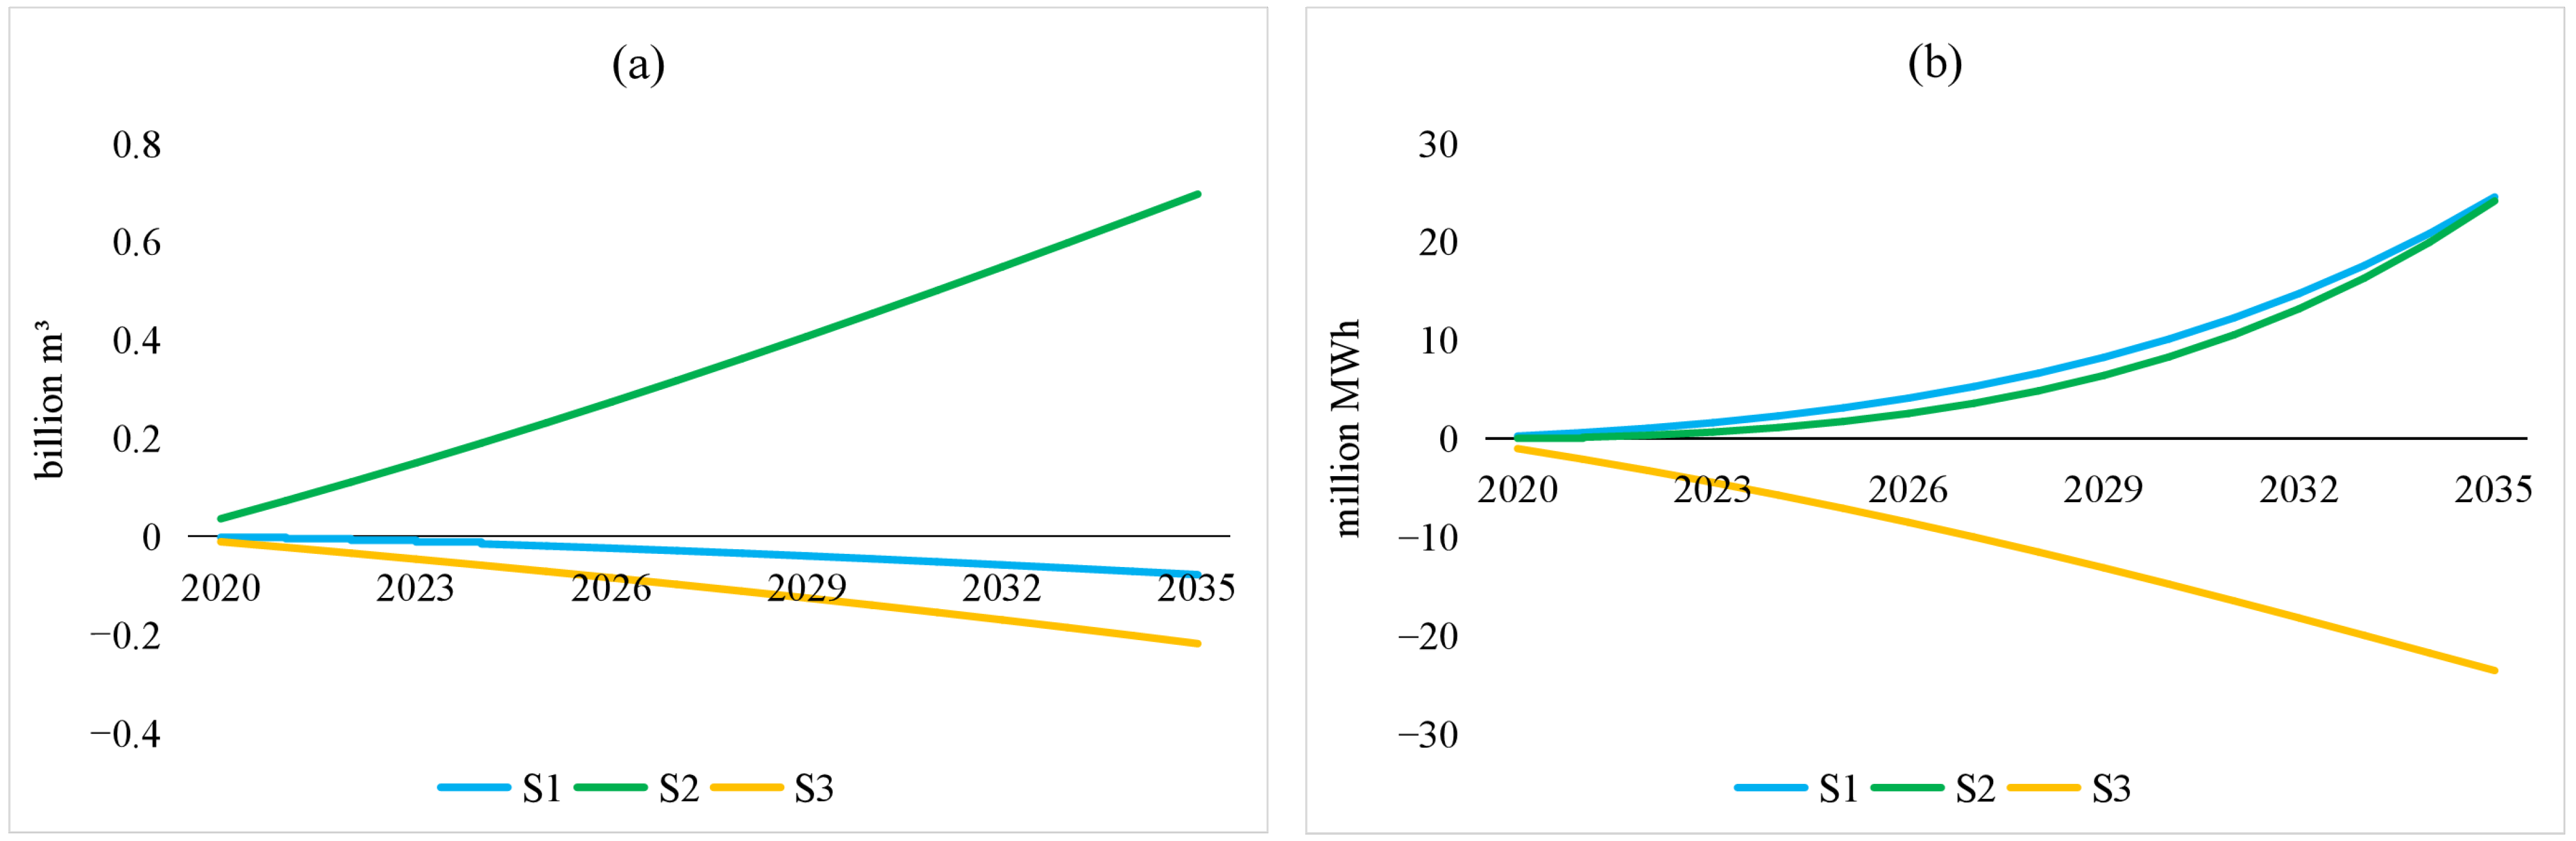
On the supply side of water resources (Figure 5), the S1 scenario can effectively ensure that the water supply satisfies the growing demand, since the water usage in Shenzhen became more reliant on water outside urban boundaries by the diversion project. The local water supply from reservoirs, groundwater, and rainwater occupy smaller shares in the total WS, so the S2 scenario cannot release the pressure induced by demand expansion. As the combination of S1 and S2, the S3 scenario exerts the maximum effect with 219 million m3 of water surplus in 2035. For the energy scenario, S1 and S2 have almost the identical policy effects and neither of them can satisfy the growing energy demand. However, when the mentioned two polices are combined (S3), the result reveals that the energy gap can be narrowed over time. In summary, the policies rolled out on the WE supply side by increasing the current growth rates can achieve the desirable effects.
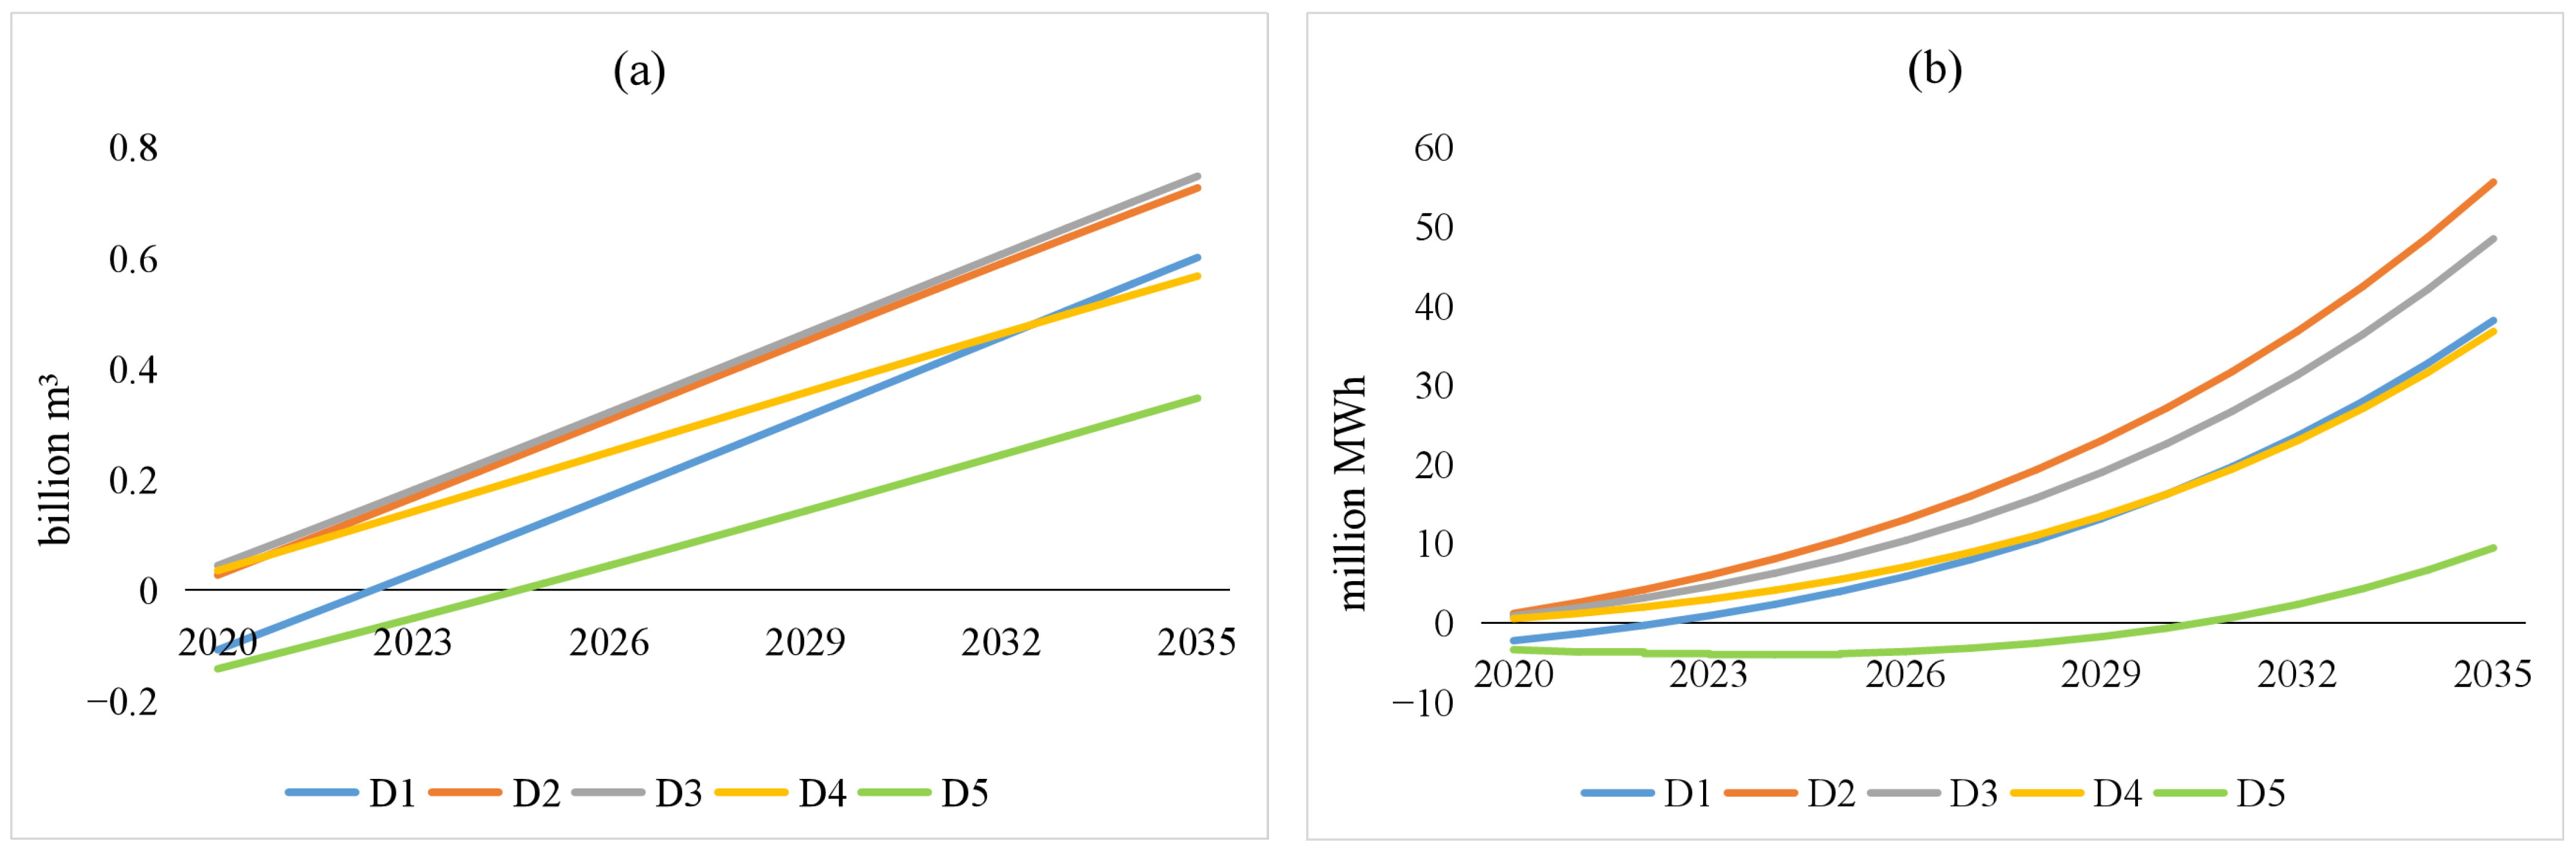
For the demand side of WE resources (Figure 6), scenario assumptions should be made more rigorously because urban resources demands from different sectors/users are more difficult to regulate in practice. The policy alternatives can be selected in two ways: reducing the amount of demand (D1 and D2) and decreasing/increasing the growing/declining rates (D3 and D4). The D1 scenario successfully achieves a higher supply of WE resources than demand by 2022, but it fails to sustain this balance in the long term. As agricultural land utilization requires fewer WE resources, the effect of the D2 scenario appears to be slight. It means that the reduction rates for residential and agricultural WD and ED are not enough or that the demand from industrial and other sectors sustain the faster growth rates. Though the industrial and commercial and service sectors are the main WE consumers, the additional change in their annual varying rates (D3 and D4) still makes it hard to achieve the desirable policy effects. When we combine the above four scenarios (D5), it merely exerts positive effects in the short term and eventually cannot control the growing gap.
When we compare all the above scenarios, the supply side polices presented a better performance, especially for import expansion strategies. For instance, since local water storage is strongly constrained, the city would probably resort to introducing more water from outside as the demand kept growing. If the city relies largely on external input, it will damage the urban resilience, while increasing the difficulties of cross-regional coordination. When it comes to energy, the implementation of a single import policy cannot deal with the expected energy shortage completely, and internal policy is of equal significance. Thus, the preferable choice refers to the combination of internal and external policy optimization. On the other hand, the demand-side policies showed limited effectiveness, whether they were to reduce the amount of consumption or to downregulate the growth rates. Moreover, a wide variety of stakeholders are involved in this side, which may cause more complexities in the process of policy negotiation and implementation. Therefore, the optimal solutions should weigh the priorities of both supply and demand strategies and fully consider the feasibility of different scenarios for policymaking. Given the results of the policy simulations, Table 2 summarizes the priority and difficulty levels of different policy options when incorporating stakeholders’ participation.
The policy scenarios exhibiting higher priorities are commonly accompanied by higher difficulty since more stakeholders are involved. On the supply side, the implementation of scenario S1 is expected to exert a better policy effect in bridging water and energy gaps in the coming future. In the meantime, however, having considerable resources transferred outside the city alters the relationship between local suppliers and demanders while requiring synergies and tradeoffs between import and export regions. More stakeholders with various interests may also reduce the stability of city resource supply systems when resource competitions and conflicts happen between import and export sides. Hence, the import strategies of Shenzhen should consider the resource availability and consumption trends of its trade partners. The economic cooperation and cross-regional coordination at larger scales in the urban agglomeration of the Pearl River Delta is also critical. On the demand side, four scenarios exhibit moderate or low priority, demonstrating that urban resources crises cannot be easily resolved since they only rely on single stakeholders. Only if stakeholders from all four sectors will take joint actions to facilitate cross-sectoral coordination can the city find approximate solutions to narrow the resource gaps. This requires residents to adopt more resource-saving practices in daily life, industries to improve their technologies towards high efficiency, and the advancement of agricultural production (e.g., irrigation scheduling and bioenergy production).
5. Discussions and Conclusions
Water and energy are tightly interconnected in the process of urban supply and demand, and their securities are threatened by continuous economic and population expansion. To cope with the risk of resource scarcity and vulnerability, nexus-thinking provides a useful tool for understanding the complexities of water and energy systems. Over the past several years, scholars have progressively realized the great potential of a nexus approach to solve complex system issues, especially for sustainable natural resource management. For the WE nexus, despite some specific methods having been developed and applied into practice, they seldom reveal the dynamics and feedbacks between different components in the nexus, nor do they fully take the various stakeholders into account.
This study enhances previous studies by combining systematical modeling and policy analysis. We take the city Shenzhen in southern China as a case study and calculate the WE relation parameters on both the supply and demand sides. On that basis, a system dynamics model (SDM) is constructed to simulate the gap between the supply and demand of WE over time. To address the potential challenges the city may encounter in the near future, some scenarios are proposed, and their impacts on narrowing the resource gap are compared. These scenarios are tightly connected to various stakeholders who might influence the process of policymaking and implementation. For city managers, they should integrate the simulation results together with the priority and difficulty levels of stakeholders’ involvements when arranging the resources management policies in practice.
The results presented in our study indicate how quantitative and qualitative approaches can be combined to conduct assessments of policy scenarios. These integrated dynamics models have great potential to inform a substantive dialog on WE nexus challenges. The quantified outcomes identify the status of the WE nexus over time and possible future changes. Through model simulation, the resource gap calls for the measures that need to be taken by different sectors. Accordingly, a stakeholder analysis exhibits significant potential to improve coordination, especially on the discrepancies among a wide range of sectors and regions. Thus, an integrated assessment provides an interpretative framework to assess the WE nexus and produces insights and discrepancies related to resource coupling and multitiered institutional arrangements.
Author Contributions
Conceptualization, Y.W. and X.Z.; methodology and software, X.Z.; formal analysis and writing, Y.W. and C.K. All authors have read and agreed to the published version of the manuscript.
Funding
This research was funded by the National Social Science Foundation of China (Grant No. 19BJL054), Project of Social Science Foundation of Jiangsu Province (Grant No. 21EYC008) and the Scientific Research Starting Foundation of Jiangsu University of Science and Technology (Grant No. 1192932101).
Institutional Review Board Statement
Not applicable.
Informed Consent Statement
Not applicable.
Data Availability Statement
The data presented in this study was obtained from the Water Resources Bureau of Shenzhen Municipality.
Acknowledgments
We acknowledge the academic support from Minjiang University.
Conflicts of Interest
The authors declare no conflict of interest.
References
- Mayor, B.; Casado, R.R.; Landeta, J.; López-Gunn, E.; Villarroya, F. An expert outlook on water security and water for energy trends to 2030–2050. Water Policy 2016, 18, 1–18. [Google Scholar] [CrossRef]
- FAO. The State of Food Insecurity in the World; FAO: Rome, Italy, 2013; ISBN 9789251079164. [Google Scholar]
- Niva, V.; Cai, J.; Taka, M.; Kummu, M.; Varis, O. China’s sustainable water-energy-food nexus by 2030: Impacts of urbanization on sectoral water demand. J. Clean. Prod. 2020, 251, 119755. [Google Scholar] [CrossRef]
- Zhou, C.; Gong, M.; Xu, Z.; Qu, S. Urban scaling patterns for sustainable development goals related to water, energy, infrastructure, and society in China. Resour. Conserv. Recycl. 2022, 185, 106443. [Google Scholar] [CrossRef]
- Larsen, M.A.D.; Petrovic, S.; Engström, R.E.; Drews, M.; Liersch, S.; Karlsson, K.B.; Howells, M. Challenges of data availability: Analysing the water-energy nexus in electricity generation. Energy Strateg. Rev. 2019, 26, 100426. [Google Scholar] [CrossRef]
- Dargin, J.; Daher, B.; Mohtar, R.H. Complexity versus simplicity in water energy food nexus (WEF) assessment tools. Sci. Total Environ. 2019, 650, 1566–1575. [Google Scholar] [CrossRef]
- Zarei, M. The water-energy-food nexus: A holistic approach for resource security in Iran, Iraq, and Turkey. Water-Energy Nexus 2020, 3, 81–94. [Google Scholar] [CrossRef]
- Wang, X.C.; Jiang, P.; Yang, L.; van Fan, Y.; Klemeš, J.J.; Wang, Y. Extended water-energy nexus contribution to environmentally-related sustainable development goals. Renew. Sustain. Energy Rev. 2021, 150, 111485. [Google Scholar] [CrossRef]
- Ahmad, S.; Jia, H.; Chen, Z.; Li, Q.; Xu, C. Water-energy nexus and energy efficiency: A systematic analysis of urban water systems. Renew. Sustain. Energy Rev. 2020, 134, 110381. [Google Scholar] [CrossRef]
- Wu, W.; Maier, H.R.; Dandy, G.C.; Arora, M.; Castelletti, A. The changing nature of the water–energy nexus in urban water supply systems: A critical review of changes and responses. J. Water Clim. Change 2020, 11, 1095–1122. [Google Scholar] [CrossRef]
- Santos, C.; Taveira-Pinto, F.; Pereira, D.; Matos, C. Analysis of the water–energy nexus of treated wastewater reuse at a municipal scale. Water 2021, 13, 1911. [Google Scholar] [CrossRef]
- Capodaglio, A.G.; Olsson, G. Energy issues in sustainable urban wastewater management: Use, demand reduction and recovery in the urban water cycle. Sustainability 2020, 12, 266. [Google Scholar] [CrossRef] [Green Version]
- Sieber, J.; Purkey, D. Water Evaluation and Planning System User Guide for Weap21; Stockholm Environment Institute, U.S. Center: Somerville, MA, USA, 2007; Available online: https://www.weap21.org/downloads/WEAP_User_Guide.pdf (accessed on 4 April 2020).
- Heaps, C.G. Long-Range Energy Alternatives Planning (LEAP) System, Software version: 2018.1.6; Stockholm Environment Institute: Somerville, MA, USA, 2016; Available online: https://ndcpartnership.org/toolbox/long-range-energy-alternatives-planning-system-leap%C2%A0 (accessed on 29 April 2020).
- Giampietro, M.; Aspinall, R.J.; Bukkens, S.G.F.; Benalcazar, J.C.; Diaz-Maurin, F.; Flammini, A.; Gomiero, T.; Kovacic, Z.; Madrid, C.; Ramos-Martin, J.; et al. An Innovative Accounting Framework for the Food-Energy-Water Nexus: Application of the MuSIASEM Approach to Three Case Studies; FAO: Rome, Italy, 2013; ISBN 9789251079645. [Google Scholar]
- Mounir, A.; Guan, X.; Mascaro, G. Investigating the value of spatiotemporal resolutions and feedback loops in water-energy nexus modeling. Environ. Model. Softw. 2021, 145, 105197. [Google Scholar] [CrossRef]
- Taghdisian, A.; Bukkens, S.G.F.; Giampietro, M. A Societal Metabolism Approach to Effectively Analyze the Water–Energy–Food Nexus in an Agricultural Transboundary River Basin. Sustainability 2022, 14, 9110. [Google Scholar] [CrossRef]
- Friedrich, J.; Poganietz, W.R.; Lehn, H. Life-cycle assessment of system alternatives for the Water-Energy-Waste Nexus in the urban building stock. Resour. Conserv. Recycl. 2020, 158, 104808. [Google Scholar] [CrossRef]
- Wang, S.; Liu, Y.; Chen, B. Multiregional input–output and ecological network analyses for regional energy–water nexus within China. Appl. Energy 2018, 227, 353–364. [Google Scholar] [CrossRef]
- Liu, Z.; Huang, Q.; He, C.; Wang, C.; Wang, Y.; Li, K. Water-energy nexus within urban agglomeration: An assessment framework combining the multiregional input-output model, virtual water, and embodied energy. Resour. Conserv. Recycl. 2021, 164, 105113. [Google Scholar] [CrossRef]
- Wang, S.; Chen, B. Energy–water nexus of urban agglomeration based on multiregional input–output tables and ecological network analysis: A case study of the Beijing–Tianjin–Hebei region. Appl. Energy 2016, 178, 773–783. [Google Scholar] [CrossRef]
- Wen, C.; Dong, W.; Zhang, Q.; He, N.; Li, T. A system dynamics model to simulate the water-energy-food nexus of resource-based regions: A case study in Daqing City, China. Sci. Total Environ. 2022, 806, 150497. [Google Scholar] [CrossRef]
- Gozini, H.; Zahraie, B.; Ravar, Z. System Dynamics Modeling of Water–Energy Nexus for Resource-Saving Policy Assessment. Int. J. Environ. Res. 2021, 15, 349–367. [Google Scholar] [CrossRef]
- Huang, A.; Chang, F.J. Article prospects for rooftop farming system dynamics: An action to stimulate water-energy-food nexus synergies toward green cities of tomorrow. Sustainability 2021, 13, 9042. [Google Scholar] [CrossRef]
- Tian, H.; Lu, C.; Pan, S.; Yang, J.; Miao, R.; Ren, W.; Yu, Q.; Fu, B.; Jin, F.F.; Lu, Y.; et al. Optimizing resource use efficiencies in the food–energy–water nexus for sustainable agriculture: From conceptual model to decision support system. Curr. Opin. Environ. Sustain. 2018, 33, 104–113. [Google Scholar] [CrossRef]
- Gómez-Llanos, E.; Durán-Barroso, P.; Robina-Ramírez, R. Analysis of consumer awareness of sustainable water consumption by the water footprint concept. Sci. Total Environ. 2020, 721, 137743. [Google Scholar] [CrossRef] [PubMed]
- Acosta-Banda, A.; Aguilar-Esteva, V.; Ortiz, M.P.; Ortiz, J.P. Construction and validity of an instrument to evaluate renewable energies and energy sustainability perceptions for social consciousness. Sustainability 2021, 13, 2333. [Google Scholar] [CrossRef]
- Larkin, A.; Hoolohan, C.; McLachlan, C. Embracing context and complexity to address environmental challenges in the water-energy-food nexus. Futures 2020, 123, 102612. [Google Scholar] [CrossRef]
- Al-Saidi, M.; Hussein, H. The water-energy-food nexus and COVID-19: Towards a systematization of impacts and responses. Sci. Total Environ. 2021, 779, 146529. [Google Scholar] [CrossRef] [PubMed]
- Simpson, G.; Berchner, M. Water-energy nexus: Measuring integration—Towards a water-energy-food nexus index. Water Wheel 2017, 16, 22–23. [Google Scholar]
- Lin, J.; Kang, J.; Bai, X.; Li, H.; Lv, X.; Kou, L. Modeling the urban water-energy nexus: A case study of Xiamen, China. J. Clean. Prod. 2019, 215, 680–688. [Google Scholar] [CrossRef]
- Ravar, Z.; Zahraie, B.; Sharifinejad, A.; Gozini, H.; Jafari, S. System dynamics modeling for assessment of water–food–energy resources security and nexus in Gavkhuni basin in Iran. Ecol. Indic. 2020, 108, 105682. [Google Scholar] [CrossRef]
- Bakhshianlamouki, E.; Masia, S.; Karimi, P.; van der Zaag, P.; Sušnik, J. A system dynamics model to quantify the impacts of restoration measures on the water-energy-food nexus in the Urmia lake Basin, Iran. Sci. Total Environ. 2020, 708, 134874. [Google Scholar] [CrossRef]
- Li, X.; Yang, L.; Zheng, H.; Shan, Y.; Zhang, Z.; Song, M.; Cai, B.; Guan, D. City-level water-energy nexus in Beijing-Tianjin-Hebei region. Appl. Energy 2019, 235, 827–834. [Google Scholar] [CrossRef] [Green Version]
- Tayerani Charmchi, A.S.; Ifaei, P.; Yoo, C.K. Smart supply-side management of optimal hydro reservoirs using the water/energy nexus concept: A hydropower pinch analysis. Appl. Energy 2021, 281, 116136. [Google Scholar] [CrossRef]
- Sun, Y.; Liu, N.; Shang, J.; Zhang, J. Sustainable utilization of water resources in China: A system dynamics model. J. Clean. Prod. 2017, 142, 613–625. [Google Scholar] [CrossRef]
- Cai, Y.; Cai, J.; Xu, L.; Tan, Q.; Xu, Q. Integrated risk analysis of water-energy nexus systems based on systems dynamics, orthogonal design and copula analysis. Renew. Sustain. Energy Rev. 2019, 99, 125–137. [Google Scholar] [CrossRef]
- Liu, J.; Zang, C.; Tian, S.; Liu, J.; Yang, H.; Jia, S.; You, L.; Liu, B.; Zhang, M. Water conservancy projects in China: Achievements, challenges and way forward. Glob. Environ. Change 2013, 23, 633–643. [Google Scholar] [CrossRef] [Green Version]
- Hua, W.; Lijin, Z.; Xiaotian, F.; Spooner, S. Water-Energy Nexus in the Urban Water Source Selection: A Case Study from Qingdao; World Resources Institute Report; Water Resources Institute: Beijing, China, 2014; pp. 49–78. [Google Scholar]
- Smith, K.; Liu, S.; Liu, Y.; Savic, D.; Olsson, G.; Chang, T.; Wu, X. Impact of urban water supply on energy use in China: A provincial and national comparison. Mitig. Adapt. Strateg. Glob. Change 2016, 21, 1213–1233. [Google Scholar] [CrossRef]
- Liu, J.; Li, X.; Yang, H.; Han, G.; Liu, J.; Zheng, C.; Zheng, Y. The Water-Energy Nexus of Megacities Extends Beyond Geographic Boundaries: A Case of Beijing. Environ. Eng. Sci. 2019, 36, 778–788. [Google Scholar] [CrossRef] [Green Version]
- Chu, C.; Ritter, W.; Sun, X. Spatial variances of water-energy nexus in China and its implications for provincial resource interdependence. Energy Policy 2019, 125, 487–502. [Google Scholar] [CrossRef]
- Jinxia, W.; Sabrina, G.S.A.R.; Declan, C.; Lijuan, Z.; Wei, X.; Ian, P.H.; Yumin, L. China’s water-energy nexus: Greenhouse-gas emissions from groundwater use for agriculture. Environ. Res. Lett. 2012, 7, 014035. [Google Scholar]
- Mahlknecht, J.; González-Bravo, R.; Loge, F.J. Water-energy-food security: A Nexus perspective of the current situation in Latin America and the Caribbean. Energy 2020, 194, 116824. [Google Scholar] [CrossRef]
- Lu, Y.; Chen, B. Energy-water nexus in urban industrial system. Energy Procedia 2016, 88, 212–217. [Google Scholar] [CrossRef] [Green Version]
- Prell, C.; Hubacek, K.; Reed, M. Stakeholder analysis and social network analysis in natural resource management. Soc. Nat. Resour. 2009, 22, 501–518. [Google Scholar] [CrossRef]
- Mannetti, L.M.; Göttert, T.; Zeller, U.; Esler, K.J. Identifying and categorizing stakeholders for protected area expansion around a national park in Namibia. Ecol. Soc. 2019, 24, 5. [Google Scholar] [CrossRef]
- Salmoral, G.; Zegarra, E.; Vázquez-Rowe, I.; González, F.; del Castillo, L.; Saravia, G.R.; Graves, A.; Rey, D.; Knox, J.W. Water-related challenges in nexus governance for sustainable development: Insights from the city of Arequipa, Peru. Sci. Total Environ. 2020, 747, 141114. [Google Scholar] [CrossRef] [PubMed]
- Li, W.-J.; Li, L.-J.; Qiu, G.-Y. General Nexus Between Water and Electricity Use and Its Implication for Urban Agricultural Sustainability: A Case Study of Shenzhen, South China. J. Integr. Agric. 2013, 12, 1341–1349. [Google Scholar] [CrossRef]
Figure 1.
The flow diagram of WE nexus.

Figure 2.
(a) Amount of energy used for water supply; (b) Amount of energy used for water demand.

Figure 3.
(a) Amount of water used for energy production; (b) Amount of water used for energy demand.
Figure 3.
(a) Amount of water used for energy production; (b) Amount of water used for energy demand.

Figure 4.
(a) Predictions of water supply and demand from 2020 to 2035; (b) Predictions of energy supply and demand from 2020 to 2035.
Figure 4.
(a) Predictions of water supply and demand from 2020 to 2035; (b) Predictions of energy supply and demand from 2020 to 2035.

Figure 5.
(a) Scenario simulations on the water supply side from 2020 to 2035; (b) Scenario simulations on the energy supply side from 2020 to 2035. If the value is greater than zero, it means the resource supply is lower than the demand. Otherwise, the resource supply is higher than the demand.
Figure 5.
(a) Scenario simulations on the water supply side from 2020 to 2035; (b) Scenario simulations on the energy supply side from 2020 to 2035. If the value is greater than zero, it means the resource supply is lower than the demand. Otherwise, the resource supply is higher than the demand.

Figure 6.
(a) Scenario simulations on the water demand side from 2020 to 2035; (b) Scenario simulations on the energy demand side from 2020 to 2035. If the value is greater than zero, it means the resource supply is lower than demand. Otherwise, the resource supply is higher than demand.
Figure 6.
(a) Scenario simulations on the water demand side from 2020 to 2035; (b) Scenario simulations on the energy demand side from 2020 to 2035. If the value is greater than zero, it means the resource supply is lower than demand. Otherwise, the resource supply is higher than demand.


Table 1.
Scenarios and corresponding variables adjustment.
| Scenarios | Measures (Compared to the Base Run) | |
|---|---|---|
| Supply side | S1: import expansion policy | The rate of both diversion WS and import ES increased by 50% |
| S2: local supply increase policy | The amount of reservoir and ground WS stay in current level and rate of rain WS increased by 50%, meanwhile the rate of thermal, nuclear, and other ES all increased by 50% | |
| S3: comprehensive supply policy | S1 + S2 | |
| Demand side | D1: residential saving policy | The amount of residential WD and ED reduced by 20% |
| D2: agricultural land use policy | The amount of agricultural WD and ED reduced by 20% | |
| D3: industrial management policy | The rate of industrial WD increased by 50% while the rate of industrial ED decreased by 50% | |
| D4: commercial and service policy | The rate of commercial & service WD and ED decreased by 50% | |
| D5: comprehensive demand policy | D1 + D2 + D3 + D4 |
Table 2.
Priority and difficulty levels of different policy scenarios and related stakeholders.
| Scenarios | Priority | Difficulty | Stakeholders | ||
|---|---|---|---|---|---|
| Water | Energy | Water | Energy | ||
| S1 | High | Moderate | Moderate | Moderate | Governments (internal and external) |
| S2 | Low | Moderate | Low | Low | Government, WE supply companies |
| S3 | High | High | High | High | S1 + S2 |
| D1 | Moderate | Moderate | Moderate | Moderate | Residents, communities, and NGOs |
| D2 | Low | Low | Low | Low | Peasants |
| D3 | Low | Low | Moderate | Moderate | Industrial companies |
| D4 | Moderate | Moderate | Moderate | Moderate | Businesses, public sectors |
| D5 | Moderate | Moderate | High | High | D1 + D2 + D3 + D4 |
Publisher’s Note: MDPI stays neutral with regard to jurisdictional claims in published maps and institutional affiliations. |
© 2022 by the authors. Licensee MDPI, Basel, Switzerland. This article is an open access article distributed under the terms and conditions of the Creative Commons Attribution (CC BY) license (https://creativecommons.org/licenses/by/4.0/).
Share and Cite
MDPI and ACS Style
Wang, Y.; Kou, C.; Zhai, X. Systematic Modeling and Policy Analysis on the Urban Water–Energy Nexus for Sustainable Resources Management. Sustainability 2022, 14, 15724. https://0-doi-org.brum.beds.ac.uk/10.3390/su142315724
AMA Style
Wang Y, Kou C, Zhai X. Systematic Modeling and Policy Analysis on the Urban Water–Energy Nexus for Sustainable Resources Management. Sustainability. 2022; 14(23):15724. https://0-doi-org.brum.beds.ac.uk/10.3390/su142315724
Chicago/Turabian StyleWang, Yongsheng, Chenhuan Kou, and Xujun Zhai. 2022. "Systematic Modeling and Policy Analysis on the Urban Water–Energy Nexus for Sustainable Resources Management" Sustainability 14, no. 23: 15724. https://0-doi-org.brum.beds.ac.uk/10.3390/su142315724
Note that from the first issue of 2016, this journal uses article numbers instead of page numbers. See further details here.