Article

Safety Analysis of Merging Vehicles Based on the Speed Difference between on-Ramp and Following Mainstream Vehicles Using NGSIM Data

1
Qatar Transportation and Traffic Safety Center, College of Engineering, Qatar University, Doha P.O. Box 2713, Qatar
2
Department of Civil and Architectural Engineering, College of Engineering, Qatar University, Doha P.O. Box 2713, Qatar
3
School of Transportation, Southeast University, Nanjing 211189, China
*
Author to whom correspondence should be addressed.
Sustainability 2022, 14(24), 16436; https://0-doi-org.brum.beds.ac.uk/10.3390/su142416436
Submission received: 7 November 2022 / Revised: 2 December 2022 / Accepted: 5 December 2022 / Published: 8 December 2022
(This article belongs to the Collection Emerging Technologies and Sustainable Road Safety)

Abstract

:
Highway merging points are critical elements due to the interactions between merging vehicles and following vehicles on the outermost lane of the highway stream. Such interactions could have significant implications for safety and capacity at ramp locations. The aim of this study was to investigate the spacing adjustment behavior by the interacting drivers at merging locations. In this regard, we relied on the NGSIM trajectory dataset to investigate the impacts of the speed difference between the following and merging vehicles on a space headway, considering different geometric designs and vehicle classes. Nonlinear regression models were estimated to analyze the interactions. The results showed a significant and exponential tendency for headway reduction, particularly when the difference in speed was higher than 30 km/h. In addition, the findings revealed that the highway with an auxiliary lane performed better in terms of headway reduction. Furthermore, the space headway reduction trend was higher when the following vehicle was a truck rather than a car. Policymakers and practitioners aiming to improve road safety at merging locations could use this study’s findings. The resulting parameters can also be utilized in microsimulation models, e.g., for headway adjustment behavior in car-following models.

1. Introduction

On-ramp merging locations are considered critical elements of highways due to the interactions between merging vehicles and vehicles on the right lane of the highway stream [1]. Previous studies have shown that the probability of rear-end crashes increases within these sections, since both traffic streams travel at different speeds [2,3]. The most common type of road traffic crash (RTC) is also the rear-end crash, accounting for almost 30% of all crashes [4]. When it comes to freeway crashes, around 15% of the total crashes occurred in the ramp-freeway area in California, United States [5]. The higher the speed difference between following and merging vehicles, the higher the severity of such rear-end or sideswipe crashes would be at these locations.
In this regard, many researchers have examined different contributory factors associated with safety at on-/off-ramp locations. For instance, Wang et al. [6] explored the main factors that contribute to injury severity at 231 freeway exit points in Florida using crash data. The study found that the number of lanes on mainstream and/or ramps, length of auxiliary lanes, light/weather conditions, vehicle type, average daily traffic and surface conditions, etc., were the main contributory factors in injury severity at such locations.
In cases where on-ramp drivers merge with lower speeds compared to the speeds of the following drivers, the latter have to make headway and speed adjustments to accommodate merging vehicles. However, drivers often fail to maintain adequate gaps [7] and also overestimate safety when following another vehicle [8]. In this regard, the presence of an auxiliary lane could allow merging vehicles to accelerate and minimize interference with through traffic [9]. Lee and Abdel-Aty [10] found a negative correlation between the length of ramps and fatal/severe injuries. Longer acceleration lanes allow merging drivers to accelerate before converging into the right through-lane. Daamen et al. [11] presented the distribution of merging locations under free-flow and merging conditions. The authors found that merging vehicles accept smaller gaps at the end of the auxiliary lane compared to the gaps accepted at the beginning part of the auxiliary lane. Kondyli and Elefteriadou [12] studied driving behavior at merging locations in a field experiment using an instrumented vehicle. They found that merging drivers utilized the acceleration lane length on tapered on-ramps at a higher percentage compared to the parallel design. Moreover, when merging into the mainstream highway lanes, drivers on the tapered on-ramps attained higher speeds. In another study, Chen et al. evaluated the performance of left-side off-ramps using historical crash data [13]. The study results showed that compared to the location with an additional optional lane, the conflict rates were higher at the location with two exclusive off-ramps. In addition, the study indicated a lower safety level at left-side off-ramps, as they produced higher average crash counts, crash rates and severe crash percentages. Another study showed that right-turning lanes on two-lane trunk highways eliminated rear-end crashes [14].
Another factor could be the merging drivers’ perception of the speed of their fellow vehicles. Wu et al. [15] investigated perceived vehicle speeds from the driving perspective using video clips of naturalistic driving recordings. They found that with the increase in image size, participants underestimated the driving speed. Not only the perceived speed, but also the actual acceleration/deceleration capacity varies between the different types of vehicles. For instance, Bokare & Maurya [16] found that the maximum deceleration rate was significantly higher for diesel and petrol cars compared to trucks. The authors further observed that in most of the cases, the maximum deceleration rates increased with an increase in the approach speed of the vehicles. Similar results were observed in another study comparing the acceleration/deceleration rates of different types of vehicles at signalized intersections [17]. The results indicated that compared to two/three-wheelers and cars, trucks require a relatively higher time to decelerate.
In this study, we considered the Next-Generation Simulation (NGSIM) open-source dataset collected on two different highway segments [18]. The NGSIM trajectory dataset has been widely used to analyze and predict macroscopic as well as microscopic aspects of traffic-flow phenomena, such as understanding congestion phenomena through fundamental diagrams [19], calibrating and validating lane-changing models [20,21,22], car-following models [23,24,25,26], queue estimations [27,28], etc. To the best of our knowledge and extensive literature search, the impact of speed difference (i.e., between following mainstream and on-ramp merging vehicles) on space headways when considering vehicle type and geometric design has never been studied using real world data including the NGSIM datasets. This study fills that gap in the literature by analyzing the safety of merging vehicles considering the speed difference, different geometric designs (with/without an auxiliary lane) and vehicle types.
The main objective of this study is to investigate the space headway (or spacing) adjustment behavior by the drivers who are interacting, i.e., following vehicles on the main highway and merging vehicles at on-ramp locations. In particular, the impacts of the speed difference between the following and merging vehicles will be studied in detail using the NGSIM trajectory dataset. Given the level of speed differences between the vehicles on the main highway and on the ramp, the headway-adjusting behavior could be significantly different at on-ramp locations compared to general cases. Further, this behavior and the associated parameters, i.e., headway and speed differences, could have important implications for safety as well as capacity at ramp locations. To this end, we formulate the following hypotheses:
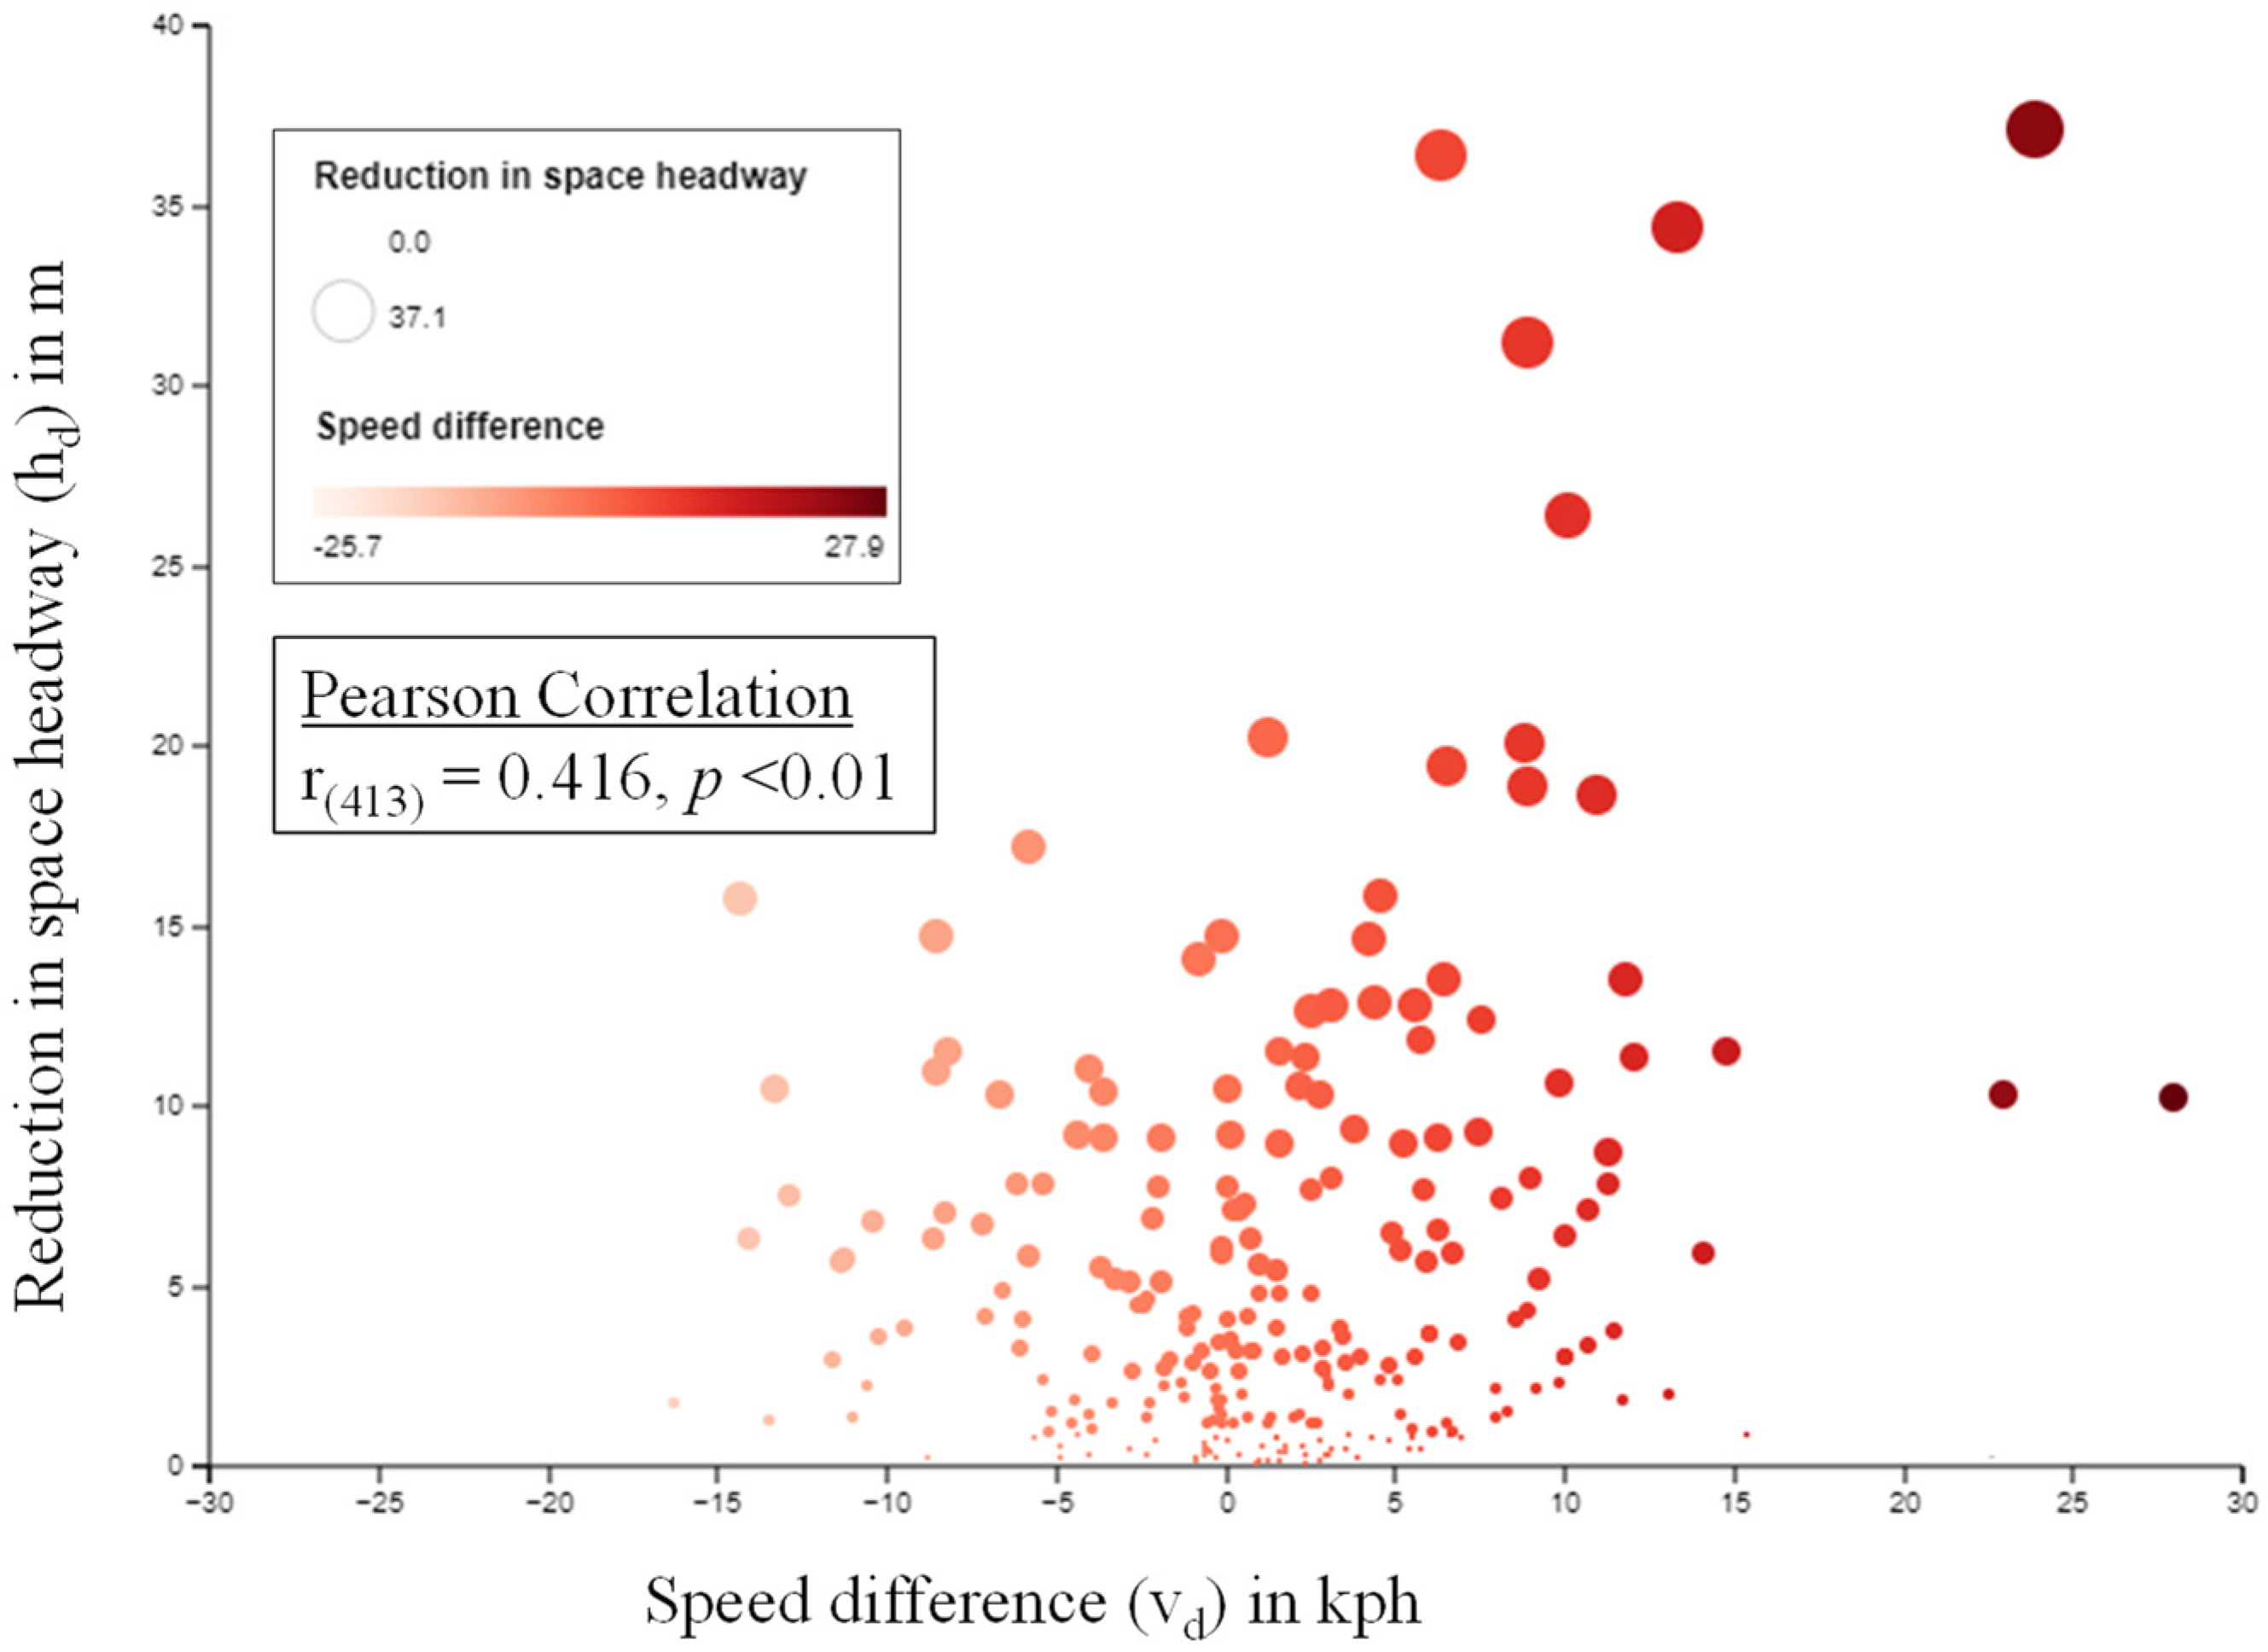
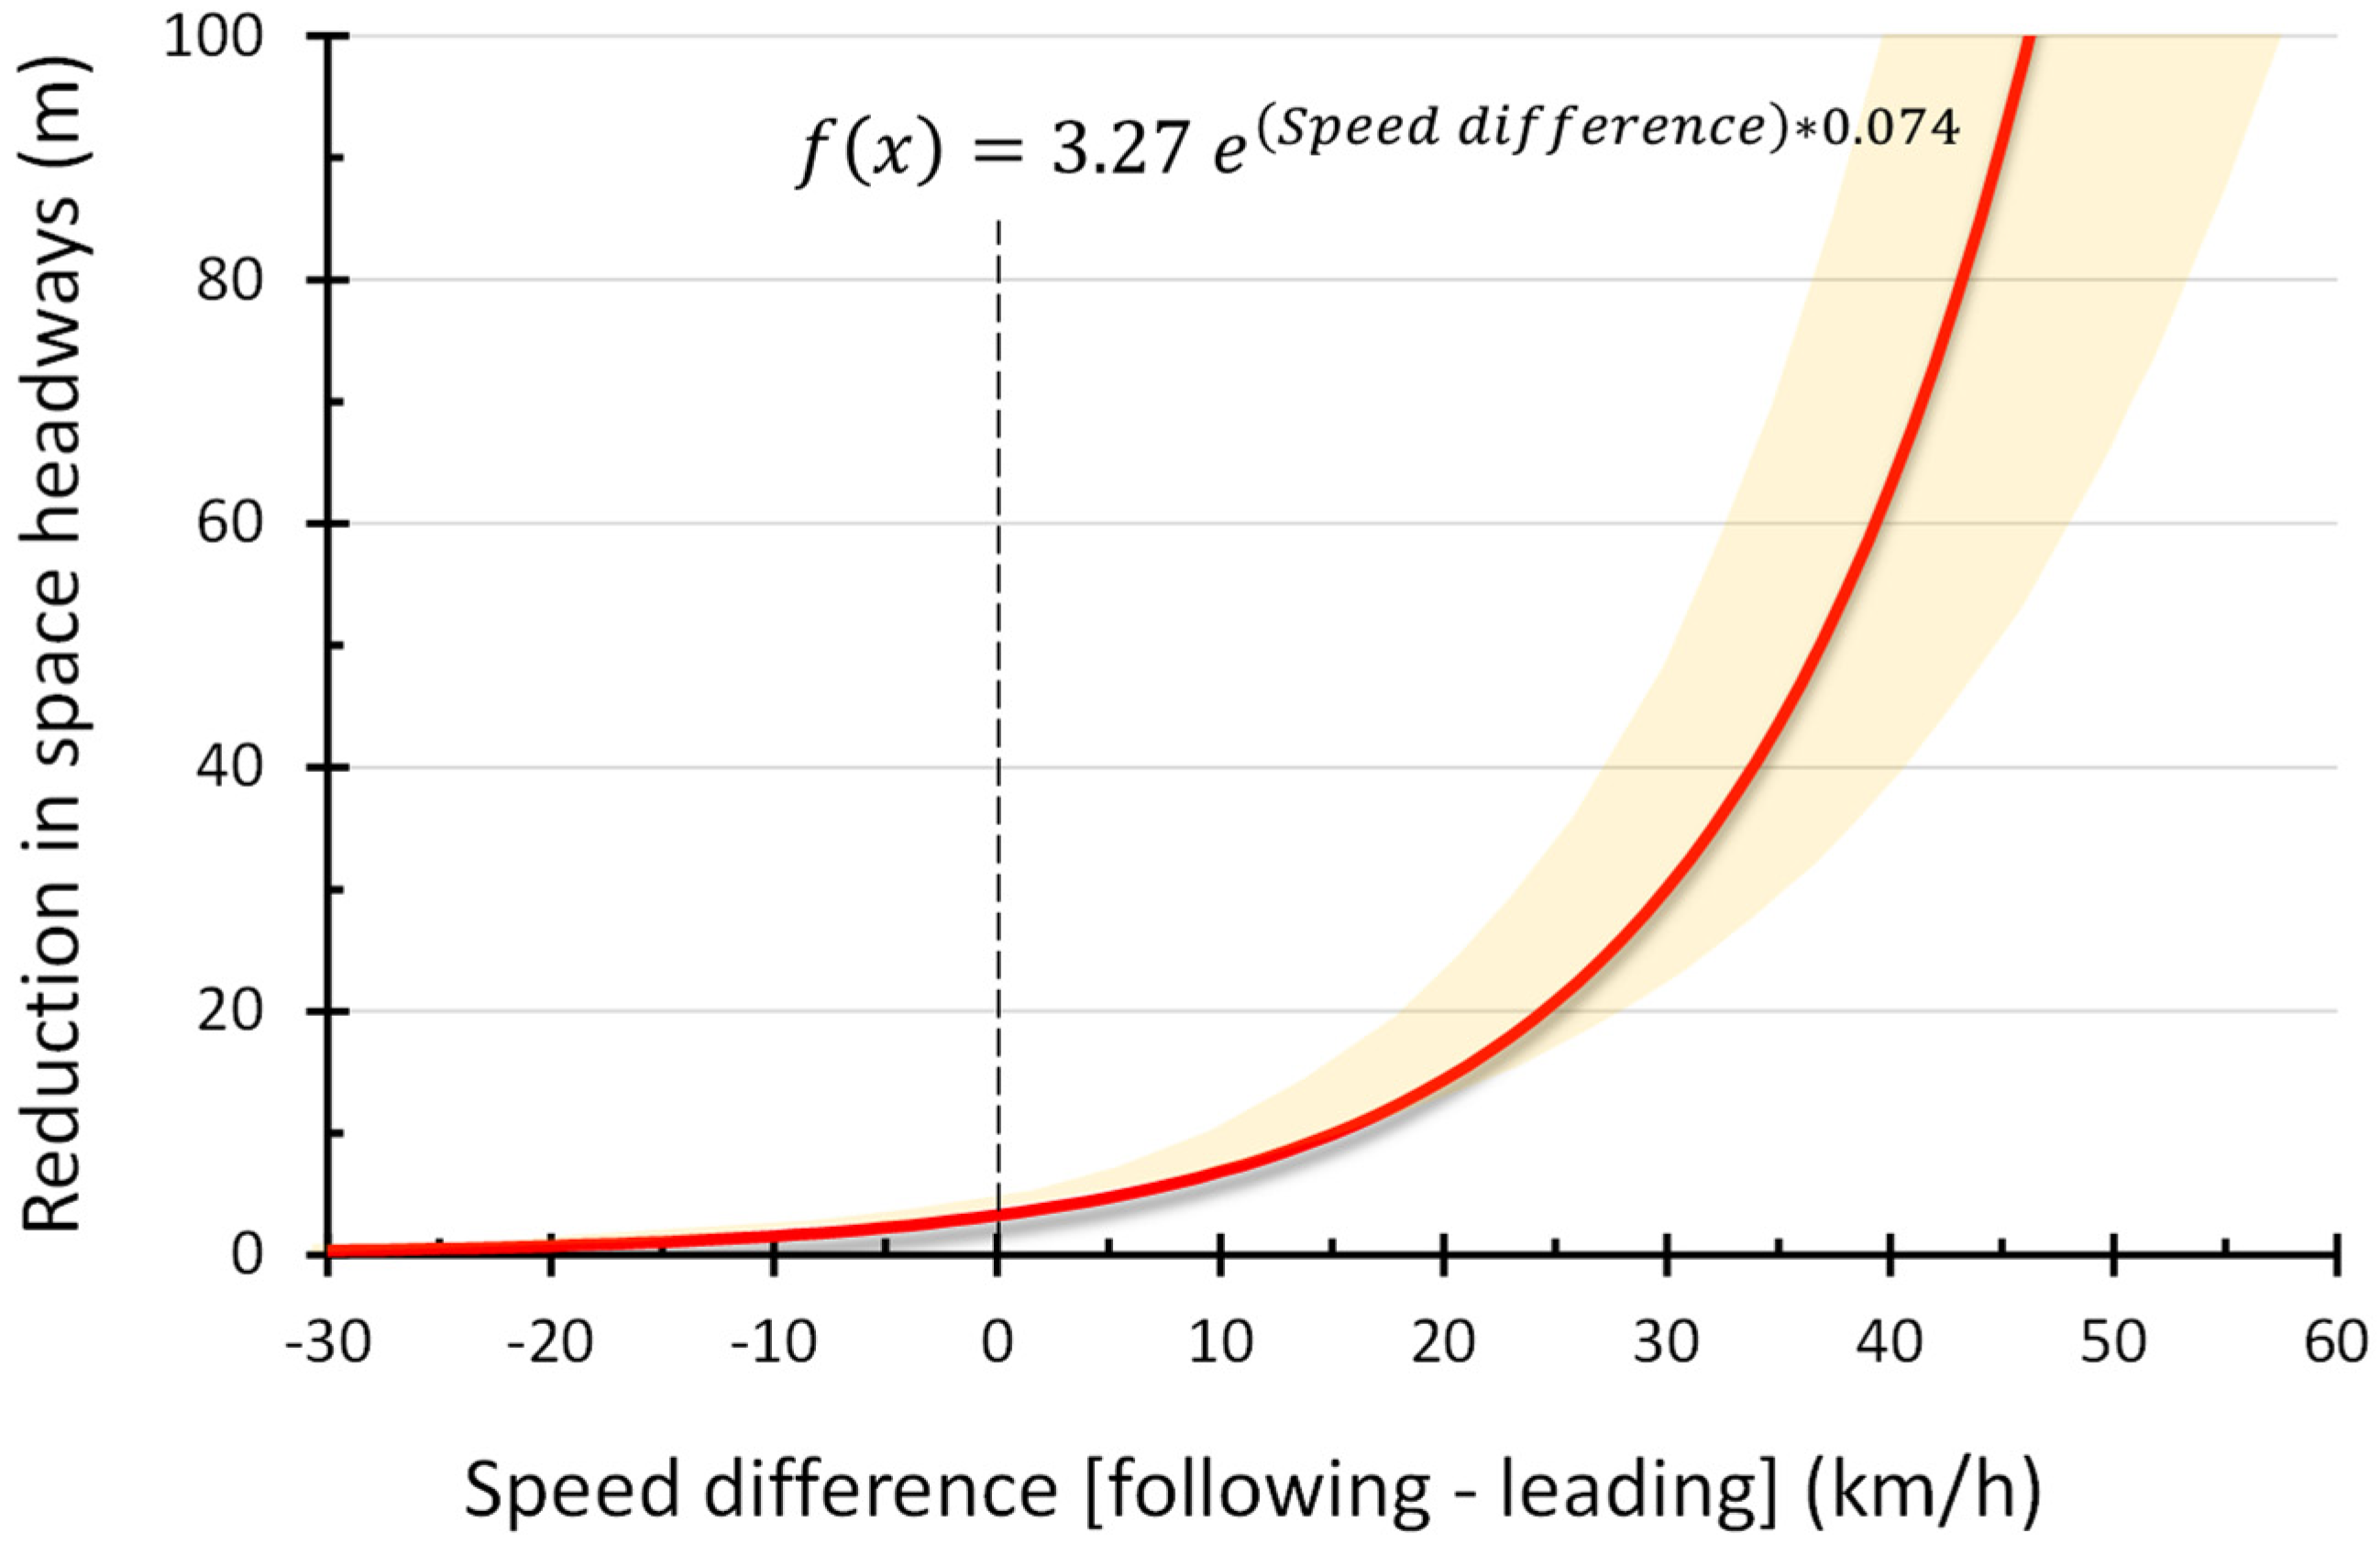
  • The higher the speed difference between the following and merging vehicle, the greater the reduction in space headway would be.
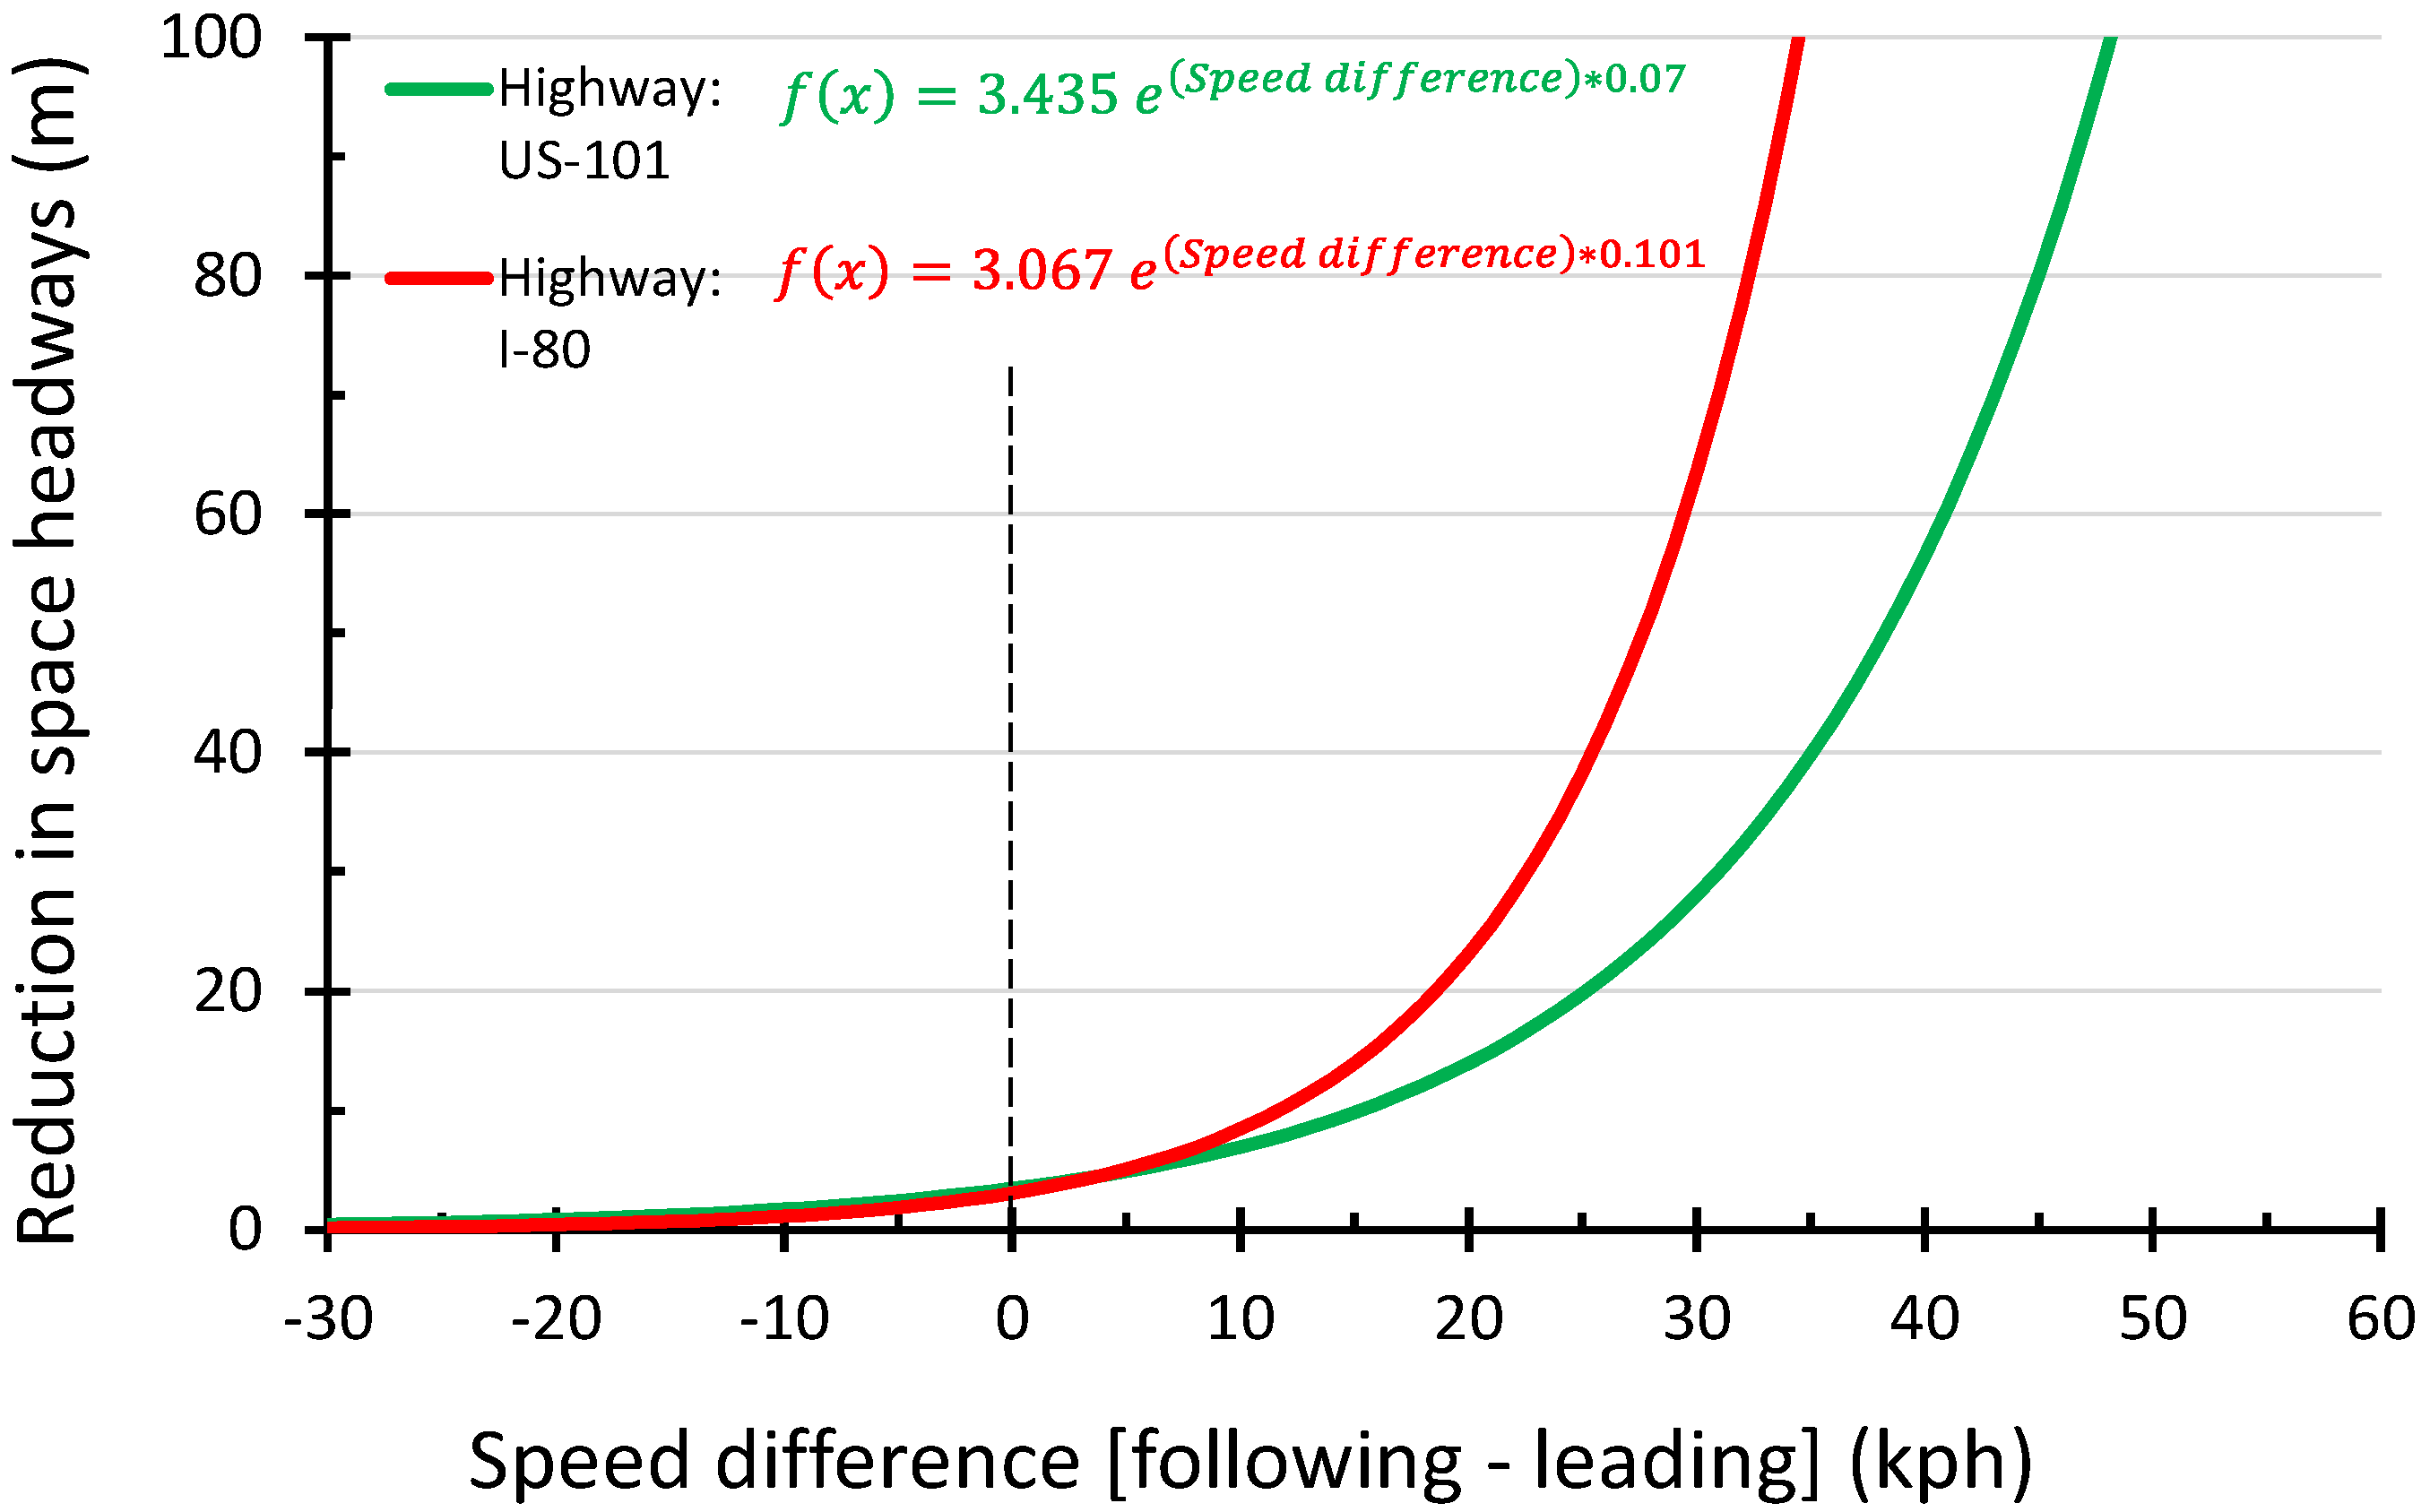
  • Space headway reduction is higher for highways without an auxiliary lane.
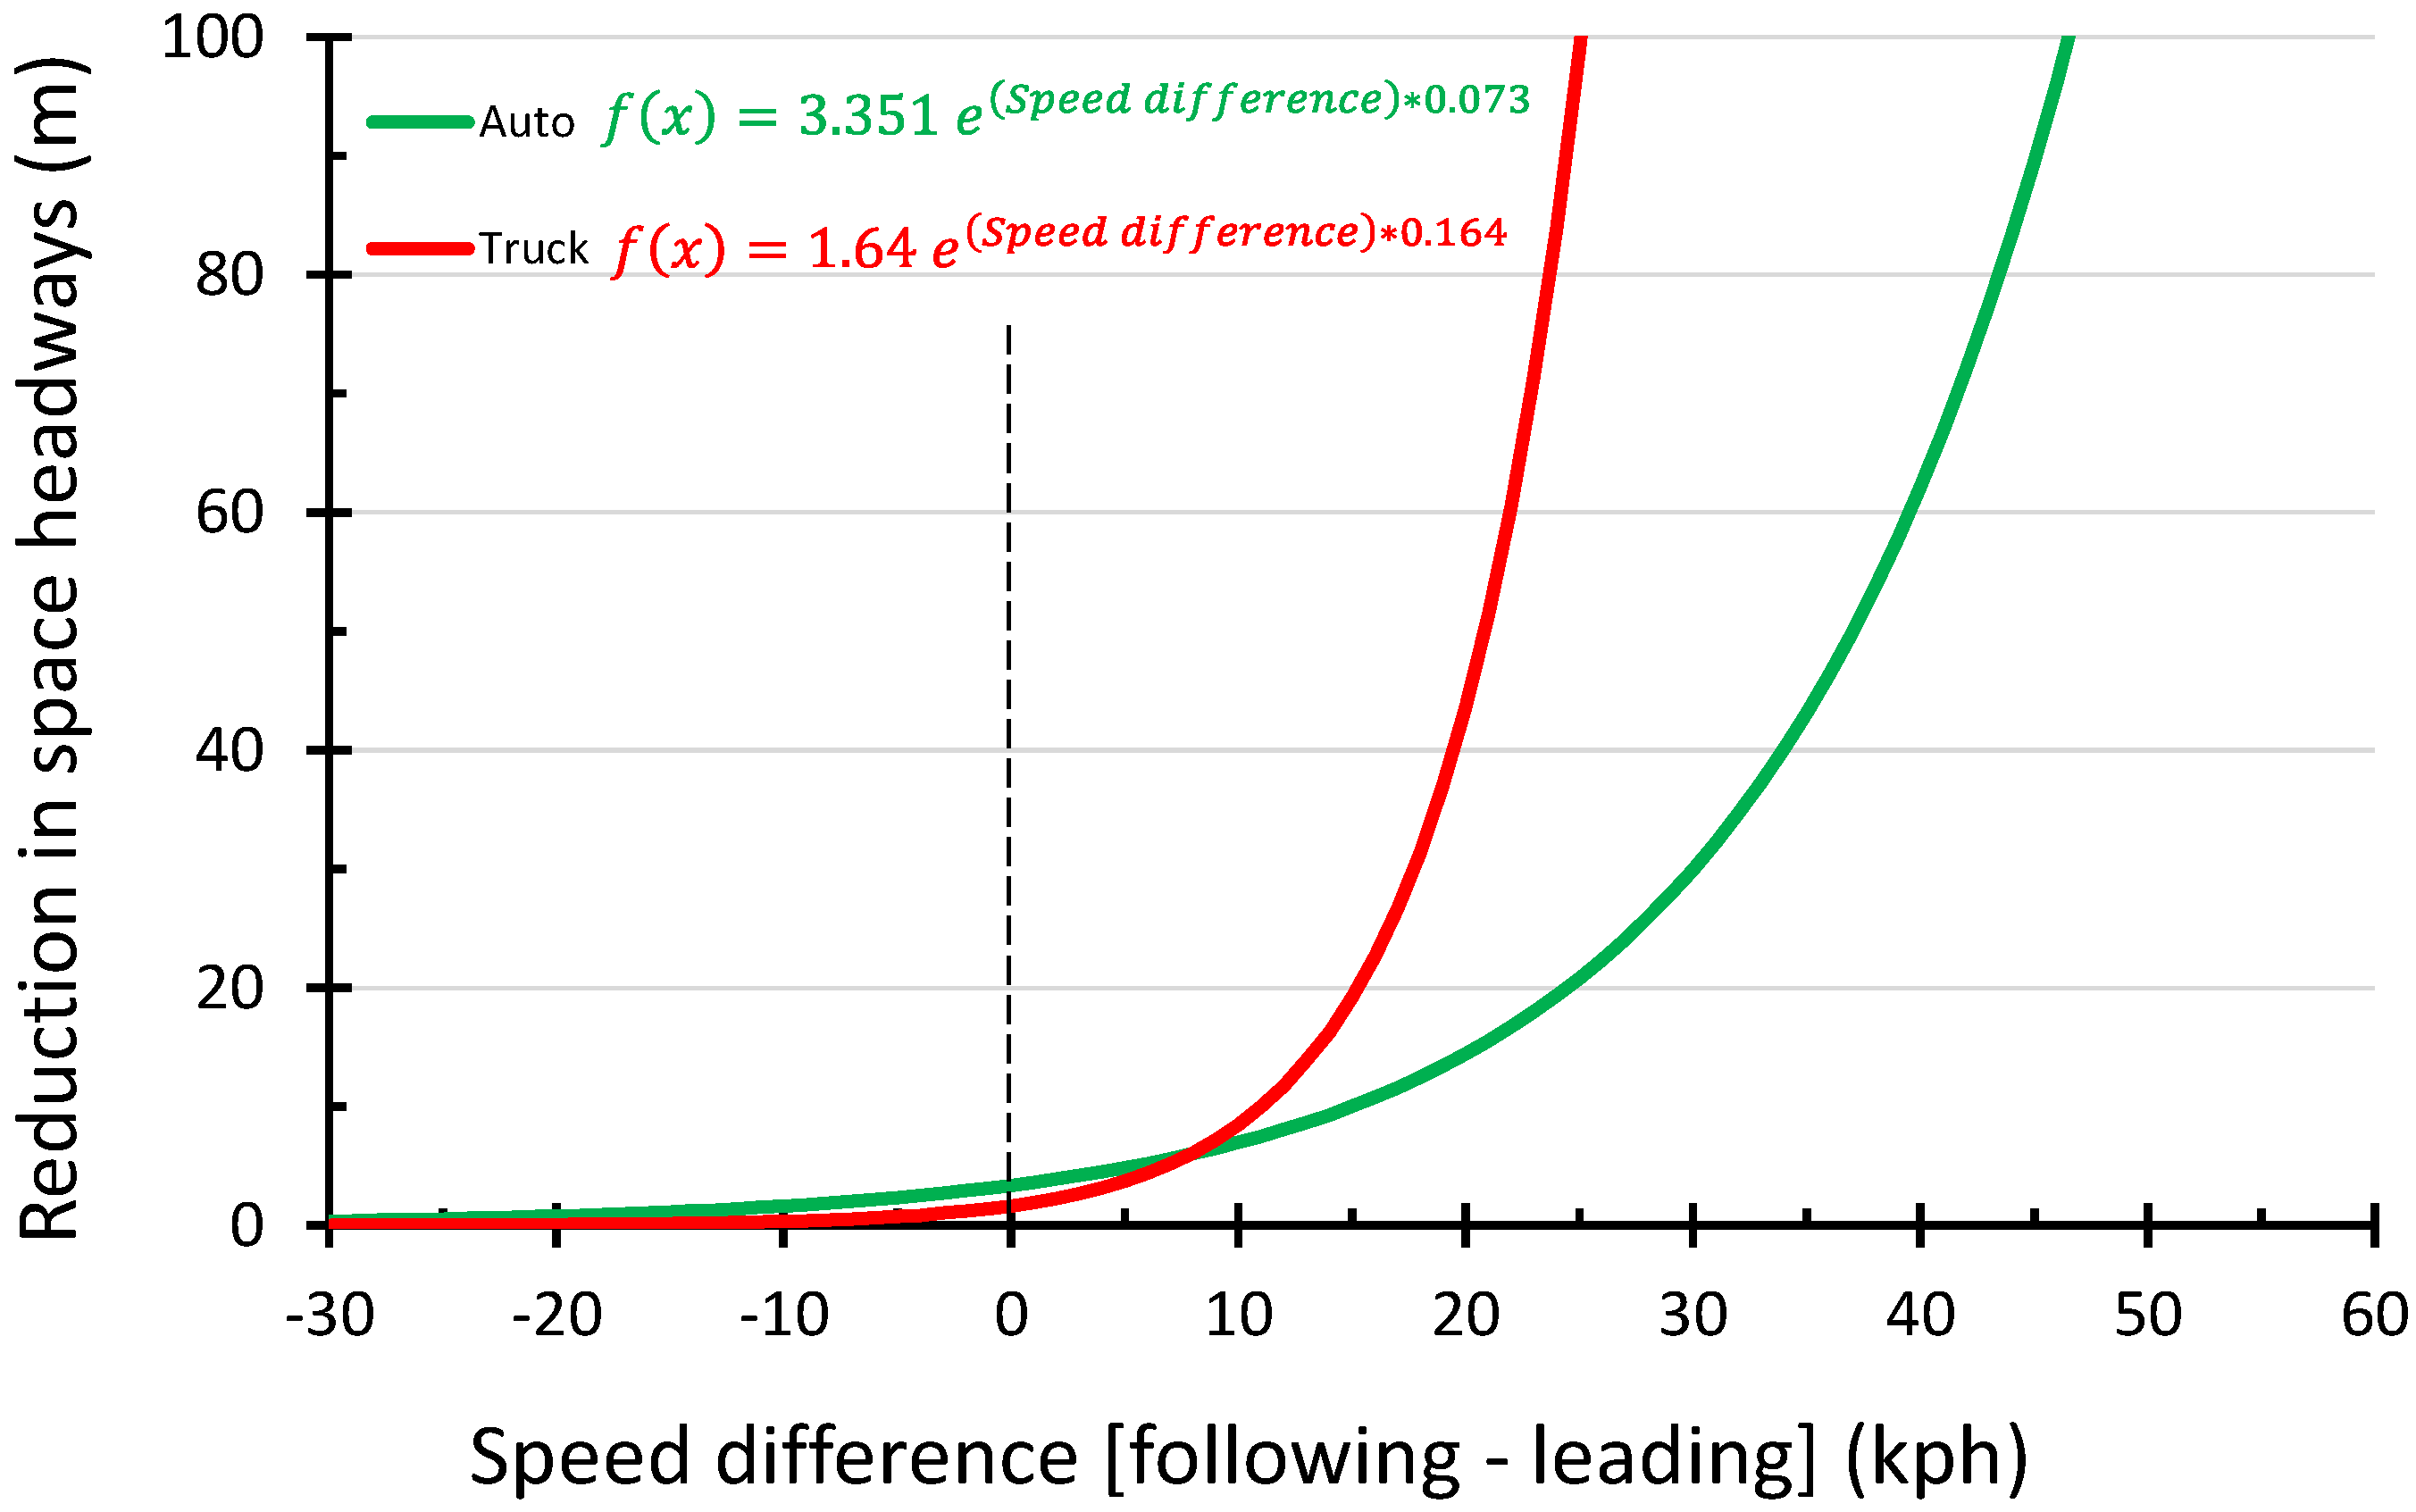
  • Space headway reduction is higher if the following vehicle is a truck.
The outcome of the study would not only allow practitioners to improve safety at highway merging points but also can be used to enhance microscopic traffic simulation models, e.g., headway adjustment behavior in car-following models [29], and to calibrate and validate them.

2. Materials and Methods
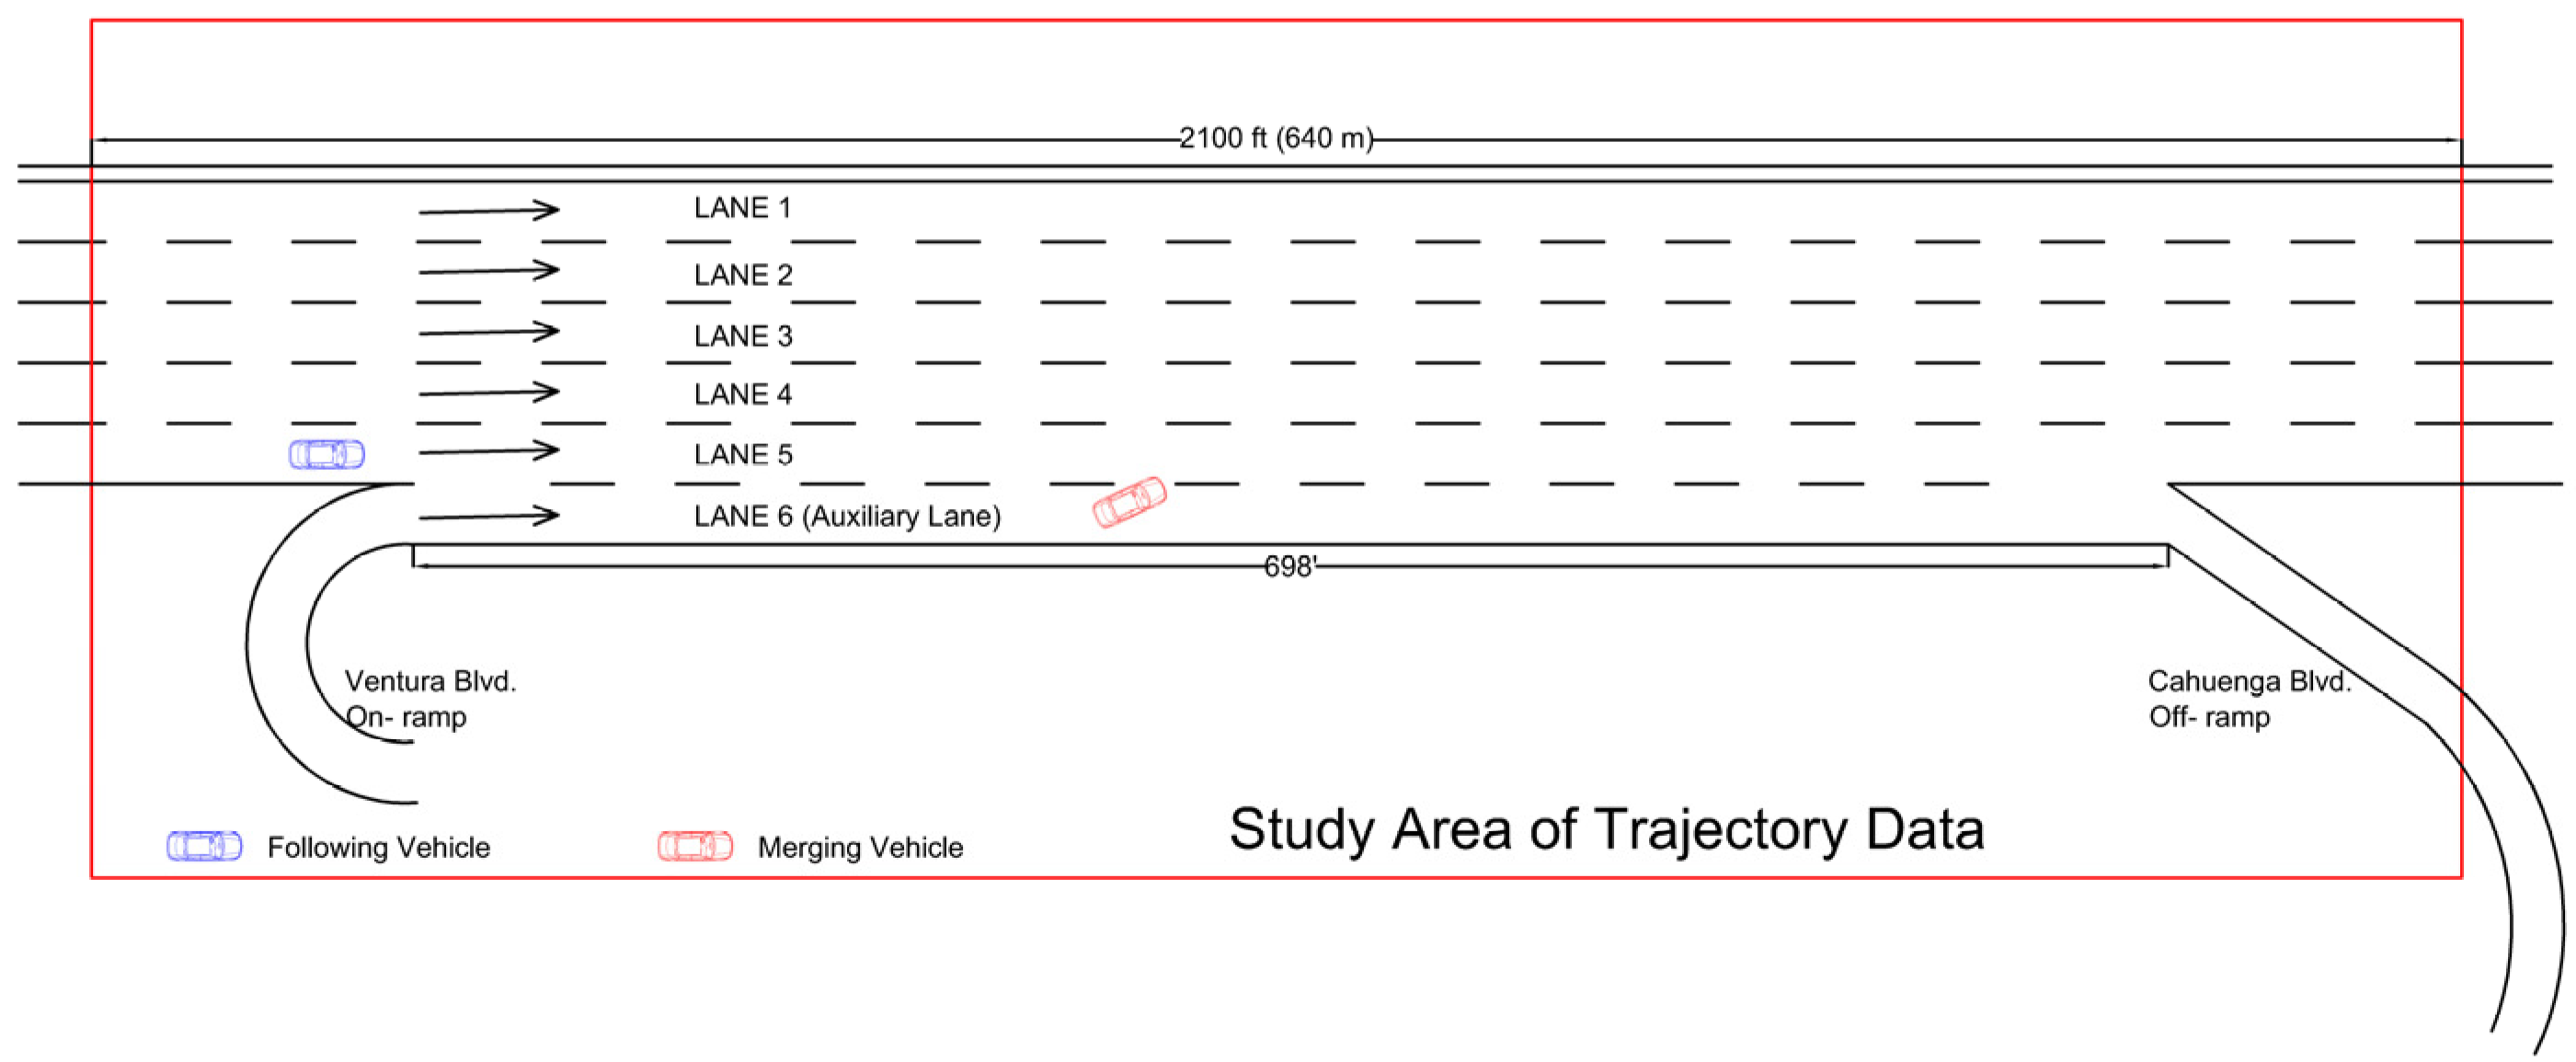
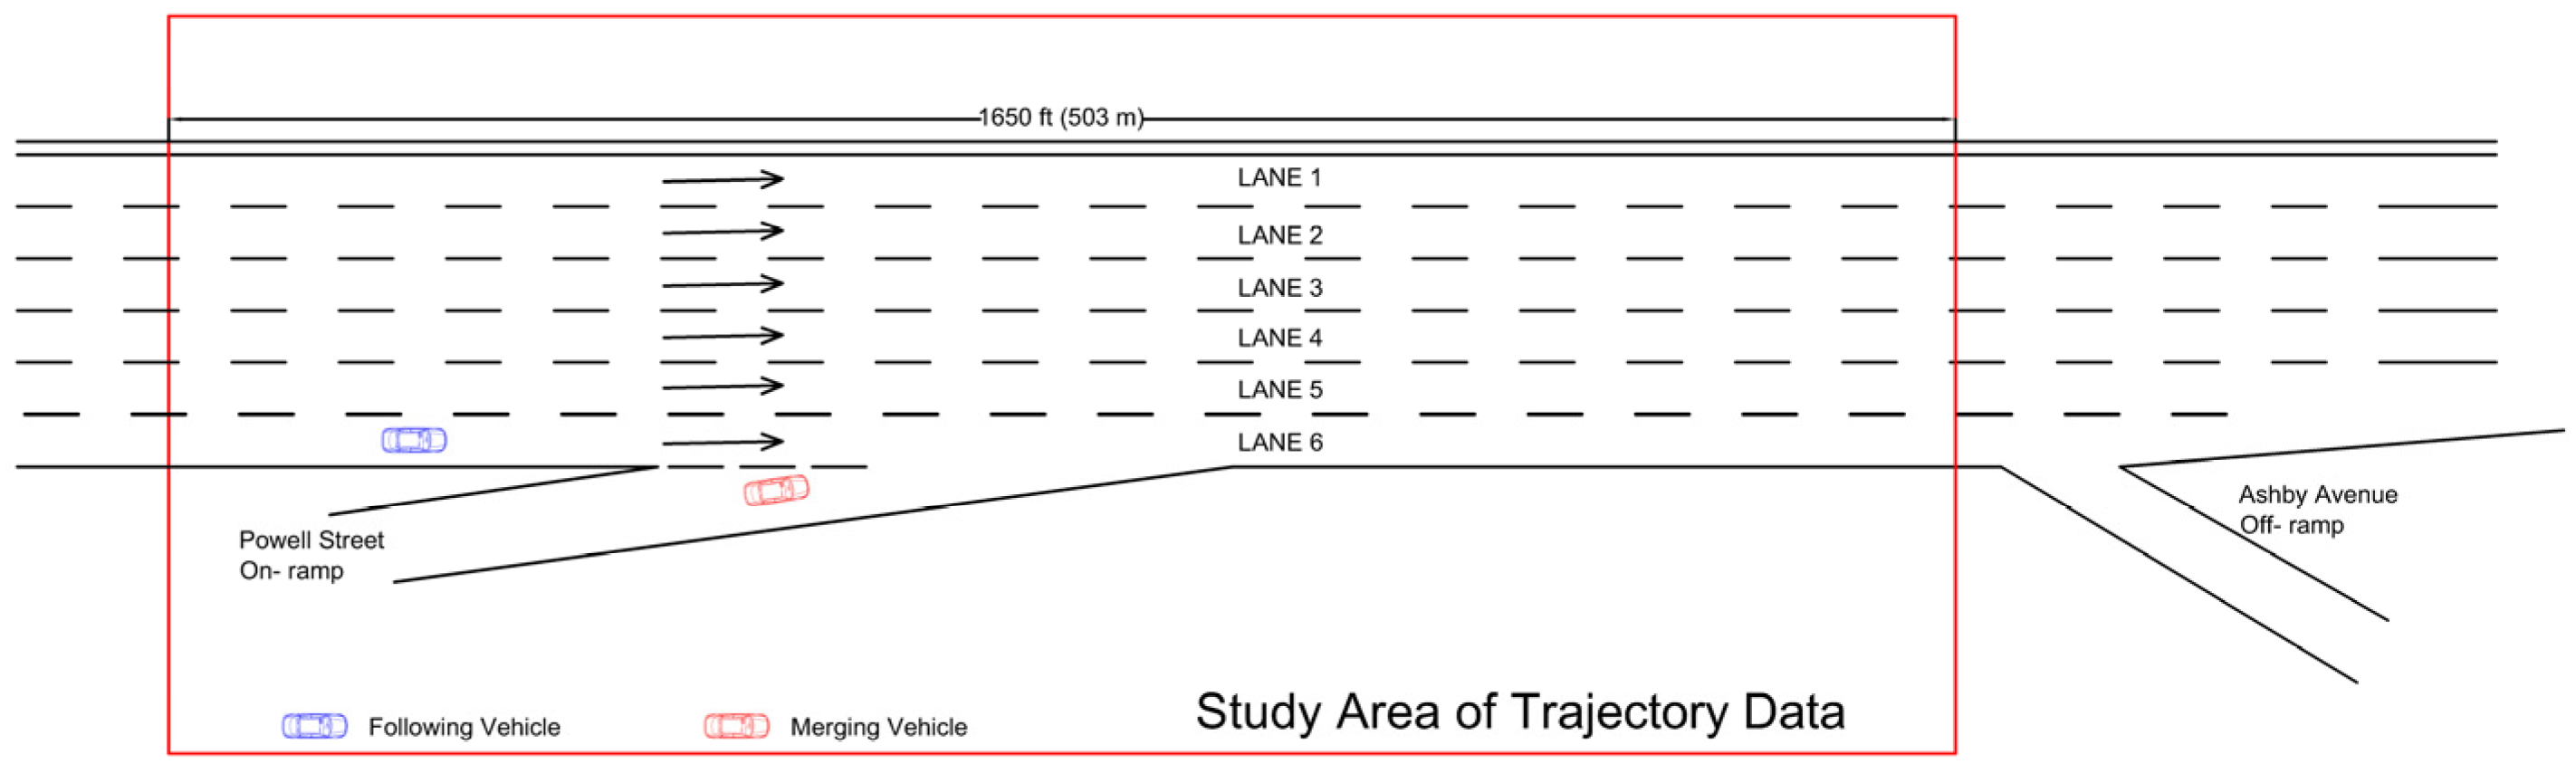
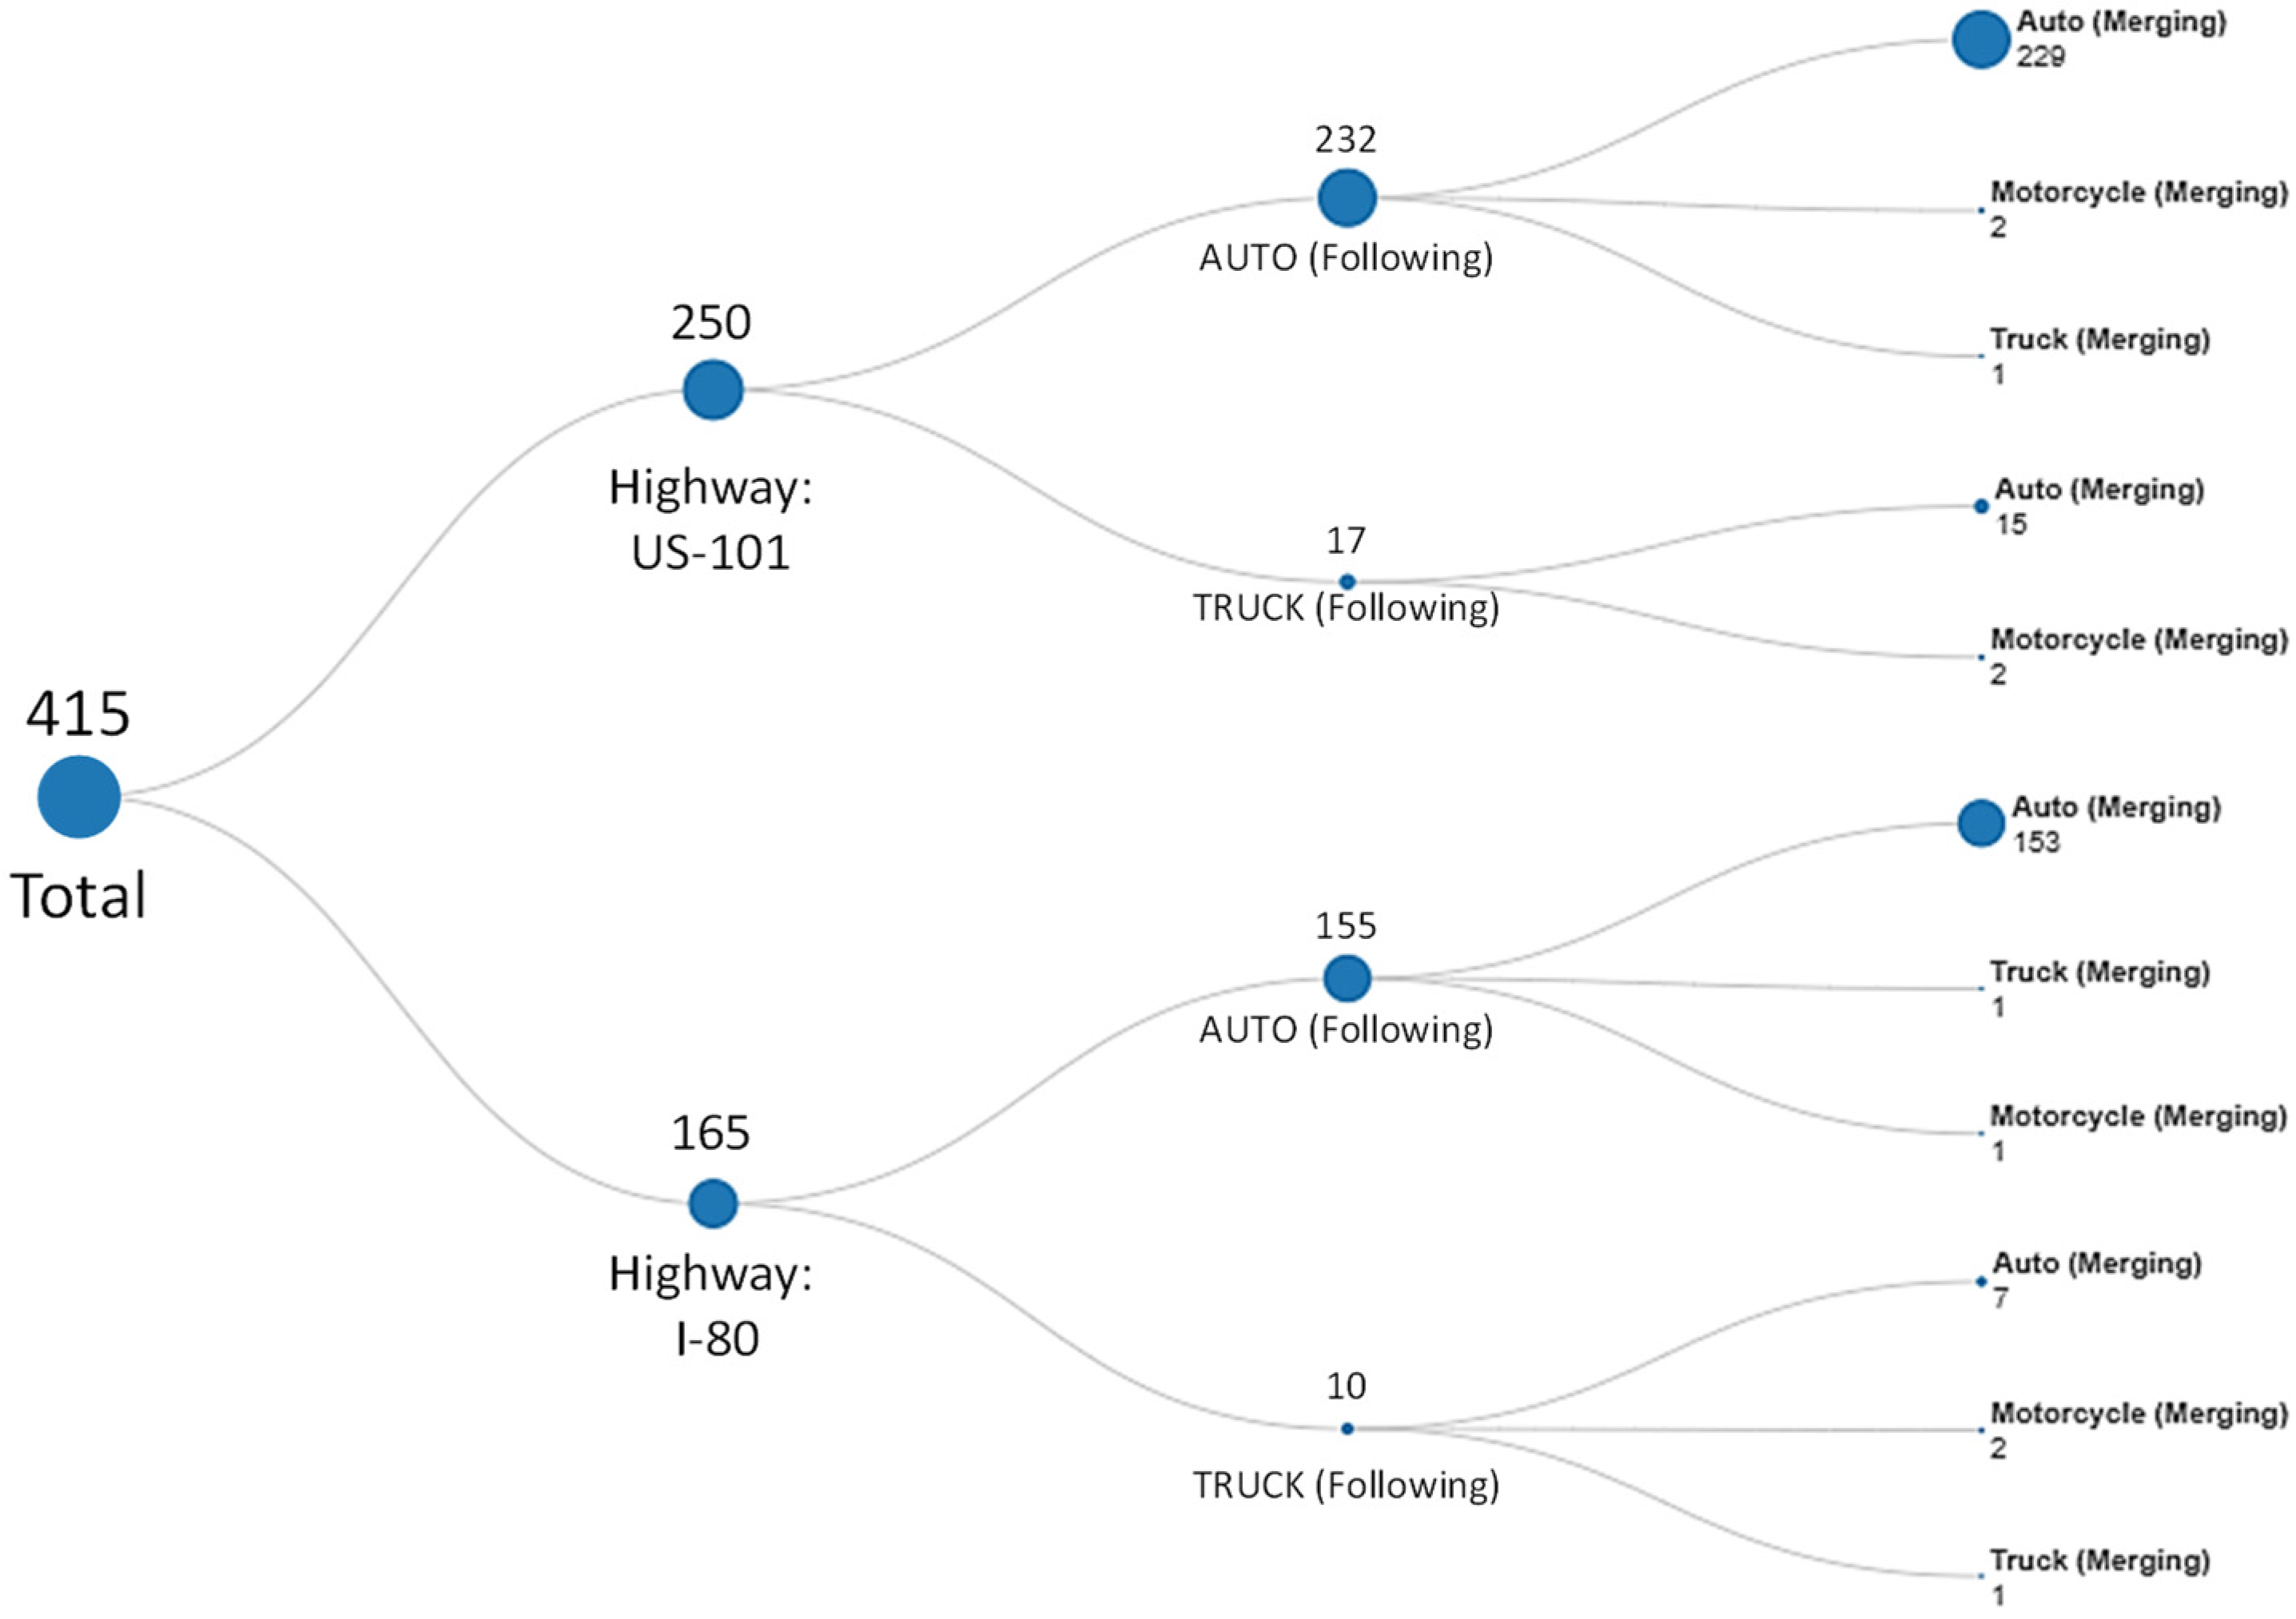
2.1. Dataset

The Federal Highway Administration of the U.S. Department of Transportation collected the NGSIM dataset at four different locations, including two highway segments and two arterial segments [18]. For the purpose of this study, we considered the datasets associated with the two highways, i.e., US-101, also known as Hollywood freeway, in Los Angeles and I-80 in the San Francisco Bay area. As illustrated in Figure 1, the study area of the US-101 is around 640 m in length and contains five mainstream lanes throughout the section. An additional auxiliary lane is present between the on-ramp and the off-ramp. The speed limit on the US-101 highway was 55 mph at the time of data collection. On the other hand, the study area of the I-80 is around 500 m in length, contains six mainstream lanes and is without a separate auxiliary lane present between the on-ramp and off-ramp (see Figure 2). The speed limit on the I-80 highway was 65 mph at the time of data collection.

2.2. Features Selection and Data Extraction

The vehicle trajectory data are transcribed from videos and are available for every one-tenth of a second in Microsoft Excel and Text Document formats. Each column of the Excel or Text documents represents an attribute. The trajectory data include 18 different attributes, such as vehicle IDs, longitudinal position along the road, lateral position, current lane position, speed, acceleration/deceleration, space headways and time headways relative to other vehicles, etc. [18]. All the attributes and their definitions are presented in Table A1 in Appendix A. In total, the trajectory data were available for 12,473 vehicles, i.e., 6014 vehicles on the US-101 and 6459 vehicles on the I-80 highways.
For the sake of this study, we were only interested in the interactions between the on-ramp merging vehicles and the following vehicles that were driving on the outermost lane of the mainstream. In this regard, first of all, we filtered the data for on-ramp vehicles by using the Lane-ID attribute. Further filtration was performed for only vehicles that merge into the highway, since there were some cases where on-ramp vehicles used the auxiliary lane and took the exit at the off-ramp. In addition, at the merging point, we also filtered the data for cases where a following vehicle was present in the same lane using the “Following” attribute of the data. After the filtration, a total of 428 such interactions were captured from both datasets. Extracted data for each interaction include position (sm, sf), speed (vm, vf), space headways at merging point ( h mer ) , minimum space headways achieved along the study area ( h min ) and the vehicle class of both vehicles. The extracted data were used to calculate the speed difference between the following and merging vehicles   [ v d =   v f   v m ] as well as the reduction in space headways that happened in each interaction [ h d =   h mer   h min ] . The calculated values for the variable “reduction in space headway” ( h d ) were always greater than or equal to zero.
Out of the total interactions, 13 interactions were removed based on (one of) the following criteria: (a) extreme outliers in terms of the speed difference between the merging and following vehicles, i.e., the following vehicle was driving with a much lower speed and was in the free flow condition. These cases were removed because there was no potential interaction between the two vehicles and the inclusion of such cases could bias the study results. (b) Cases where either the following or merging vehicles changed their lanes just after the interaction occurred. Thus, a total of 415 interactions were considered for the analyses. Figure 3 summarizes the 415 interactions in terms of highways, following vehicle class and merging vehicle class. It can be seen that most of the interactions were between auto-auto, followed by truck-auto.

2.3. Statistical Analysis

Descriptive analyses were conducted to report the overall trajectories characteristics. In addition, a bubble plot (a modified form of scatter plot) and correlation analysis were used to understand the trend between the response variable and predictor. The trend showed exponential relationships; therefore, exponential nonlinear regression models were conducted to estimate the impact of speed difference on headway reductions. The exponential regression models are widely used to estimate nonlinear relationships [30]. A general form of an exponential regression model for a single predictor can be written as follows [30]:
y =   α e γ x +   ε
where y is the response variable, x is the predictor, α and γ are unknown parameters and ε is the error term N (0, σ2).
To conduct the statistics, we relied on SPSS Statistics Version 28 and Minitab Statistical Software. The significance level was set to p < 0.05 for the correlation analyses. In terms of nonlinear models, p-values cannot be computed since nonlinear equations can take many different forms. Instead, the confidence interval for each parameter estimate can be used to determine if the interval range is feasible and indicates a significant effect [31].
The results will be organized in four different sections: (a) descriptive statistics of the extracted interactions together with the correlation figures; (b) results from the exponential regression model considering overall interactions; (c) comparison of both highways; and (d) comparison of following vehicle class.

3. Results

3.1. Descriptive Statistics and Correlation Tests

Table 1 presents the descriptive statistics of the speed difference between the following and merging vehicles (vf − vm) and the reduction in space headway ( h mer h min ). It can be read from the table that space headway (in m) significantly reduced when considering overall data (t(414) = 12.1, p < 0.001). The headway reduction was higher for I-80 compared to US-101. On the other hand, the mean speed difference on I-80 (0.6 kph) was higher compared to US-101 (−3.8 kph). This means that at the merging point, the mean speed of the merging vehicles was higher than the mean speed of the following vehicles on US-101. This could be because an auxiliary lane was present on the US-101 highway, allowing drivers to accelerate before the first interaction occurred.
To see the trend between v d and h d , a bubble plot was plotted for the data, together with the Pearson Correlation test (see Figure 4). The results from the Pearson correlation confirmed a moderate to strong positive correlation (r(413) = 0.416) between the two variables [32], which was significantly greater than zero (p < 0.01) [33]. It can be visualized from the bubble plot that the data follow a nonlinear trend between the two variables. Thus, the most commonly used exponential regression model was used to estimate the reduction in space headway. Five different models were estimated: the main model considering the total interactions; two separate models for interactions that occurred on each highway; and two separate models for the two vehicle classes (i.e., auto and truck).

3.2. Main Exponential Regression Model Considering the Overall Interactions

Table 2 shows the results from the exponential regression model considering the overall interactions (n = 415). In this regard, h d was used as a response variable, while v d was considered as a predicting variable. The estimation results seem plausible as the parameters have the correct signs and the lower and upper bounds of the corresponding confidence interval lie in the same quadrant of the plot, which indicates a significant effect [31]. Additionally, the overall model goodness-of-fit statistic is within an acceptable range.
The fitted exponential regression function is illustrated in Figure 5. The vertical dashed line in the figure represents the point at which the difference in speed between the following and merging vehicles was zero at the point of the first interaction. It can be seen that the function follows an exponential trend after the difference in speed becomes higher than 30 km/h. Based on the model results, the reduction in space headways reaches 30 m at v d = 30 km/h, 50 m at v d = 37 km/h and 100 m at v d = 46 km/h.

3.3. Highway

Two separate exponential regression models were estimated for both highways independently (see Table 3). In total, the estimated model for US-101 includes 250 interactions, while the model for I-80 includes 165 interactions. Again, both models performed satisfactorily, i.e., the corresponding confidence interval for each parameter lies in the same quadrant, indicating significant effects.
To understand the difference between the two highways, both functions were plotted together, as shown in Figure 6. It can be seen from the figure that the reduction in headway for I-80 follows a steeper exponential trend compared to US-101. The reduction in space headway for the I-80 highway reaches 30 m at v d = 23 km/h, 50 m at v d = 28 km/h and 100 m at v d = 35 km/h. When it comes to the US-101, space headway reduction becomes 30 m at v d = 31 km/h, 50 m at v d = 39 km/h and 100 m at v d = 49 km/h.

3.4. Following Class

To analyze the difference between the two following vehicle classes (i.e., auto and truck), two separate exponential regression models were estimated, as shown in Table 4. In this regard, a total of 388 interactions were included in the “Auto” category while 27 interactions were included in the “Truck” category. It is important to mention that both models performed satisfactorily. The lower and upper bounds of the corresponding confidence interval for each parameter possessed the same signs (positive) showing that they lie in the same quadrant. This indicates the significant effects of both parameters used in each model. In addition, the r-squared values were 0.203 and 0.361 for “Auto” and “Truck”, respectively.
Next, the regression functions were plotted together for both models, as illustrated in Figure 7. As shown, a higher space headway reduction trend was estimated if the following vehicle was a truck compared to if it was an auto. For instance, for a speed difference ( v f   v m ) of 20 km/h, the space headway reduces up to 44 m for the “following vehicle = truck” compared to 14.3 m for the “following vehicle = auto”.

4. Discussion and Conclusions

This study aimed at investigating the impact of speed differences on space headway-adjustment behavior at highway merging sections. To achieve this key aim of the study, we formulated three hypotheses considering the overall interactions, two different highway on-ramps and vehicle class. The NGSIM trajectory data from two different highways were filtered for interactions between the on-ramp merging and following vehicles on the outermost lane of the mainstream.
Results from the Pearson correlation showed a significant positive correlation between the speed difference and headway reduction. This is indeed obvious if only physical parameters are considered. However, these relations could vary due to several factors, such as driving behavior itself [34], the geometric design of on-ramps [9], posted speed limit on the road [35], vehicle type and driver perception of safety [15,36], other environmental factors [37], etc. Therefore, it is important to understand the headway reduction trend considering real world cases, such as the NGSIM trajectories. The characteristics of the data allowed us to estimate nonlinear models for such interactions. The model showed a significant and exponential trend of headway reduction, especially when the difference in speed was higher than 30 km/h. This indicates the importance of harmonizing the speeds of the merging and following vehicles at highway merging locations [38]. Using active traffic management strategies, a maximum appropriate speed limit can be used to lower the speed difference of such interactions [39,40]. Another method could be motivating drivers to maintain safe and larger space headways with merging vehicles, such as using active gap metering signalization [41].
Our results showed that the highway US-101 performed better compared to I-80, i.e., a higher space headway reduction represents a lower level of road safety at I-80. This could be due to the fact that US-101 was equipped with an auxiliary lane, allowing drivers to merge safely [10]. In this context, simulation studies indicated that introducing a parallel auxiliary lane could reduce the conflict frequency by more than 80 percent compared to the tapered merge area [42]. In cases where the introduction of an auxiliary lane is not feasible, dynamic merge control strategies can be used on the mainstream before merging locations—for instance, to motivate outermost lane drivers to change their lane and/or reduce their speed as per lane-specific variable speed limits [43].
Regarding the vehicle class of the following vehicle, we found that the space headway reduction was higher for trucks compared to autos. This finding corroborates the fact that due to the higher momentum (mass * velocity), trucks require a relatively longer time to decelerate [17]. In addition, the merging drivers’ perceptions about the speed of the following vehicle could also play an important role in accepting relatively smaller gaps since the speed of larger vehicles could be underestimated [15]. Therefore, it may not be appropriate to set uniform speed limits for autos and trucks considering the different physical and maneuverability characteristics of these two types. To address this issue and reduce the speed difference between following trucks and merging vehicles, differential speed limits can be set for trucks and cars, with trucks having lower posted speed limits [44].
The results of this study are important, since it considers real world interactions at merging locations under different geometric designs and vehicle classes. The outcomes of this study could be beneficial for policymakers and practitioners aiming to enhance road safety, as well as efficiency at merging locations. The resulting parameters and the empirical relationships can be used to improve microsimulation models for headway adjustment behavior, e.g., in car-following models as well as for validating and calibrating such models.
This study is not without limitations. The sample size used in the study was not very large; 415 interactions were considered for the analyses. However, based on the available datasets and filtration criteria, these were the only interactions that were obtained. Furthermore, vehicle class was not considered for merging vehicles, since the distribution of trucks and two-wheelers was too small. Finally, only two geometric settings, i.e., with and without auxiliary lane, were available in the data for comparison purposes.

Author Contributions

Conceptualization, Q.H. and C.D.; Data curation, A.A.-S. and I.H.; Formal analysis, Q.H. and A.A.-S.; Investigation, Q.H. and C.D.; Methodology, Q.H., C.D. and I.H.; Project administration, Q.H.; Resources, A.A.-S.; Software, Q.H.; Supervision, Q.H.; Validation, Q.H. and I.H.; Visualization, Q.H. and C.D.; Writing—original draft, Q.H.; Writing—review and editing, Q.H., C.D., A.A-S. and I.H. All authors have read and agreed to the published version of the manuscript.

Funding

This research was funded by Qatar University, under the Student Grant [QUST-2-CENG-2022-638].

Institutional Review Board Statement

Not applicable.

Informed Consent Statement

Not applicable.

Data Availability Statement

The Next-Generation Simulation (NGSIM) Vehicle Trajectories Open-source dataset has been used in this research. The dataset is available online and can be found here: https://ops.fhwa.dot.gov/trafficanalysistools/ngsim.htm. Accessed 21 September 2022.

Acknowledgments

This publication was supported by Qatar University Student Grant [QUST-2-CENG-2022-638]. The findings achieved herein are solely the responsibility of the author[s].

Conflicts of Interest

The authors declare no conflict of interest. The funders had no role in the design of the study; in the collection, analyses or interpretation of the data; in the writing of the manuscript; or in the decision to publish the results.

Appendix A

Table A1. Attributes and their definitions.
Attribute LabelAttribute Definition
Vehicle_IDA unique vehicle ID (integer) ascending by entry to the section
Frame_IDFrame ID (integer) ascending by start time
Total_FramesTotal number of frames (integer) in which the vehicle appears in the data
Global_TimeElapsed time in milliseconds (integer) since 1 January 1970
Local_XLateral coordinate of the front center of the vehicle with respect to the left-most edge of the section in the driving direction (in feet)
Local_YLongitudinal coordinate of the front center of the vehicle with respect to the start of the section in traveling direction (in feet)
Global_XX Coordinate for the front center of the vehicle based on CA State
Plane III in NAD83 (in feet)
Global_YY Coordinate for the front center of the vehicle based on CA State
Plane III in NAD83 (in feet)
v_LengthVehicle length (in feet)
v_WidthVehicle width (in feet)
v_ClassVehicle type (integer): 1—motorcycle; 2—auto; 3—truck
v_VelVehicle instantaneous speed (feet/second)
v_AccVehicle instantaneous acceleration (feet/second2)
Lane_IDCurrent lane position of the vehicle (integer): 1 represents the farthest left lane, 5 represents the farthest right lane, 6 represents the auxiliary lane and 7 represents the on-ramp lane
PrecedingVehicle ID of the lead vehicle in the same lane. “0” represents no lead vehicle in the study section in the same lane.
FollowingVehicle ID of the following vehicle in the same lane. “0” represents no following vehicle in the study section in the same lane
Space_HeadwayThe distance between the front center of a vehicle to the front center of the preceding vehicle (in feet)
Time_HeadwayThe temporal difference between the front center of a vehicle (at the speed of the vehicle) to the front center of the preceding vehicle (in seconds)

References

  1. Garber, N.J.; Hoel, L.A. Traffic and Highway Engineering; Cengage Learning: Boston, MA, USA, 2019. [Google Scholar]
  2. Liu, R.; Hyman, G. Modelling motorway merge: The current practice in the UK and towards establishing general principles. Transp. Policy 2012, 24, 199–210. [Google Scholar] [CrossRef]
  3. Yang, H.; Ozbay, K. Estimation of traffic conflict risk for merging vehicles on highway merge section. Transp. Res. Rec. 2011, 2236, 58–65. [Google Scholar] [CrossRef]
  4. Lee, S.E.; Llaneras, E.; Klauer, S.; Sudweeks, J. Analyses of Rear-End Crashes and Near-Crashes in the 100-Car Naturalistic Driving Study to Support Rear-Signaling Countermeasure Development; DOT HS: Washington, DC, USA, 2007; Volume 810, pp. 1–125. [Google Scholar]
  5. Khorashadi, A. Effect of Ramp Type and Geometry on Accidents; FHWA/CA/TE-98/13; The National Academies of Sciences: Washington, DC, USA, 1998. [Google Scholar]
  6. Wang, Z.; Chen, H.; Lu, J.J. Exploring impacts of factors contributing to injury severity at freeway diverge areas. Transp. Res. Rec. 2009, 2102, 43–52. [Google Scholar] [CrossRef]
  7. Ben-Yaacov, A.; Maltz, M.; Shinar, D. Effects of an in-vehicle collision avoidance warning system on short-and long-term driving performance. Hum. Factors 2002, 44, 335–342. [Google Scholar] [CrossRef]
  8. Taieb-Maimon, M.; Shinar, D. Minimum and comfortable driving headways: Reality versus perception. Hum. Factors 2001, 43, 159–172. [Google Scholar] [CrossRef]
  9. Yang, G.; Xu, H.; Wang, Z.; Tian, Z. Truck acceleration behavior study and acceleration lane length recommendations for metered on-ramps. Int. J. Transp. Sci. Technol. 2016, 5, 93–102. [Google Scholar] [CrossRef] [Green Version]
  10. Lee, C.; Abdel-Aty, M. Analysis of crashes on freeway ramps by location of crash and presence of advisory speed signs. J. Transp. Saf. Secur. 2009, 1, 121–134. [Google Scholar] [CrossRef]
  11. Daamen, W.; Loot, M.; Hoogendoorn, S.P. Empirical analysis of merging behavior at freeway on-ramp. Transp. Res. Rec. 2010, 2188, 108–118. [Google Scholar] [CrossRef]
  12. Kondyli, A.; Elefteriadou, L. Driver behavior at freeway-ramp merging areas based on instrumented vehicle observations. Transp. Lett. 2012, 4, 129–142. [Google Scholar] [CrossRef]
  13. Chen, H.; Zhou, H.; Zhao, J.; Hsu, P. Safety performance evaluation of left-side off-ramps at freeway diverge areas. Accid. Anal. Prev. 2011, 43, 605–612. [Google Scholar] [CrossRef]
  14. Ale, G.B.; Varma, A.; Gage, B. Safety impacts of right-turn lanes at unsignalized intersections and driveways on two-lane roadways: Crash analysis. J. Transp. Eng. 2014, 140, 04013001. [Google Scholar] [CrossRef]
  15. Wu, C.; Yu, D.; Doherty, A.; Zhang, T.; Kust, L.; Luo, G. An investigation of perceived vehicle speed from a driver’s perspective. PLoS ONE 2017, 12, e0185347. [Google Scholar] [CrossRef] [PubMed] [Green Version]
  16. Bokare, P.S.; Maurya, A.K. Acceleration-deceleration behaviour of various vehicle types. Transp. Res. Procedia 2017, 25, 4733–4749. [Google Scholar] [CrossRef]
  17. Ramireddy, S.; Ala, V.; Kvr, R.; Mehar, A. Acceleration and Deceleration Rates of Various Vehicle Categories at Signalized Intersections in Mixed Traffic Conditions. Period. Polytech. Transp. Eng. 2021, 49, 324–332. [Google Scholar] [CrossRef]
  18. U.S. Department of Transportation Federal Highway Administration. Next Generation Simulation (NGSIM) Vehicle Trajectories and Supporting Data. [Dataset]. Provided by ITS DataHub through Data.transportation.gov. 2016. Available online: https://data.transportation.gov/Automobiles/Next-Generation-Simulation-NGSIM-Vehicle-Trajector/8ect-6jqj (accessed on 6 November 2022).
  19. Lu, X.-Y.; Varaiya, P.; Horowitz, R. Fundamental diagram modelling and analysis based NGSIM data. IFAC Proc. Vol. 2009, 42, 367–374. [Google Scholar] [CrossRef] [Green Version]
  20. Jin, C.-J.; Knoop, V.; Li, D.; Meng, L.-Y.; Wang, H. Discretionary lane-changing behavior: Empirical validation for one realistic rule-based model. Transp. A Transp. Sci. 2019, 15, 244–262. [Google Scholar] [CrossRef] [Green Version]
  21. Park, M.; Jang, K.; Lee, J.; Yeo, H. Logistic regression model for discretionary lane changing under congested traffic. Transp. A Transp. Sci. 2015, 11, 333–344. [Google Scholar] [CrossRef]
  22. Wang, Z.; Huang, H.; Tang, J.; Lee, J.; Meng, X. Driving angle prediction of lane changes based on extremely randomized decision trees considering the harmonic potential field method. Transp. A Transp. Sci. 2021, 18, 1601–1625. [Google Scholar] [CrossRef]
  23. Hao, H.; Ma, W.; Xu, H. A fuzzy logic-based multi-agent car-following model. Transp. Res. Part C Emerg. Technol. 2016, 69, 477–496. [Google Scholar] [CrossRef]
  24. Mo, Z.; Shi, R.; Di, X. A physics-informed deep learning paradigm for car-following models. Transp. Res. Part C Emerg. Technol. 2021, 130, 103240. [Google Scholar] [CrossRef]
  25. Nadimi, N.; Amiri, A.M.; Sadri, A. Introducing novel statistical-based method of screening and combining currently well-known surrogate safety measures. Transp. Lett. 2022, 14, 385–395. [Google Scholar] [CrossRef]
  26. Sharma, A.; Zheng, Z.; Bhaskar, A. A pattern recognition algorithm for assessing trajectory completeness. Transp. Res. Part C Emerg. Technol. 2018, 96, 432–457. [Google Scholar] [CrossRef]
  27. Hao, P.; Ban, X.; Guo, D.; Ji, Q. Cycle-by-cycle intersection queue length distribution estimation using sample travel times. Transp. Res. Part B Methodol. 2014, 68, 185–204. [Google Scholar] [CrossRef]
  28. Yang, S.; Chung, E. Driver response time of queuing vehicles at urban signalized intersections. Procedia-Soc. Behav. Sci. 2012, 43, 169–177. [Google Scholar] [CrossRef]
  29. Chen, X.; Li, L.; Zhang, Y. A Markov model for headway/spacing distribution of road traffic. IEEE Trans. Intell. Transp. Syst. 2010, 11, 773–785. [Google Scholar] [CrossRef]
  30. Kutner, M.; Nachtsheim, C.; Neter, J.; Li, W. Introduction to nonlinear regression and neural networks. In Applied Linear Statistical Models; McGraw-Hill: New York, NY, USA, 2005. [Google Scholar]
  31. Cook, R.D.; Weisberg, S. Confidence curves in nonlinear regression. J. Am. Stat. Assoc. 1990, 85, 544–551. [Google Scholar] [CrossRef]
  32. Akoglu, H. User’s guide to correlation coefficients. Turk. J. Emerg. Med. 2018, 18, 91–93. [Google Scholar] [CrossRef]
  33. Taylor, R. Interpretation of the correlation coefficient: A basic review. J. Diagn. Med. Sonogr. 1990, 6, 35–39. [Google Scholar] [CrossRef]
  34. Jiao, S.; Zhang, S.; Zhou, B.; Zhang, Z.; Xue, L. An extended car-following model considering the drivers’ characteristics under a V2V communication environment. Sustainability 2020, 12, 1552. [Google Scholar] [CrossRef] [Green Version]
  35. Ayres, T.J.; Li, L.; Schleuning, D.; Young, D. Preferred Time-Headway of Highway Drivers; IEEE: Piscataway, NJ, USA, 2001. [Google Scholar]
  36. Thomas, J.A.; Walton, D. Vehicle size and driver perceptions of safety. Int. J. Sustain. Transp. 2008, 2, 260–273. [Google Scholar] [CrossRef]
  37. Caro, S.; Cavallo, V.; Marendaz, C.; Boer, E.R.; Vienne, F. Can headway reduction in fog be explained by impaired perception of relative motion? Hum. Factors 2009, 51, 378–392. [Google Scholar] [CrossRef]
  38. Dowling, R.; Nevers, B.; Jia, A.; Skabardonis, A.; Krause, C.; Vasudevan, M. Performance benefits of connected vehicles for implementing speed harmonization. Transp. Res. Procedia 2016, 15, 459–470. [Google Scholar] [CrossRef] [Green Version]
  39. Jones, J.C.; Knopp, M.C.; Fitzpatrick, K.; Doctor, M.A.; Howard, C.E.; Laragan, G.M.; Rosenow, J.A.; Struve, B.A.; Thrasher, B.A.; Young, E.G. Freeway Geometric Design for Active Traffic Management in Europe; Federal Highway Administration: Washington, DC, USA, 2011. [Google Scholar]
  40. Mirshahi, M.; Obenberger, J.; Fuhs, C.A.; Howard, C.E.; Krammes, R.A.; Kuhn, B.T.; Mayhew, R.M.; Moore, M.A.; Sahebjam, K.; Stone, C.J.; et al. Active Traffic Management: The Next Step in Congestion Management; Federal Highway Administration: Washington, DC, USA, 2007. [Google Scholar]
  41. Reinolsmann, N.; Alhajyaseen, W.; Brijs, T.; Pirdavani, A.; Hussain, Q.; Brijs, K. Investigating the impact of a novel active gap metering signalization strategy on driver behavior at highway merging sections. Transp. Res. Part F Traffic Psychol. Behav. 2021, 78, 42–57. [Google Scholar] [CrossRef]
  42. Qi, Y.; Chen, X.; Cheu, R.K.; Yu, L.; Wu, J.; Wang, Y.; Liu, H.; Liu, G.; Liu, Y. Design and Scope of Impact of Auxiliary Lanes: Technical report; Dept. of Transportation. Research and Technology Implementation Office: Austin, TX, USA, 2014. [Google Scholar]
  43. Reinolsmann, N.; Alhajyaseen, W.; Brijs, T.; Pirdavani, A.; Hussain, Q.; Brijs, K. Investigating the impact of dynamic merge control strategies on driving behavior on rural and urban expressways—A driving simulator study. Transp. Res. Part F Traffic Psychol. Behav. 2019, 65, 469–484. [Google Scholar] [CrossRef] [Green Version]
  44. Ghods, A.H.; Saccomanno, F.; Guido, G. Effect of car/truck differential speed limits on two-lane highways safety operation using microscopic simulation. Procedia-Soc. Behav. Sci. 2012, 53, 833–840. [Google Scholar] [CrossRef]
Figure 1. Schematic illustration of highway: US-101.
Sustainability 14 16436 g001
Figure 2. Schematic illustration of highway: I-80.
Sustainability 14 16436 g002
Figure 3. Extracted data description.
Sustainability 14 16436 g003
Figure 4. Bubble plot and correlation test.
Sustainability 14 16436 g004
Figure 5. Fitted exponential regression function—overall interactions.
Sustainability 14 16436 g005
Figure 6. Fitted exponential regression functions—both highways.
Sustainability 14 16436 g006
Figure 7. Fitted exponential regression functions—following vehicle class.
Sustainability 14 16436 g007
Table 1. Descriptive statistics.
Highway Type and StatisticsSpeed Difference
(vd = vf − vm)
Reduction in Space Headway
(hd = hmer − hmin)
US-101Mean−3.8 kph2.6 m
St. Dev6.70.4
T-stat8.98.7
p-value<0.001<0.001
I-80Mean0.6 kph4.0 m
St. Dev7.65.9
T-stat−0.98.6
p-value0.355<0.001
TotalMean−2.1 kph3.1 m
St. Dev7.45.3
T-stat5.712.1
p-value<0.001<0.001
Table 2. Results from exponential regression model for overall interactions.
ParameterEstimateStd. ErrorLower BoundUpper Bound
α3.2700.2492.7813.758
γ0.0740.0060.0630.085
R-squared = 0.209
Table 3. Results from exponential regression models—both highways.
HighwayParameterEstimateStd. ErrorLower BoundUpper Bound
US-101A3.0670.3302.4173.718
Γ0.1010.0170.0690.134
R-squared = 0.123
I-80A3.4350.4072.6324.239
Γ0.0700.0080.0550.085
R-squared = 0.276
Table 4. Results from exponential regression models—following vehicle class.
Vehicle ClassParameterEstimateStd. ErrorLower BoundUpper Bound
Autoα3.3510.2632.8333.868
γ0.0730.0060.0610.084
R-squared = 0.203
Truckα1.6400.5480.5112.768
γ0.1640.0720.0160.312
R-squared = 0.361
Publisher’s Note: MDPI stays neutral with regard to jurisdictional claims in published maps and institutional affiliations.

