Article

The Prevalence of Active Commuting to School and the Factors Influencing Mode Choice: A Study of University Students in a Secondary City of Bangladesh

by
Ummay Fatema Urmi
1,
Khalidur Rahman
1,*,
Md Jamal Uddin
1,2 and
Mohammad Nayeem Hasan
1
1
Department of Statistics, Shahjalal University of Science and Technology, Sylhet 3114, Bangladesh
2
Department of General Educational and Development, Daffodil International University, Dhaka 1216, Bangladesh
*
Author to whom correspondence should be addressed.
Sustainability 2022, 14(24), 16949; https://0-doi-org.brum.beds.ac.uk/10.3390/su142416949
Submission received: 2 November 2022 / Revised: 9 December 2022 / Accepted: 14 December 2022 / Published: 17 December 2022

Abstract

:
Physical activity among people of all ages has been decreasing at an alarming rate in recent years. Active commuting is recognized as a public health strategy to increase physical activity. The objectives of the study were to determine the habit of active commuting and the associated factors of commute mode choice among university students in the secondary city of Sylhet, Bangladesh. The study was cross-sectional in nature, and information from three hundred and forty-eight students was collected through an online survey using Google Forms. In addition to basic statistical tools, a multiple logistic regression model was applied to identify the factors that were associated with the commuting mode choice of the students. The results have shown that the prevalence of using an active commuting mode is not at a satisfactory level (43%). No remarkable difference in commuting behavior was found between males and females. The “distance between campus and students’ residences” and the “mode of commuting preferred by roommate or classmate” are the most significant factors influencing students’ commuting choices and related actions. In addition, respondents with lower socio-economic conditions have more of a tendency to use active modes of commuting. Weather, time constraints, road safety, and family residence in rural or urban areas all have an impact on choosing an active mode of transportation for attending classes, but none is overly significant. It is recommended to promote the health and financial benefits of active commuting. Necessary facilities should be constructed to increase the level of active commuting, such as additional residential halls near campus and developing a built environment on the campus for walking and cycling for both male and female students.

1. Introduction

In recent years, the rate of physical inactivity has been increasing at an alarming rate. It has a negative impact on both physical and mental health that affects the quality of life. According to the World Health Organization (WHO), in industrialized countries, insufficient physical activity has become the second-most significant risk factor for poor health after tobacco smoking. The WHO also reported that such inactivity is estimated to be responsible for around 2 million fatalities per year worldwide [1]. The problem of physical inactivity similarly exists in kids and adolescents, which is a threat to our future generations. More than 80% of the world’s young population is insufficiently physically active [2]. Nowadays, sedentary lifestyles are spreading all over the world [3]. One-fourth of American adults are totally sedentary [4]. The prime reasons behind such lifestyles are higher levels of occupational sedentary duties at work; the high frequency of the use of passive commuting modes; and the extreme use of television, mobile phones, computers, and other devices. In this regard, some environmental factors, such as air pollution, a lack of parks or sidewalks, traffic congestion, a shortage of leisure-time facilities, and a lack of appropriate places for exercise and sports, are also contributory.
An active commute is defined as traveling to and from work by physically active means, such as walking, cycling (for at least 10 min at a time), or any other similar mode of transportation. It may also include any commuting in combination with motorized or non-motorized forms of transportation, for example, a combination of walking and a car, a rickshaw and walking, or a train and cycling [5]. On the other hand, passive commuting is usually sedentary by nature. The passive commute includes commuting by motorized vehicles, such as a bus, train, or car, as well as non-motorized vehicles, such as a rickshaw. Such commutes are in inactive form and do not involve a countable amount of physical activity.
Active commuting to and from school is a significant way of increasing physical activity levels and an inevitable way of enhancing children’s health and well-being [6]. Students at universities might benefit from active commuting, as it is linked with health-enhancing physical activity. It has been found that adults who used active transportation reported much more total physical activity than those who did not [7]. A cohort study with adults working in Cambridge, United Kingdom, revealed that a reduction in active travel was related to a greater reduction in total physical activity (RRR = 2.1). Similarly, a rise in active transportation was related to a marginally significant rise in the self-reported total level of physical activity (RRR = 1.8) [8].
The modal choices of university students to go to class depend on a variety of factors, including cost, personal preferences, and environmental elements, such as the quantity of sidewalks and roadways [9]. Along with other predictors, such as income, trip length, travel costs and health benefits, the lack of personal vehicles was found to be the most important factor that influences choosing walking as an active travel mode in Nigeria [10]. In Wales, the United Kingdom, living less than one mile from the school, parents’ frequency of walking and cycling, and living in an urban area were found to be positively associated with active commuting to primary and secondary schools [11]. Adolescent active travel in Vietnam is positively associated with the built environment (tree cover, food attractions, and unobstructed paths), social contacts (peer groups, parents, and communities), and adversely associated with traffic, air pollution, and past accident experiences [12]. The most-favored built environment component was cited in Kuala Lumpur, Malaysia as being street connectivity and accessibility, followed by land use, pedestrian infrastructure, walking experience, traffic safety, and campus neighborhood, respectively [13].
The effect of meteorological conditions on commuter behavior has also been studied in some research. For instance, it has been demonstrated that adverse weather conditions, such as rain, snow, fog, cold, and high winds, have an effect on road capacity, traffic safety, and travelers’ choice of routes [14,15,16]. Students are more likely to walk or ride bikes when the weather is sunny, whereas on days when it is raining, students choose to take a bus or a car rather than walk to school [17].
Socio-demographic factors such as “no regular monthly income” and “willingness to walk” were the most significant ones associated with on-campus walking habits [13]. Even though active commuting is associated with self-reported physical activity, it does not seem to deliver enough physical activity to reduce BMI (body mass index) [8,18]. Self-efficacy of psychological aspects and social support from parents and friends are significant factors that incite adolescents in Portugal to use active commuting to school [19]. While analyzing the influence of personal values on attitudes, intentions, and cycling and walking, it has been discovered that cycling and walking are associated with values of self-transcendence and openness to change [20]. There are also studies that investigated vehicle, bus, and bicycle usage intentions using lifestyle orientations that included some personal values [21]. The intention to use cars was found to be indirectly influenced by lifestyle orientations toward consumerism and egalitarianism [22].
Secondary cities may have fewer people and less educational, technological, political, and economic development compared to the capital city of a country [23]. Sylhet is a secondary city in northeastern Bangladesh. The factors that affect the commuting mode choice of university students in Sylhet, Bangladesh, were not scrutinized in any previous study. In Bangladesh, the main contributions to total physical activity are from work-related physical activity and active commuting domains [24]. The prevalence of insufficient physical activity ranged between 20% and 67% among children and adolescents [25]. In Dhaka city, approximately 25% of the students of private universities go to university by walking and 3% by bicycle [26]. This research, therefore, aims to identify the factors associated with the commuting mode choice of university students in the secondary city of Sylhet. In particular, the specific objectives are as follows: i) to assess the prevalence of using active commuting modes among university students and ii) to identify the factors associated with university students’ commuting mode choice to and from school.

2. Materials and Methods

2.1. Study Area

This research was carried out in a South Asian country—Bangladesh. The study basically covers the urban area of Sylhet, which is a secondary city in Bangladesh.

2.2. Sampling Techniques

In this study, a sample of students was selected from the Shahjalal University of Science and Technology (SUST) to determine the prevalence of active commuting and to identify the factors that affect the students’ choice of commute modes. Three hundred and sixty students (at least 50 students from each semester) participated from this university to provide necessary information. In a previous study [27] about students’ commuting patterns to school, an intra-class correlation coefficient was found to be around 0.7 when considering socio-demographic covariates. In addition, to determine the minimum required size of the sample, the following formula had been used in [3] for physical activity and sedentary behavior among university students. The formula is:
E = 1 m k 2 ( 1 ρ ^ ) 2 [ 1 + ( k 1 ) ρ ^ ] 2 k ( k 1 ) m
where, k = the size of sample required in each group, m = number of groups = 6, z α / 2 = the z-score from a standardized normal distribution at 5% level of significance = 1.96, ρ ^ = the estimated intra-class correlation coefficient = 0.7 (adopted), and E = the margin of error = 0.05 (5% margin of error).
After simplification, we get k = 7 (approx.) and thus, a larger sample (at least 50 students from each semester) than the minimum required sample size has been used in this study.

2.3. Data Collection

The study was conducted from February to June 2021. The data we used for this study was collected with the aid of an online questionnaire. The online questionnaire describing the aims of the study and other researcher information was posted on some university forums and discussion groups. A Web link was provided, and any student could access the survey via an Internet connection and respond. The inclusion criteria were being a student at the Shahjalal University of Science and Technology and being enrolled in a running semester. The relevant information on commuting behavior from and to the campus was asked to be provided by recalling the respondent students’ habits in a normal situation, i.e., before the COVID-19 pandemic. The questionnaire for this research was split into several parts, covering socio-demographic information, commuting patterns, psychological information, attitude and behavior, environmental factors, and lastly, physical activity and sedentary behaviors. It should be noted that the questionnaire that was used in this study has been provided as supplementary material at the end of this article. Questionnaires with incomplete and missing information and students who did not meet the criteria for inclusion were excluded. After applying exclusion criteria, 348 of the 360 completed surveys were included in the study. Furthermore, the responses were sorted and coded according to convenience for analysis. The study was approved by the Department of Statistics, Shahjalal University of Science and Technology. All participants were told of the study’s objectives prior to beginning the questionnaire, and their participation was completely voluntary and anonymous.

2.4. Outcome Variable

The participants of the study reported “how do they usually commute to campus” from five pre-defined responses such as walking, cycling, motorized vehicle, non-motorized vehicle, or combined modes. The respondents who use combined modes to reach campus also answered, “Which mode covers the major part?” and were classified accordingly. Then the modes of walking and cycling to campus were categorized as “active travel” and motorized or non-motorized vehicles were categorized as “passive travel”. Thus, the binary outcome variable of this study was obtained.

2.5. Explanatory Variables/Factors

Most of the questions regarding socio-demographic information were closed-ended, so the respondents choose their answers from a set of pre-defined responses. Furthermore, the responses were sorted and coded according to convenience for analysis. First of all, master’s (senior) and master’s (junior) groups were combined into a single category “masters” in the variable “student’s running semester”, and the other categories were 1st year, 2nd year, 3rd year, and 4th year. Then the BMI was calculated from the self-reported height and weight of the respondents. Data on students’ “home division” was collected, and the divisions Khulna and Barisal were merged due to computational ease. Information on the father’s education and the mother’s education was collected into four categories: no education, primary, secondary, and above secondary. For further analysis, the categories “no education” and “primary” were merged together. The father’s occupation was categorized into five categories, such as farming, non-agricultural work, agricultural labor, job/service, and others. Then farming and agricultural labor were computed in a single category, and non-agricultural work was considered in the other category. The occupation of the mother was classified into three categories: housewife, job/service, and others. In the data processing stage, the categories “Job/Service and Others” were computed in a single category named “Others”.
Most of the psychological information was collected using binary responses. The respondents reported their level of agreement with the statements, e.g., a. “I would walk or cycle more often if I had a friend or classmate to travel with,” b. “Going to campus by walking or cycling is time-consuming,” c. “Walking or cycling has an adverse effect on my outlook.” The responses were provided by the respondents themselves by choosing one of the two options, “yes” and “no”, i.e., in binary terms, “1” and “0”. The respondents were also asked to specify their self-assessed socioeconomic class, categorized as lower and upper, and their perceived degree of healthiness, categorized as unsatisfied and satisfied.
The physical activity level and sedentary behavior of each student were measured using self-reported activities in the International Physical Activity Questionnaire (IPAQ) long form [28]. In this section, participants reported how much time they spent on physical activity and sedentary behaviors (in hours and minutes) per week under the five domains. MET stands for metabolic equivalent and is used to measure the energy level (oxygen consumption) necessary for a person to perform certain activities. One unit of MET is equivalent to 1 kcal/kg/h; i.e., the level of energy at immobility or while sitting still. Accordingly, [29], the following MET values were used to score the physical activities of the students: 3.0 METs = moderate activities inside the home; 3.3 METs = walking for work, transportation, or recreation; 4.0 METs = moderate activities at work/in the garden or yard/in leisure; 5.5 METs = vigorous activities in the garden or yard; 6.0 METs = cycling for transport; and 8.0 METs = vigorous activities at work/ in leisure. Then scores were computed for all the physical activities and sedentary behaviors.

2.6. Statistical Analyses

In this study, several statistical analyses have been performed to conduct the study, such as exploratory data analysis, chi-square test for independence, independent sample t-test, Mann–Whitney U test, and, finally, binary logistic regression. An exploratory data analysis was performed to summarize the data. The chi-square test is performed to identify the factors associated with university students’ commute mode choice when an arbitrary p-value (p ≤ 0.20) is used [29]. In some cases, the cell frequencies were found to be less than five while performing a chi-square test for independence, so we used Fisher’s exact test for those cases. Independent sample t-tests and Mann–Whitney U tests were conducted to compare means between two groups (p ≤ 0.20), i.e., between active commuters and passive commuters. Finally, logistic regression was conducted to find out the significant factors that work for or work against the active mode of commuting. At this stage, simple logistic regression analysis was first performed for each individual explanatory factor, and the factors that were significant (p ≤ 0.20) in each individual model were selected. The final logistic regression model was multiple and ran with the significant factors found in the individual models, yielding significant factors (p ≤ 0.05). For model evaluation, the Hosmer–Lemeshow test and ROC curve were used. SPSS Version 22.0 was used to conduct the statistical analyses.

2.7. Multiple Logistic Regression Model

The logistic regression model is widely used to describe the effect of an explanatory variable on a dichotomous response variable [30]. Multiple logistic regression analysis is a regression analysis that uses a single dichotomous outcome variable and multiple independent variables.
Let Y be a binary response variable with values 0 and 1. That is,
Y = 1, if the outcome of interest is present and
Y = 0 if the outcome of interest is absent.
When X has the value x, the logistic regression model has the logit of the success probability in linear form, i.e.,
π ( x ) = P ( Y = 1 \ X ) = e β 0 + x i β 1 + e β 0 + x i β and   1 π ( x ) = P ( Y = 0 \ X ) = 1 1 + e β 0 + x i β O d d s = π ( x ) 1 π ( x ) = e β 0 + x i β
The logit transformation is now as follows:
l o g i t   π ( x ) = log ( o d d s ) = log ( π ( x ) 1 π ( x ) ) = β 0 + x i β
and the multiple logistic regression model is
l o g i t   π ( x ) = β 0 +   β 1 X 1 + β 2 X 2 + +   β k X k
where X = ( X 1 , X 2 , , X k ) is a set of explanatory variables that can be categorical, continuous, or a combination of both, and β = ( β 1 , β 2 , , β k ) is the set of parameters, i.e., the coefficient of X .
Thus, for a collection of ‘k’ independent variables (X) denoted by the vector X = ( x 1 , x 2 , , x n ) for each of the ‘n’ individuals, it has a [ ( k + 1 ) 1 ] vector of unknown parameters β , including the intercept term.

3. Results

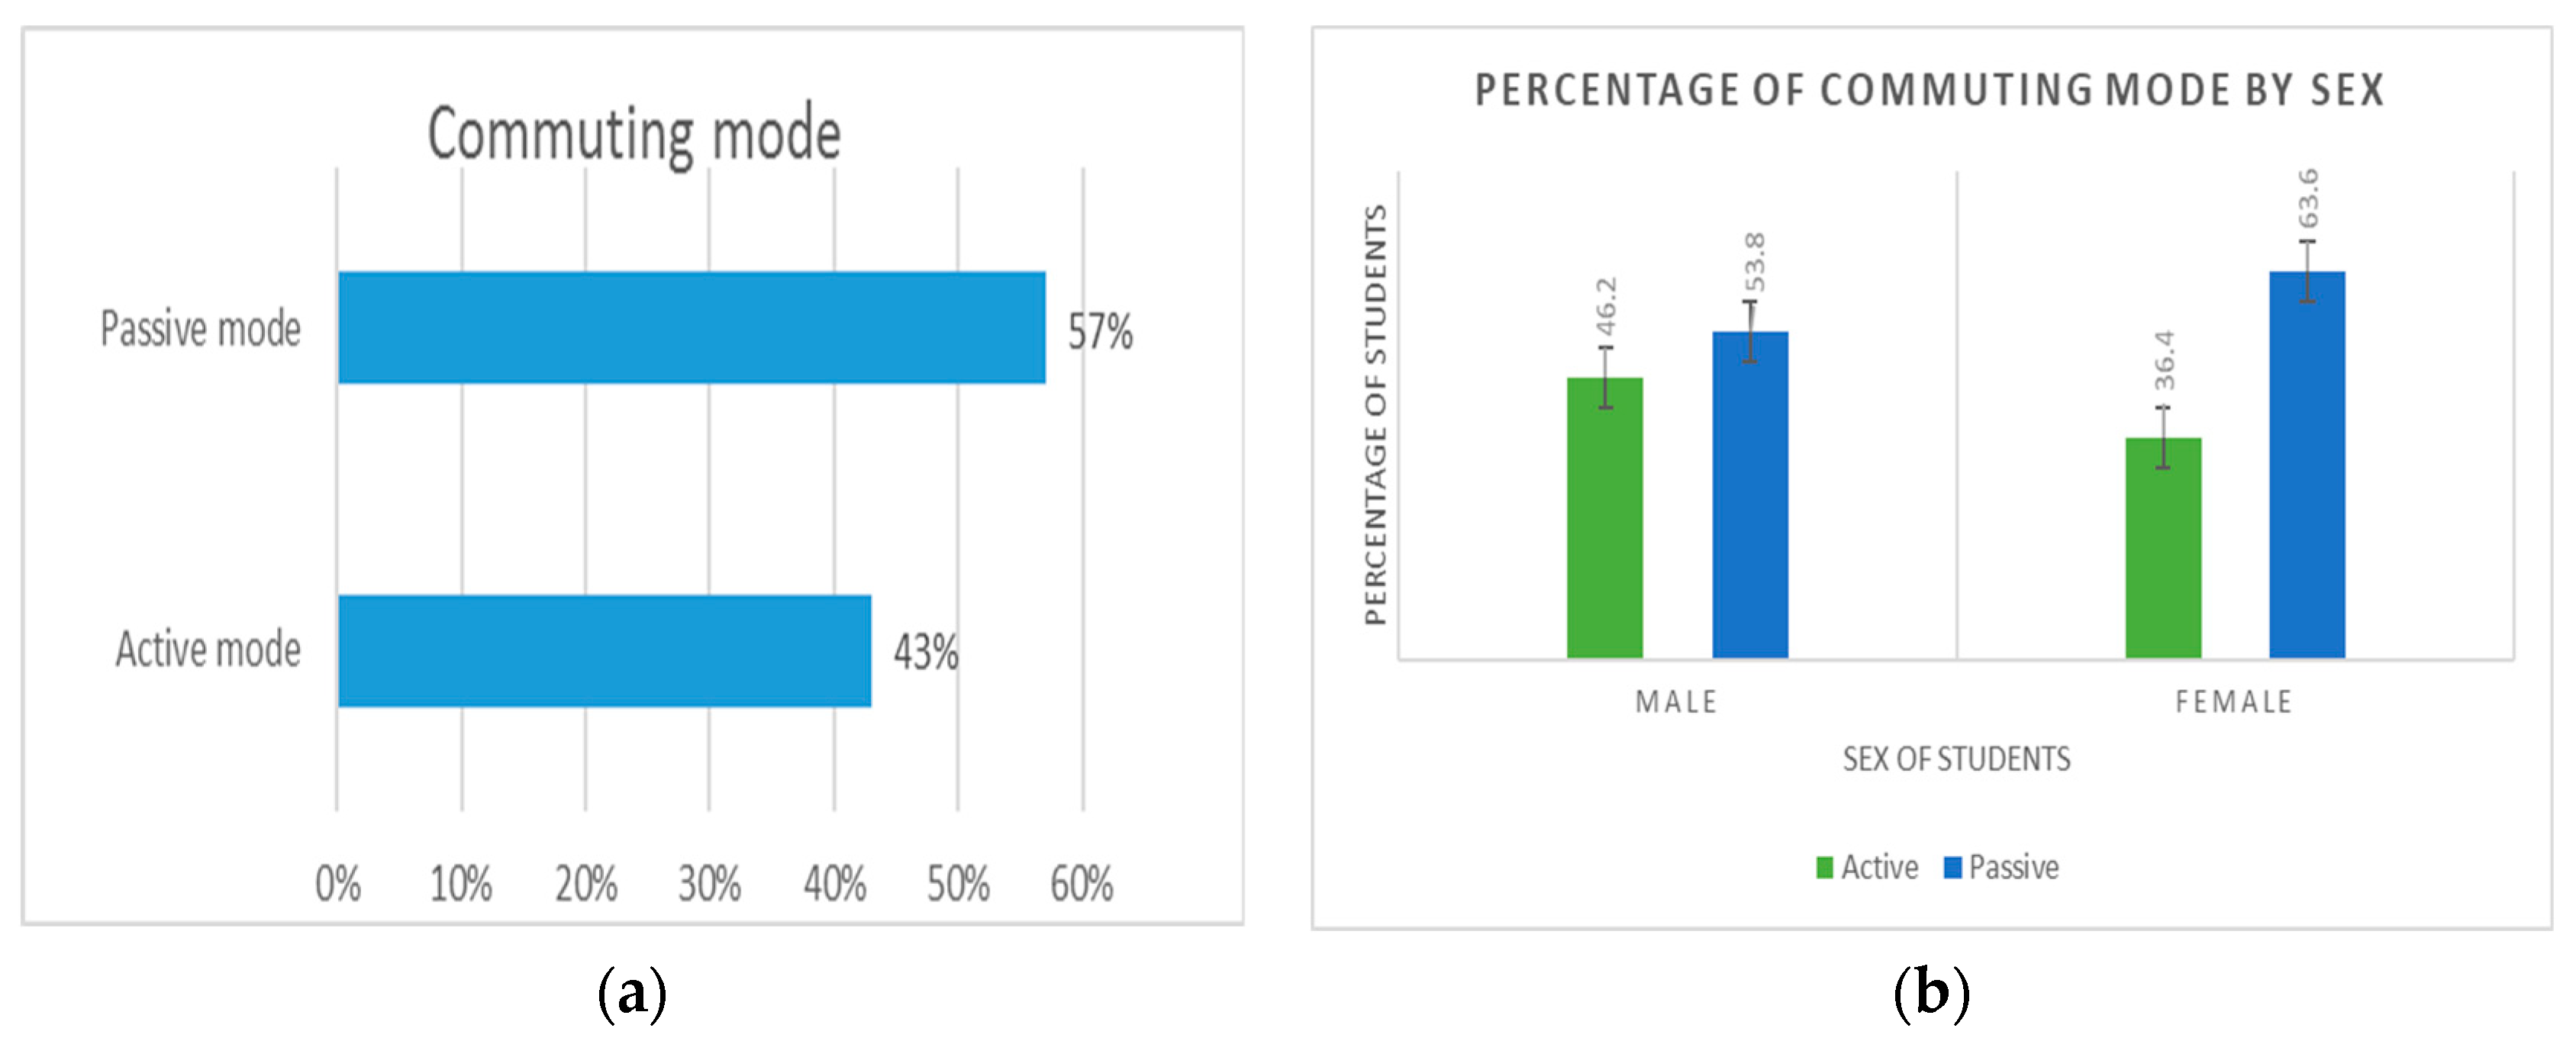
3.1. The Prevalence of Active Commuting Mode

The commuting modes of the students are categorized as “active mode” and “passive mode.” The survey data shows that over half of the students (57%) use passive modes of commuting and 43% commute to university using active modes. Although it is not noticeably higher, as noted in the next section, male students are found to be more likely to use active modes than their female counterparts (Figure 1).

3.2. Summary Statistics of Socio-Demographic Variables/Factors

It is revealed that nearly an equal proportion of students from each semester responded to the study, with approximately 68.4% of responding students being male and the remaining (31.6%) being female. In terms of home division, most of the students are from Dhaka division (26.4%) and Chattogram division (28.7%), and a very small portion of students are from Rajshahi (5.2%), and 5.2% are jointly from Khulna and Barisal divisions. About 73% of the students are from urban areas, and 27% from rural areas. Students’ fathers are more educated than their mothers. Only 7.5% of students’ fathers are involved in agriculture or farming, while the majority of their mothers (89.1%) are housewives. The majority of respondents (86.8%) are members of nuclear families. More than half of the students (60.9%) live in students’ private dormitories or mess in Sylhet; 21.8% live in the university hall; the rest (17.2%) live in their own residence. Only 28.7% of students participate in sports or go to the gym. Less than 15% of students have chronic complications such as diabetes, asthma, hypothyroidism, allergies, and so on. The average BMI of the students is 22.51. On average, the students live around 2.51 km from the campus. They spend 4.4 h on the internet daily on average.

3.3. Association of Commuting Mode Choice with Socio-Demographic Characteristics and Psychological Factors

An overview of the socio-demographic characteristics of the respondents is demonstrated in Table 1. In terms of p-values, no association was found between commuting mode choice with the sex of the students, studying semesters, parents’ education levels and occupations, types of family, involvement in sports or gym, bearing chronic disease, and the cost of transportation. However, students’ home division, place of residence with family, and place of residence at Sylhet show significant associations (Table 1). Students’ fathers are more educated than their mothers. The cost of transportation is a concern for both active and passive commuters (73%), who need to bear it on a regular basis for commuting purposes. Among the psychological factors, the mate commuting mode choice, the influence of the mate’s commuting mode, self-assessed socio-economic class, time-consuming realization, road safety, and weather effects have significant associations with commuting mode choice (Table 2).

3.4. Assessing the Mean Difference

A comparison of the mean values of some characteristics between groups of students is assessed in Table 3. No significant difference between the active commuting group and the passive commuting group is observed to have evolved from student’s BMI (based on t-test, p > 0.20), MET-minutes per week, and total sitting time (based on U-test, p > 0.20). However, a significant mean difference between the two groups is observed based on the distance between residence and campus, monthly family income, and time spent on the internet (p < 0.20).

3.5. Logistic Regression for Individual Factors

Logistic regression is separately used for every single covariate found to be significant in the previous stages. The factors which would be found to be significant (p-value ≤ 0.20, as used in [31]) in the individual model, would be included in the final multiple logistic regression model as explanatory factors. The factors “Home division” and “Monthly family income “ have not been found to be significant in the individual models, as shown in Table 4. Since the distance to campus was measured considering the students’ residence in Sylhet, the effect of the factor “Place of residence in Sylhet” could be explained by the factor “Distance.” For this reason, to avoid collinearity, the factor “ Place of residence at Sylhet” has been excluded from the model. Thus, other than the factors “Division,” “Income,” and “Residence at Sylhet,” the remaining factors have been included in the multiple logistic regression model.

3.6. Multiple Logistic Regression Model

In the overall model (Table 4), the commuting mode choice of the roommate or classmate (p-value = 0.00) and the distance between residence and campus (p-value = 0.018) have been found to be the most statistically significant factors. The commuting mode choice of a mate has been found to be positively related to the commuting mode choice of the self. The corresponding result suggests that students who have active-mode-user mates are more than 30 times as likely to utilize active mode as students who have passive-mode-user mates [OR = 30.043, CI = (11.526–78.307)]. The distance between residence and campus has been found to have a negative relationship with the choice of one’s own mode for commuting [OR = 0.704, CI = (0.526–0.941)]. The result indicates that, for a 1 km increase in distance between residence and campus, the chance of commuting to campus by active mode is reduced by 0.296 times, given that the effects of other factors remained constant. In addition, the students who belong to a lower socioeconomic class are 0.945 times more likely to use active mode than those who belong to an upper socioeconomic class [OR = 1.945, CI = (0.716–5.284)].
The students who reported that weather conditions have an effect on their commuting mode are 0.51 times less likely to use active modes than those who reported weather conditions have no effect [OR = 0.510, CI = (0.086–3.015)]. Moreover, students who indicated that active commuting takes a lot of time are 0.812 times less likely to use it than those who indicated that it does not [OR= 0.812, CI = (0.319–2.070)]. Students who feel safe on roads are 0.338 times more likely to use active modes than students who have safety issues on roads [OR = 1.338, CI = (0.242–7.379)]. It has also been found that students from rural areas are 0.155 times more likely to use active modes than students from urban areas [OR = 1.155, CI = (0.394–3.384)]. However, this attribute has no significant effect on the commuting mode choice of the students (p > 0.05).
Time spent on the Internet is negatively associated with active commuting. Every additional hour spent on the internet reduces the likelihood of attending classes on campus by 0.2 percent [OR = 0.998, CI = (0.855–1.165)]. The students who reported an influence from their mate’s active mode of travel are 0.016 times more likely to use the active mode of commuting.

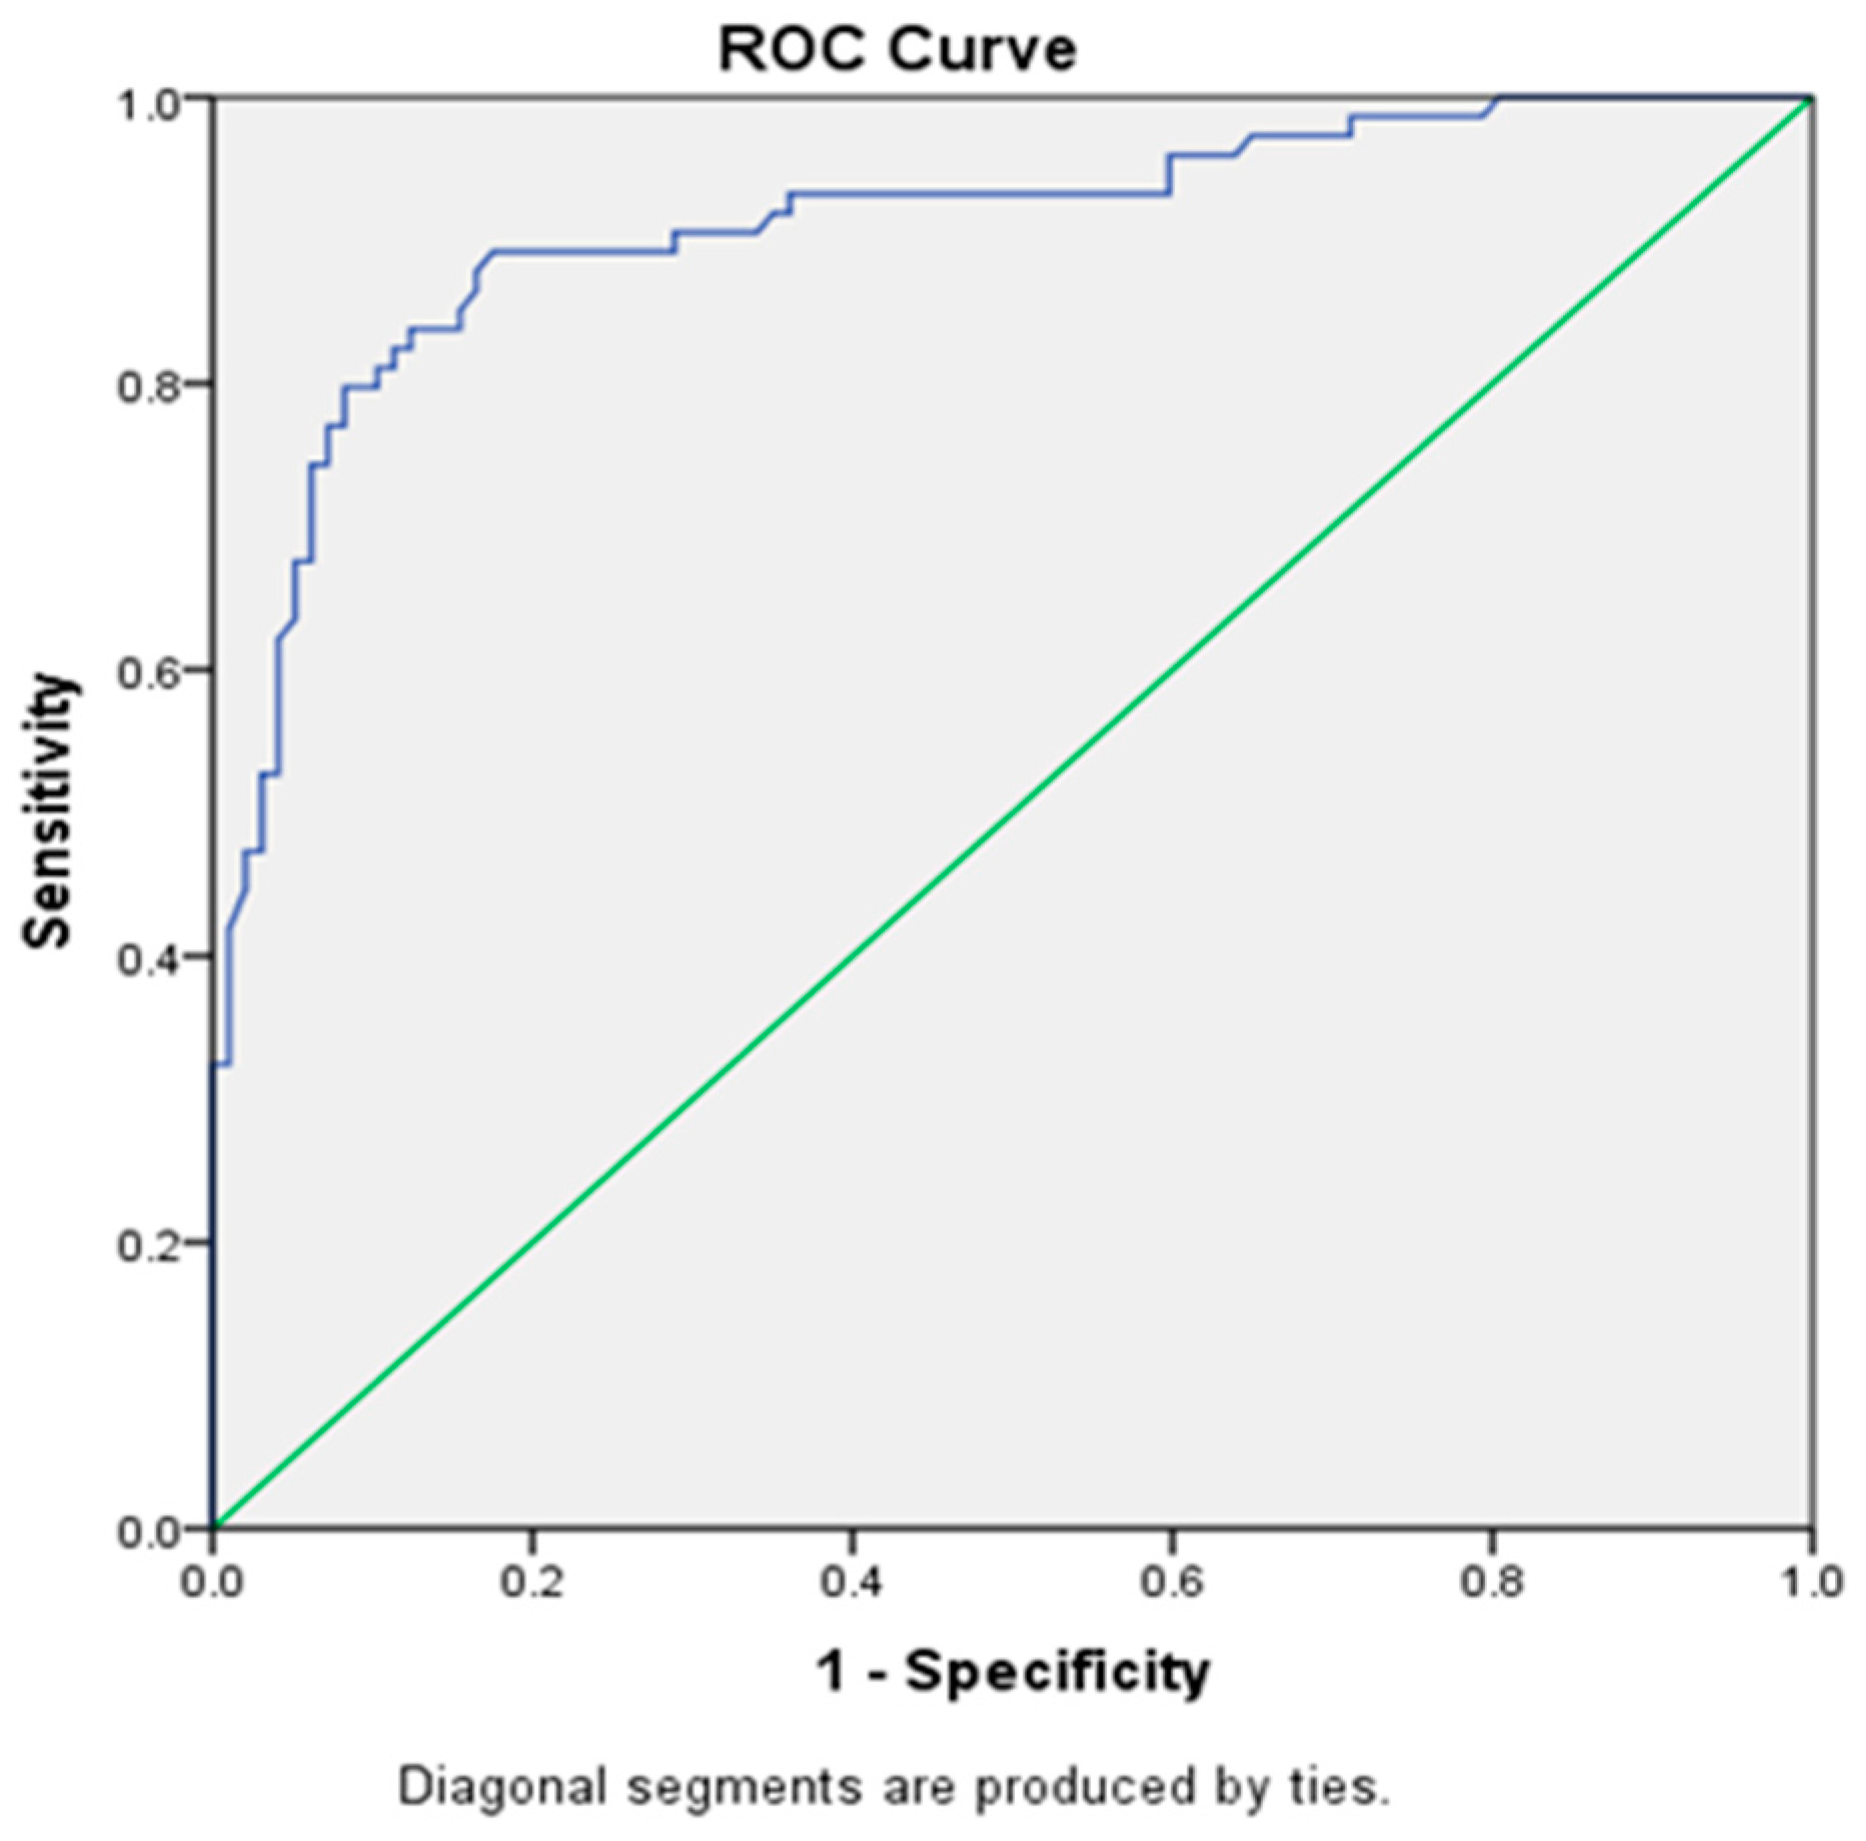
3.7. Model Evaluation

From the multiple logistic regression model, the Hosmer–Lemeshow test gives a value of chi-square = 7.345 and a p-value< 0.05, which means the model has been fitted well. The area under the ROC curve is found to be 0.909, which suggests the better performance of the classification model (Figure 2).

4. Discussion

This study provides evidence that the prevalence of using active commuting mode (43%) among Bangladeshi university students is almost equivalent to Australians (46.8%) [32], higher than Chileans (26.33%) [33] and Americans (5% to 31%) and lower than Brazilians (62.5%) [34], Colombians (65.3%) [35], and Chinese (88%) [36]. In this aspect, socio-cultural phenomena may be more responsible than the economic conditions of the students. However, no evidence of a connection between participants’ sexes and their preferred commute mode to campus has been found. This finding is not supported by most of the previous studies wherein gender was found to be a significant factor. For example, there is a higher prevalence of active commuting among boys [37], and boys are more likely to use active mode [38]. Findings of a non-significant difference in commuting between the genders of students may occur as an outcome of having an equal environment and facilities for both male and female students.
Findings show that a student’s reading semester has no significant relationship with the choice of mode for commuting. However, newcomers in the first year/semester are more inclined (54.5%) to active mode than the others. In reality, as they grow more autonomous and acquainted with their campus surroundings, students have more freedom to choose their means of transportation for getting to and from school [39]. As a result, older students are anticipated to commute by automobile more frequently. Similar studies also concluded the same [40,41].
Different levels of physical activity were found in urban and rural adults of various socioeconomic backgrounds in the United States [4], which may be due to favorable infrastructure, accessibility to sports or recreational facilities, or a history of long-term exercise promotion. In addition, parents’ physical activity, active commuting to work, and socio-demographic factors served as predictors of individual commuting to school [42]. These are not totally unsupported in the current study, such as patents’ educational qualifications, occupations, and the size of their families of socio-demographic factors. However, none are too important to consider a factor to include in the students’ commuting choice analysis. Both active and passive commuters (73%) are concerned about transportation costs. Furthermore, it is found that the commuting choices of Bangladeshi university students are primarily linked with the origin of the students’ family (division) and their place of residence, i.e., urban or rural. Students from rural residence families have been found to be more likely to choose an active commuting mode. Another study in Bangladesh found results similar to this one, i.e., the total physical activity level was higher in rural areas than in urban areas [24].
According to the findings, the factor “distance between campus and students’ residences” has significant association with commuting mode choices. In addition, a significant association between a student’s residence at Sylhet and their commute mode has been found. Thus, the factor “residence at Sylhet” was replaced by the distance from their residence to the campus. This was done to provide realistic decisions for policymaking and to avoid collinearity. Furthermore, the significance of the “distance between campus and students’ residences” with active commuting indicates that distance has a negative effect on the choice of an active mode of transportation for commuting to campus. It implies that the rate of active travel decreases as the distance between campus and the residences of students increases. This finding is supported by a previous study done in Spain with similar outcomes [43]. That study found that the students who lived between 2 and 5 km from the university used biking (i.e., an active commuting mode) most frequently. Likewise, a significant negative association with distance to campus means that respondents living in urban areas are more likely to use active modes in the United States [38,44].
Lower self-assessed socioeconomic class (SES) university students at Sylhet are more likely than their counterparts to use active mode for commuting, and accordingly, the monthly family income has been found to be very significant in this sense. Existing literature also supports this finding. The university students who lived in lower-SES neighborhoods reported more active commuting to university trips per week than those who lived in higher-SES neighborhoods [45], and the issue is connected to the parents’ income level [42].
BMI has been found to be almost similar and to show the same degree of consistency for both active and passive commuting users. This may result from the fact that university students enjoy engaging in physical activities during their free time, such as playing on campus or going for walks or rides up hills around campus with friends. Physical leisure activities are not common in several Asian cultures, particularly in Bangladesh. In addition, a lot of people in Bangladesh invest a lot of time and effort in hard labor in order to make a living. This results in an extremely thin body mass, which is an entirely different situation from our study.
The factor “having a roommate or classmate who walks” was found to be a significant factor [44], which is similar to the factor “mate commuting mode choice” in this study, which has also been found to be a significant factor and to positively affect the commuting mode choice of university students. In addition, students whose roommates or classmates use active mode for commuting are 30 times more likely to use active mode than those whose roommates or classmates are passive-commuting-mode users. Again, it is supposed by the students that relatively more time is needed for active commuting, and the existing reports have matched with this argument; for example, the Chilean university students noted [46] the main barrier behind active travel was that “it takes too much time.” Furthermore, this study found that Bangladeshi university students who spend more time online use active commuting less frequently than those who spend less time online, despite the fact that, in an earlier study [47], it was found there was a significant negative association between active commuting and the amount of time spent studying without using the internet.
In order to encourage active commuting to school, among other things, road safety must be considered [48], and the findings of this study have concluded the same. The absence of sidewalks and a designated bicycle lane may be the prime reasons why students do not feel comfortable on the road and avoid active modes of commuting. Furthermore, bad weather encourages the use of automobiles [49], and commuters tend to walk and cycle less on “colder than average” days as the temperature rises [50]. This study supports these findings on weather effects.

5. Conclusions

This study is the first attempt to assess the commuting behavior of students in the secondary city of Sylhet, Bangladesh. The study found that the prevalence of active commuting among university students is not too low, but most of the students use passive modes to commute to campus. Various factors are associated with the choice of mode of transport to attend on the campus. Of them, the distance between campus and residence is an important factor to be considered. The preferred mode of commuting of a roommate or classmate has a significant influence on the choice of a student’s active commuting mode. In addition, students from lower socioeconomic status appear to be more likely to commute by active means. Furthermore, associations with weather conditions, time effects, road safety, students’ original residence, and daily hours of internet use have also been discovered.
Despite its limitations, as mentioned in the next section, this research may assist the university administration and corresponding policymakers to take steps to promote active commuting more effectively. Additional residential halls near campus (to reduce the distance from residence), a separate bicycle lane, priority-based traffic management, active commuter safety measures, and vehicle restrictions on campus may influence commuting mode choice to switch from passive to active. Finally, the educational sector should work on the development of an educational strategy that promotes the health and financial benefits of active commuting among students.

6. Limitation of the Study

Within the constraints of time and resources, a representative study was attempted to assess the practice and habits of the commuting behavior of university students in Sylhet, Bangladesh. However, the study has some limitations. Although a representative sample (n = 348) was considered, there were not enough students who exhibit the whole pattern of students’ commuting behavior. Because of the COVID-19 pandemic situation, data was collected via an online survey and contains several errors and incomplete information. As the students provided the required information by recalling their behavior patterns in normal conditions, i.e., before the start of the COVID-19 pandemic, there is a great possibility that the data suffers from a lack of accuracy. Thus, we acknowledge that a recall bias might have influenced the findings of this study. This study includes only a cross-sectional dataset, and hence the findings could not be generalized over a long period of time. It is based on statistical relationships, and no causal relationship was examined. The study focuses on only the commuting behavior of university students in the Sylhet City Corporation area. A study on the commuting behavior of adolescents, young adults and people of other age groups should be done in the future to realize the overall commuting behavior and the associated factors of city dwellers.

Supplementary Materials

The following supporting information can be downloaded at: https://0-www-mdpi-com.brum.beds.ac.uk/article/10.3390/su142416949/s1, Factors Associated with the Commuting Mode Choice to School: An Investigation among University Students in a Secondary City of Bangladesh.

Author Contributions

Conceptualization, U.F.U. and K.R.; methodology, U.F.U., K.R. and M.J.U.; validation, U.F.U.; formal analysis, U.F.U. and M.N.H.; investigation, U.F.U., K.R., M.J.U. and M.N.H.; data curation, U.F.U.; writing—original draft preparation, U.F.U.; writing—review and editing, K.R. and M.J.U.; supervision, K.R. and M.J.U. All authors have read and agreed to the published version of the manuscript.

Funding

This research received no external funding.

Institutional Review Board Statement

Ethical review and approval were waived by the authority of the Shahjalal University of Science and Technology, Sylhet-3114, Bangladesh.

Informed Consent Statement

Informed consent was obtained from all subjects involved in the study.

Data Availability Statement

Not applicable.

Conflicts of Interest

The authors declare no conflict of interest.

References

  1. WHO/ILO. Almost 2 Million People Die from Work-Related Causes Each Year. Available online: https://www.who.int/news/item/16-09-2021-who-ilo-almost-2-million-people-die-from-work-related-causes-each-year (accessed on 22 October 2022).
  2. WHO. New WHO-led Study Says Majority of Adolescents Worldwide Are Not Sufficiently Physically Active, Putting Their Current and Future Health at Risk. Available online: https://www.who.int/news/item/22-11-2019-new-who-led-study-says-majority-of-adolescents-worldwide-are-not-sufficiently-physically-active-putting-their-current-and-future-health-at-risk (accessed on 22 October 2022).
  3. Rahman, K.; Vandoni, M.; Cheval, B.; Asaduzzaman, M.; Hasan, M.N.; Rahman, S.T. Exploring two pandemics in academic arena: Physical activity and sedentary behaviors profile of university students in Bangladesh. Eur. J. Investig. Health Psychol. Educ. 2021, 11, 358–371. [Google Scholar] [CrossRef]
  4. Parks, S.E.; Housemann, R.A.; Brownson, R.C. Differential correlates of physical activity in urban and rural adults of various socioeconomic backgrounds in the United States. J. Epidemiol. Commun. Health 2003, 57, 29–35. [Google Scholar] [CrossRef] [PubMed] [Green Version]
  5. Jones, C.H.; Ogilvie, D. Motivations for active commuting: A qualitative investigation of the period of home or work relocation. Int. J. Behav. Nutr. Phys. Act. 2012, 9, 12. [Google Scholar] [CrossRef] [PubMed] [Green Version]
  6. Siiba, A. Active travel to school: Understanding the Ghanaian context of the underlying driving factors and the implications for transport planning. J. Trans. Health 2020, 18, 100869. [Google Scholar] [CrossRef]
  7. Sahlqvist, S.; Song, Y.; Ogilvie, D. Is active travel associated with greater physical activity? The contribution of commuting and non-commuting active travel to total physical activity in adults. Prevent. Med. 2012, 55, 206–211. [Google Scholar] [CrossRef] [PubMed] [Green Version]
  8. Foley, L.; Panter, J.; Heinen, E.; Prins, R.; Ogilvie, D. Changes in active commuting and changes in physical activity in adults: A cohort study. Int. J. Behav. Nutr. Phys. Act. 2015, 12, 12. [Google Scholar] [CrossRef] [Green Version]
  9. Whalen, K.E.; Páez, A.; Carrasco, J.A. Mode choice of university students commuting to school and the role of active travel. J. Trans. Geogr. 2013, 31, 132–142. [Google Scholar] [CrossRef]
  10. Olojede, O.; Yoade, A.; Olufemi, B. Determinants of walking as an active travel mode in a Nigerian city. J. Trans. Health 2017, 6, 327–334. [Google Scholar] [CrossRef]
  11. Potoglou, D.; Arslangulova, B. Factors influencing active travel to primary and secondary schools in Wales. Trans. Plann. Technol. 2017, 40, 80–99. [Google Scholar] [CrossRef]
  12. Leung, A.; Le, T.P.L. Factors associated with adolescent active travel: A perceptive and mobility culture approach–insights from HO Chi Minh City, Vietnam. Trans. Res. Part Policy Pract. 2019, 123, 54–67. [Google Scholar] [CrossRef]
  13. Ramakreshnan, L.; Fong, C.S.; Sulaiman, N.M.; Aghamohammadi, N. Motivations and built environment factors associated with campus walkability in the tropical settings. Sci. Total Environ. 2020, 749, 141457. [Google Scholar] [CrossRef]
  14. Cools, M.; Moons, E.; Creemers, L.; Wets, G. Changes in travel behavior in response to weather conditions: Do type of weather and trip purpose matter? Trans. Res. Record 2010, 2157, 22–28. [Google Scholar] [CrossRef] [Green Version]
  15. Rahman, K.; Ghani, N.A.; Kamil, A.A.; Mustafa, A. Analysis of pedestrian free flow walking speed in a least developing country: A factorial design study. Res. J. Appl. Sci. Eng. Technol. 2012, 4, 4299–4304. [Google Scholar]
  16. Rahman, K.; Ghani, N.A.; Kamil, A.A.; Mustafa, A. Weighted regression method for the study of pedestrian flow characteristics in Dhaka, Bangladesh. Mod. Appl. Sci. 2013, 7, 17. [Google Scholar] [CrossRef] [Green Version]
  17. Nikitas, A.; Wang, J.Y.; Knamiller, C. Exploring parental perceptions about school travel and walking school buses: A thematic analysis approach. Trans. Res. Part Policy Pract. 2019, 124, 468–487. [Google Scholar] [CrossRef]
  18. Heelan, K.A.; Donnelly, J.E.; Jacobsen, D.J.; Mayo, M.S.; Washburn, R.; Greene, L. Active commuting to and from school and BMI in elementary school children–preliminary data. Child Care Health Dev. 2005, 31, 341–349. [Google Scholar] [CrossRef] [PubMed]
  19. Silva, K.S.; Pizarro, A.N.; Garcia, L.M.T.; Mota, J.; Santos, M.P. Which social support and psychological factors are associated to active commuting to school? Prevent. Med. 2014, 63, 20–23. [Google Scholar] [CrossRef]
  20. García, J.; Mars, L.; Arroyo, R.; Casquero, D.; di Ciommo, F.; Ruiz, T. Personal values, attitudes and travel intentions towards cycling and walking, and actual behavior. Sustainability 2019, 11, 3574. [Google Scholar] [CrossRef] [Green Version]
  21. Pojani, E.; Van Acker, V.; Pojani, D. Cars as a status symbol: Youth attitudes toward sustainable transport in a post-socialist city. Trans. Res. Part Traffic Psychol. Behav. 2018, 58, 210–227. [Google Scholar] [CrossRef]
  22. Long, Z.; Axsen, J. Who will use new mobility technologies? Exploring demand for shared, electric, and automated vehicles in three Canadian metropolitan regions. Energy Res. Soc. Sci. 2022, 88, 102506. [Google Scholar] [CrossRef]
  23. UN-Habitat/UNICEF. Analysis of Multiple Deprivations in Secondary Cities in Sub-Saharan Africa. Available online: https://www.unicef.org/esa/reports/analysis-multiple-deprivations-secondary-cities-sub-saharan-africa (accessed on 22 October 2022).
  24. Moniruzzaman, M.; Zaman, M.M.; Islalm, M.; Ahasan, H.; Kabir, H.; Yasmin, R. Physical activity levels in Bangladeshi adults: Results from STEPS survey 2010. Public Health 2016, 137, 131–138. [Google Scholar] [CrossRef] [PubMed]
  25. Uddin, R.; Hasan, M.; Saif-Ur-Rahman, K.; Mandic, S.; Khan, A. Physical activity and sedentary behaviour in Bangladesh: A systematic scoping review. Public Health 2020, 179, 147–159. [Google Scholar] [CrossRef] [PubMed]
  26. Nasrin, S. Private university students’ mode choice behaviour for travel to university: Analysis in the context of Dhaka city. In Transportation Research; Springer: Berlin/Heidelberg, Germany, 2020; pp. 299–310. [Google Scholar]
  27. Loong, C.; van Lierop, D.; El-Geneidy, A. On time and ready to go: An analysis of commuters’ punctuality and energy levels at work or school. Trans. Res. Part Traffic Psychol. Behav. 2017, 45, 13. [Google Scholar] [CrossRef]
  28. Fogelholm, M.; Malmberg, J.; Suni, J.; Santtila, M.; Kyrolainen, H.; Mantysaari, M.; Oja, P. International physical activity questionnaire: Validity against fitness. Med. Sci. Sports Exerc. 2006, 38, 753. [Google Scholar] [CrossRef]
  29. Forde, C. Scoring the International Physical Activity Questionnaire (IPAQ); University of Dublin: Dublin, Ireland, 2018; Volume 3. [Google Scholar]
  30. Gujarathi, D.M. Gujarati: Basic Econometrics; McGraw-hill: New York, NY, USA, 2022. [Google Scholar]
  31. Hasan, M.N.; Chowdhury, M.A.B.; Jahan, J.; Jahan, S.; Ahmed, N.U.; Uddin, M.J. Cesarean delivery and early childhood diseases in Bangladesh: An analysis of Demographic and Health Survey (BDHS) and Multiple Indicator Cluster Survey (MICS). PLoS ONE 2020, 15, e0242864. [Google Scholar] [CrossRef]
  32. Shannon, T.; Giles-Corti, B.; Pikora, T.; Bulsara, M.; Shilton, T.; Bull, F. Active commuting in a university setting: Assessing commuting habits and potential for modal change. Trans. Policy 2006, 13, 240–253. [Google Scholar] [CrossRef]
  33. Palma-Leal, X.; Parra-Saldías, M.; Aubert, S.; Chillón, P. Active Commuting to University Is Positively Associated with Physical Activity and Perceived Fitness. Healthcare 2022, 10, 990. [Google Scholar] [CrossRef] [PubMed]
  34. Silva, K.S.; Vasques, D.G.; de Oliveira Martins, C.; Williams, L.A.; Lopes, A.S. Active commuting: Prevalence, barriers, and associated variables. J. Phys. Act. Health 2011, 8, 750–757. [Google Scholar] [CrossRef]
  35. García-Hermoso, A.; Quintero, A.P.; Hernández, E.; Correa-Bautista, J.E.; Izquierdo, M.; Tordecilla-Sanders, A.; Prieto-Benavides, D.; Sandoval-Cuellar, C.; González-Ruíz, K.; Villa-González, E. Active commuting to and from university, obesity and metabolic syndrome among Colombian university students. BMC Public Health 2018, 18, 7. [Google Scholar] [CrossRef] [Green Version]
  36. Shi, Z.; Lien, N.; Kumar, B.N.; Holmboe-Ottesen, G. Physical activity and associated socio-demographic factors among school adolescents in Jiangsu Province, China. Prevent. Med. 2006, 43, 218–221. [Google Scholar] [CrossRef]
  37. Pinto, A.d.A.; Claumann, G.S.; Angelo, H.C.C.d.; Menezes, E.C.; Dias, D.T.; Pelegrini, A. Active commuting to school and associated factors among adolescents: A systematic review. J. Phys. Educ. 2018, 28, e2859. [Google Scholar] [CrossRef]
  38. Babey, S.H.; Hastert, T.A.; Huang, W.; Brown, E.R. Sociodemographic, family, and environmental factors associated with active commuting to school among US adolescents. J. Public Health Policy 2009, 30, S203–S220. [Google Scholar] [CrossRef] [PubMed]
  39. Easton, S.; Ferrari, E. Children’s travel to school—The interaction of individual, neighbourhood and school factors. Trans. Pol. 2015, 44, 9–18. [Google Scholar] [CrossRef] [Green Version]
  40. Su, J.G.; Jerrett, M.; McConnell, R.; Berhane, K.; Dunton, G.; Shankardass, K.; Reynolds, K.; Chang, R.; Wolch, J. Factors influencing whether children walk to school. Health Place 2013, 22, 153–161. [Google Scholar] [CrossRef] [Green Version]
  41. Reynolds, C.C.; Harris, M.A.; Teschke, K.; Cripton, P.A.; Winters, M. The impact of transportation infrastructure on bicycling injuries and crashes: A review of the literature. Environ. Health 2009, 8, 19. [Google Scholar] [CrossRef] [Green Version]
  42. Rodríguez-Rodríguez, F.; Gálvez-Fernández, P.; Huertas-Delgado, F.J.; Aranda-Balboa, M.J.; Saucedo-Araujo, R.G.; Herrador-Colmenero, M. Parent’s sociodemographic factors, physical activity and active commuting are predictors of independent mobility to school. Int. J. Health Geogr. 2021, 20, 11. [Google Scholar] [CrossRef]
  43. Molina-García, J.; Sallis, J.F.; Castillo, I. Active commuting and sociodemographic factors among university students in Spain. J. Phys. Act. Health 2014, 11, 359–363. [Google Scholar] [CrossRef]
  44. Sims, D.; Bopp, M.; Wilson, O.W. Examining influences on active travel by sex among college students. J. Trans. Health 2018, 9, 73–82. [Google Scholar] [CrossRef]
  45. Molina-García, J.; Menescardi, C.; Estevan, I.; Martínez-Bello, V.; Queralt, A. Neighborhood built environment and socioeconomic status are associated with active commuting and sedentary behavior, but not with leisure-time physical activity, in university students. Int. J. Environ. Res. Public Health 2019, 16, 3176. [Google Scholar] [CrossRef] [PubMed] [Green Version]
  46. Castillo-Paredes, A.; Inostroza Jiménez, N.; Parra-Saldías, M.; Palma-Leal, X.; Felipe, J.L.; Págola Aldazabal, I.; Díaz-Martínez, X.; Rodríguez-Rodríguez, F. Environmental and psychosocial barriers affect the active commuting to university in chilean students. Int. J. Environ. Res. Public Health 2021, 18, 1818. [Google Scholar] [CrossRef]
  47. Aparicio-Ugarriza, R.; Mielgo-Ayuso, J.; Ruiz, E.; Ávila, J.M.; Aranceta-Bartrina, J.; Gil, Á.; Ortega, R.M.; Serra-Majem, L.; Varela-Moreiras, G.; González-Gross, M. Active commuting, physical activity, and sedentary behaviors in children and adolescents from Spain: Findings from the ANIBES Study. Int. J. Environ. Res. Public Health 2020, 17, 668. [Google Scholar] [CrossRef] [PubMed]
  48. Tudor-Locke, C.; Ainsworth, B.E.; Popkin, B.M. Active commuting to school. Sports Med. 2001, 31, 309–313. [Google Scholar] [CrossRef] [PubMed]
  49. Bergström, A.; Magnusson, R. Potential of transferring car trips to bicycle during winter. Trans. Res. Part Policy Pract. 2003, 37, 649–666. [Google Scholar] [CrossRef]
  50. Liu, C.; Susilo, Y.O.; Karlström, A. The influence of weather characteristics variability on individual’s travel mode choice in different seasons and regions in Sweden. Trans. Pol. 2015, 41, 147–158. [Google Scholar] [CrossRef]
Figure 1. Commuting modes used by university students: (a) all students; (b) according to the sex of the students.
Sustainability 14 16949 g001
Figure 2. ROC curve for the multiple logistic regression model.
Sustainability 14 16949 g002
Table 1. Socio-demographic characteristics/factors of students and their association with commuting mode choice.
FactorsActive ModePassive ModeTotalp-Values (χ2)
n (%)n (%)n (%)
Sex
Male110 (46.2)128 (53.8)238 (68.4)0.222
Female40 (36.4)70 (63.6)110 (31.6)
Semester
First Year36 (54.5)30(45.5)66 (19.0)0.404
Second Year24 (37.5)40 (62.5)64 (18.4)
Third Year22 (35.5)40 (64.5)62 (17.8)
Fourth Year20 (35.7)36 (64.3)56 (16.1)
Masters48 (48.0)52 (52.0)100 (28.7)
Home division
Dhaka50 (54.3)42 (45.7)92 (26.4)0.023
Chattogram38 (38.0)62 (62.0)100 (28.7)
Rajshahi8 (44.4)10 (55.6)18 (5.2)
Khulana/ Barisal8 (44.4)10 (55.6)18 (5.2)
Sylhet6 (12.5)42 (87.5)48 (13.8)
Rangpur16 (61.5)10 (38.5)26 (7.5)
Mymensingh24 (52.2)22 (47.8)46 (13.2)
Place of residence with family
Urban94 (37.0)160 (63.0)254 (73.0)0.008
Rural56 (59.6)38 (40.4)94 (27.0)
Father’s education
No Education/Primary20 (52.6)18 (47.4)38 (10.9)0.455
Secondary 24 (35.3)44 (64.7)68 (19.5)
Above Secondary106 (43.8)136 (56.2)242 (69.5)
Mother’s education
No Education/Primary26 (52.0)24 (48.0)50 (14.4)0.582
Secondary56 (40.0)84 (60.0)140 (40.2)
Above Secondary68 (43.0)90 (57.0)158 (45.4)
Father’s occupation
Agricultural Labor/Farming16 (61.5)10 (38.5)26 (7.5)0.218
Job/Service60 (37.5)100 (62.5)160 (46.0)
Others74 (45.7)88 (54.3)162 (46.6)
Mother’s occupation
Housewife134 (43.2)176 (56.8)310 (89.1)0.926
Job/Service/Others16 (42.1)22 (57.9)38 (10.9)
Family type
Nuclear family126 (41.7)176 (58.3)302 (86.8)0.346
Joint Or Extended Family24 (52.2)22 (47.8)46 (13.2)
Place of residence in Sylhet
Hall48 (63.2)28 (36.8)76 (21.8)<0.001
Mess96 (45.3)116 (54.7)212 (60.9)
Own Residence6 (10.0)52 (90.0)60 (17.2)
Involved in sports/gym
Yes44 (44.0)56 (56.0)100 (28.7)0.879
No106 (42.7)142 (57.3)248 (71.3)
Chronic complications
Yes22 (44.0)28 (56.0)50 (14.4)0.922
No128 (43.0)170 (57.0)298 (85.6)
Cost matters for transportation
Yes110 (43.3)144 (56.7)254 (73.0)0.929
No40 (42.6)54 (57.4)94 (27.0)
Total150 (43.1)198 (56.9)348 (100.0)
Table 2. Psychological factors and their association with commuting mode choice.
FactorsActive ModePassive ModeTotalp-Values (χ2)
n (%)n (%)n (%)
Mate commuting mode choice
Walking/Cycling121 (86.8)18 (13.2)139 (39.8)<0.001
Vehicle31 (14.6)178 (85.4)209 (60.2)
Has the influnce of mate’s commuting mode?
Yes122 (47.7)134 (52.3)156 (73.6)0.043
No28 (30.4)64 (69.6)92 (26.4)
Walking/cycling is time consuming
Yes76 (37.6)126 (62.4)202 (58.1) 0.086
No74 (50.7)72 (49.3)146 (41.9)
Adverse effects on your impression
Yes32 (40.0)28 (60.0)80 (23.0)0.652
No118 (44.0)150 (56.0)268 (77.0)
Walking/cycling is good for health
Yes150 (43.6)194 (56.4)344 (98.9)0.216
No0 (0.00)4 (100.0)4 (1.1)
Feel safe walking/cycling to campus (road safety)
Yes144 (47.1)162 (52.9)306 (87.9)0.004
No6 (14.3)36 (85.7)42 (12.1)
Should have restriction on vehicle
Yes90 (46.9)102 (53.1)192 (55.2)0.265
No60 (38.5)96 (61.5)156 (44.8)
Self-assessed socioeconomic class
Lower114 (50.4)112 (49.6)226 (64.9)0.008
Upper36 (29.5)83 (70.5)122 (35.1)
Degree of healthiness
Unsatisfied 62 (46.3)72 (53.7)134 (38.5)0.505
Satisfied88 (41.1)126 (58.9)214 (61.5)
Weather condition has an effect
Yes132 (41.0)190 (59.0)322 (92.5)0.048
No18 (69.2)8 (30.8)26 (7.5)
Total150 (43.1)198 (56.9)348 (100.0)
Table 3. Mean difference of BMI, residence to campus distance, family income, internet times, MET, and sitting minutes by commuting mode choice among university students.
FactorsActive ModePassive Modet/Up-Value
Mean ± SDMean ± SD
Student’s BMI22.58 ± 3.3322.45 ± 3.350.250.800
Distance between residence and campus1.59 ± 1.353.21 ± 2.35−1.340.182
Monthly family income37,380 ± 33,977.0244,080.81 ± 30,760.32−5.73<0.001
Times on internet4.387 ± 2.475.005 ± 2.93−1.510.134
MET-minutes/week (median)1367.501183.503644.500.836
Sitting minutes/week (median)1245162033020.212
Table 4. Associated factors for commuting mode choices and their odds ratios obtained from simple (crude) and multiple (adjusted) logistic regression models.
ModelCrude ModelAdjusted Model
FactorOR (95% CI)p-ValueOR (95% CI)p-Value
Monthly family income0.99 (0.99–1.01)0.184--
Mate commuting mode choice
Passive modeReference-Reference-
Active mode38.46 (15.80–93.63)<0.00130.04 (11.53–78.31)<0.001
Has the influnce of mate’s commuting mode?
NoReference-Reference-
Yes2.081 (1.02–4.26)0.0451.02 (0.33–3.09)0.987
Time-consuming
NoReference-Reference-
Yes0.59 (0.32–1.08)0.0870.81 (0.32–2.07)0.665
Road safety
NoReference-Reference-
Yes5.33 (1.51–18.86)0.0091.34 (0.24–7.38)0.739
Internet0.92 (0.81–1.03)0.1470.99 (0.86–1.17)0.982
Distance 0.52 (0.40–0.69)<0.0010.70 (0.53–0.94)0.018
Weather effect
NoReference-Reference-
Yes0.31 (0.91–1.05)0.0590.51 (0.09–3.02)0.448
Residence Sylhet
HallReference---
Mess0.07 (0.02–0.25)<0.001--
Own residence0.48 (0.23–1.03)0.061--
Division
Dhaka----
Chattogram0.52 (0.23–1.16)0.11--
Rajshahi0.67 (0.16–2.83)0.588--
Sylhet0.12 (0.03–0.12)0.002--
Khulna/Barisal0.67 (0.67–0.16)0.588--
Rangpur1.34 (0.38–4.73)0.645--
Mymensingh0.92 (0.34–2.50)0.864--
Self-assessed socioeconomic class
UpperReference-Reference-
Lower2.43 (1.25–4.72)0.0091.95 (0.72–5.28)0.192
Residence
UrbanReference-Reference-
Rural2.51 (1.27–4.98)0.0081.16 (0.39–3.38)0.793
Publisher’s Note: MDPI stays neutral with regard to jurisdictional claims in published maps and institutional affiliations.

